Low-Carbon Transportation Oriented Urban Spatial Structure: Theory, Model and Case Study


1
Guangdong Open Laboratory of Geospatial Information Technology and Application, Guangzhou Institute of Geography, Guangzhou 510070, China
2
Guangzhou Institute of Geochemistry, Chinese Academy of Science, Guangzhou 510640, China
3
College of Resources and Environment, University of Chinese Academy of Science, Beijing 100049, China
*
Authors to whom correspondence should be addressed.
Sustainability 2018, 10(1), 19; https://0-doi-org.brum.beds.ac.uk/10.3390/su10010019
Submission received: 29 October 2017
/
Revised: 29 November 2017
/
Accepted: 14 December 2017
/
Published: 22 December 2017
(This article belongs to the Special Issue Methodological Advances in Research on Sustainable Ecosystems)
Abstract
:Optimising the spatial structure of cities to promote low-carbon travel is a primary goal of urban planning and construction innovation in the low-carbon era. There is a need for basic research on the structural characteristics that help to reduce motor traffic, thereby promoting energy conservation. We first review the existing literature on the influence of urban spatial structure on transport carbon dioxide emissions and summarise the influence mechanisms. We then present two low-carbon transportation oriented patterns of urban spatial structure including the traditional walking city and the modern transit metropolis, illustrated by case studies. Furthermore, we propose an improved model Green Transportation System Oriented Development (GTOD), which is an extension of traditional transit-oriented development (TOD) and includes the additional features of a walking city and an emphasis on the integration of land use with a green transportation system, consisting of the public transportation and non-auto travel system. A compact urban form, effective mix of land use and appropriate scale of block are the basic structural features of a low-carbon transportation city. However, these features are only effective at promoting low-carbon transportation when integrated with the green traffic systems. Proper integration of the urban structural system with the green space system is also required. The optimal land use/transportation integration strategy is to divide traffic corridors with wedge-shaped green spaces and limit development along the transit corridors. This strategy forms the basis of the proposed urban structural model to promote low-carbon transportation and sustainable urban growth management.
1. Introduction
Greenhouse gas (GHG) emissions resulting from human activities has played the central role in global climate change [1,2,3]. The carbon emissions problem has received extensive attention from policy makers, industrial manufacturers, and researchers to formulate low carbon development strategies [4,5,6,7,8,9,10,11]. Cities are the centres of population, construction, transportation, industry and logistics, and therefore dominate the net energy-related carbon emissions [12,13,14].
Life in any city of the world is concentrated mostly in a particular ever-changing environment [15]. Excessive greenhouse gas (GHG) emissions means this change tends to be negative. Exploring the main sources of GHG emissions and reducing GHG emissions are two key points to solving the issues. Transportation and building contribute to the largest share of GHG emissions [16]. In the context of global climate change, transportation in growing megacities has become a key issue, because motorized mobility resulting from urban expansion is a major source of greenhouse gas emissions [17,18,19,20,21]. The transport sector is a most important driver for GHG emissions [22,23]. According to the US Energy Information Administration (EIA), the transport sector accounted for approximately 13% of all GHG emissions and over 21% of world energy-related CO2 emissions in 2006 (EIA, 2006). Transport emissions are especially dominant in the US: approximately 33% of its emissions are generated by the transportation sector (EIA, 2007). It is becoming increasingly difficult to curb the emissions from the transport sector in cities, especially in developing countries where the number of vehicles has increased rapidly. Forecasts predict that with the ongoing increase in population, rise in incomes and availability of cheaper vehicles in developing countries, their share of cars will increase from 25% in 1995 to 48% in 2050 (United Nations, 2001). In China, the private vehicle fleet increased to over 18 million vehicles between 2001 and 2005 with an average growth of 23% annually. In the same period, the petroleum consumption in the transport sector increased from 24.6% to 29.8% of the total consumption, and is projected to reach 47% of the total consumption in 2030 [24].
The transport sector therefore faces a critical challenge in energy saving and emissions reduction, and low-carbon transport has become the common goal of many countries throughout the world. There are three major approaches to reducing transportation emissions: (1) low-carbon energy sources that reduce the emissions per unit energy; (2) more efficient vehicles that reduce the energy consumption per vehicle-kilometre travelled (VKT); and (3) VKT reduction through implementing an energy-efficient urban spatial structure with improved logistics and non-motorised travel such as walking and biking [25].
Energy-saving technologies provide the technical means for low-carbon transport but are not sufficient to solve the transport emissions problem alone, especially in terms of changing the travel behaviour of city dwellers in response to variations in the urban spatial structure. Once the urban spatial structure and corresponding travel behaviour are established, adjustment can be quite difficult. There is therefore an urgent need to explore effective ways to reduce motorised transport from the perspective of the relationship between transport and urban spatial structure.
Regarding the transportation policy contents of building low-carbon cities, three policies deserve mention. The first concerns urban public transport systems [26], the second policy is to enforce an energy consumption measurement for all vehicle-using enterprises [27], and the third policy is to form a new specialized ministerial level agency in the state transportation department. Buildings are the major component of a city and urbanization means more built-up areas. With the process of urbanization, more and more square meters of new buildings have been built each year, particularly in developing countries. Once built up, both commercial and residential buildings continue to show an insatiable demand for energy. Because of this, the energy efficiency of buildings has been a policy concern of the government to reduce GHG emissions. The energy-saving building, or “green building”, has various low carbon aspects including heating, appliances, lighting, energy intensity, and building materials [28,29]. It is known that cities form just two percent of the total earth area but they consume more than 75% of the total energy and release more than 80% of GHG [30]. Urban form is also an important factor influencing carbon emissions. This is because there are significant relationships between physical characteristics of the city, such as density, size, and amount of open space and energy use in transport and household [27]. In order to reduce carbon emissions, sustainable urban planning proposes a dense and adjacent development model to control city spread [31]. In addition, urban green space system plays an indispensable role in making low carbon city coming true. It can capture carbon release oxygen, reduce its own carbon emission, reduce urban heat island, reduce building energy consumption, induce non-motorized travel, and promote urban agriculture [32]. While, Badiu et al.’s study indicated that the target set for urban green space could not be exclusively used as an indicator for sustainable cities and the supply of urban green spaces [33]. However, the positive role of urban green space system in reducing the city’s greenhouse gas content and improving people’s well-being is uncontroversial among distinct fields.
The remainder of the paper is divided into three sections. Section 2 provides a review of the theoretical evidence linking urban spatial structure and transport emissions, focusing on the impact of the density, degree of mixed land use and land use/transport connection on the travel demand. Section 3 discusses low-carbon transport oriented urban spatial structure and its characteristics through case studies, including the examples of Zurich, Singapore, Hong Kong and Copenhagen. A discussion of our findings and our conclusions are presented in Section 4. The objective of this study is to answer the following questions: (1) Does the urban spatial structure have an influence on the transport emissions? (2) What type of spatial structure is most conducive to the reduction of motor traffic to promote energy conservation?
2. The Influence of Urban Spatial Structure on Transport Emissions
Urban spatial structure refers to the spatial configuration of urban land use within a metropolitan area [34]. Urban sprawl, with its wide dispersion of metropolitan areas and the spread of cities with high consumption of scarce resources, is a relatively common phenomenon in the course of the development of the city. The urban land use pattern, including the distribution of residential, employment, shopping, and recreational areas as well as leisure facilities over an urban area, determines the activities of the city’s residents and thereby affects their travel needs both directly and indirectly. There is a substantial body of literature examining the connection between urban spatial structure and travel behaviour. Many researchers employ empirical models to describe the interactions between urban spatial structure and travel behaviour. The evidence suggests that the influence of urban spatial structure on transport-related energy consumption and emissions is profound. Urban sprawl will significantly increase the commuting time [35]. Travisi et al. used a mobility impact index (IMPACT) based on commuting data on 739 Italian cities and empirically proved that sprawl contributes to move job opportunities to peripheral areas and the congestion virtually follows jobs to the periphery and increases travel demand [36]. Young et al. analyzed the effects of transportation costs on urban sprawl in 10 Canadian metropolitan areas; the result showed that parking prices would be more efficient in contributing to reduce the extent of urban sprawl if employers adopted a parking cash-out policy [37]. Zolnik proved that centralizing employment as the urban planning policy most likely to reduce private-vehicle commuting times [38]. The factors influencing travel behaviour and transport emissions include (1) form factors including the urban compactness, density and scale; (2) function factors such as the mix of land use; and (3) network factors such as the land use/transport connection [27,39].
2.1. The Influence of Urban Compactness, Density and Scale
A large body of research indicates that compact cities with a high density and good jobs/housing balance facilitate the access of residents to facilities and services and thereby reduce their travel requirements, travel distances and private vehicle use [40,41,42]. Stone et al. [43] developed a method of vehicle emissions estimation aimed at analysing the emissions under different land development scenarios for several metropolitan areas, and the results indicated that the median reduction in carbon emissions under a compact growth scenario would be 5.1%. Hankey and Marshall [25] developed and applied a Monte Carlo approach that models the ensemble statistics of several dozen urban areas rather than forecasting the changes in individual cities to estimate the total passenger VKT and resulting carbon emissions for urban areas in the US. The results indicate that among six urban growth scenarios, comprehensive compact development could most effectively reduce the 2000–2020 cumulative emissions by up to 15–20% of the projected cumulative emissions. Bartholomew and Ewing [44] developed a regional vehicle-miles-travelled (VMT) model to determine the extent to which compact growth scenarios are estimated to reduce vehicular travel below the existing trends based on 85 scenarios in 23 planning studies from 18 metropolitan areas in the US. Their findings suggest that by 2050, a typical compact land use scenario could reduce the VMT by 17% compared to the projected trend for the same population and employment. Based on these findings, urban growth management designed to curb urban sprawl into the fringes of cities is expected to contain the need for long-distance travel and vehicle use, promoting energy conservation and emissions reduction. The contribution of urban growth management to curb the environmental effects of transport has also been empirically and broadly demonstrated in Western cities [23,45].
The urban density refers to the land use, population, employment and residential densities. Although fiercely debated, a large body of literature suggests there is a relationship between urban density and vehicle travel behaviour [46,47,48], and there is a significant negative statistical correlation between urban density and transport-related energy consumption per capita. These findings indicate that increasing the density of cities will reduce the energy consumed and CO2 emissions produced by transportation. Based on the National Household Travel Survey (NHTS) for 2001, Glaeser and Kahn [49] examined the effects of urban form on CO2 emissions and social costs in 66 metropolitan areas. They found that metropolitan areas with low-density development are associated with far higher CO2 emissions than metropolitan areas where the density is relatively high, which means that cities generally have significantly lower emissions than suburban areas [49]. VandeWeghe and Kennedy [50] studied both the overall patterns of greenhouse gas emissions in Toronto and how the emissions vary spatially throughout the Toronto Census Metropolitan Area (CMA). Their findings support the thesis put forward by high density development proponents that increased residential and employment density leads to a reduction in automobile dependence and transportation energy consumption.
In practice, the vast majority of high-density cities do have relatively low levels of GHG emissions owing to lower energy consumption in private transport. For example, the fraction of the total emissions contributed by the transport sector in high-density Chinese cities such as Beijing and Shanghai (approximately 11%) is close to half that in American and European cities such as New York and London (approximately 23%, 22% and 18% for New York, London and Washington DC, respectively) [51].
There are three major reasons why a high urban density reduces energy consumption and emissions. First, high-density development may reduce trip frequencies and commuting distances [52,53]. For example, Miller and Ibrahim [52] reported that high-density employment nodes had lower VKTs per worker. Second, a higher density is related to greater public transportation use and increased levels of walking and other non-auto travel [54,55,56]. For example, Cervero [57] found that an increase in neighbourhood density was related to an increase in non-car commuting. Third, the residents of high density neighbourhoods tend to choose smaller and more fuel-efficient vehicles [58], possibly owing to the relative difficulty of manoeuvring and parking large vehicles in dense neighbourhoods.
Urban scale and accessibility also have obvious impacts on transport emissions. In an empirical study on urban scale and transport emissions, Glaeser and Kahn examined emissions from driving, public transit, home heating, and household electricity usage in different locations across the U.S., and they found that the highest emissions areas were in Texas and Oklahoma and the lowest emissions areas were in California [49]. Glaeser and Kahn [49] found that as city size increases, the transport emissions per capita rise, suggesting a positive correlation between urban scale and emissions. Using data from the 2001 National Household Travel Survey (NHTS), Liu et al. [59] studied the effects of urban land use characteristics on energy consumption of household travel and transportation in the Baltimore metropolitan area. Their results indicate that using different built environment measures can lead to substantially different findings regarding the influence of urban spatial structure on travel behaviour. They found that among the variables used, accessibility has far higher explanatory power than density. Zhang [60] adopted time use analysis to explore the relationship between urban form and nonwork travel and highlighted the importance of physical planning and design to improve spatial accessibility.
2.2. The Influence of Land Use Mix and Jobs/Housing Balance
The extent of mixed land use is also found to have a significant impact on travel patterns. For example, Cervero et al. [61] concluded that mixed land use reduces motorised travel by spreading trips more evenly throughout the day, encouraging more workers to carpool and vanpool, and enabling shared-use parking arrangements. Based on an analysis of 59 suburban office development projects, he found every 20% increase of mixed retail and commercial activities in floor area leads to a 4.5% increase in mini-bus carpool and public transportation. Frank and Pivo [46] reported that increased mixed land use is related to a smaller number of single-occupant vehicles. Based on travel survey data, Kockelman [62] argued that a higher level of mixed land use is associated with lower VMT values and increased walking and bicycling. Thus, an effective mix of land use for the purpose of travel distance reduction can therefore promote a good jobs/housing balance and help to reduce motorised transport.
Using data from the San Francisco Bay Area in the US, Cervero and Duncan [63] found that an effective jobs/housing balance could result in a substantial reduction in VMT, and the daily work-tour VMT would be reduced by 3.29% when there was a 10% increase in the number of jobs in a given occupational category within four miles of the typical worker’s residence [64]. In order to examine whether the regional centre has been effective as an alternative employment centre to the Central Business District (CBD) as well as whether the development of the regional centre has encouraged the reduction of work-related travel in Singapore, Sim et al. [64] conducted a survey and concluded that there is great potential for reduction of work-related travel, car reliance and traffic congestion through a displacement of commercial activities from the CBD of Singapore to regional centres [64].
2.3. The Influence of the Land Use/Transport Connection
What type of interaction between land use and transport is most conducive to low-carbon transportation? Most researchers believe that transit-oriented development (TOD), in which a high urban density combined with mixed-use areas built around high-quality transit systems, provides a focused urban structure that can loosen the dependence on automobile. Cervero [65] noted that by consolidating most new urban developments into high-density forms clustered around rail stations, Stockholm had transformed itself into a multi-centered metropolis with a minimal level of car dependency over the last 50 years. Some researchers argue that travel demand can be reduced through the clustering of housing and jobs activities into nodes [23,66]. The rise in private vehicle can be minimised around public transportation centres by increasing the residential and employment density, thereby enhancing public transportation patronage. Many cities, including Stockholm, Copenhagen, Toronto, Singapore and Hong Kong have successfully experimented with the land use/transport interaction, leading to the establishment of a sustainable mode of transport and land use.
3. Low-Carbon Transport Oriented Urban Spatial Structure: Patterns and Case Studies
3.1. The Traditional Walking City
In this study, a traditional walking city refers to a city in which non-motorised transport such as walking or cycling has been adopted as the primary mode of travel. A walking city is characterised by a high density and mixture of land use and is connected by narrow streets in an organic form that fits the landscape. Many modern cities have portions that either retain historical walking characteristics or have been intentionally constructed on a walking scale by the municipal authorities [67]. Most walking cities developed approximately 1000 years ago and they can still be found in some places today, e.g., the medieval core areas of many European cities, such as the new suburban centres along Stockholm’s rail system, new district centres such as the Bogenhausen District Centre in Munich or the following described city, Zurich.
Zurich, located in northern Switzerland alongside the Zurich Lake, is the largest economic centre and most important historical city in Switzerland. Since 2000, Zurich has been continuously appraised as the world’s No. 1 most liveable city by the well-known advisory body Mercer and has been named the energy saving and environmental protection Champion City of Switzerland. These achievements owe primarily to Zurich’s effective public transport system and excellent walking environment. Zurich serves as a walking city model for the world. Zurich residents walk 0.6 km per day on average, accounting for one third of all daily travel, and the sidewalks and hiking roads in Zurich cover 3150 km in total, twice the length of the state highways in the city [68].
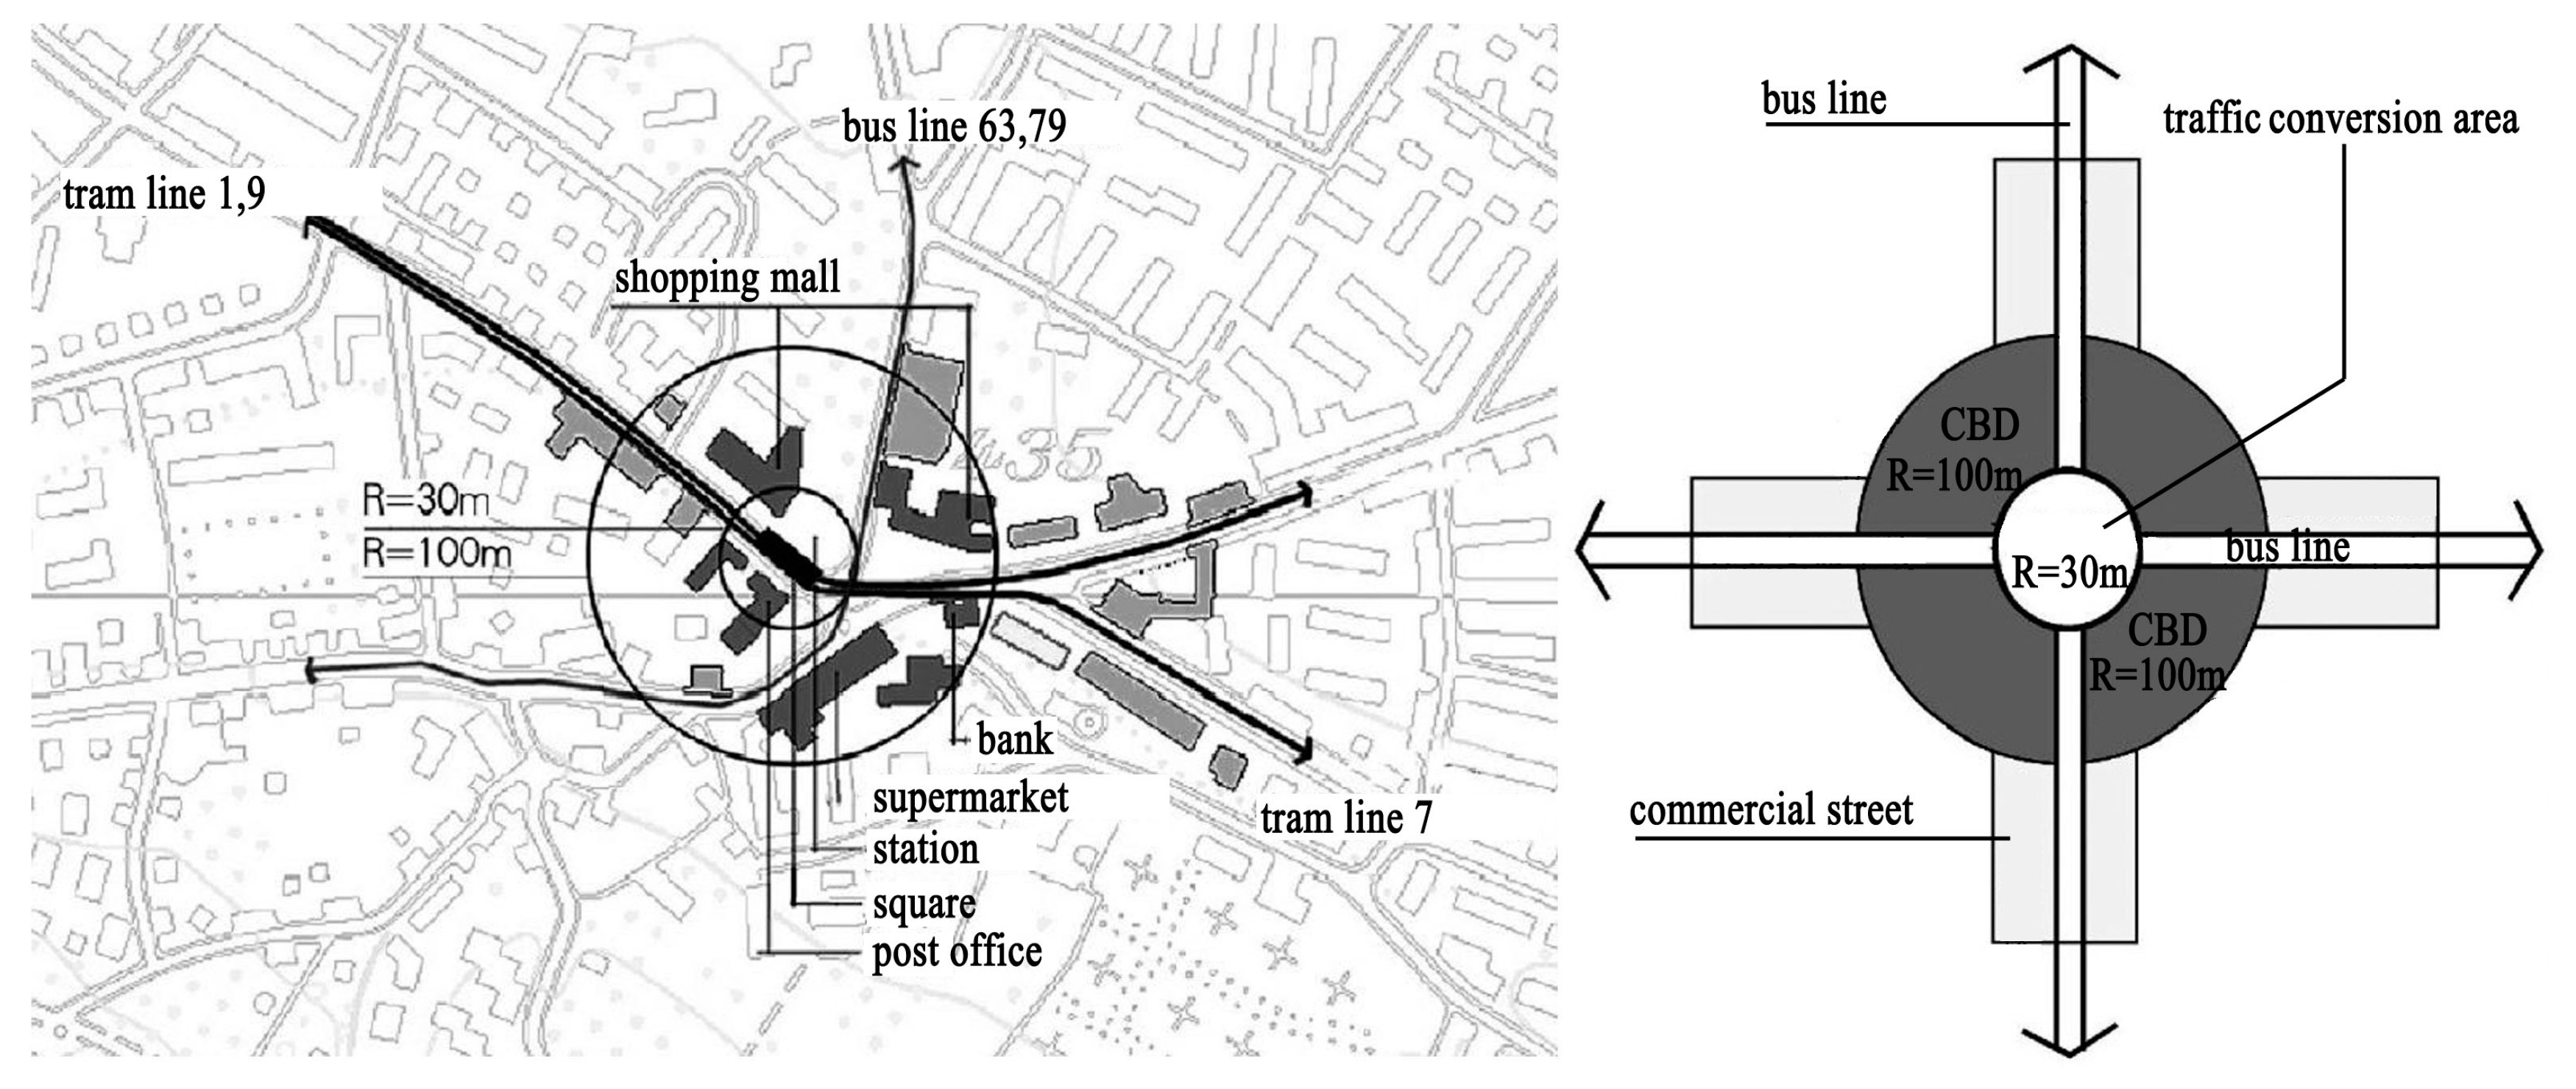
Zurich has formed a complete walking network including two levels. The first level is composed of regional walkways connecting the green lands, historical cultural conservation areas, open spaces, landmarks, major squares and public facilities including railway stations, shopping centres, movie theatres and opera houses. The second level consists of community walkways within series of urban public centres arranged around transit hubs, connected with the regional walkways to form a convenient walking network (see Figure 1).
The arrangement of the urban public centre is characterised by mixed land use. The typical mixed layout consists of a traffic conversion area of 30 m radius centred around a public transportation station (including a station and square), a central business centre of 100 m radius surrounding the traffic conversion area with commercial facilities such as supermarkets, banks, post offices and restaurants and some additional commercial streets along the bus lines. Sports, cultural and other public facilities are generally close to the public centre, where a quiet environment is maintained. The public centre also offers office buildings of mixed functions, shopping malls, residential buildings, recreational and cultural facilities, etc., enabling pedestrians to engage in a variety of activities over a short period of time and thereby increasing the appeal of walking (see Figure 2).
Zurich is also worth studying for its amenities. First, the high accessibility of bus stops has greatly shortened walking distances, encouraging a joint walking/public transport travel mode in place of car use. In the city centre area, the distance between any two stops is no greater than 300 m and in many cases is less than 150 m, and the distance of any point to the nearest bus stop does not exceed 250 m. Second, the comfortable walking environment and pleasant street landscape encourage residents to walk the streets and enjoy themselves. The bus stops are connected to surrounding residential areas by walking trails furnished with seats, flower beds and landscape trees that are often directly connected to the entrances of residences with no barriers. Sculptures, fountains and other works of art are visible throughout the streets of Zurich, and pedestrians appreciate the frequent variation in the walking scene.
3.2. The Modern Transit Metropolis
The modern transit metropolis is a modernised city in which public transportation is the primary means of travel, and the development pattern follows a transit-oriented development (TOD) model. There are a large number of modern transit metropolises throughout the world, demonstrating the success of TOD in leading to compact development and reducing private vehicle use in cities such as Singapore, Copenhagen and Hong Kong, which will be discussed further below. What these success cases have in common is that the most efficient public transport corridors are also the corridors of urban high-intensity development, and density control and functional organisation along the bus routes are emphasised.
3.2.1. Singapore: A Rapid Transit System Model for the Development of New Towns
Singapore, which enjoys the reputation of a garden city, is an island nation in Southeast Asia. In the late 1970s and early 1980s, the country developed a planning model emphasising the combination of land use and transportation (see Figure 3), which had a profound impact on the urban layout and development thereafter.
In Singapore today, there are approximately 20 new towns arranged along the subway lines, whose land use is characterised by a TOD pattern. The residential areas, shopping centres, public facilities and open spaces are dexterously combined with transport hubs and strung by subway lines in a pattern resembling a pearl necklace. As a result, half of all Singaporeans live within one kilometer of a subway station, rendering the railway one of the top travel choices for residents. In addition, Singaporeans are aware of the fact that rail traffic is an important factor in retail development, and a large number of high-density business districts therefore surround the subway stations. There are currently 23 large-scale shopping centres in Singapore, and 15 of them are located within 400 m of a subway station [69].
Moreover, as an effective supplement to rail transportation, the bus system in Singapore is closely connected with the subway networks. The buses both feed the subway and shuttle between the new towns, and the lines run parallel to the subway corridor or serve areas that are underserved by the subway. Almost all of the new town residents live within a five minute walk from a bus station. The combination of the privately run rail transportation routes and bus extensions has created one of the most complete and effective public transport networks in the world, linking the urban centres and new towns organically and thereby greatly improving the public transportation to population ratio. Although there are approximately 414,000 private cars in Singapore, amounting to 57.5% of the total number of motor vehicles, public transport remains the primary mode of transportation, accounting for 66% of the motorised travel demand in Singapore [70].
3.2.2. Hong Kong: A Concordance of Building Complexes and an Urban Transportation System
Hong Kong is one of the most densely populated cities in the world. Due to limited land resources, Hong Kong has adopted a land use pattern characterised by mixed and high-density land use. Urban space and architectural space are intertwined in a variety of fashions, creating a three-dimensional urban form.
The three-dimensional land use pattern promotes the development of building complexes in Hong Kong, such as the Pacific Place, Admiralty, Festival Walk, IFC and Lok Fu Shopping Centre Phase II. In Hong Kong, approximately 70% of the shopping centre complexes lie along the subways, displaying a typical pattern of subway-oriented business development. The efficient building complexes take advantage of the accessibility of public transportation to concentrate a variety of features and urban facilities in a limited land area, implementing high-intensity development in a three-level construct including the space under ground, on the ground and above ground. A variety of means of transportation interchange in the building complexes, creating a comfortable transfer platform to facilitate residents’ travel. A variety of transportation spaces, including a pedestrian passageway, open atrium, vehicle stops and transfer stations form a three-dimensional network in which residents can travel or stay for a while.
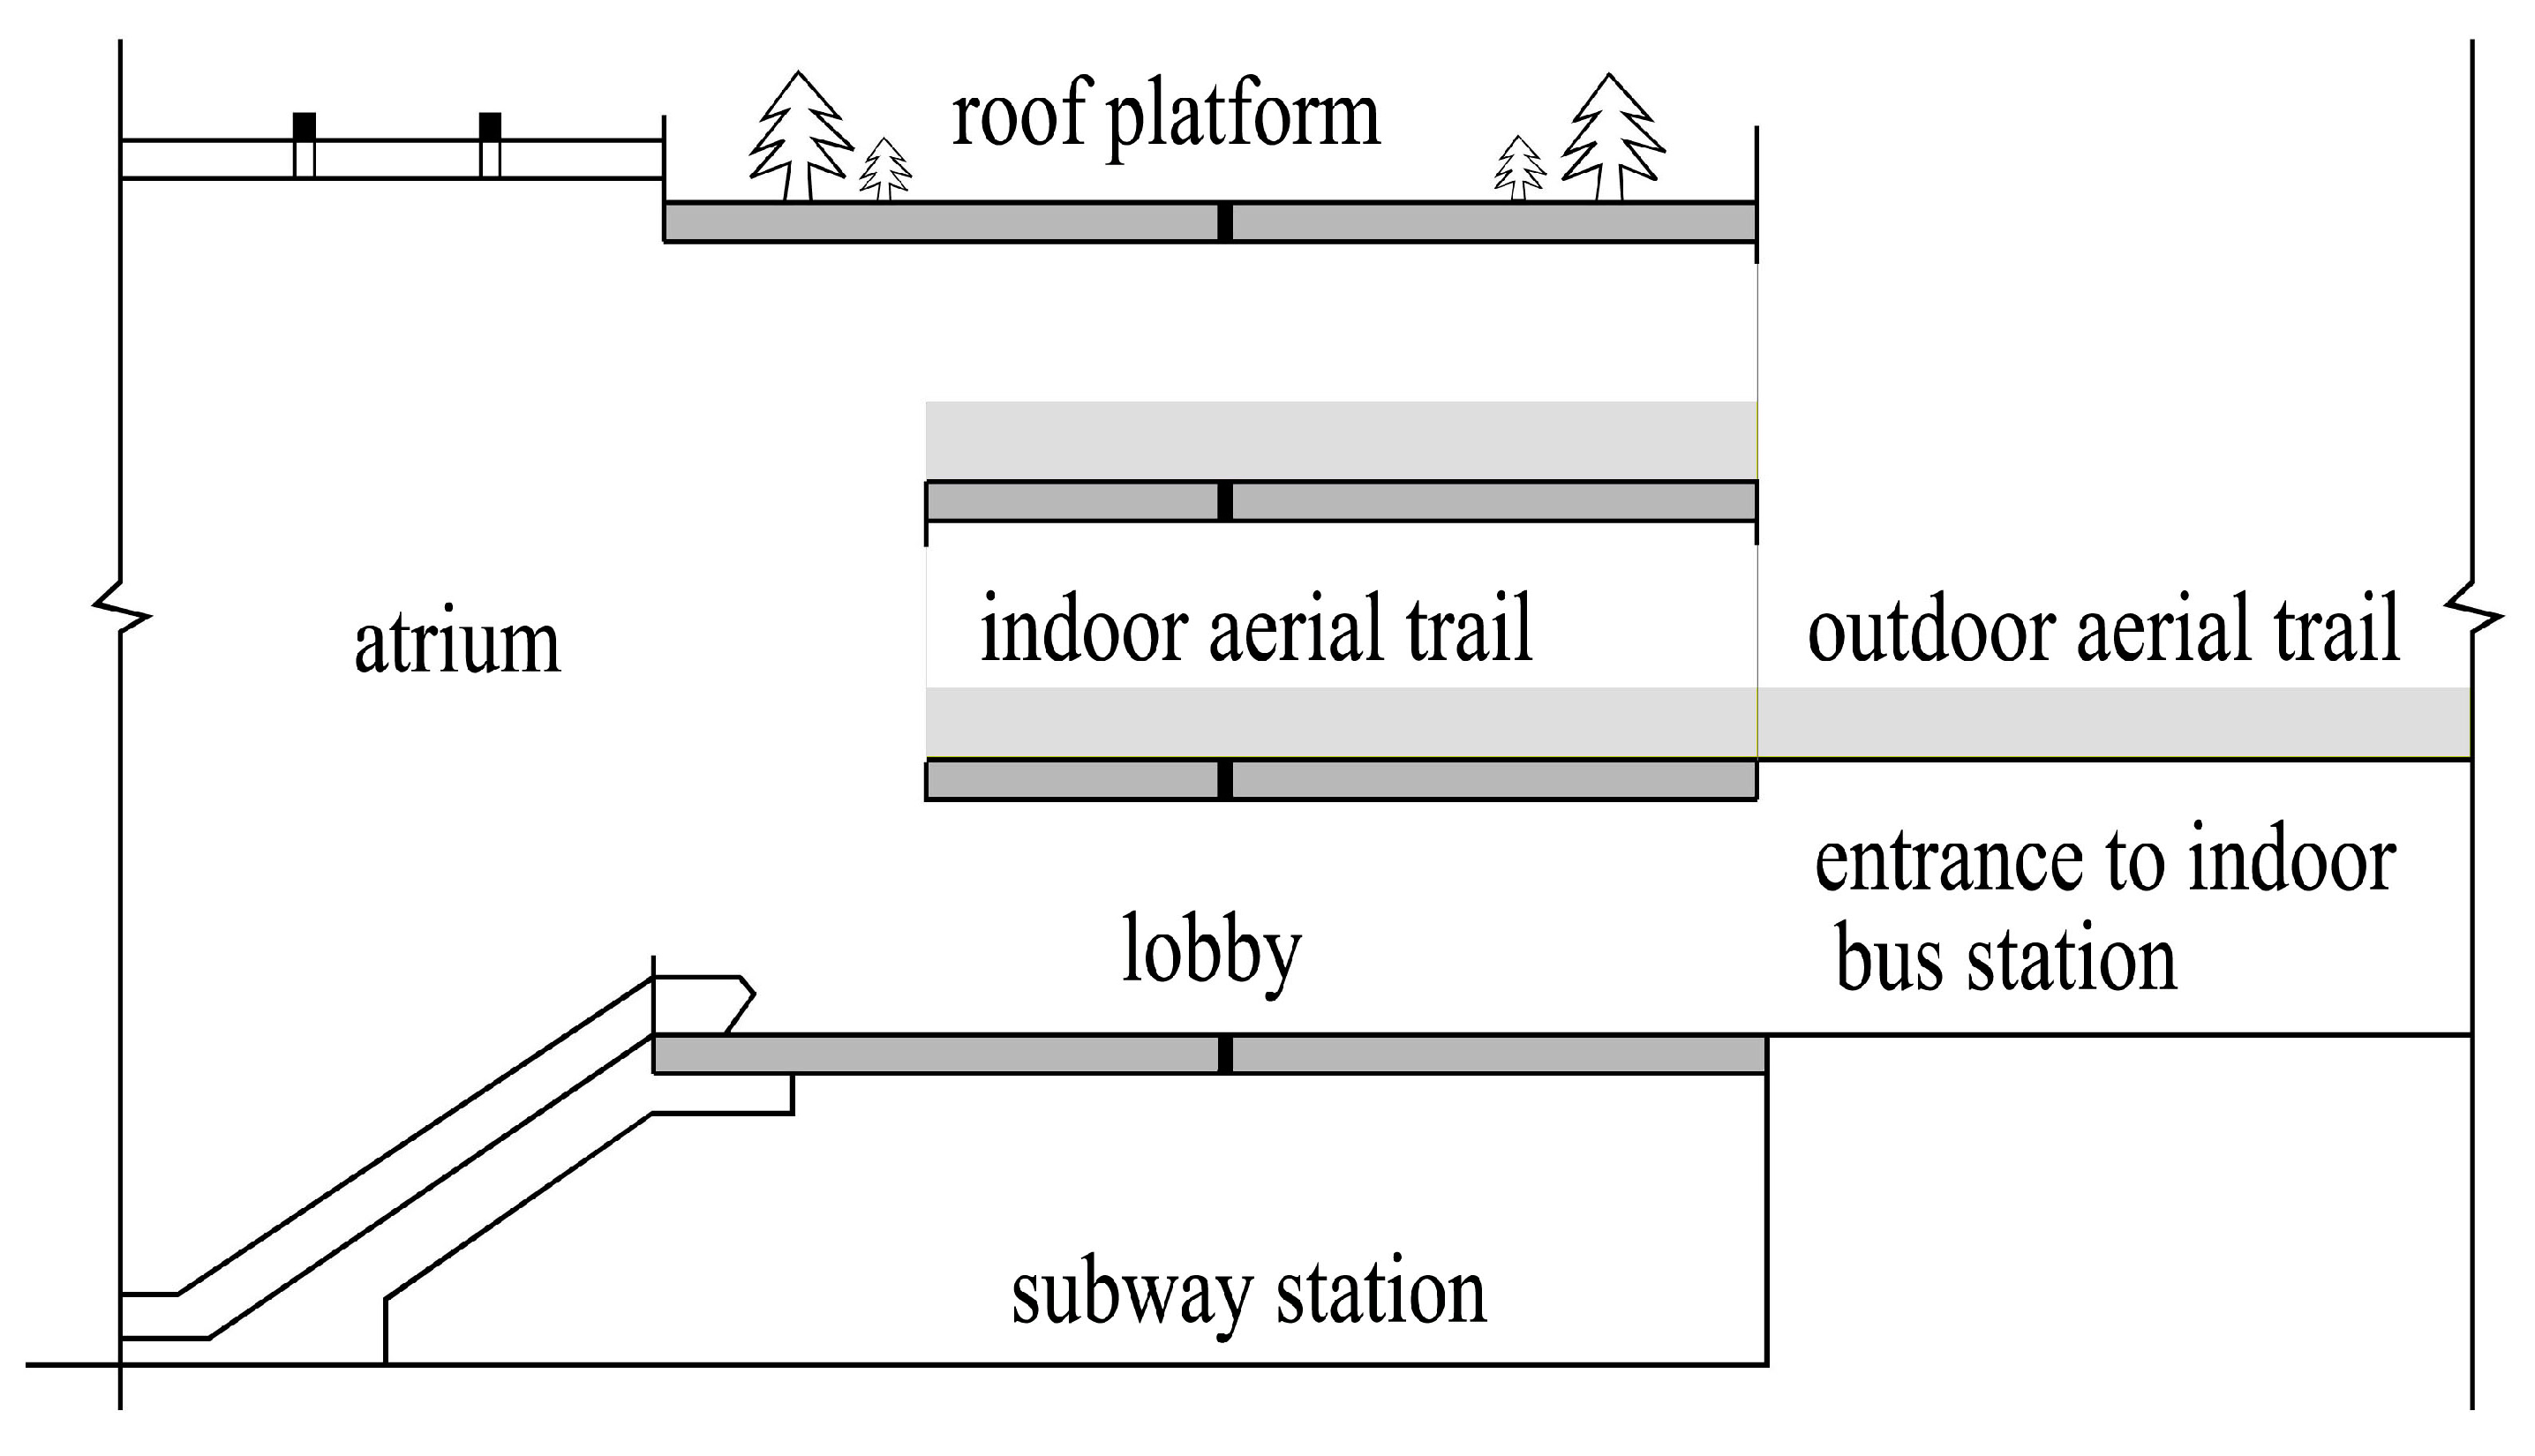
The transport space within a building complex is typically organised as follows (Figure 4): (1) tunnels are available in the basement for connecting subway stations or parking; (2) the transfer stations and vehicle channels are located on the first floor adjacent to the subway station, allowing travelers to transfer conveniently without changing levels; (3) the urban aerial trails are connected by networks on the second floor; (4) the roof platform is designed in the form of a city garden or walking platform; and (5) the escalators and atrium connect each layer into an organic space which interacts with the outdoor areas and surrounding buildings [71].
3.2.3. Copenhagen: The Most Liveable Transit Metropolis
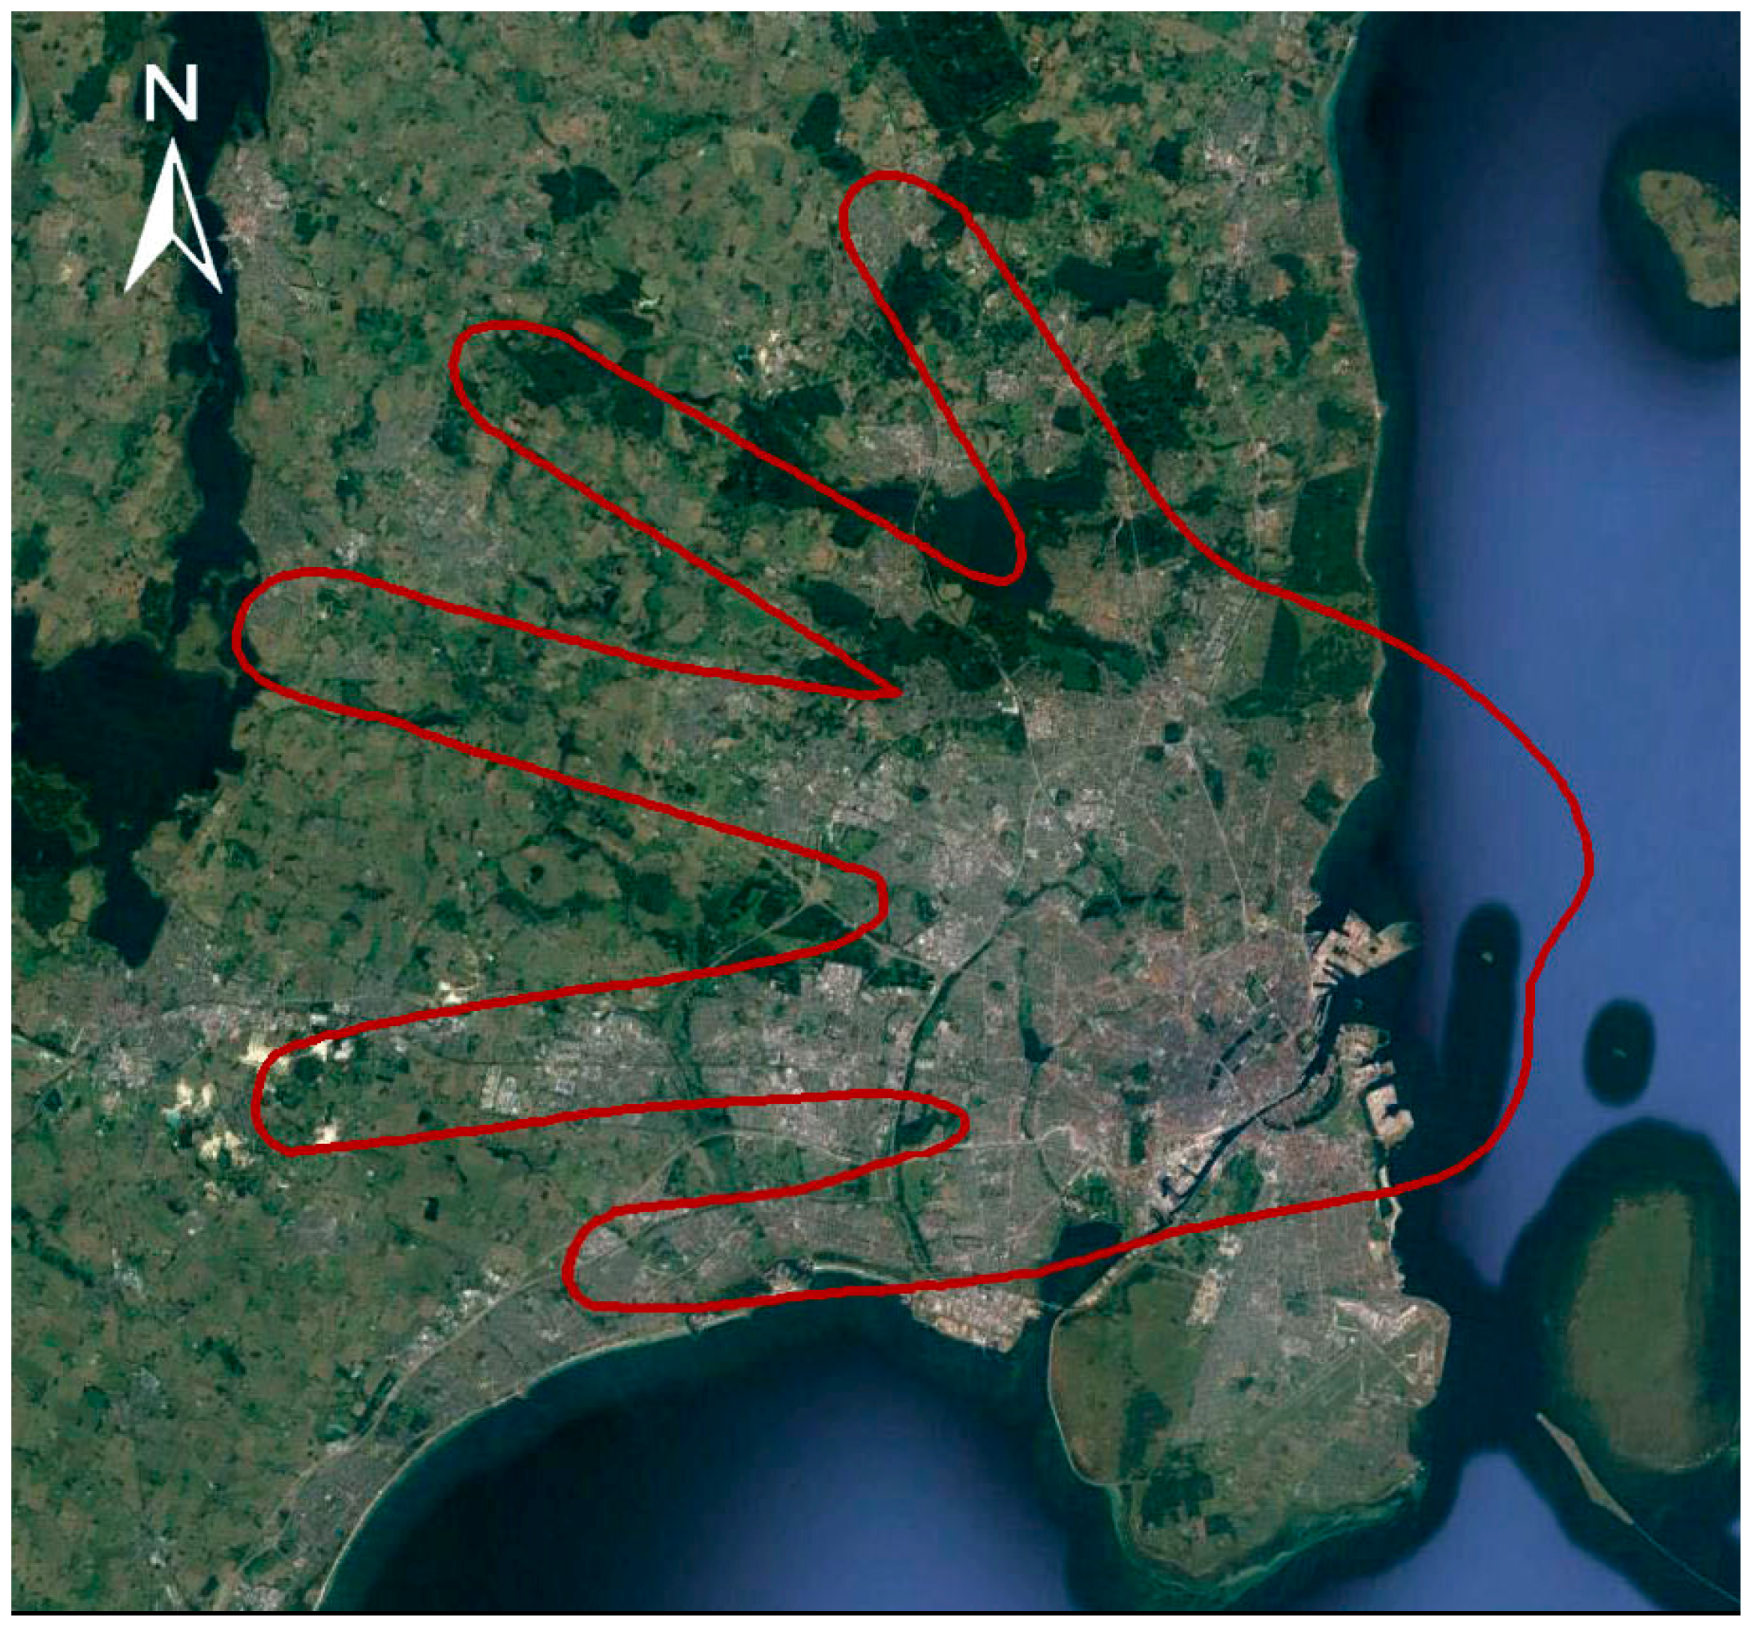
Copenhagen is the capital of Denmark with a population of 1,700,000, of which 500,000 live in the city centre. It has been appraised by the media as the world’s most liveable city, particularly based on ecological and environmental criteria. The city takes full advantage of its forests, farmlands and open green spaces to limit development along transit corridors, thereby maintaining a favourable ecological urban environment and mitigating urban sprawl [72].
In early 1947, the famous “finger form planning” was put forward to concentrate the development along several narrow radial corridors separated by green wedges (see Figure 5). In the following decades, the planning was executed well. As a result, a well-developed rail transportation system along the corridors from the city centre to the urban fringes has been integrated with the green wedge system, and most public buildings and high density residential areas are clustered around the railway stations so that residents can conveniently use rail transportation and enjoy the pleasant city environment. In the city centre, the public transportation system, walking system, and bicycle network are combined, sustaining and strengthening the traffic functions of the medieval-style city centre. Despite being one of the cities with the highest per capita income in Europe, Copenhagen has a low per capita car ownership rate and utilises public transportation, walking and bicycling as the primary means of transportation.
Copenhagen stresses the connection between land use and the public traffic system, requiring that all development be focused within a distance of one kilometer from a rail transit station. Moreover, the government grants subsidies based on the land use of the public traffic stations and even pays bonuses for high density commercial development around the stations, strongly stimulating commercial development of the areas surrounding the stations [73]. The integration of land use with the public traffic system yields a win-win situation in that the public traffic system is able to offer effective and convenient services to the residents living along the traffic lines and at the same time, land development along the traffic lines encourages sufficient passengers to use public transportation.
The realisation of the low carbon transportation system of Copenhagen also owes to the perfect connection of the walking trails, bicycle trails and bus system. Copenhagen is called the “One Floor City” because of the abundance of public streets and squares with virtually no overpasses, viaducts or pedestrian bridges in the city centre, which is quite convenient for walking and cycling. The government has adopted a gradual traffic improvement plan, which can be viewed as an extensive walking program, supporting the priority of pedestrian trails and narrow streets to create a large and comfortable walking network. As a result, 80% of the streets are designed for walking, with each square arranged to connect walking trails and open spaces. Moreover, bicycle lanes are placed along all of the main roads, secondary roads and one-way streets to form a completely continuous bicycle road network. The riders of Copenhagen currently cover a total distance of more than 1,000,000 km daily, and 35% of Copenhagen residents travel to work or school by bicycle [74]. In addition, the walking system and bicycle network interact with the public transportation system organically. The transit system is simultaneously designed for convenient non-auto travel and rail transit accessibility, promoting the development of the public transportation system and making Copenhagen one of the cities with the lowest rate of private car ownership in any developed country.
3.3. Examples from Developing Countries: Challenges and Responses
On the one hand, many cities in developing countries have witnessed a rapid population growth over the past decades with the rapid expansion of urban areas and the rapid growth of motor vehicles. On the other hand, most of these cities were characterized by unreasonable spatial structure, backward planning and poor infrastructure facilities problem. It was difficult for these cities to meet the rapidly growing traffic demands, which eventually leads to traffic congestion and a series of environmental problems. According to the “INRIX Global Traffic Scorecard” launched in 2016, Thailand in Southeast Asia tops ranking country in 2016 with drivers spending an average of 61 hours in peak hours congestion, which was followed by Colombia (47 h), Indonesia (47 h), and Russia (42 h). But, China, the biggest developing country in the world, was not listen in the INRIX Global Traffic Scorecard. Therefore, we focused on analyzing the traffic congestion in China according to the “China’s major cities traffic analysis report in 2016” released by the Amap. In this newly published traffic analysis report, one third of the China’s cities suffered traffic congestion. The top ten cities with traffic congestion in China in 2016 were Jinan, Harbin, Beijing, Chongqing, Guiyang, Shenzhen, Kunming, Hangzhou, Dalian, and Guangzhou, respectively. Delay index in the Top four cities (Jinan, Harbin, Beijing, and Chongqing) were more than 2.0, which indicated that these cities would consumed twice as many commutes as usual during the traffic congestion period. In response to traffic congestion, the emergence of a new mode of transport in Curitiba, Brazil, that is Bus Rapid Transit (BRT) in the 70s of last century. The BRT employed the improved large-capacity public transport vehicle and modern intelligent transportation technology to run on the bus lane and maintain the performance of the rail traffic. Due to its large capacity, short period of construction, rapid speed of operation, and energy conservation and environmental protection features, the BRT effectively alleviated urban traffic congestion and became the development direction of urban public transport in developing countries gradually. In addition, developing countries are also actively exploring ways to improve urban transport and urban environment through the innovation of traffic patterns and the adjustment of urban spatial structure. New energy vehicles such as Blade Electric Vehicles (BEVs) and Hybrid Electric Vehicles (HEVs) were strongly advocated in China. In the past two years, sharing bicycle has been on the rise in China. It has also taken a positive role in replacing the “last five kilometers” of short-distance driving travel. The city’s green travel level has also been correspondingly raised. With the rapid development of high-speed railways and inter-city railways, a large number of TOD new towns and cities around the high-speed rail stations are under planning and construction.
4. GTOD: An Improved Model
4.1. TOD and Its Blemishes
Transit-oriented development (TOD) is a classical planning technique, which aims to reduce automobile use and promote the use of public transit and human-powered transportation modes by means of high density (density), mixed use (diversity) and environmentally friendly urban design (design) near transit centres [61]. These three factors are known as the 3-D planning factors (density, diversity and design).
The TOD concept, was first proposed by an American architect [67] in his book titled The Next American Metropolis: Ecology, Community and the American Dream, which has emerged as one possible solution for sustainable urban transport. The TOD concept can help to reshape the quality and form of urban growth through improving accessibility, mobility, pedestrian friendliness, and increasing sustainability [75].
The modern transit metropolises mentioned previously in this paper, including Singapore, Hong Kong and Copenhagen, have precisely followed the TOD model, which has been very successful and delivered compact and very high density urban development focused around rail transit stations. As an increasingly advocated concept supported by a wealth of empirical evidence from around the world, TOD has become one of the key planning methods for managing urban growth intelligently in the 21st century.
However, the traditional TOD model emphasizes the importance of guiding urban development with public transport and the 3-D planning factors, which are still not enough. It ignored the organic relationship between urban development and public transportation and the green space system to some extent, and ignored the important role of non-auto travel systems and its organic link with the public transportation at the same time. So, we propose an improved model Green Transportation System Oriented Development (GTOD), which is an extension of traditional TOD and includes the additional features of a walking city and an emphasis on the integration of land use with a green transportation system, consisting of the public transportation and non-auto travel systems.
4.2. An Extension of the Model
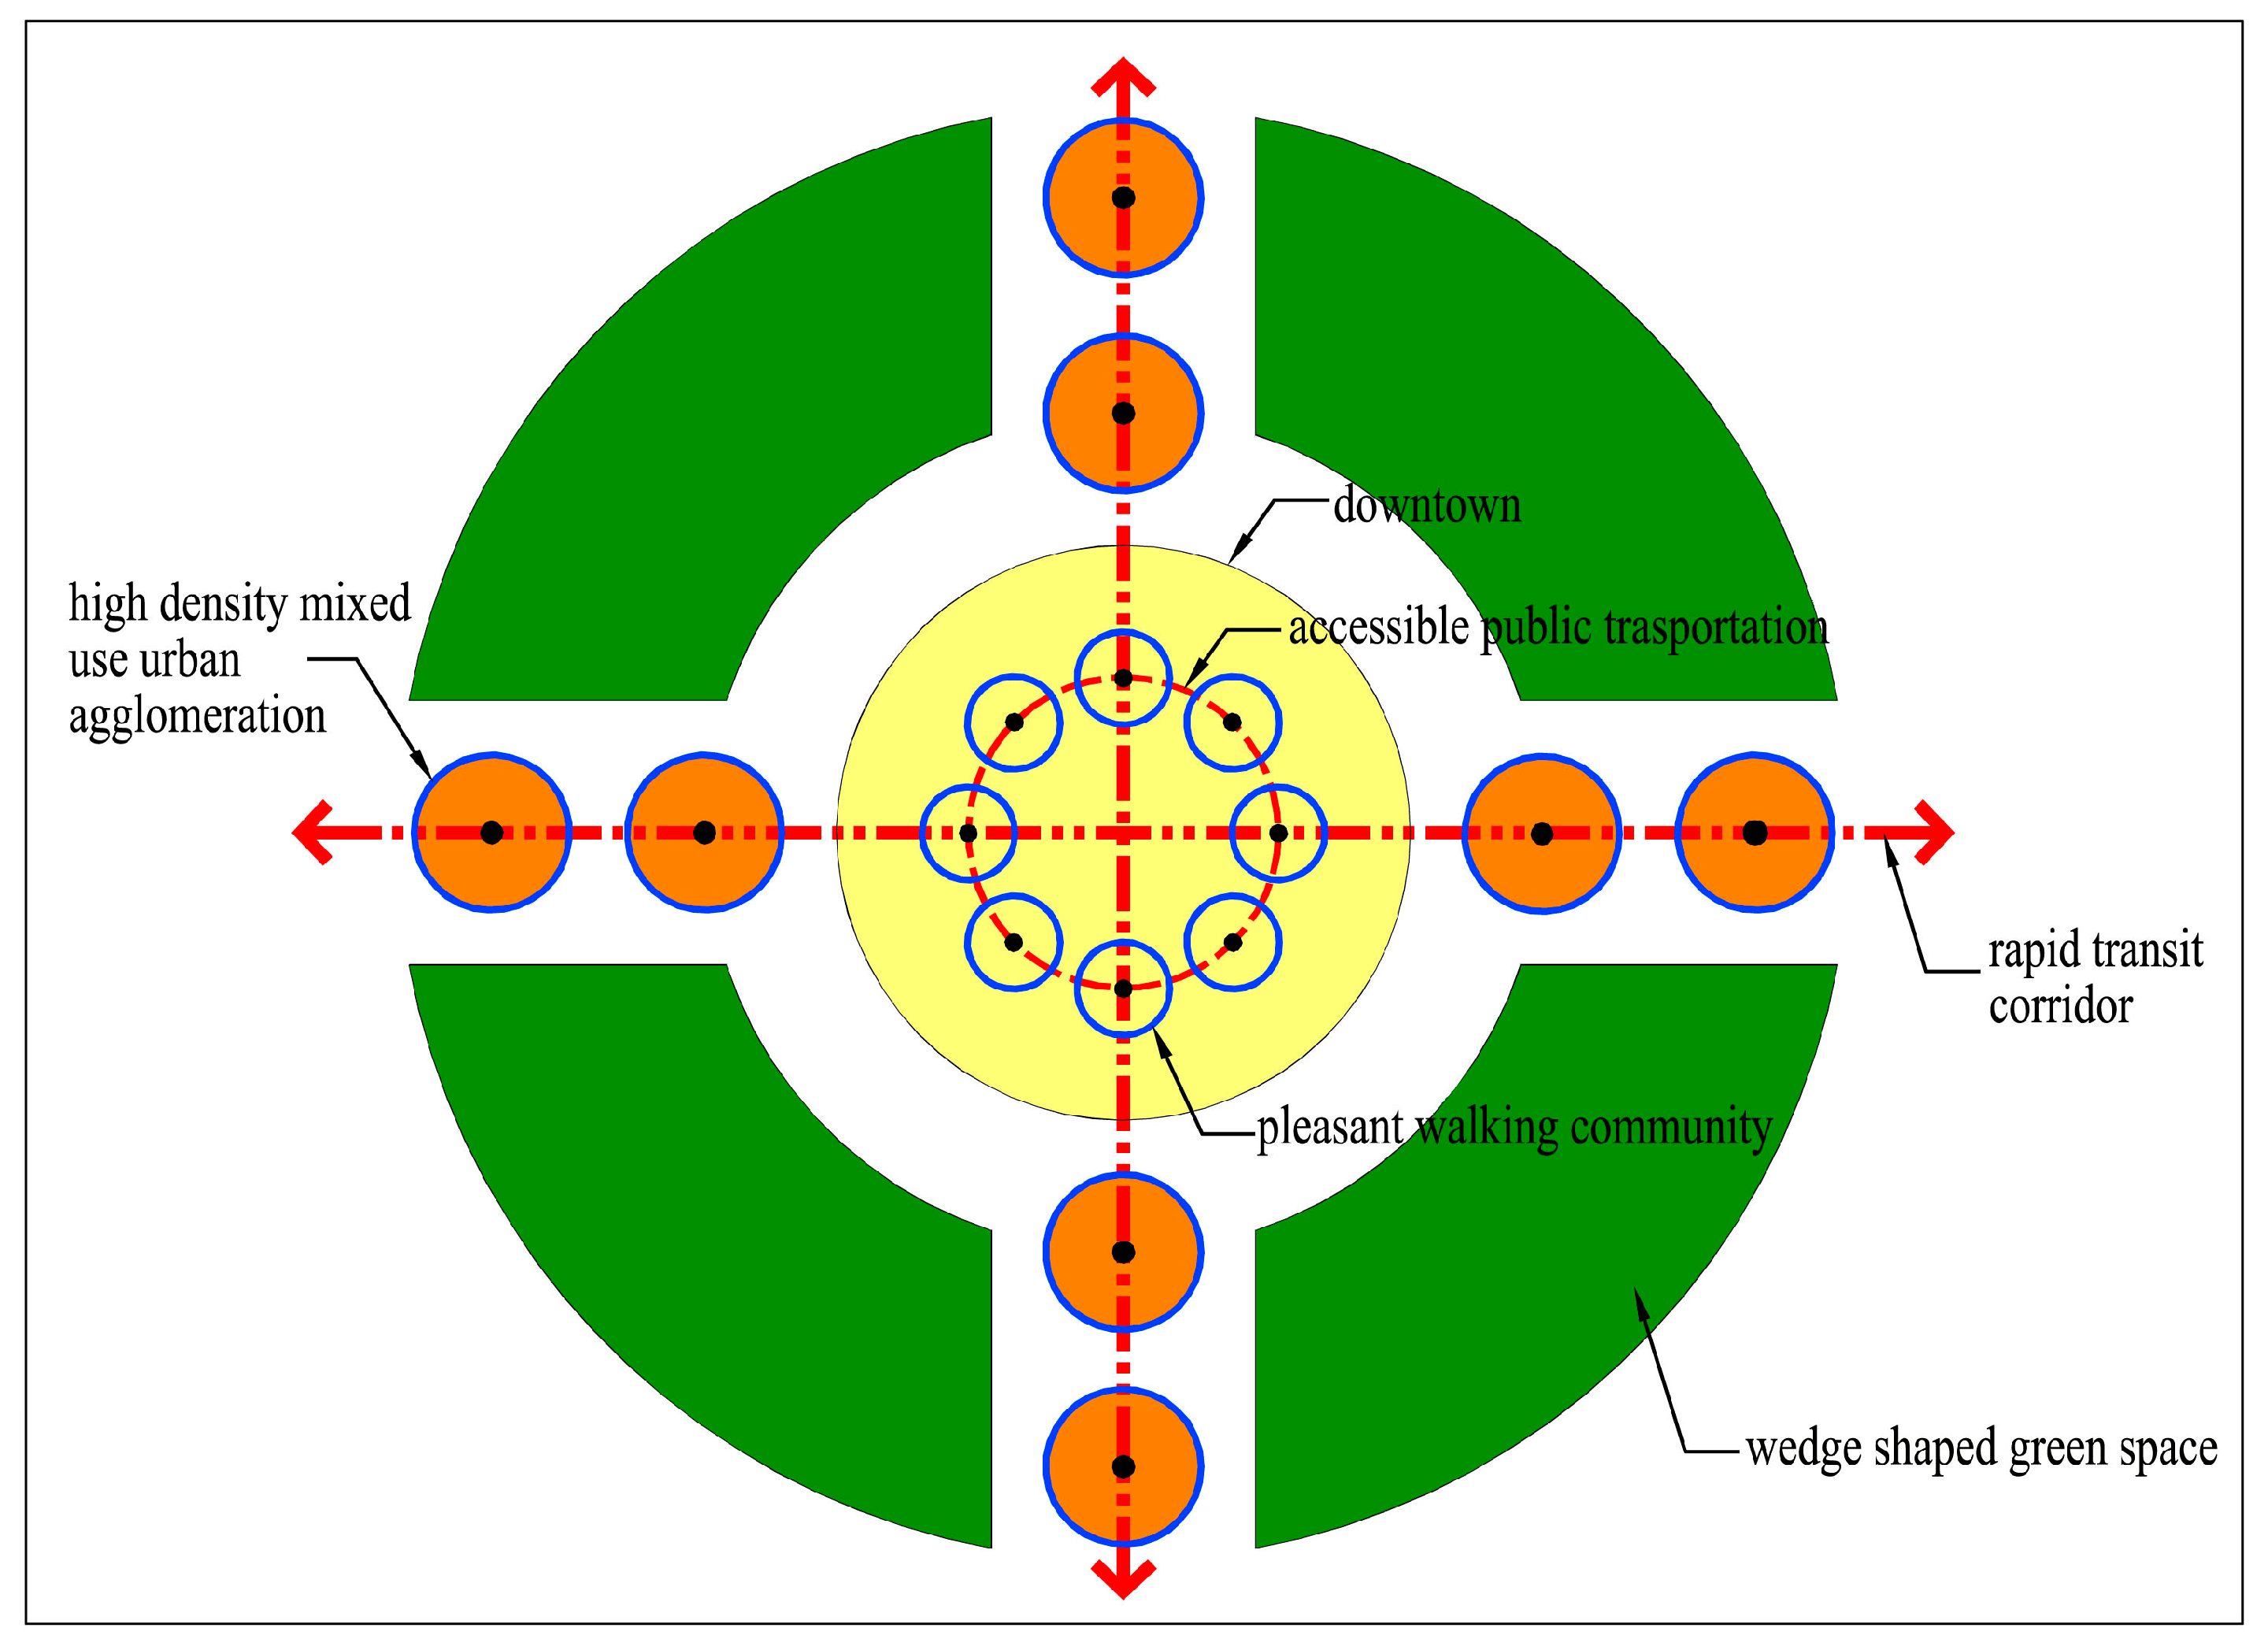
The design patterns discussed above, including the traditional walking city and modern transit metropolis display many similarities to TOD, such as high density, mixed use, environmentally friendly urban design and integration of transportation and land use. A shift from monocentric cities to increasingly polycentric urban regions has been widely recognised in recent research literature [74]. Employment and population spatial structure of metropolitan regions have evolved in the era of post-industrialization [75]. With the development of cities, the multi-centralization of cities has become a general trend of development [76]. Multi-centralization is not only the spatial differentiation of population and employment, but also the continuous improvement of the urban system. The sub center also represents a structural element of an urban sub-system within the metropolitan configuration—that is, a place with intense spatial interaction with its hinterland [77]. We propose an extension of TOD and call it Green Transportation System Oriented Development (GTOD; see Figure 6). This model includes the additional features of a walking city and an emphasis on the integration of land use with a green transportation system consisting of a non-auto trail system (for walking and bicycling) and public transportation system. The integration of land use with the green transportation system can be realised on two different scales: cities and communities. On the city scale, development is oriented by the railway or rapid transit system and divided into several urban agglomerations, and density control and the jobs/housing balance within each agglomeration are emphasised. At the community level, a non-auto trail system must be constructed to support non-auto travel such as walking and bicycling. This non-auto system should be combined with the public transportation system to promote a combined walking/public transport travel mode in place of vehicle use. Moreover, the GTOD model strongly emphasises the integration of land use with the green space system. The optimal integration mode to promote an urban spatial structure conducive to low-carbon transportation is to divide the traffic corridors with wedge shaped green spaces and limit development along the transit corridors. Proper integration of the urban structural system with the green space system is required. The optimal land use/transportation integration strategy is to divide traffic corridors with wedge-shaped green spaces and limit development along the transit corridors. This strategy forms the basis of the proposed urban structural model to promote low-carbon transportation.
5. Discussion and Conclusions
Both the theoretical arguments and empirical case studies in this paper indicate that the density, extent of mixed land use and land use/transport connection have a profound influence on the level of transport emissions. A compact urban form, effective mix of land use and appropriate scale of block are the main characteristics of a low-carbon transportation oriented urban spatial structure.
However, these features are only effective in promoting low carbon transportation when they are integrated organically with the green traffic system, consisting of the public transportation and non-auto travel systems. So, we propose an improved model GTOD, which is an extension of traditional TOD and includes the additional features of a walking city and an emphasis on the integration of land use with a green transportation system. Proper integration of the urban structural system with the green space system is also required. The optimal land use/transportation integration strategy is to divide traffic corridors with wedge-shaped green spaces and limit development along the transit corridors. This strategy forms the basis of the proposed urban structural model to promote low-carbon transportation.
In Asia, and especially in our own country, China, a large number of cities have urban characteristics conducive to implementation of the GTOD mode, e.g., a high population density, acceptance of the high-density lifestyle, sufficient public traffic flow and a lower popularity of car use compared to developing countries. China is currently undergoing large-scale city construction and a new round of urban structure adjustment and reorganisation. Now is the time for the cities to implement the GTOD mode. However, we often find inconsistencies between the traffic planning and urban planning in our system because they are relegated to different departments. In addition, traditional urban planning places more emphasis on zoning and land use than the construction of the traffic system and ecological infrastructure (EI), making it difficult to implement the GTOD mode.
A shift from monocentric cities to increasingly polycentric urban regions has been widely recognised in recent research literature [76]. Employment and population spatial structure of metropolitan regions have evolved in the era of post-industrialization [77]. With the development of cities, the multi-centralization of cities has become a general trend of development [78]. Multi-centralization is not only the spatial differentiation of population and employment, but also the continuous improvement of the urban system. The sub center also represents a structural element of an urban sub-system within the metropolitan configuration—that is, a place with intense spatial interaction with its hinterland [79]. In the future, urban planning should be focused on the construction of a spatial structure conducive to low carbon transportation. A green traffic system to support low carbon travel should be one of the primary goals of modern city planners, and the construction of a green traffic system and ecological infrastructure should be highly prioritised in urban development. These are no easy tasks and will require the cooperation of government departments in addition to further basic research. In addition, in the process of urban planning and management, as the highest functional organization, local and regional government as well as local and regional public entities have very important influence in urban planning and management and they must give full play to its own influence. Public entities such as local and regional transport departments can also effectively reduce the use of private cars through the introduction of related public transportation promotion policies, such as reducing public transport fare, increasing parking costs in the downtown area, and limiting traffic in some areas, thus promoting the development of low-carbon transportation. On the basis of following the laws of urban development, local and regional public entities should make reasonable interventions into urban management and planning so as to ensure that urban planning management can always be maintained in a scientific and proper state of development, and lay a sound and solid foundation for the long-term sustainable development of the city.
Acknowledgments
This study was supported by the National Natural Science Foundation of China (41671130, 41501144 and 41601151); the Natural Science Foundation of Guangdong Province (2015A030313867, 2017A030310475); the Highlevel Leading Talent Introduction Program of GDAS (2016GDASRC0101); the Scientific Platform and Innovation Capability Construction Program of GDAS (2016GDASPT-0210).
Author Contributions
Yuyao Ye designed research; Changjian Wang, Yuling Zhang, Kangmin Wu, Qitao Wu, and Yongxian Su performed research. All authors wrote the paper. All authors have read and approved the final manuscript.
Conflicts of Interest
The authors declare no conflict of interest.
References
- Le Quéré, C.; Andres, R.J.; Boden, T.; Conway, T.; Houghton, R.A.; House, J.I.; Marland, G.; Peters, G.P.; van der Werf, G.R.; Ahlström, A.; et al. The global carbon budget 1959–2011. Earth Syst. Sci. Data 2013, 5, 165–185. [Google Scholar] [CrossRef] [Green Version]
- Rosa, E.A.; Dietz, T. Human drivers of national greenhouse-gas emissions. Nat. Clim. Chang. 2012, 2, 581–586. [Google Scholar] [CrossRef]
- Steinberger, J.K.; Roberts, J.T.; Peters, G.P.; Baiocchi, G. Pathways of human development and carbon emissions embodied in trade. Nat. Clim. Chang. 2012, 2, 81–85. [Google Scholar] [CrossRef]
- Wang, C.; Wang, F. China can lead on climate change. Science 2017, 357, 764. [Google Scholar] [CrossRef] [PubMed]
- Liu, Z.; Guan, D.; Moore, S.; Lee, H.; Su, J.; Zhang, Q. Steps to China’s carbon peak. Nature 2015, 522, 279–281. [Google Scholar] [CrossRef] [PubMed]
- Wang, C.; Wang, F.; Zhang, H.; Ye, Y.; Wu, Q. China’s Carbon Trading Scheme is a Priority. Environ. Sci. Technol. 2014, 48, 13559. [Google Scholar] [CrossRef] [PubMed]
- Urpelainen, J. The limits of carbon reduction roadmaps. Science 2017, 356, 1019. [Google Scholar] [CrossRef] [PubMed]
- Rockström, J.; Gaffney, O.; Rogelj, J.; Meinshausen, M.; Nakicenovic, N.; Schellnhuber, H.J. A roadmap for rapid decarbonization. Science 2017, 355, 1269–1271. [Google Scholar] [CrossRef] [PubMed]
- Jackson, R.B.; Canadell, J.G.; Le Quere, C.; Andrew, R.M.; Korsbakken, J.I.; Peters, G.P.; Nakicenovic, N. Reaching peak emissions. Nat. Clim. Chang. 2016, 6, 7–10. [Google Scholar] [CrossRef] [Green Version]
- Wang, C.; Wang, F.; Zhang, X.; Yang, Y.; Su, Y.; Ye, Y.; Zhang, H. Examining the driving factors of energy related carbon emissions using the extended STIRPAT model based on IPAT identity in Xinjiang. Renew. Sustain. Energy Rev. 2017, 67, 51–61. [Google Scholar] [CrossRef]
- Wang, C.; Wang, F.; Zhang, X.; Deng, H. Analysis of influence mechanism of energy-related carbon emissions in Guangdong: Evidence from regional China based on the input-output and structural decomposition analysis. Environ. Sci. Pollut. Res. 2017, 24, 25190–25203. [Google Scholar] [CrossRef] [PubMed]
- Agency, I.E. Cities, Towns and Renewable Energy; OECD: Paris, France, 2009. [Google Scholar]
- Kennedy, C.; Steinberger, J.; Gasson, B.; Hansen, Y.; Hillman, T.; Havranek, M.; Pataki, D.; Phdungsilp, A.; Ramaswami, A.; Villalba Mendez, G. Greenhouse Gas Emissions from Global Cities. Environ. Sci. Technol. 2009, 43, 7297–7302. [Google Scholar] [CrossRef] [PubMed]
- Dhakal, S. GHG emissions from urbanization and opportunities for urban carbon mitigation. Curr. Opin. Environ. Sustain. 2010, 2, 277–283. [Google Scholar] [CrossRef]
- Zavadskas, E.K.; Kaklauskas, A.; Vainiūnas, P.; Šaparauskas, J. A model of sustainable urban development formation. Int. J. Strateg. Prop. Manag. 2004, 8, 219–229. [Google Scholar]
- Liu, W.; Qin, B. Low-carbon city initiatives in China: A review from the policy paradigm perspective. Cities 2016, 51, 131–138. [Google Scholar] [CrossRef]
- Zhao, P. Sustainable urban expansion and transportation in a growing megacity: Consequences of urban sprawl for mobility on the urban fringe of Beijing. Habitat Int. 2010, 34, 236–243. [Google Scholar] [CrossRef]
- Cariolet, J.-M.; Colombert, M.; Vuillet, M.; Diab, Y. Assessing the resilience of urban areas to traffic-related air pollution: Application in Greater Paris. Sci. Total Environ. 2018, 615, 588–596. [Google Scholar] [CrossRef] [PubMed]
- Shekarchian, M.; Moghavvemi, M.; Zarifi, F.; Moghavvemi, S.; Motasemi, F.; Mahlia, T.M.I. Impact of infrastructural policies to reduce travel time expenditure of car users with significant reductions in energy consumption. Renew. Sustain. Energy Rev. 2017, 77, 327–335. [Google Scholar] [CrossRef]
- Ruparathna, R.; Hewage, K.; Karunathilake, H.; Dyck, R.; Idris, A.; Culver, K.; Sadiq, R. Climate conscious regional planning for fast-growing communities. J. Clean. Prod. 2017, 165, 81–92. [Google Scholar] [CrossRef]
- Wang, C.; Wang, F.; Zhang, X.; Zhang, H. Influencing mechanism of energy-related carbon emissions in Xinjiang based on the input-output and structural decomposition analysis. J. Geogr. Sci. 2017, 27, 365–384. [Google Scholar] [CrossRef]
- Grazi, F.; van den Bergh, J.C.J.M. Spatial organization, transport, and climate change: Comparing instruments of spatial planning and policy. Ecol. Econ. 2008, 67, 630–639. [Google Scholar] [CrossRef]
- Grazi, F.; van den Bergh, J.C.J.M.; Ommeren, J.N.V. An Empirical Analysis of Urban Form, Transport, and Global Warming. Energy J. 2008, 29, 97–122. [Google Scholar] [CrossRef]
- World Bank. An Overview of China’s Transport Sector. 2007. Available online: http://documents.worldbank.org/curated/en/337221468024252254/pdf/427980WP0CHA0T10Box0327331B1PUBLIC1.pdf (accessed on 29 November 2017).
- Hankey, S.; Marshall, J.D. Impacts of urban form on future US passenger-vehicle greenhouse gas emissions. Energy Policy 2010, 38, 4880–4887. [Google Scholar] [CrossRef]
- Nakamura, K.; Hayashi, Y. Strategies and instruments for low-carbon urban transport: An international review on trends and effects. Transp. Policy 2013, 29, 264–274. [Google Scholar] [CrossRef]
- Banister, D.; Watson, S.; Wood, C. Sustainable Cities: Transport, Energy, and Urban Form. Environ. Plan. B Urban Anal. City Sci. 1997, 24, 125–143. [Google Scholar] [CrossRef]
- Venkatarama Reddy, B.V. Sustainable materials for low carbon buildings. Int. J. Low-Carbon Technol. 2009, 4, 175–181. [Google Scholar] [CrossRef]
- Pan, W. System boundaries of zero carbon buildings. Renew. Sustain. Energy Rev. 2014, 37, 424–434. [Google Scholar] [CrossRef]
- Alsaidi, A.Z.M. The impact of urban form characteristics on carbon mitigation process in cities. Civ. Environ. Res. 2016, 26, 23–26. [Google Scholar]
- Liu, Z.; Qin, B. Urban Form and Low-carbon Cities: Research Progress and Planning Strategies. Urban Plan. Int. 2013, 28, 4–11. [Google Scholar]
- Zhao, C.J.; Liu, X.M. The Role of Urban Green Space System in Low-carbon City. Chin. Landsc. Archit. 2010, 26, 23–26. [Google Scholar]
- Badiu, D.L.; Iojă, C.I.; Pătroescu, M.; Breuste, J.; Artmann, M.; Niță, M.R.; Grădinaru, S.R.; Hossu, C.A.; Onose, D.A. Is urban green space per capita a valuable target to achieve cities’ sustainability goals? Romania as a case study. Ecol. Indic. 2016, 70, 53–66. [Google Scholar] [CrossRef]
- Anderson, W.P.; Kanaroglou, P.S.; Miller, E.J. Urban Form, Energy and the Environment: A Review of Issues, Evidence and Policy. Urban Stud. 1996, 33, 7–35. [Google Scholar] [CrossRef]
- Kashem, S.B.; Irawan, A.; Wilson, B. Evaluating the dynamic impacts of urban form on transportation and environmental outcomes in US cities. Int. J. Environ. Sci. Technol. 2014, 11, 2233–2244. [Google Scholar] [CrossRef]
- Travisi, C.M.; Camagni, R.; Nijkamp, P. Impacts of urban sprawl and commuting: A modelling study for Italy. J. Transp. Geogr. 2010, 18, 382–392. [Google Scholar] [CrossRef]
- Young, M.; Tanguay, G.A.; Lachapelle, U. Transportation costs and urban sprawl in Canadian metropolitan areas. Res. Transp. Econ. 2016, 60, 25–34. [Google Scholar] [CrossRef]
- Zolnik, E.J. The effects of sprawl on private-vehicle commuting distances and times. Environ. Plan. B Urban Anal. City Sci. 2011, 38, 1071–1084. [Google Scholar] [CrossRef]
- Ratti, C.; Baker, N.; Steemers, K. Energy consumption and urban texture. Energy Build. 2005, 37, 762–776. [Google Scholar] [CrossRef]
- Levinson, D.M.; Kumar, A. Density and the journey to work. Growth Chang. 1997, 28, 147–172. [Google Scholar] [CrossRef]
- Schwanen, T.; Dijst, M.J.; Dieleman, F.M. Policies for Urban Form and Their Impact on Travel: The Netherlands Experience. Urban Stud. 2004, 41, 579–603. [Google Scholar] [CrossRef]
- Chen, Y.; Li, X.; Zheng, Y.; Guan, Y.; Liu, X. Estimating the relationship between urban forms and energy consumption: A case study in the Pearl River Delta, 2005–2008. Landsc. Urban Plan. 2011, 102, 33–42. [Google Scholar] [CrossRef]
- Jr, B.S.; Mednick, A.C.; Holloway, T.; Spak, S.N. Is Compact Growth Good for Air Quality? J. Am. Plan. Assoc. 2007, 73, 404–418. [Google Scholar]
- Bartholomew, K.; Ewing, R. Land Use–Transportation Scenarios and Future Vehicle Travel and Land Consumption: A Meta-Analysis. J. Am. Plan. Assoc. 2008, 75, 13–27. [Google Scholar] [CrossRef]
- Newman, P.W.G.; Kenworthy, J.R. Gasoline Consumption and Cities: A Comparison of U.S.—Cities with a Global Survey. J. Am. Plan. Assoc. 1989, 55, 24–37. [Google Scholar] [CrossRef]
- Frank, L.D. Impacts of Mixed Used and Density on Utilization of Three Modes of Travel: Single-Occupant Vehicle, Transit, Walking. Transp. Res. Rec. 1994, 1466, 44–52. [Google Scholar]
- Lin, J.J.; Yang, A.T. Structural Analysis of How Urban Form Impacts Travel Demand: Evidence from Taipei. Urban Stud. 2009, 46, 1951–1967. [Google Scholar] [CrossRef]
- Litman, T. Land Use Impacts on Transport How Land Use Factors Affect Travel Behavior. Available online: http://www.vtpi.org/landtravel.pdf (accessed on 29 November 2017).
- Glaeser, E.L.; Kahn, M.E. The greenness of cities: Carbon dioxide emissions and urban development. J. Urban Econ. 2010, 67, 404–418. [Google Scholar] [CrossRef]
- Vandeweghe, J.R.; Kennedy, C. A Spatial Analysis of Residential Greenhouse Gas Emissions in the Toronto Census Metropolitan Area. J. Ind. Ecol. 2007, 11, 133–144. [Google Scholar] [CrossRef]
- Dodman, D. Blaming cities for climate change? An analysis of urban greenhouse gas emissions inventories. Environ. Urban. 2009, 21, 185–201. [Google Scholar] [CrossRef]
- Miller, E.J.; Ibrahim, A. Urban form and vehicular travel: Some empirical findings. Transp. Res. Rec. J. Transp. Res. Board 1998, 1617, 18–27. [Google Scholar] [CrossRef]
- Brownstone, D.; Golob, T.F.; Brownstone, D.; Golob, T.F. The Impact of Residential Density on Vehicle Usage and Energy Consumption. J. Urban Econ. 2008, 65, 91–98. [Google Scholar] [CrossRef]
- Kenworthy, J.R.; Laube, F.B. Automobile dependence in cities: An international comparison of urban transport and land use patterns with implications for sustainability. Environ. Impact Assess. Rev. 1996, 16, 279–308. [Google Scholar] [CrossRef]
- Zhang, M. The Role of Land Use in Travel Mode Choice: Evidence from Boston and Hong Kong. J. Am. Plan. Assoc. 2004, 70, 344–360. [Google Scholar] [CrossRef]
- Chen, C.; Gong, H.; Paaswell, R. Role of the built environment on mode choice decisions: Additional evidence on the impact of density. Transportation 2008, 35, 285–299. [Google Scholar] [CrossRef]
- Cervero, R. Mixed land-uses and commuting: Evidence from the American Housing Survey. Transp. Res. Part A Policy Pract. 2008, 30, 361–377. [Google Scholar] [CrossRef]
- Fang, H.A. A discrete–continuous model of households’ vehicle choice and usage, with an application to the effects of residential density. Transp. Res. Part B Methodol. 2008, 42, 736–758. [Google Scholar] [CrossRef]
- Liu, C.; Shen, Q. An empirical analysis of the influence of urban form on household travel and energy consumption. Comput. Environ. Urban Syst. 2011, 35, 347–357. [Google Scholar] [CrossRef]
- Zhang, M. Exploring the relationship between urban form and nonwork travel through time use analysis. Landsc. Urban Plan. 2005, 73, 244–261. [Google Scholar] [CrossRef]
- Cervero, R.; Kockelman, K. Travel demand and the 3Ds: Density, diversity, and design. Transp. Res. Part D Transp. Environ. 1997, 2, 199–219. [Google Scholar] [CrossRef]
- Kockelman, K.M. Travel Behavior as Function of Accessibility, Land Use Mixing, and Land Use Balance: Evidence from San Francisco Bay Area. Transp. Res. Rec. J. Transp. Res. Board 1997, 1607, 116–125. [Google Scholar] [CrossRef]
- Cervero, R.; Duncan, M. Which Reduces Vehicle Travel More: Jobs-Housing Balance or Retail-Housing Mixing? J. Am. Plan. Assoc. 2006, 72, 475–490. [Google Scholar] [CrossRef]
- Sim, L.L.; Lai, M.L.; Chin, K.H.L. Integrating land use and transport planning to reduce work-related travel: A case study of Tampines Regional Centre in Singapore. Habitat Int. 2001, 25, 399–414. [Google Scholar] [CrossRef]
- Cervero, R. Planned Communities, Self-containment and Commuting: A Cross-national Perspective. Urban Stud. 2014, 32, 1135–1161. [Google Scholar] [CrossRef]
- Mindali, O.; Raveh, A.; Salomon, I. Urban density and energy consumption: A new look at old statistics. Transp. Res. Part A Policy Pract. 2004, 38, 143–162. [Google Scholar] [CrossRef]
- Calthorpe, P. The Next American Metropolis: Ecology, Community & the American Dream; Princeton Architectual Press: New York, NY, USA, 1993. [Google Scholar]
- Dai, D.; Yao, D. Research on Strategies for Walking Under Context of Global Pedestrian Culture: A Case Study on Zurich. City Plan. Rev. 2010, 34, 48–55. [Google Scholar]
- Rashid, S.; Gray, C.; Luo, A. Sustainable Transportation Development in the Pacific Rim: Policies, Challenges and Cases in the U.S., Singapore and China. Urban Plan. Int. 2011, 26, 36–41. [Google Scholar]
- Jin, A.; Zhou, Z.; Liu, M. Singapore’s Urban Transport Development Mode and Its Implications for Guangzhou. Urban Insight 2010, 4, 63–69. [Google Scholar]
- Lin, Y. Preliminary Analysis of the Integration of Hong Kong Building Complex with Traffic Space. Archit. J. 2007, 6, 26–29. [Google Scholar]
- Dong, Q.; Zhen, F. Low carbon city and analysis of its guidance to urban planning. Urban Stud. 2010, 17, 152–155. [Google Scholar]
- Cervero, R. The Transit Metropolis; Island Press: Washington, DC, USA, 1998. [Google Scholar]
- Dahl, J. Urban spaces and mobility-strategies and projects in The City of Copenhagen. Archit. J. 2011, 5–12. Available online: http://en.cnki.com.cn/Article_en/CJFDTOTAL-JZXB201101003.htm (accessed on 29 November 2017).
- Curtis, C.; Renne, J.L.; Bertolini, L. Transit Oriented Development: Making It Happen. GeoJournal 2009, 16, 1190–1195. [Google Scholar]
- Vasanen, A. Functional Polycentricity: Examining Metropolitan Spatial Structure through the Connectivity of Urban Sub-centres. Urban Stud. 2012, 49, 3627–3644. [Google Scholar] [CrossRef]
- Dadashpoor, H.; Alidadi, M. Towards decentralization: Spatial changes of employment and population in Tehran Metropolitan Region, Iran. Appl. Geogr. 2017, 85, 51–61. [Google Scholar] [CrossRef]
- Berry, B.J.L.; Kim, H.M. Challenges to the Monocentric Model. Geogr. Anal. 2010, 25, 1–4. [Google Scholar] [CrossRef]
- Cladera, J.R.; Duarte, C.R.M.; Moix, M. Urban Structure and Polycentrism: Towards a Redefinition of the Sub-centre Concept. Urban Stud. 2009, 46, 2841–2868. [Google Scholar] [CrossRef]
Figure 1.
The walking network system of Zurich.

Figure 2.
Land Use Mode of the Community Public Centre in Zurich [68].
Figure 2.
Land Use Mode of the Community Public Centre in Zurich [68].

Figure 3.
Model of the new town plan of Singapore [69].
Figure 3.
Model of the new town plan of Singapore [69].

Figure 4.
Transfer space integration inside a Hong Kong building complex.

Figure 5.
The finger-shape planning and rail lines of Copenhagen.

Figure 6.
Schematic diagram of the Green Transportation System Oriented Development (GTOD) model.

© 2017 by the authors. Licensee MDPI, Basel, Switzerland. This article is an open access article distributed under the terms and conditions of the Creative Commons Attribution (CC BY) license (http://creativecommons.org/licenses/by/4.0/).
Share and Cite
MDPI and ACS Style
Ye, Y.; Wang, C.; Zhang, Y.; Wu, K.; Wu, Q.; Su, Y. Low-Carbon Transportation Oriented Urban Spatial Structure: Theory, Model and Case Study. Sustainability 2018, 10, 19. https://0-doi-org.brum.beds.ac.uk/10.3390/su10010019
AMA Style
Ye Y, Wang C, Zhang Y, Wu K, Wu Q, Su Y. Low-Carbon Transportation Oriented Urban Spatial Structure: Theory, Model and Case Study. Sustainability. 2018; 10(1):19. https://0-doi-org.brum.beds.ac.uk/10.3390/su10010019
Chicago/Turabian StyleYe, Yuyao, Changjian Wang, Yuling Zhang, Kangmin Wu, Qitao Wu, and Yongxian Su. 2018. "Low-Carbon Transportation Oriented Urban Spatial Structure: Theory, Model and Case Study" Sustainability 10, no. 1: 19. https://0-doi-org.brum.beds.ac.uk/10.3390/su10010019
Note that from the first issue of 2016, this journal uses article numbers instead of page numbers. See further details here.