Environmental Regulation, Green Innovation, and Industrial Green Development: An Empirical Analysis Based on the Spatial Durbin Model

1
School of Economic and Management, Dongguan University of Technology, Dongguan 523808, China
2
School of Economics and Management, Harbin Engineering University, Harbin 150001, China
*
Author to whom correspondence should be addressed.
Sustainability 2018, 10(1), 223; https://0-doi-org.brum.beds.ac.uk/10.3390/su10010223
Submission received: 7 December 2017
/
Revised: 14 January 2018
/
Accepted: 15 January 2018
/
Published: 16 January 2018
(This article belongs to the Special Issue Transition from China-Made to China-Innovation
)
Abstract
:Environmental regulation and green innovation are two main fulcrums in the realization of green transition of industrial growth. However, few studies have done an empirical analysis of the impact of environmental regulation and green innovation on green development. Based on the theory of systematic interduality, regional industrial green development is regarded as a dynamic system composed of two subsystems: the state and the process subsystem. Using provincial industrial panel data from 2007–2015 and the spatial Durbin model under the unified analysis framework, this paper examines the role and mechanism of environmental regulation (divided into administrative environmental regulation, market-based environmental regulation, and public participation environmental regulation) in the impact of green innovation (divided into green product innovation and green craft innovation) on industrial green development. The results indicate a sharp fluctuating trend in China’s overall industrial green development performance, and that China’s 30 provinces can be divided into four categories, based on the development levels of two subsystems of industrial green development. There is a clear positive spatial correlation between the industrial green development performance in different provinces. Considering the impact of environmental regulation on industrial green development performance, different types of environmental regulation have different regional influences. Considering the impact of green innovation on industrial green development performance, in the absence of environmental regulation constraints, green product innovation shows a certain promotional role, and green craft innovation has a significant inhibitory effect. However, under environmental regulation constraints, market-based environmental regulation through the encouragement of green craft innovation rather than green product innovation achieves a positive impact on industrial green development.
1. Introduction
China has enjoyed rapid economic growth since 1978. However, this growth comes at the expense of resources and with increased environmental costs [1,2,3,4]. According to “BP World Energy Statistical Yearbook 2016”, China’s total energy consumption and net energy consumption accounted for 23% and 34% of the world’s total respectively in 2015, resulting in a total of 27% of the world’s carbon dioxide emissions. China has the highest energy consumption and the highest carbon emissions in the developing countries [5]. As the core of China’s economy, industry plays a significant role in economic growth. However, due to the extensive development mode adopted by industry in China for a long time, the massive resource consumption and environmental pollution caused by it have approached the environmental load limit [6]. According to the calculations of Chen [7], during the 30 years of reform and opening up, industry, which accounts for 40.1% of China’s GDP, consumed 67.9% of the country’s energy and emitted 83.1% of the country’s total carbon dioxide. The gray wall covering millions of square kilometers across the city from Beijing to Hong Kong serves as example, according to the satellite haze map from NASA [8,9]. Under the new normal of the economy, the green economy has become a new global economic development trend [10]. Therefore, the green and intensive development of China’s industry must be promoted, and green development must be realized. Green development is a mode of pursuing economic growth and development while preventing environmental deterioration, biodiversity loss and unsustainable use of natural resources [11].
Environmental regulation and green innovation are two main fulcrums in the realization of green and intensive development of industrial growth. On the one hand, as resources and the environment are public goods, there are some limitations to using market mechanisms to solve environmental problems. Therefore, it is necessary for government departments to implement environmental regulation. On the other hand, at the confluence of “innovation” and “green”, green innovation has become an effective means of breaking the constraints of resources and environment and promoting China’s green economic growth, which is more important than ever before. Green innovation can save resources and reduce environmental pollution by improving production efficiency, saving energy, and reducing emissions. Thus it has a positive effect on the green growth of the economy [12,13,14]. Under the unified analysis framework, this paper examines the role and mechanism of environmental regulation in the impact of green innovation on industrial green development, explores the concrete effects of green innovation in promoting the green transformation of industrial development, and provides preliminary empirical evidence for environmental regulation and green innovation in promoting industrial green development. It concludes that China’s overall industrial green development performance shows a fluctuating trend. In the absence of environmental regulation constraints, green product innovation and green craft innovation have promotional and inhibitory effects, respectively. However, under environmental regulation constraints, market-based environmental regulation through the encouragement of green craft innovation rather than green product innovation, achieves a positive impact on industrial green development. The policy implications of the results are outlined.
This paper is organized as follows. Section 2 provides an overview of the related literature. Section 3 establishes the research hypotheses. Section 4 introduces the design and methodology of this study. Section 5 presents the variables chosen in this study as well as data sources. Section 6 discusses our empirical results and presents our discussion. Finally, Section 7 provides conclusions and policy implications.
2. Literature Review
The existing research undertook a positive exploration at the interface between environmental regulation and green development, however, it presents mixed results. Several research papers focus on China. For instance, Li et al. [15] found that the promotion of green total factor productivity (GTFP) is the mechanism of environmental regulation by which China’s industrial development could be affected. Zhang et al. [16] found that there are regional differences in the influence of different types of environmental regulations on industrial green productivity. Zhao et al. [17] found that market-based regulations and government subsidies have a positive impact on efficiency improvement and CO2 reduction, but command and control regulations have no significant effect. Ren et al. [18] analyzed the effects of these three environmental regulations on eco-efficiency in 30 Chinese provinces based on panel data from 2000–2013. The results indicate that the effects of different types of environmental regulation on eco-efficiency apparently differ in regions. Wang and Shen [19] empirically researched the non-linear relationship between environmental regulation and the green productivity of China’s industry, and the results depicted the relationship between the two as an “inverse U curve”. Based on the data of 275 prefecture-level cities in China, Zhang and Tan [20] empirically analyzed GTFP and its influencing factors. They found that environmental regulation has a significant positive impact on GTFP. Based on the data from 273 cities in China from 2003–2013, and using the spatial Durbin model (SDM) to test the effect of mandatory government and voluntary public environmental regulation on industrial GTFP, Li and Wu [21] found that the former has a significantly positive impact on cities with high political attributes, while the latter has a direct and indirect positive impact. Several researchers focus on other countries. For instance, based on empirical results from Norwegian industrial firms, Telle and Larsson [22] found that environmental regulation promotes the improvement of industrial GTFP. Ploeg and Withagen [23] investigated the relationship between environmental regulation and green growth practices. Their findings show that the combination of R&D subsidies and the carbon tax is the best way to achieve green growth. Nielsen et al. [24] proposed that developing incentive-based and coordinated environmental regulations would contribute to realizing green growth.
More recently, some research has linked technological innovation with energy savings, emission reductions, and endogenous economic growth. There are discussions about the importance of technological innovation for boosting green development. For instance, Tellis et al. [25] argued that innovation plays a critically important role in the sustainable development of contemporary economies. Padilla-Pérez and Gaudin [26] investigated the relationship between science, technology and innovation and inclusive and sustainable economic growth. The results show that there is a strong association between the science, technology and innovation strength and social–economic development in Central American countries.
Some scholars put technical progress, environmental quality, and economic growth into a unified analytical framework, and put forward the concept of technological progress bias, energy conservation, and cleaner production—that is, green innovation [27,28]. On this basis, a few scholars began to study the influence of green innovation on the quality of economic green growth. Wang et al. [29] empirically examined the impact of green innovation efficiency and other factors on green growth performance, and found that green innovation efficiency has a significant positive impact on green growth performance. Based on the research of Rauscher [30] and Moser et al. [31], Zhou et al. [32] established an economic growth model of endogenous biochemical and environmental policy under the goal of green growth. Their simulation results showed that the key driver of green growth is directed innovation under pollution control. This research showed that green innovation has a positive effect on the green growth of economies.
Above studies mostly focused on discussing the relationship between one specific factor (such as environmental regulation, technological innovation and green innovation) and green development. However, there are few significant attempts to integrate environmental regulation, technological innovation, and green development into a methodological framework. For instance, Chan et al. [33] used the structural equation modeling to investigate relationships among environmental dynamics, green product innovation, and firm performance in China. The results show that environmental dynamics have a relatively strong moderation effect on the relationship between green product innovation and cost efficiency, and marginally moderate the relationship between green product innovation and firm profitability. By using Chinese pollution-intensive corporation panel data from 2011–2012, Zhao and Sun [34] established panel regression models to explore the influence of environmental regulation on corporation innovation and competitiveness. Guo et al. [35] developed an integrated model to investigate the relationships among environmental regulation, technological innovation and regional green growth performance. They found that environmental regulation could not directly promote regional green growth performance, but that regional green growth performance will be positively impacted by technological-innovation-driven environmental regulation.
These existing studies do lay the foundation and offer some inspiration for this paper, our study is one of the first that explores the regulatory role of environmental regulation in the impact of green innovation on industrial green development in China. In detail, this paper contributes to the literature as follows: first, in order to comprehensively reflect the scale benefit and quality improvement of industrial green development, industrial green development is regarded as a dynamic system composed of two subsystems, namely the industrial green development state subsystem and the industrial green development process subsystem. On this basis, a comprehensive evaluation index of industrial green development is constructed, namely industrial green development performance. Second, breaking through the existing studies that separately analyze the impact of environmental regulation on green growth or technological innovation on green growth, this research attempts to study the role and mechanism of environmental regulation (divided into administrative environmental regulation, market-based environmental regulation, and public participation environmental regulation) in the impact of green innovation (divided into green product innovation and green craft innovation) on industrial green development under a unified analysis framework, and reveals the inherent mechanisms of green innovation that promote industrial green development. Third, in the research method, this research builds a spatial weight matrix by integrating geographic characteristics and economic characteristics, and uses the spatial Durbin model for empirical research.
3. Research Hypotheses
3.1. Green Innovation and Industrial Green Development
Green innovation is often referred to as eco-innovation, environmental innovation and sustainable innovation. The current study defines green innovation as new or modified products and processes, including technology, managerial, and organizational innovations, that help sustain the surrounding environment [36]. According to the theory of “decoupling”, green growth means that while achieving economic development and social welfare improvement, resource consumption and environmental damage are reduced, really achieving the decoupling of economy, resources and environment. In this process, green innovation plays a key role in improving green growth performance by saving resources and reducing environmental pollution by increasing production efficiency, saving energy and reducing emissions [37]. Therefore, to achieve green development, we must rely on green innovation to alleviate economic development’s over-reliance on resource consumption and reduce environmental damage caused by pollution emissions. Magat [38] believed that green innovation not only solves environmental problems but also promotes economic growth, which is an effective way to solve both economic development and environmental problems. Exploratory empirical research has also showed that green innovation, as an important way to realize industrial green growth, can realize the “win–win” of reducing pollution and increasing production efficiency [29,30,31,32]. Based on the above analysis, the first hypothesis is stated as follows.
Hypothesis (H1)
Enterprises carrying out green innovation can promote industrial green development.
3.2. Environmental Regulation and Industrial Green Development
Based on an OECD study (2011a) [39], environmental policies are an important means of promoting green development. With environmental problems continuing to deteriorate, the Chinese government started to impose environmental laws or regulations in the 1980s. In 1979, the “Environmental Protection law of the PRC” was enacted, and was revised in 1989. Later, the “Air Pollution Prevention and Control Law of the PRC”, “Water Pollution Control Act of the PRC”, “Solid Waste Pollution Prevention and Control Law of the PRC” and others were formulated and promulgated. The formulation and implementation of these environmental policies shows that the Chinese government attaches great importance to the ecological environment problem. These regulation policies have also caused great pressure on the sustainable development of China, especially in areas with a serious shortage of resources and serious environmental pollution. Therefore, we think that the pressure of environmental regulation directly leads to the better performance of regional green development. Based on the above analysis, the second hypothesis is stated as follows.
Hypothesis (H2)
Environmental regulation has a positive impact on industrial green development.
3.3. The Regulatory Role of Environmental Regulation between Green Innovation and Industrial Green Development
The regulatory role of environmental regulation between green innovation and industrial green development is mainly manifested in two aspects. Rennings [40] pointed out that in addition to the typical spillover effect, green innovation can generate external effects by reducing the production of or reducing the external environmental costs of products, which is the so-called “double externality” of green innovation. The existence of the “double externality” of green innovation means that relying solely on the market to promote green innovation is far from enough. Unless the government implements effective incentives for green innovation and increases the market value of green innovation, it will be difficult for enterprises to have enough incentives. Therefore, market forces cannot bring green innovation to the socially optimal level, and environmental regulation is a necessary government intervention to promote green innovation. Environmental regulation policy drives enterprises to carry out green innovation by imposing appropriate incentives and restraints.
On the other hand, under environmental regulation, enterprises have to spend the pollution control investment in order to meet the regulatory sewage requirements, which are equivalent to an increase in the production costs, which is not conducive to the improvement of the enterprises’ market competitiveness. Therefore, under the pressure of environmental regulation, in order to maintain a competitive advantage in the market, enterprises often achieve profit growth through green innovation [41]. If environmental regulation is properly designed and effectively implemented, it cannot only mitigate the emission of pollutants to achieve industrial green development, but also stimulate more green innovation that can eventually offset the regulatory costs and even generate additional profit [42]. Based on the above analysis, the third hypothesis is stated as follows.
Hypothesis (H3)
Environmental regulation plays a positive regulatory role in the impact of green innovation on industrial green development.
In summary, the theoretical model of hypotheses constructed in this paper is shown in Figure 1.
4. Methodology
4.1. Definition of the Spatial Measurement Model
This paper mainly investigates the role and mechanism of environmental regulation on the impact of green innovation on industrial green development. Considering that the spatial Durbin model (SDM) can examine the influence of the dependent variables affected by the variables in the local area, as well as the dependent and independent variables in neighboring areas, this makes the SDM more suitable for the purposes of this paper. Its basic form is:
On the basis of Equation (1), the SDM of the impact of environmental regulation (divided into administrative environmental regulation, market-based environmental regulation, and public participation environmental regulation and green product innovation) on industrial green development performance.
The SDM of the impact of environmental regulation (divided into administrative environmental regulation, market-based environmental regulation, and public participation environmental regulation) and green craft innovation on industrial green development performance.
Among them, indicates the regional industrial green development performance, , , AER, , and indicate green product innovation, green craft innovation, administrative environmental regulation, market-based environmental regulation, and public participation environmental regulation, respectively. indicates the control variable and represents the spatial weight matrix. and are the section and time effects, respectively; is the random perturbation item. Le Sage and Pace pointed out that using the point estimation method of the spatial regression model to test the spatial spillover effect leads to bias (that is, the coefficient estimate of the explanatory variable does not represent the true partial regression coefficient); the total effect should be divided into a direct and an indirect effect by using the partial derivative method [43]. Referring to the method proposed by Elhorst [44], the SDM can be transferred as the following vector form:
The partial differential equation matrix for the K variables in the explanatory variable is as follows:
The mean of the diagonal elements represents the direct effect, the mean of the non-diagonal elements is the indirect effect—namely, the spatial spillover effect—and the sum of the matrix is the total effect. This paper uses this partial differential matrix method to measure the effect of environmental regulation and green innovation on industrial green development performance.
4.2. Construction of the Spatial Weight Matrix
The spatial weight matrix is exogenously given in the spatial econometric model, and the selection of a reasonable spatial weight matrix is the key to spatial econometric analysis. The current relatively common spatial weight matrix has: (1) The geographically-adjoining weight matrix: if two regions are geographically adjacent they are set to one, and if not adjacent they are set to zero. (2) Geographical distance weight matrix: this is usually constructed from the reciprocal of the geographical distance squared. (3) Economic distance weight matrix: the geographical characteristics and economic characteristics are used to build the spatial weight matrix; provinces with higher levels of economic development have greater spatial influence and spillover effects on provinces with lower economic development levels. For instance, Beijing’s influence on Hebei is greater than the influence of Hebei on Beijing [45,46,47].
This paper uses the economic distance weight matrix to study the spatial effect of regional industrial green development. The weights of the matrix are set according to the distance between provinces and per capita gross domestic product (GDP) [48]. The matrix element of the spatial weight matrix after normalization of the line ; among them, is defined as follows:
In Equation (6), represents the average annual per capita GDP of provinces during the observation period, and is the distance between provinces.
5. Data and Variables
5.1. Industrial Green Development Performance
Green growth in the general sense may be just a “standing still” economic model, that is, a reduction of pollution emissions under the condition of no economic growth is also considered to have achieved green growth. Green development not only involves green economy growth, but also increased economic efficiency, the upgrading of industrial structures and the improvement of social welfare. Therefore, industrial green development should not only reflect the total green output and benefit (scale index) of industries, but also increases in green growth efficiency (quality index) [49]. In order to comprehensively and objectively evaluate regional industrial green development, based on the theory of systematic interduality, this paper builds an indicator that can comprehensively measure the scale benefit and quality improvement of industrial green development, namely industrial green development performance.
From the systems perspective, the physical world is made up of two elements of Yin and Yang. These two elements exist in the same object, appear and disappear together, and their existence conditions and references each other—a phenomenon known as “dual” in the laws of physics (i.e., the wave-particle duality of light). In systems science, it is more generally accepted that either system could be divided into two complementary subsystems that are “virtual, real” or “soft, hard”. Gao and Xu [50] carried out a systematic integrative study, and first developed the most extensive concept of duality and four equivalence concepts. In the broader sense of “systematics”, a “theory of systematics interduality” is proposed. Under the concept of the theory of systematic interduality, many research results have been presented.
Based on the theory of systematic interduality, industrial green development is seen as a dynamic system; it presents the characteristics of a state and process in the process of green development—“state” is the static description of the system, and “process” is the dynamic reflection of the system. Industrial green development can be divided into two subsystems, that is, the industrial green development state subsystem and industrial green development process subsystem. When describing the level of industrial green development in a specific space–time, it is necessary to pre-define it in a stationary state. That is to say, the description of the level of industrial green development should be understood in terms of a view of state, which is the industrial green development state subsystem. The industrial green development process subsystem is a “virtual image” subsystem of industrial green development. It is based on the dynamic analysis of industrial green development in the time dimension. The former is the objective real image subsystem (the material subsystem), and the latter is the virtual image subsystem composed of the properties mapped by the material subsystem. In order to evaluate the regional industrial green development performance, the development level of the two subsystems should first be measured objectively.
The evaluation of the regional industrial green development state subsystem focuses on measures of the outputs and benefits of green development. It is a measure of the overall quantity and scale of the output of green development in regional industries. This research evaluates the development level of the regional industrial green development state subsystem by using the industrial green development benefit (GDB). Its measures include economic growth, energy efficiency, and environmental benefit outputs, the five specific indicators seen in Table 1 (see column 3, lines 5–9). For green development benefit, the entropy method [9] is adopted to evaluate and compare the industrial green development benefit in various provinces of China.
The evaluation of the regional industrial green development process subsystem focuses on measuring the effectiveness of the industrial green development process, which comprises the evaluation of the quality of the regional industrial green development. The measure of industrial green development quality simultaneously reflects improvements in the growth efficiency and changes in the growth pattern (that is, energy savings and environment friendliness), while the index of green total factor productivity (GTFP) properly reflects the effect of transformations from extensive development to green intensive development for industries. Therefore, this paper adopts GTFP to measure the development level of the regional industrial green development process subsystem. For regional industrial GTFP, the Malmquist–Luenberger index [51] is used to calculate. Before applying this index, it is important to determine the indicators of inputs, outputs (including desirable outputs and undesired outputs), the specific indicators seen in Table 1 (see column 3, lines 1–9).
To sum up, the industrial green development performance (IGDP) of this paper is:
According to Equation (7), the overall level of regional industrial green development performance depends on the development level and coordination degree of the two subsystems. The two subsystems of the regional industrial green development influence and restrict each other. Only when the two subsystems achieve coordinated and balanced development, industrial intensive green development can be realized.
5.2. Environmental Regulation
At present, the more commonly-used environmental regulations are classified into three types, namely, administrative environment regulation, market-based environmental regulation, and public participation environmental regulation [18].
Administrative environmental regulation is the most widely-used environmental regulation in China. It refers to environmental laws, regulations and policies enacted by government departments or environmental protection agencies, and its fundamental characteristic is that it is mandatory. In order to solve outstanding environmental problems directly and effectively, some of our environmental policies will be implemented through administrative legislation and administrative orders. According to the different stages of regulations, it can be divided into three types of regulations: pre-incident, incident and ex-post. Among these, pre-incident regulations are to be taken as a precaution. Considering that the “three simultaneous” system is China’s first pre-incident regulation, administrative environmental regulation is measured by the proportion of the total environmental investment of the “three simultaneous” projects in total industrial output value.
Market-based environmental regulation refers to government departments using market means such as price and cost to promote the internalization of external costs, so that enterprises have an inherent power to prevent damage to the environment and reduce environmental pollution, and ultimately improve environmental pollution. Marketability is a fundamental characteristic. China’s common means of market-based environmental regulation refers mainly to sewage charges, sewage subsidies, and tradable permits. Considering the early implementation of China’s sewage charge system, and this policy is relatively stable. Market-based environmental regulation is measured by the proportion of the sewage fee income in the total industrial output value.
Public participation environmental regulation refers to the public expressing their environmental interests by participating in environmental regulation activities through understanding information. In fact, due to the great difference in the level of public participation and the restriction of government environmental regulation legislation, the forms and channels of public participation in environmental regulation are limited in China, possible only through environmental complaints, environmental letter visits and other channels. Considering the instability of environmental prosecution data and the strong randomness, public participation environmental regulation is measured by number of letters of civil environment petition per citizen.
5.3. Green Innovation
Green innovation can be divided into different dimensions or types, among which green product innovation and green craft innovation are widely accepted [52,53,54,55]. Green product innovation refers to the green products that meet environmental requirements through design, development, and production throughout the life cycle of the product, thus reducing energy consumption and environmental pollution. Compared with traditional product innovation, green product innovation pays more attention to the reduction of energy consumption. Therefore, we use a new product unit, energy consumption, to express green product innovation [56], the smaller the ratio, the stronger the green product innovation ability. Green craft innovation refers to the innovation of production technology and technological equipment in the production process. With reference to the existing literatures [57], the proportion of technical transformation investment of the total industrial output value, as measure of green craft innovation. The larger the ratio, the stronger the green craft innovation ability.
In accordance with the existing literature [21,49], this paper takes into account five factors, namely, property right structure (PRO), scale of enterprise (SE), trade (TRA), capital intensity (CI) and foreign direct investment (FDI) in the control variables. Details of the variables are outlined in Table 2.
5.4. Data Sources and Descriptions
Due to the change of the statistical indicators and caliber, the research period of this paper is 2007–2015, and the research object is China’s 30 provinces (Tibet is eliminated because of a lack of data). By using traditional practices, the regions are divided into three major regions, namely the eastern, central, and western regions. Table 2 provides descriptive statistics for the variables.
6. Empirical Results and Discussion
6.1. Measuring Results of Industrial Green Development Performance
The entropy method and the Malmquist–Luenberger index model are used to respectively evaluate the industrial green development benefit (GDB) and the green total factor productivity (GTFP) index of each province in China; Equation (7) is then used to calculate the industrial green development performance (IGDP). The results are shown in Table 3.
From the temporal perspective, the growth trend of the mean of industrial green development performance in China as a whole, as well as its central and western regions, in the years 2007–2015, is consistent with a trend of sharp fluctuation. All regions reached their highest point in 2011 (0.538, 0.537, and 0.516, respectively). The eastern region is showing a steady trend of annual growth. From the spatial perspective, Guangdong shows the highest mean of industrial green development performance in the period 2007–2015, and Hebei the lowest. Comparing the three regions, the eastern region shows the highest mean industrial green development performance (0.514), which is much higher than the national mean (0.456), while the central region (0.440) and western region (0.410) are significantly lower. Using analysis of variance (F = 9.515, P = 0.001), one can see that there are significant differences between the means of industrial green development performance.
The reasons for this regional disparity are manifold. This paper mainly gives explanations from two aspects of economic growth and urban agglomeration. First, the eastern region has a relatively high level of economic growth and realized the necessity for environmental governance and regulation earlier than the central region and western region, and implemented environmental governance investment and regulatory policy-making earlier. In order to rapidly reverse the situation of low levels of economic growth, the one-sided pursuits of economic growth in the central region and western region have brought about serious environmental pollution. Especially in recent years, the central region and western region have achieved rapid economic growth by undertaking industrial transfer in the eastern region. At the same time, they absorbed a large amount of disqualified production capacity and caused some pressure on the environment and resources. Second, the levels of urban agglomeration in the eastern, central and western regions are obviously different. The agglomeration level in the eastern region is obviously higher than the central and western regions. Urban agglomeration and development groups have been formed and the economic density of cities has been significantly raised in the eastern region. Research shows that the increase in urban agglomeration can produce a significant emissions reduction effect, which mainly comes from various spillover effects of economic agglomeration and the scale economy of pollution control [58]. Overall, the regional industrial green development in China shows clear regional differences. The eastern region is the leader in industrial green development, and the central region and western region need to catch up.
From the perspective of the duality subsystems of regional industrial green development, and considering its comprehensive performance in terms of green development benefit and green total factor productivity index in different provinces, the means of the two are the classification threshold (with values of 0.433, and 1.053 for the horizontal axis and vertical axis, respectively). The 30 provinces in China can be divided into four categories, as shown in Figure 2 and as discussed below.
Category A. The six provinces of Beijing, Tianjin, Hubei, Jilin, Hainan, and Anhui belong to this category. The areas in this category are characterized by the following: development levels of two subsystems higher than the national mean, that is, industrial green development has a superior scale output and quality enhancement. These areas are the benchmark areas of China’s industrial green development, and have obvious green development superiority. In these areas, the experience and path of industrial green development should continue to be explored, the characteristic pattern of green development (the basic kernel of this pattern is the industrial system, innovation system and institution mechanism) should be developed, and the comparative advantage of green development should be transformed into a competitive advantage.
Category B. The seven provinces of Ningxia, Neimenggu, Shaanxi, Xinjiang, Guangxi, Gansu, and Sichuan belong to this category. The areas in this category have a development level of industrial green development process subsystem that is higher than the national mean, and a development level of industrial green development state subsystem that is lower than the national mean. That is, industrial green development has a certain comparative advantage in the green development efficiency promotion and process quality, but a shortage in the green development scale benefit output. These areas have better green development process effectiveness, indicating a certain process superiority and potentiality of the green development in such areas.
Category C. The nine provinces of Hebei, Shanxi, Qinghai, Yunnan, Guizhou, Liaoning, Heilongjiang, Hunan, and Chongqing belong to this category. The characteristics of this category are: both the development level of the industrial green development state subsystem and industrial green development process subsystem are lower than the national mean, that is, the scale benefit and process quality of the industrial green development is “double weak”. According to the predicament bureau, the overall industrial green development level is poor. In these areas, the green development concept must be adopted as guidance in the development of the regional industrial economy, while measures must simultaneously be taken to vigorously promote low consumption and low-carbon green development.
Category D. This category is comprised of the eight provinces of Guangdong, Jiangsu, Shandong, Shanghai, Zhejiang, Henan, Fujian, and Jiangxi. The development level of the industrial green development state subsystem is higher than the national mean, while the development level of the industrial green development process subsystem is lower than the national mean. Industrial green development has a certain comparative advantage in the scale benefit output; however, there is a certain insufficiency in efficiency promotion of green development and process quality. These areas should fully embrace the advantages of the large-scale output benefits of industrial green development, reverse the shortage of the inefficient allocation of green resources, and realize green and intensive development.
6.2. Results Analysis
In the use of spatial econometric methods, spatial dependence is investigated first. The results show that: the global Moran I index is 0.167 (z test value is 2.139), rejecting the original assumption at the 5% significance level, thus indicating that regional industrial green development performance has spatial autocorrelation.
The spatial Durbin model (SDM) is divided into the individual fixed effect model and the individual random effect model. According to the results of the Hausman test, models (2) and (3) passed the test of significance, and therefore the individual fixed effect model is used as result of the final report. The estimated results for national samples are shown in Table 4.
The estimation results indicate that the green development spatial coefficient in models (2) and (3) are positive, which indicates that there is a significant positive spatial correlation and spatial spillover effect in the industrial green development performance among provinces.
For model (2), that is, the impact of environmental regulation and green product innovation on industrial green development performance, the direct and total effects of administrative environmental regulation are negative and the indirect effect is positive, but none of them pass the test of significance. This may mean that administrative environmental regulation is not conducive to industrial green development performance in this province, but that this province’s industrial green development performance will benefit from administrative environmental regulation in the neighboring provinces. The direct effect of market-based environmental regulation is positive, but does not pass the test of significance. The indirect effect and the total effect of market-based environmental regulation are negative, and the tests of significance were adopted at the 5% and 10% levels, respectively. This implies that market-based environmental regulation is beneficial to industrial green development performance in this province; however, and such development will be restrained by the market-based environmental regulation of neighboring provinces. Moreover, the restraining effect is obviously greater than the promotion effect. The direct, indirect, and total effects of public participation environmental regulation are negative; however, none of them pass the test of significance. This indicates the possibility that public participation environmental regulation will restrain the industrial green development performance of the province and its neighboring provinces. The direct, indirect, and total effect coefficients of green product innovation on industrial green development performance, which are respectively −0.0002, −0.0001, and −0.0002, indicate that the new product unit energy consumption has a negative correlation with industrial green development performance—that is, the stronger the green product innovation ability, the more conducive to the improvement of industrial green development performance. Green product innovation is beneficial to the industrial green development performance of the province and neighboring provinces, and its direct effect is greater than the indirect effect, which indicates that the green product innovation of this province has a greater effect on its industrial green development performance. This implies that the industrial enterprises actively implement green product innovation through the active development and production of energy-saving new products, and reducing the emissions in the product production and use processes, so that the “win–win” of the environmental and economic benefits can be obtained. The research findings on the influence of different environmental regulations on industrial green development performance are basically consistent with the research results of some empirical studies about China (Li et al. [15]; Zhao et al. [17]; Zhang and Tan [20]). That is, environmental regulation has a positive impact on China’s green growth or green development; However, the impact of different types of environmental regulation shows some differences, it is difficult to promote industrial green transformation by administrative environmental regulation, while market-based environmental regulation can promote the industrial green transformation. Based on this, the second hypothesis (H2) is partly confirmed.
For model (3), that is, the impact of environmental regulation and green craft innovation on the industrial green development performance, the influence of the three environmental regulations of administrative environmental regulation, market-based environmental regulation and public participation environmental regulation on industrial green development performance, are consistent with the results of model (2). This verifies the robustness of the model results. The direct, indirect, and total effects of green craft innovation on industrial green development performance are all negative, and passed the test of significance, and the coefficients are respectively −0.0336, −0.0186, and −0.0522.This indicates that green craft innovation has a certain inhibitory effect on industrial green development performance in the provinces and the neighboring provinces. A possible explanation for this is that we used “the proportion of technical transformation investment in total industrial output value” to measure green craft innovation. For industrial enterprises with a background of no strict environmental regulation constraints, the spontaneous technical transformation activities and funds are more focused on improving total factor productivity than the green transformation of the existing production equipment and technology. The increase in investment in technical transformation has not had a positive effect on industrial green development performance. Based on the above analysis, the first hypothesis (H1) is partly confirmed. That is, enterprises that carry out green product innovation can promote the industrial green development, while enterprises that carry out green craft innovation have a certain inhibitory effect on the industrial green development.
In the control variables, the estimation results of models (2) and (3) are essentially consistent. Among them, the direct and total effects of trade (TRA) on industrial green development performance are significantly negative, and the indirect effect is negative, but not through the test of significance. The direct, indirect, and total effects of capital intensity (CI) and foreign direct investment (FDI) on industrial green development performance are significantly negative. The direct, indirect, and total effects of scale of enterprise (SE) on industrial green development performance are significantly positive. The influence of property rights structure (PRO) on industrial green development performance shows instability.
In general, the influence of three different types of environmental regulation and two different types of green innovation on the regional industrial green development performance differs among the three regions, as shown in Table 5.
Considering the impact of administrative environmental regulation on industrial green development performance, the direct, indirect, and total effects of administrative environmental regulation in the eastern and western region are all negative. While the direct and total effects in the central region are negative, the indirect effect is positive; further, the eastern region passes the test of significance. This indicates that administrative environmental regulation with “compulsory treatment” as the main feature has a significant negative impact on industrial green development performance in the eastern region. Considering the impact of market-based environmental regulation on industrial green development performance, the direct effects of market-based environmental regulation in the eastern and western regions are positive, while the indirect and total effects are negative. However, the direct, indirect, and total effects in the central region are all negative, and most of the results do not pass the test of significance. In terms of the impact of public participation environmental regulation on industrial green development performance, the direct effects of public participation environmental regulation in the central and western region are positive, while the indirect effects and the total effects are negative and did not pass the test of significance. However, in the eastern region, both the direct and total effects are positive, and the indirect effect is negative, and passes the test of significance. This means that the positive effect of public participation in environmental supervision and management on the promotion of industrial green development performance is already apparent in the eastern region. This demonstrates that popularizing public environmental education, raising public environmental awareness, and increasing public access to environmental information are beneficial to the transformation of industrial green development. This is partly in accordance with the result of Ren et al. [18]. That is, in the eastern region, public participation environmental regulation has a positive impact on industrial green development, while administrative environmental regulation has a negative impact.
Considering the impact of green product innovation on industrial green development performance, the direct, indirect, and total effects in the eastern, central, and western regions are negative, while only the eastern region passes the test of significance. This implies that the eastern region has achieved initial success in realizing industrial green development through green product innovation. Considering the impact of green craft innovation on industrial green development performance, the direct, indirect, and total effects are negative in the central and western regions, but none passed the test of significance. The direct and total effects of the eastern region are negative, and this passed the test of significance; the indirect effect is positive, but did not pass the test of significance.
Overall, the test results for the sub-regions of the control variables are basically the same as those of the national overall sample test, showing some regional differences.
Another concern of this research is the mechanism of the three different types of environmental regulation, which manifests itself in the process of two different types of green innovation acting on industrial green development performance (the regulatory role of environmental regulation in the impact of green innovation on industrial green development performance). Specifically, this issue was examined by adding the interaction items of three different types of environmental regulation and green product innovation to model (2), and by adding the interaction items of three different types of environmental regulation and green craft innovation to model (3). Table 6 reports the estimated results of the SDM after adding the interaction items.
From the estimation results, the direct and total effects of the interaction items MER * GPI are significantly positive, while the indirect effect is positive but not significant. This demonstrates that, in the restraint of market-based environmental regulation, green product innovation has not played a positive role in promoting industrial green development performance. The direct and total effects of the interaction items MER * GCI are significantly positive, while the indirect effect is positive but not significant. This demonstrates that the more restrictive the market-based environmental regulation, the more the investment in technical transformation, especially in green technology and equipment upgrading, so as to promote industrial green development. Therefore, the adoption of market-based environmental regulation is to encourage green craft innovation rather than green product innovation, and ultimately enhances the industrial green development performance, which is an effective path of environmental regulation indirectly affecting the industrial green development performance. Based on the above analysis, the third hypothesis (H3) is partly confirmed. That is, under the regulatory role of market-based environmental regulation, green craft innovation has a positive effect on the industrial green development.
A possible explanation is that levying sewage charges as a tool of market-based environmental regulation will result in an increase in production costs and a decrease in corporate profits. This will prompt enterprises to adopt green craft innovation to improve or develop green process equipment and cleaner production process with low energy consumption and less pollutants, to offset the “compliance costs” of pollution abatement. Although green product innovation can reduce energy consumption and pollution from the source, the research and development of green products is costly and risky. Due to the “externality” of the “green benefits” of green products, it is difficult for enterprises to enjoy all benefits of green product innovation. Moreover, the current market environment lacks an effective green product management mechanism, and is incapable of encouraging enterprises to innovate green products. For cost savings and risk aversion considerations, enterprises will choose green craft innovation to respond to market-based environmental regulation.
The existing tools of market-based environmental regulation in China include levying sewage charges (the indicator used in this paper), sewage subsidies and tradable sewage permits. In the process of implementation, the enterprises that consider the correlation between these tools and green product innovation is not strong, because green product innovation is for consumers and has nothing to do with sewage disposal, and thus cannot encourage enterprises to carry out green product innovation [59,60]. In the future, when China designs market-based environmental regulation tools, their incentive capability for green product innovation should be one of the primary considerations.
7. Conclusions and Policy Implications
Using the panel data of 30 provinces in China from 2007–2015, this paper constructed and calculated an index of industrial green development performance, based on the theory of systematic interduality. Through application of the spatial Durbin model, under the unified analysis framework, the role and mechanism of environmental regulation in the impact of green innovation on industrial green development were investigated. The main conclusions were as follows: (1) During the period of investigation, the mean industrial green development performance in China experienced sharp fluctuation, in comparison, the means industrial green development performance in the three regions was as follows: the eastern, central and western regions. The six provinces of Beijing, Tianjin, Hubei, Jilin, Hainan, and Anhui show a high-quality coordinated development in the two subsystems of industrial green development, with higher levels of scale benefit and quality improvement. (2) The influence of different types of environmental regulation on industrial green development performance differs across regions. In the eastern region, administrative environmental regulation has a certain negative effect. In the eastern and western regions, the direct effect of market-based environmental regulation on industrial green development performance is positive; the positive effects of public participation environmental regulation have gradually became apparent in the eastern region. (3) In the absence of environmental regulation, green craft innovation has had a certain inhibitory effect on industrial green development performance, while green product innovation has had a certain promotional effect. However, under the constraints of market-based environmental regulation, green product innovation has not played a positive role in promoting industrial green development performance, while green craft innovation has played a positive role.
The important policy implications of these conclusions are as follows: first, government should fully consider the adaptability of different types of environmental regulation in different regions, and implement the policies and tools of environmental regulation. On the whole, the use of administrative environmental regulation policies and tools nationwide, and especially in the eastern region, should gradually be reduced. In addition, the eastern region should be a focus on enriching and using market-based environmental regulation tools, and to guide the public participation environmental regulation by perfecting and cultivating the external environment of public participation in environmental protection and management. Second, market-based environmental regulation and green craft innovation should be promoted simultaneously, through the provision of market-based environmental regulation policies and tools, promoting the “incentive effect” of market-based environmental regulation on green craft innovation for enterprises. Third, the existing environmental regulation cannot inspire enterprises to carry out green product innovation to achieve industrial green development. Therefore, a complex and systematic project is required to encourage enterprises to adopt green product innovation.
Although this study provides valuable insights, it has limitations, which should serve to stimulate further research. First, our study is limited to the sample data. Arguably, the sample data not only satisfies the needs of this study but also represents the typical data for the key period of China’s industrial green transition. Extending the study to evaluate other periods to confirm our findings of similarities is one area where we can extend this study. Second, in our study, environmental regulation is divided into administrative environmental regulation, market-based environmental regulation, and public participation environmental regulation, and each type of environmental regulation is measured by a typical indicator in empirical research. In further research, we may consider a further expansion of the indicator system. According to the development of environmental regulation policies, it can be divided into more types or subdivided indicators, and more guiding conclusions can be obtained. Third, in this paper, we take the provincial industrial panel data from China as the research object, and some meaningful results are obtained. In order to keep the consistency of the results, we will try to expand further research by taking panel data from China’s manufacturing or industry as the research subject.
Acknowledgments
This work is support by grants from the National Natural Science Foundation of China (71603048), Guangdong Natural Science Foundation (2015A030313656), Foundation for Distinguished Young Talents in Guangdong (2014WQNCX155), National Social Sciences Fund of China (14BGL007); Foundation of College’s Key Research base on Humanities and Social Science in Guangdong Province, China (2016WZJD005). Guangdong Philosophy and Social Science Program (GD17CYJ06). Innovation and Strong School Project in Higher Education (2016GXJK157).
Author Contributions
Zhijun Feng conceived and designed the study; Wei Chen contributed to the fieldwork.
Conflicts of Interest
The authors declare no conflict of interest.
References
- Liu, Y.H.; Gao, C.C.; Lu, Y.Y. The impact of urbanization on GHG emissions in China: The role of population density. J. Clean. Prod. 2017, 157, 299–309. [Google Scholar] [CrossRef]
- Lu, Z.; Chen, H.; Hao, Y.; Wang, J.; Song, X. The dynamic relationship between environmental pollution, economic development and public health: Evidence from China. J. Clean. Prod. 2017, 166, 134–147. [Google Scholar] [CrossRef]
- Dai, J.; Chen, B.; Hayat, T.; Alsaedi, A.; Ahmad, B. Sustainability-based economic and ecological evaluation of a rural biogas-linked agro-ecosystem. Renew. Sustain. Energy Rev. 2015, 41, 347–355. [Google Scholar] [CrossRef]
- Sun, X.; Xiong, S.; Zhu, X.J.; Zhu, X.D.; Li, Y.F.; Li, B.L. A new indices system for evaluating ecological-economic-social performances of wetland restorations and its application to Taihu lake basin. China Ecol. Model. 2015, 295, 216–226. [Google Scholar] [CrossRef]
- BP Public limited company. BP World Energy Statistical Yearbook 2016; BP Public Limited Company: Beijing, China, 2016. [Google Scholar]
- Tian, P.; Lin, B. Promoting green productivity growth for China’s industrial exports: Evidence from a hybrid input-output model. Energy Policy 2017, 111, 394–402. [Google Scholar] [CrossRef]
- Chen, S.Y. Energy consumption, carbon dioxide emissions and sustainable development of China’s industry. Econ. Res. J. 2009, 4, 41–55. (In Chinese) [Google Scholar]
- Li, L.; Tang, D.L.; Kong, Y.; Liu, D.J.; Yang, Y.H. Spatial econometrical research on the impact of FDI on urban haze pollution—Take the Pearl River Delta as an example. Manag. World 2016, 6, 1003–1952. (In Chinese) [Google Scholar]
- Hou, J.; Chen, H.; Xu, J.Z. External knowledge sourcing and green innovation growth with environmental and energy regulations: Evidence from manufacturing in China. Sustainability 2017, 3, 342. [Google Scholar] [CrossRef]
- Shi, B.; Yang, H.; Wang, J.; Zhao, J. City Green Economy Evaluation: Empirical Evidence from 15 Sub-Provincial Cities in China. Sustainability 2016, 8, 551. [Google Scholar] [CrossRef]
- Antal, M. Green goals and full employment: Are they compatible? Ecol. Econ. 2014, 107, 276–286. [Google Scholar] [CrossRef]
- Sun, L.Y.; Miao, C.L.; Li, Y. Ecological-economic efficiency evaluation of green technology innovation in strategic emerging industries based on entropy weighted TOPSIS method. Ecol. Indic. 2017, 73, 554–558. [Google Scholar] [CrossRef]
- Byron, C.J.; Jin, D.; Dalton, T.M. An Integrated ecological–economic modeling framework for the sustainable management of oyster farming. Aquaculture 2015, 447, 15–22. [Google Scholar] [CrossRef]
- Ooba, M.; Hayashi, K.; Fujii, M.; Fujita, T.; Machimura, T.; Matsui, T. A long-term assessment of ecological-economic sustainability of woody biomass production in Japan. J. Clean. Prod. 2015, 88, 318–325. [Google Scholar] [CrossRef]
- Li, B.; Peng, X.; Ouyang, M.K. Environmental regulation, green total factor productivity and the transformation of China’s industrial development mode: Empirical study based on data from 36 industrial sectors. China Ind. Econ. 2013, 4, 56–68. (In Chinese) [Google Scholar]
- Zhang, J.X.; Cai, N.; Yang, C. Impact of environmental regulations on China’s industrial green growth index. China Popul. Resour. Environ. 2015, 1, 24–31. (In Chinese) [Google Scholar]
- Zhao, X.; Yin, H.; Zhao, Y. Impact of environmental regulations on the efficiency and CO2 emissions of power plants in China. Appl. Energy 2015, 149, 238–247. [Google Scholar] [CrossRef]
- Ren, S.; Li, X.; Yuan, B.; Li, D.; Chen, X. The effects of three types of environmental regulation on eco-efficiency: A cross-region analysis in China. J. Clean. Prod. 2018, 173, 245–255. [Google Scholar] [CrossRef]
- Wang, Y.; Shen, N. Environmental regulation and environmental productivity: The case of China. Renew. Sustain. Energy Rev. 2016, 62, 758–766. [Google Scholar] [CrossRef]
- Zhang, J.S.; Tan, W. Study on the green total factor productivity in main cities of China. Zb. Rad. Ekon. Fak. Rij. 2016, 34, 215–234. [Google Scholar]
- Li, B.; Wu, S.S. Effects of local and civil environmental regulation on green total factor productivity in China: A spatial Durbin econometric analysis. J. Clean. Prod. 2016, 1, 342–353. [Google Scholar] [CrossRef]
- Telle, K.; Larsson, J. Do environmental regulations hamper productivity growth? How accounting for improvements of plants’ environmental performance can change the conclusion. Ecol. Econ. 2007, 2, 438–445. [Google Scholar] [CrossRef]
- Ploeg, R.V.D.; Withagen, C. Green growth, green paradox and the global economic crisis. Environ. Innov. Soc. Trans. 2013, 6, 116–119. [Google Scholar] [CrossRef]
- Nielsen, M.; Ravensbeck, L.; Nielsen, R. Green growth in fisheries. Mar. Policy 2014, 46, 43–52. [Google Scholar] [CrossRef]
- Tellis, G.J.; Eisingerich, A.B.; Chandy, R.K.; Prabhu, J.C. Competing for the Future: Patterns in the Global Location of R&D Centers by the World’s Largest Firms; ISBM Report; The Pennsylvania State University: State College, PA, USA, 2008. [Google Scholar]
- Padilla-Pérez, R.; Gaudin, Y. Science, technology and innovation policies in small and developing economies: The case of Central America. Res. Policy 2014, 43, 749–759. [Google Scholar] [CrossRef]
- Popp, D. Induced Innovation and Energy Prices. Am. Econ. Rev. 2002, 1, 160–180. [Google Scholar] [CrossRef]
- Acemoglu, D.; Aghion, P.; Bursztyn, L.; Hemous, D. The Environment and Directed Technical Change. Semin. Pap. 2010, 102, 131. [Google Scholar] [CrossRef]
- Wang, H.L.; Lian, X.Y.; Lin, D.M. Empirical analysis on the impact of green technological innovation efficiency on regional green growth performance. Sci. Sci. Manag. S. T. 2016, 6, 80–87. (In Chinese) [Google Scholar]
- Rauscher, M. Green R&D versus end-of-pipe emission abatement: A model of directed technical change. Th.-Ser. Appl. Econ. Theory 2009, 106, 1–18. [Google Scholar]
- Moser Email, E.; Prskawetz, A.; Tragler, G. Environmental Regulations, Abatement and Economic Growth. Dyn. Model. Econ. Econ. Financ. 2013, 14, 1–24. [Google Scholar]
- Zhou, J.M.; Zhao, Y.Z.; Xiao, G.R.; Wu, C.Y. Research on the mechanism of the influence of guiding technology innovation on green growth under pollution control. Sci. Res. Manag. 2017, 3, 38–51. (In Chinese) [Google Scholar]
- Chan, H.K.; Yee, R.W.Y.; Dai, J.; Lim, M.K. The moderating effect of environmental dynamism on green product innovation and performance. Int. J. Prod. Econ. 2016, 181, 384–391. [Google Scholar] [CrossRef]
- Zhao, X.; Sun, B. The influence of Chinese environmental regulation on corporation innovation and competitiveness. J. Clean. Prod. 2016, 112, 1528–1536. [Google Scholar] [CrossRef]
- Guo, L.; Qu, Y.; Tseng, M.L. The interaction effects of environmental regulation and technological innovation on regional green growth performance. J. Clean. Prod. 2017, 162, 894–902. [Google Scholar] [CrossRef]
- Weng, H.H.; Chen, J.S.; Chen, P.C. Effects of Green Innovation on Environmental and Corporate Performance: A Stakeholder Perspective. Sustainability 2015, 7, 4997–5026. [Google Scholar] [CrossRef]
- Kunapatarawong, R.; Martínez-Ros, E. Towards green growth: How does green innovation affect employment? Res. Policy 2016, 6, 1218–1232. [Google Scholar] [CrossRef]
- Magat, W.A. Pollution control and technological advance: A dynamics model of the firm. J. Environ. Econ. Manag. 1978, 5, 1–25. [Google Scholar] [CrossRef]
- The Organisation for Economic Co-operation and Development (OECD). Towards Green Growth: Monitoring Progress; OECD: Paris, France, 2011. [Google Scholar]
- Rennings, K. Redefining innovation–eco-innovation research and the contribution from ecological economics. Ecol. Econ. 2000, 32, 319–332. [Google Scholar] [CrossRef]
- Hamamoto, M. Environmental regulation and the productivity of Japanese manufacturing industries. Resour. Energy Econ. 2006, 28, 299–312. [Google Scholar] [CrossRef]
- Porter, M.E.; Linde, C.V.D. Towards a new conception of the environment–competitiveness relationship. J. Econ. Perspect. 1995, 9, 97–118. [Google Scholar] [CrossRef]
- Le Sage, J.P.; Pace, R.K. Introduction to Spatial Econometrics; CRC Press: Boca Raton, FL, USA, 2009; pp. 20–44. [Google Scholar]
- Elhorst, J.P. Applied spatial econometrics: Raising the bar Spat. Econ. Anal. 2010, 5, 9–28. [Google Scholar] [CrossRef]
- Liu, Y.; Xiao, H.; Zikhali, P.; Lv, Y. Carbon Emissions in China: A Spatial Econometric Analysis at the Regional Level. Sustainability 2014, 6, 6005–6023. [Google Scholar] [CrossRef]
- Liu, Y.; Xiao, H.; Zhang, N. Industrial Carbon Emissions of China’s Regions: A Spatial Econometric Analysis. Sustainability 2016, 8, 210. [Google Scholar] [CrossRef]
- Li, J.; Tan, Q.M.; Bai, J.H. Spatial econometric Analysis of regional innovation production in China: An empirical study based on static and dynamic space panel model. Manag. World 2010, 7, 43–55. (In Chinese) [Google Scholar]
- Zhang, C.J.; Zhang, Z.Y. Spatial econometric analysis of the factors affecting the upgrading of industrial structure in China. Stat. Res. 2015, 10, 32–37. (In Chinese) [Google Scholar]
- Wang, P.; You, J.H. Evaluation of environmental regulation effect in China: A spatial perspective based on industrial green development. Comp. Econ. Soc. Syst. 2016, 5, 25–42. (In Chinese) [Google Scholar]
- Gao, L.C.; Xu, F. A probe into the theory of systematics interduality: A theoretical framework. Syst. Eng. Theory Pract. 2007, 5, 95–96. (In Chinese) [Google Scholar]
- Chung, Y.H.; Färe, R.; Grosskopf, S. Productivity and undesirable outputs: A directional distance function approach. J. Environ. Manag. 1997, 51, 229–340. [Google Scholar] [CrossRef]
- Chang, C.H. The Influence of Corporate Environmental Ethics on Competitive Advantage: The Mediation Role of Green Innovation. J. Bus. Ethics 2011, 104, 361–370. [Google Scholar] [CrossRef]
- Lin, H.; Zeng, S.X.; Ma, H.Y.; Qi, G.Y.; Tam, V.W. Can political capital drive corporate green innovation? Lessons from China. J. Clean. Prod. 2014, 64, 63–72. [Google Scholar] [CrossRef]
- Rennings, K.; Rammer, C. The impact of regulation-driven environmental innovation on innovation success and firm performance. Ind. Innov. 2011, 18, 255–283. [Google Scholar] [CrossRef]
- Triguero, A.; Moreno-Mondéjar, L.; Davia, M.A. Drivers of different types of eco-innovation in European SMEs. Ecol. Econ. 2013, 92, 2–33. [Google Scholar] [CrossRef]
- Li, W.H.; Bi, K.X.; Sun, B. Influence of environmental regulation intensity on green technology innovation in pollution-intensive industry: Empirical test based on 2003–2010 panel data. Res. Dev. Manag. 2013, 6, 72–81. (In Chinese) [Google Scholar]
- Wang, F.Z.; Guo, X.C. Government governance, environmental regulation and green process innovation. J. Financ. Econ. 2016, 9, 30–40. (In Chinese) [Google Scholar]
- Zhang, Y.; Zheng, H.M.; Yang, Z.F. Urban energy flow processes in the Beijing–Tianjin–Hebei (Jing-Jin-Ji) urban agglomeration: Combining multi-regional input–output tables with ecological. J. Clean. Prod. 2016, 114, 243–256. [Google Scholar] [CrossRef]
- Xie, R.H. Environmental Regulation Leads to Innovation and Industrial Green Productivity Boosting in China. Ind. Econ. Res. 2017, 2, 38–48. (In Chinese) [Google Scholar]
- Wang, F.Z.; Jiang, T. Impact of Environmental Regulation on Green Technological Innovation in Resource-based Industries: From the Perspective of Industry Heterogeneity. Res. Financ. Econ. Issues 2015, 8, 17–23. (In Chinese) [Google Scholar]
Figure 1.
The theoretical model of hypotheses.
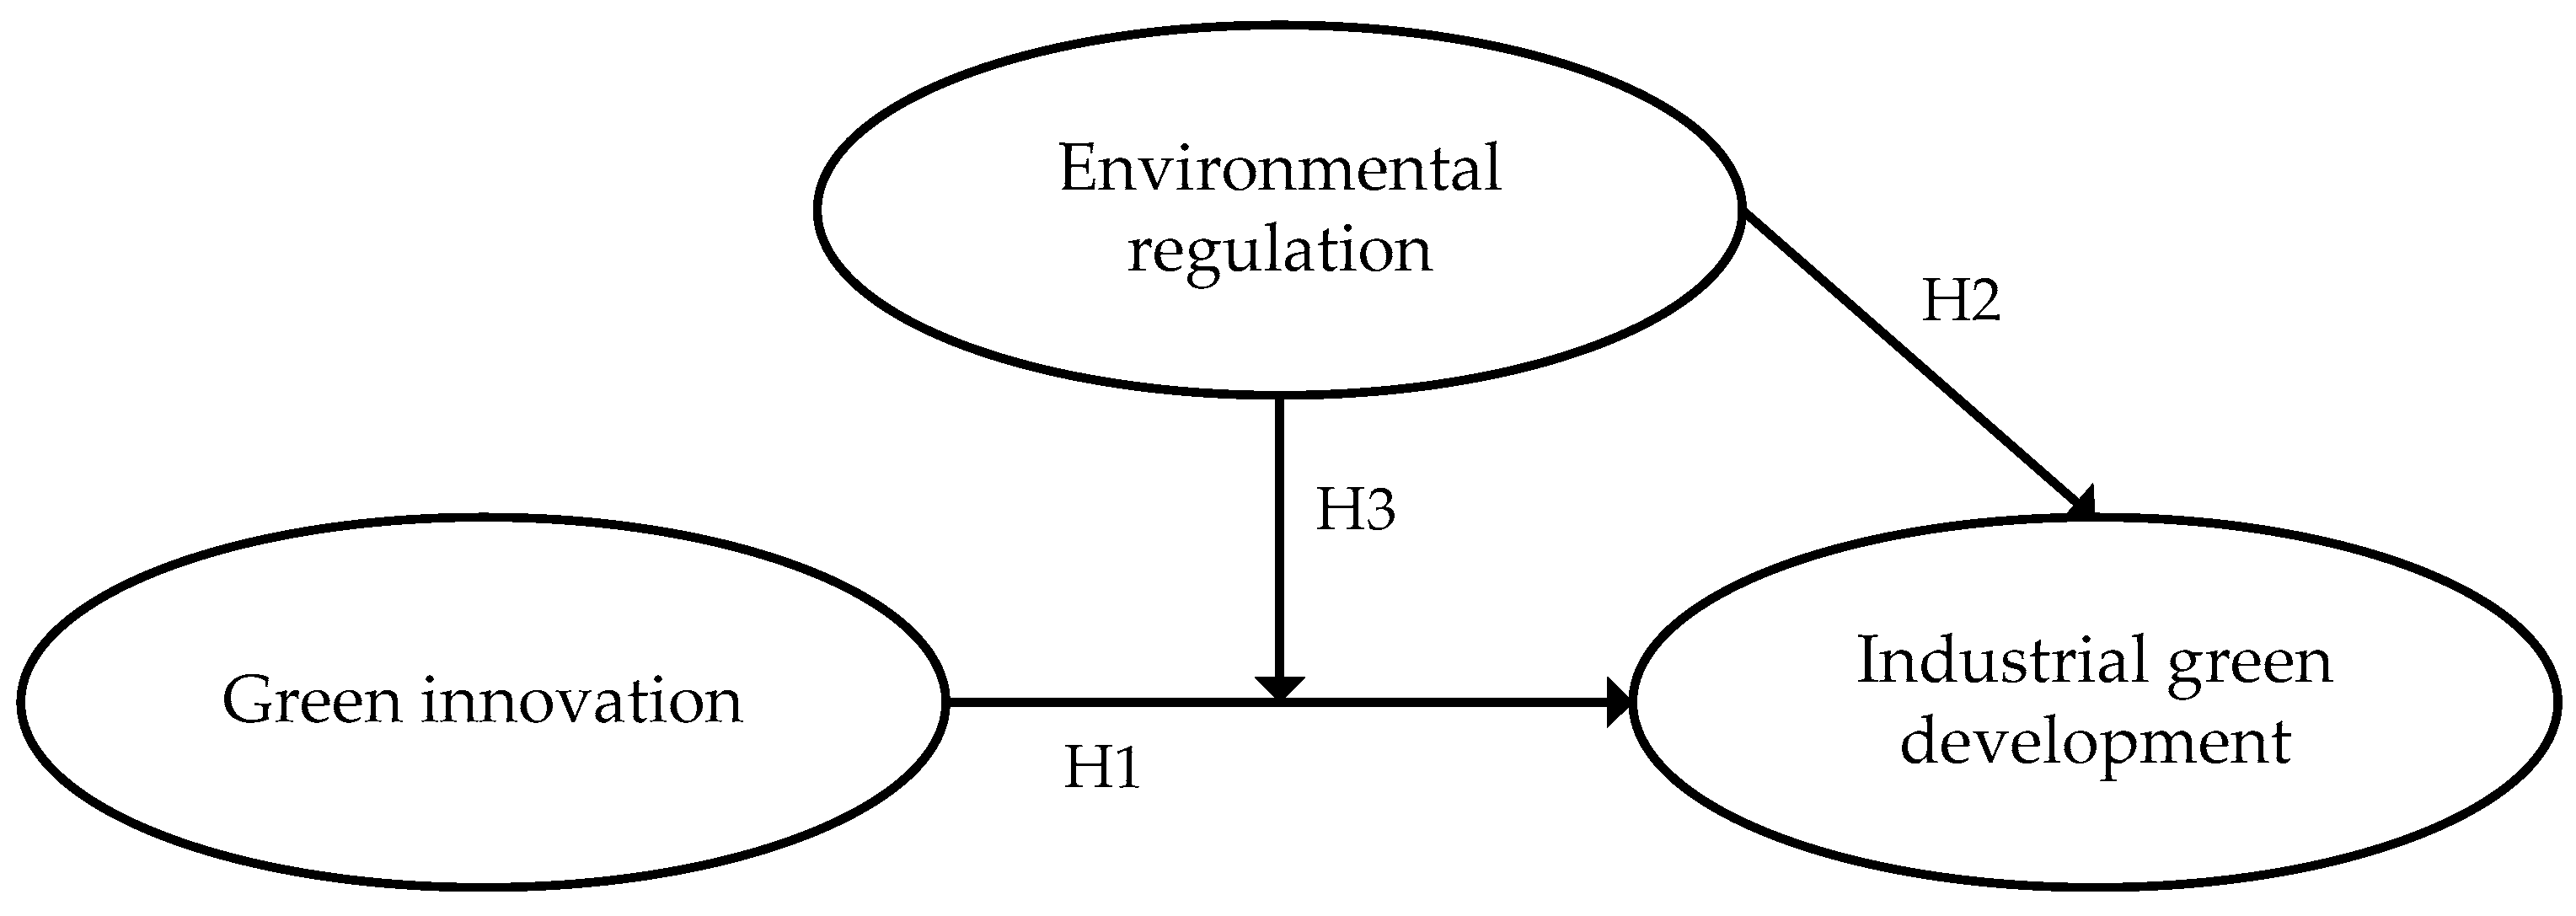
Figure 2.
Spatial distribution of regional industrial green development performance based on duality.
Figure 2.
Spatial distribution of regional industrial green development performance based on duality.


Table 1.
Input–output factors definitions and descriptive statistics.
| Indicator | Definition | Unit | Mean | S.D. | Minimum | Maximum | |
|---|---|---|---|---|---|---|---|
| Inputs | Labor input | Average employees of industrial enterprises | 104 persons | 308.379 | 333.720 | 11.640 | 1568 |
| Staff number in environmental protection system | Person | 6590.044 | 4851.190 | 804 | 27,017 | ||
| Capital input | Net investment in fixed assets of industrial enterprises | 100 million RMB | 7873.923 | 6480.671 | 515.75 | 36,500.51 | |
| Total investment in environmental pollution control | 100 million RMB | 210.138 | 184.126 | 10.600 | 1416.2 | ||
| Outputs | Economic growth | Total industrial output value | 100 million RMB | 26,706.864 | 29,626.447 | 822.720 | 149,277.471 |
| Energy efficiency | Comprehensive energy consumption output rate | 104 RMB/ton | 1.218 | 0.534 | 0.289 | 3.358 | |
| Environmental benefits | Industrial wastewater discharge | 104 tons | 75,068.504 | 62,950.896 | 5782 | 268,762 | |
| Industrial waste gas emission | 104 tons | 18,908.707 | 14,476.019 | 1115 | 79,121 | ||
| Industrial solid wastes. | 104 tons | 9040.804 | 8172.936 | 158 | 45,576 |
Note: (1) The data of the indicator obtained from the China statistical yearbook, China labor statistical yearbook, and China environmental statistical yearbook and China energy statistical yearbook. (2) The indicators of the green development benefit (GDB) are all composed of the five output indicators of industrial green development.
Table 2.
Descriptive statistics of variables.
| Variable | Unit | Mean | S.D. | Minimum | Maximum | Explanation and Data Sources |
|---|---|---|---|---|---|---|
| IGDP | 0.456 | 0.110 | 0.193 | 0.871 | ||
| AER | % | 0.335 | 0.254 | 0.022 | 1.909 | Total environmental investment of the “three simultaneous” projects/total industrial output value a,b |
| MER | % | 0.037 | 0.036 | 0.002 | 0.355 | Sewage fee income/total industrial output value a,b |
| PER | Seal/100 persons | 0.025 | 0.037 | 0.000 | 0.216 | Total number of letters of civil environment petition/population a,c |
| GPI | Ton/104 yuan | 19.022 | 47.384 | 1.041 | 466.001 | Energy consumption/new product sales revenue d,e |
| GCI | % | 0.625 | 0.750 | 0.062 | 3.478 | Investment in technical transformation/total industrial output value e,b |
| PRO | % | 36.996 | 17.820 | 9.980 | 80.185 | Proportion of state-owned and state holding industrial enterprises in total industrial output value b |
| SE | 100 million/enterprise | 2.508 | 1.119 | 0.684 | 5.086 | Total industrial output value/number of industrial enterprises b |
| TRA | % | 31.616 | 38.192 | 2.959 | 176.458 | Total export-import volume/GDP c |
| CI | 104 yuan/person | 36.255 | 21.714 | 9.567 | 139.883 | Industrial net fixed assets/employment number b |
| FDI | % | 1.841 | 2.415 | 0.068 | 8.191 | FDI/GDP c |
Note: (1) The data come from the statistical yearbook of the past years; abbreviations are as follows: a: China environmental yearbook; b: China industrial (economy) statistics yearbook; c: China statistical yearbook; d: China energy statistics yearbook; e: China science and technology statistics yearbook. (2) According to producer price index for industrial producers (PPI), the variables involving prices are all converted to the price level of the base period in 2007. Among them, the total export-import volume and foreign direct investment (FDI) data are respectively translated at the average annual exchange rate of the year.
Table 3.
Evaluation results of industrial green development performance in 30 provinces (2007–2015).
Table 3.
Evaluation results of industrial green development performance in 30 provinces (2007–2015).
| 2007 | 2008 | 2009 | 2010 | 2011 | 2012 | 2013 | 2014 | 2015 | Mean | ||
|---|---|---|---|---|---|---|---|---|---|---|---|
| Value | Ranking | ||||||||||
| Beijing | 0.496 | 0.546 | 0.451 | 0.604 | 0.606 | 0.613 | 0.595 | 0.543 | 0.663 | 0.569 | 4 |
| Tianjin | 0.450 | 0.511 | 0.396 | 0.537 | 0.575 | 0.545 | 0.573 | 0.471 | 0.634 | 0.521 | 5 |
| Hebei | 0.318 | 0.380 | 0.312 | 0.403 | 0.365 | 0.328 | 0.339 | 0.344 | 0.349 | 0.349 | 30 |
| Liaoning | 0.365 | 0.412 | 0.397 | 0.516 | 0.507 | 0.493 | 0.478 | 0.452 | 0.307 | 0.436 | 19 |
| Shanghai | 0.474 | 0.508 | 0.434 | 0.605 | 0.558 | 0.546 | 0.503 | 0.498 | 0.526 | 0.517 | 6 |
| Jiangsu | 0.344 | 0.428 | 0.470 | 0.562 | 0.630 | 0.687 | 0.756 | 0.763 | 0.798 | 0.604 | 2 |
| Zhejiang | 0.370 | 0.395 | 0.383 | 0.483 | 0.617 | 0.529 | 0.588 | 0.578 | 0.567 | 0.501 | 7 |
| Fujian | 0.365 | 0.379 | 0.343 | 0.447 | 0.520 | 0.470 | 0.507 | 0.511 | 0.544 | 0.454 | 13 |
| Shandong | 0.397 | 0.469 | 0.460 | 0.532 | 0.642 | 0.657 | 0.733 | 0.726 | 0.776 | 0.599 | 3 |
| Guangdong | 0.387 | 0.503 | 0.441 | 0.552 | 0.673 | 0.725 | 0.815 | 0.777 | 0.819 | 0.632 | 1 |
| Hainan | 0.454 | 0.193 | 0.871 | 0.497 | 0.389 | 0.400 | 0.440 | 0.544 | 0.433 | 0.469 | 8 |
| Eastern mean | 0.402 | 0.429 | 0.451 | 0.522 | 0.553 | 0.545 | 0.575 | 0.564 | 0.583 | 0.514 | |
| Shanxi | 0.366 | 0.412 | 0.300 | 0.444 | 0.437 | 0.331 | 0.302 | 0.290 | 0.263 | 0.349 | 29 |
| Jilin | 0.408 | 0.410 | 0.413 | 0.449 | 0.603 | 0.500 | 0.500 | 0.491 | 0.446 | 0.469 | 9 |
| Heilongjiang | 0.403 | 0.375 | 0.346 | 0.484 | 0.569 | 0.423 | 0.449 | 0.413 | 0.378 | 0.427 | 20 |
| Anhui | 0.388 | 0.388 | 0.391 | 0.498 | 0.560 | 0.442 | 0.471 | 0.490 | 0.477 | 0.456 | 12 |
| Jiangxi | 0.398 | 0.376 | 0.349 | 0.482 | 0.520 | 0.463 | 0.477 | 0.486 | 0.449 | 0.444 | 16 |
| Henan | 0.353 | 0.429 | 0.351 | 0.452 | 0.542 | 0.410 | 0.489 | 0.540 | 0.595 | 0.462 | 11 |
| Hubei | 0.364 | 0.385 | 0.302 | 0.527 | 0.574 | 0.478 | 0.542 | 0.499 | 0.534 | 0.467 | 10 |
| Hunan | 0.356 | 0.396 | 0.340 | 0.458 | 0.586 | 0.401 | 0.502 | 0.494 | 0.506 | 0.449 | 15 |
| Central mean | 0.379 | 0.396 | 0.349 | 0.474 | 0.549 | 0.431 | 0.467 | 0.463 | 0.456 | 0.440 | |
| Neimenggu | 0.386 | 0.491 | 0.424 | 0.413 | 0.518 | 0.378 | 0.415 | 0.343 | 0.338 | 0.412 | 22 |
| Guangxi | 0.284 | 0.247 | 0.279 | 0.369 | 0.520 | 0.428 | 0.457 | 0.458 | 0.471 | 0.390 | 26 |
| Chongqing | 0.367 | 0.390 | 0.354 | 0.410 | 0.583 | 0.420 | 0.453 | 0.480 | 0.476 | 0.437 | 18 |
| Sichuan | 0.337 | 0.390 | 0.409 | 0.515 | 0.503 | 0.330 | 0.486 | 0.450 | 0.561 | 0.442 | 17 |
| Guizhou | 0.389 | 0.454 | 0.384 | 0.341 | 0.349 | 0.356 | 0.388 | 0.382 | 0.399 | 0.382 | 27 |
| Yunnan | 0.393 | 0.343 | 0.296 | 0.430 | 0.494 | 0.392 | 0.402 | 0.401 | 0.385 | 0.393 | 25 |
| Shaanxi | 0.397 | 0.434 | 0.371 | 0.477 | 0.557 | 0.429 | 0.475 | 0.438 | 0.472 | 0.450 | 14 |
| Gansu | 0.400 | 0.431 | 0.291 | 0.442 | 0.661 | 0.363 | 0.433 | 0.361 | 0.350 | 0.415 | 21 |
| Qinghai | 0.392 | 0.336 | 0.462 | 0.366 | 0.479 | 0.370 | 0.347 | 0.363 | 0.326 | 0.382 | 28 |
| Ningxia | 0.373 | 0.444 | 0.335 | 0.427 | 0.500 | 0.446 | 0.405 | 0.361 | 0.360 | 0.406 | 23 |
| Xinjiang | 0.396 | 0.433 | 0.324 | 0.487 | 0.515 | 0.389 | 0.385 | 0.353 | 0.309 | 0.399 | 24 |
| Western mean | 0.374 | 0.399 | 0.357 | 0.425 | 0.516 | 0.391 | 0.422 | 0.399 | 0.404 | 0.410 | |
| National mean | 0.386 | 0.410 | 0.389 | 0.474 | 0.538 | 0.458 | 0.490 | 0.477 | 0.484 | 0.456 | |
Table 4.
The results of the spatial Durbin model (SDM) at the national sample.
| Variable | Model (2) | Model (3) | ||||||||
|---|---|---|---|---|---|---|---|---|---|---|
| Individual Random Effect | Individual Fixed Effect | Direct Effect | Indirect Effect | Total Effect | Individual Random Effect | Individual Fixed Effect | Direct Effect | Indirect Effect | Total Effect | |
| Constant term | 0.3727 *** (5.728) | 0.4010 *** (6.185) | ||||||||
| AER | −0.0559 * (−2.330) | −0.0480 * (−2.115) | −0.0451 (−1.787) | 0.0394 (0.331) | −0.0057 (−0.043) | −0.0559 * (−2.387) | −0.0460 * (−2.080) | −0.0442 (−1.797) | 0.0191 (0.170) | −0.0251 (−0.200) |
| MER | 0.1585 (0.722) | 0.4251 * (1.966) | 0.3101 (1.469) | −2.1764 ** (−2.726) | −1.8662 * (−2.191) | 0.3164 (1.375) | 0.6097 ** (2.671) | 0.5219 * (2.315) | −1.6674 * (−2.090) | −1.1455 (−1.317) |
| PER | −0.0109 (−0.067) | −0.1010 (−0.648) | −0.0898 (−0.582) | −0.0538 (−0.552) | −0.1436 (−0.579) | −0.0029 (−0.018) | −0.0802 (−0.522) | −0.0684 (−0.451) | −0.0383 (−0.433) | −0.1067 (−0.450) |
| GPI/GCI | −0.0001 (−0.540) | −0.0001 (−0.968) | −0.0002 (−1.021) | −0.0001 (−0.948) | −0.0002 (−1.011) | −0.0277 * (−2.217) | −0.0327 * (−2.538) | −0.0336 ** (−2.616) | −0.0186 * (−2.004) | −0.0522 * (−2.517) |
| PRO | −0.0002 (−0.306) | −0.0003 (−0.292) | −0.0003 (−0.285) | −0.0002 (−0.268) | −0.0005 (−0.281) | 0.0000 (0.038) | 0.0005 (0.460) | 0.0005 (0.489) | 0.0003 (0.462) | 0.0008 (0.485) |
| SE | 0.0305 *** (3.501) | 0.0233 * (2.505) | 0.0249 ** (2.623) | 0.0144 * (2.194) | 0.0393 ** (2.635) | 0.0262 ** (2.994) | 0.0198 * (2.165) | 0.0212 * (2.262) | 0.0114 * (2.001) | 0.0325 * (2.300) |
| TRA | 0.0006 * (1.970) | −0.0011 * (−2.200) | −0.0011 * (−2.076) | −0.0006 (−1.664) | −0.0017 * (−1.995) | 0.0006 * (1.990) | −0.0010 * (−2.105) | −0.0010 * (−1.984) | −0.0006 (−1.590) | −0.0016 * (−1.910) |
| CI | −0.0021 *** (−4.231) | −0.0027 *** (−5.192) | −0.0028 *** (−5.466) | −0.0016 ** (−2.877) | −0.0044 *** (−4.843) | −0.0023 *** (−4.724) | −0.0026 *** (−5.100) | −0.0027 *** (−5.369) | −0.0015 ** (−2.813) | −0.0042 *** (−4.792) |
| FDI | −0.0131* (−2.389) | −0.0235 *** (−3.319) | −0.0237 *** (−3.348) | −0.0140 * (−2.271) | −0.0377 ** (−3.087) | −0.0141 ** (−2.581) | −0.0256 *** (−3.627) | −0.0258 *** (−3.662) | −0.0142 * (−2.369) | −0.0400 *** (−3.368) |
| 0.3590 *** | 0.3807 *** | 0.3471 *** | 0.3634 *** | |||||||
| R2 | 0.3730 | 0.3849 | 0.3821 | 0.4018 | ||||||
| LogL | 311.4915 | 305.4160 | 313.7898 | 306.2963 | ||||||
| Hausman test | 35.3335 *** | 27.6167 *** | ||||||||
Note: ***, ** or * denotes significance at the level of 1%, 5% or 10%, respectively.
Table 5.
The direct, indirect and total effects of sub-regional sample.
| Variable | Eastern Region | Central Region | Western Region | ||||||
|---|---|---|---|---|---|---|---|---|---|
| Direct Effect | Indirect Effect | Total Effect | Direct Effect | Indirect Effect | Total Effect | Direct Effect | Indirect Effect | Total Effect | |
| AER | −0.1284 * (−0.1506 *) | −0.0599 (−0.0595) | −0.1883 * (−0.2101 *) | −0.0277 (−0.0359) | 0.0089 (0.0079) | −0.0188 (−0.0279) | −0.0447 (−0.0346) | −0.0625 (−0.0351) | −0.1071 (−0.0697) |
| MER | 1.2624 (7.7025 **) | −2.4322 (−8.7930 *) | −1.1699 (−1.0905) | −0.1361 (−0.2676) | −0.9914 (−1.1650) | −1.1275 (−1.4327) | 0.1674 (0.2280) | −0.5482 (−0.6127) | −0.3808 (−0.3847) |
| PER | 1.0484 *** (0.6385 *) | −0.3248 * (−0.1572) | 0.7237 ** (0.4813 *) | −0.1574 (−0.3703) | −0.0745 (−0.1772) | −0.2319 (−0.5475) | −0.1214 (−0.1138) | −0.0648 (−0.0594) | −0.1862 (−0.1732) |
| GPI /GCI | −0.0119 *** (−0.1447 **) | −0.0037 ** (0.0344) | 0.0156 *** (−0.1103 *) | −0.0027 (−0.0169) | −0.0017 (−0.0094) | −0.0044 (−0.0263) | −0.0001 (−0.0090) | −0.0000 (−0.0042) | −0.0001 (−0.0132) |
| PRO | −0.0022 (−0.0042) | 0.0007 (0.0011) | −0.0015 (−0.0032) | −0.0029 ** (−0.0033 ***) | −0.0018 * (−0.0019 *) | −0.0047 * (−0.0052 **) | 0.0008* (0.0007) | 0.0004 (0.0003) | 0.0012 * (0.0011) |
| SE | −0.0210 (−0.0288) | 0.0067 (0.0073) | −0.0143 (−0.0215) | 0.0180 (0.0106) | 0.0123 (0.0076) | 0.0303 (0.0182) | 0.0383 *** (0.0353 ***) | 0.0177 * (0.0157 *) | 0.0560 *** (0.0510 ***) |
| TRA | −0.0005 (−0.0006) | 0.0002 (0.0001) | −0.0004 (−0.0004) | 0.0090 * (0.0099 **) | 0.0054 * (0.0055 *) | 0.0144 * (0.0154 **) | 0.0011 (0.0011) | 0.0005 (0.0005) | 0.0017 (0.0017) |
| CI | −0.0040 * (−0.0049 *) | 0.0012 (0.0012) | −0.0028 * (−0.0037 *) | −0.0044 * (−0.0051 **) | −0.0029 (−0.0030) | −0.0073 * (−0.0081 *) | −0.0011 ** (−0.0014 ***) | −0.0005 (−0.0006 *) | −0.0016 * (−0.0020 ***) |
| FDI | −0.0150 (−0.0520 ***) | 0.0048 (0.0128) | −0.0102 (−0.0392 ***) | −0.0486 * (−0.0501) | −0.0295 * (−0.0275) | −0.0782 * (−0.0776) | 0.0194 * (0.0173) | 0.0092 (0.0080) | 0.0286 * (0.0253) |
Note: (1) The values of parentheses outside and in parentheses respectively correspond direct, indirect and total effects of green product innovation (GPI) and green craft innovation (GCI) act on industrial green development performance (IGDP). (2) ***, ** or * denotes significance at the level of 1%, 5% or 10%, respectively.
Table 6.
Estimated results after adding interaction items.
| Variable | Model (2) | Model (3) | ||||
|---|---|---|---|---|---|---|
| Direct Effect | Indirect Effect | Total Effect | Direct Effect | Indirect Effect | Total Effect | |
| AER | −0.0458 (−1.360) | −0.0005 (−0.004) | −0.0463 (−0.342) | −0.0343 (−0.915) | −0.0238 (−0.325) | −0.0581 (−0.657) |
| MER | −0.8467 * (−2.002) | −2.0771 ** (−2.960) | −2.9237 ** (−3.287) | −1.9752 *** (−4.734) | −0.2541 (−0.407) | −2.2293 ** (−3.004) |
| PER | −0.0337 (−0.189) | −0.0152 (−0.155) | −0.0489 (−0.179) | −0.2357 (−0.829) | −0.0013 (−0.034) | −0.2370 (−0.823) |
| GPI/GCI | −0.0009 * (−2.067) | −0.0005 (−1.655) | −0.0014 * (−2.005) | −0.0684 *** (−3.613) | −0.0006 (−0.079) | −0.0690 *** (−3.457) |
| AER*GPI/AER*GCI | −0.0003 (−0.302) | −0.0001 (−0.294) | −0.0004 (−0.303) | 0.0115 (0.331) | 0.0001 (0.031) | 0.0116 (0.331) |
| MER*GPI/MER*GCI | 0.0294 * (2.428) | 0.0148 (1.872) | 0.0443 * (2.351) | 0.9481 *** (4.571) | 0.0075 (0.075) | 0.9556 *** (4.331) |
| PER*GPI/PER*GCI | 0.0034 (0.311) | 0.0015 (−0.264) | 0.0049 (0.299) | −0.0146 (−0.066) | −0.0005 (−0.020) | −0.0151 (−0.066) |
| 0.3413 *** | 0.3582 *** | |||||
| R2 | 0.4295 | 0.4543 | ||||
| LogL | 314.4341 | 317.2567 | ||||
Note: (1) Due to limited length, only partial results of the model are listed. (2) ***, ** or * denotes significance at the level of 1%, 5% or 10%, respectively.
© 2018 by the authors. Licensee MDPI, Basel, Switzerland. This article is an open access article distributed under the terms and conditions of the Creative Commons Attribution (CC BY) license (http://creativecommons.org/licenses/by/4.0/).
Share and Cite
MDPI and ACS Style
Feng, Z.; Chen, W. Environmental Regulation, Green Innovation, and Industrial Green Development: An Empirical Analysis Based on the Spatial Durbin Model. Sustainability 2018, 10, 223. https://0-doi-org.brum.beds.ac.uk/10.3390/su10010223
AMA Style
Feng Z, Chen W. Environmental Regulation, Green Innovation, and Industrial Green Development: An Empirical Analysis Based on the Spatial Durbin Model. Sustainability. 2018; 10(1):223. https://0-doi-org.brum.beds.ac.uk/10.3390/su10010223
Chicago/Turabian StyleFeng, Zhijun, and Wei Chen. 2018. "Environmental Regulation, Green Innovation, and Industrial Green Development: An Empirical Analysis Based on the Spatial Durbin Model" Sustainability 10, no. 1: 223. https://0-doi-org.brum.beds.ac.uk/10.3390/su10010223
Note that from the first issue of 2016, this journal uses article numbers instead of page numbers. See further details here.