Plant-Based Lunch at Work: Effects on Nutrient Intake, Environmental Impact and Tastiness—A Case Study


Centre for Nutrition, Prevention and Health Services, National Institute for Public Health and the Environment (RIVM), Antonie van Leeuwenhoeklaan 9, 3721 MA Bilthoven, P.O. Box 1, 3720 BA Bilthoven, The Netherlands
*
Author to whom correspondence should be addressed.
Sustainability 2018, 10(1), 227; https://0-doi-org.brum.beds.ac.uk/10.3390/su10010227
Submission received: 13 December 2017
/
Revised: 12 January 2018
/
Accepted: 15 January 2018
/
Published: 17 January 2018
(This article belongs to the Special Issue Sustainable Action in Consumption and Production)
Abstract
:The aim of this study was to determine the environmental impact, nutrient intake, appreciation and tastiness of three buffet-style lunches served at the workplace, consisting of (1) animal-based foods; (2) plant-based foods; and (3) both animal-based and plant-based foods. Employees of the National Institute for Public Health and the Environment in the Netherlands participated in the study. Participants scored the lunch for appreciation and tastiness (scores from 1 to 10). Greenhouse gas (GHG) emissions and land use associated with foods consumed were calculated using life cycle assessments. Nutrient intake was calculated using food composition data. The results show that both the plant-based and the combination lunch received higher scores for tastiness than the animal-based lunch. GHG emissions and land use were lowest for the plant-based lunch and highest for the animal-based lunch. The combination lunch was associated with increased fiber and decreased saturated fat intake compared to the animal-based lunch, but also lead to increased energy intake. The plant-based lunch did not increase energy intake, while increasing fiber intake and decreasing sodium (salt) and saturated fat intakes. These initial results show that plant-based lunches have the potential to improve nutrient intake and tastiness while reducing environmental impact. Additional research in this field is worthwhile.
1. Introduction
Food consumption is estimated to be responsible for 20–30% of the environmental impact of total human consumption (including goods and services) [1]. The agricultural sector is responsible for up to 30% of global greenhouse gas (GHG) emissions [2]. Technological mitigation approaches can lower the environmental impact of food production, but dietary changes are needed as well to establish a sustainable food system [2].
Many studies have shown that reducing meat consumption will result in lower dietary GHG emissions [2,3,4,5,6,7,8]. Replacing meat with plant-based alternatives is an often-used strategy to successfully reduce dietary GHG emissions [5,6,7], and vegan diets seem to be associated with the lowest GHG emissions [3]. However, when meat is replaced iso-calorically by fruit and vegetables, reductions in GHG emissions may not be achieved [9].
Studies on the perceptions of consumers of replacing animal-based foods with plant-based alternatives for reasons of sustainability are scarce. Tobler et al. report that consumers do generally not see reducing meat consumption as environmentally beneficial: out of six options, limiting meat consumption was rated as the least environmentally beneficial in their study [10]. On the other hand, a study from the Netherlands has shown that one of the important reasons for meat eaters to limit meat consumption would be that it is better for the environment [11]. Sijtsema et al. report that in the Netherlands willingness to adopt a vegetarian diet, or to replace meat with meat substitutes more often, is low [12]. A study by Schösler et al. reports that in the Netherlands, when meat is substituted in a meal, it is most often replaced by other animal-based foods such as fish, egg and cheese and less often by plant-based foods such as tofu or nuts [13]. The authors suggest that replacing meat with less well-known plant-based alternatives in convenience food (which require no further preparation by consumers) might be a successful pathway to increase their consumption.
Changing the choice architecture (the foods available and the way they are presented) in settings such as schools, canteens, workplaces, hospitals, or grocery stores, is a possible mechanism to shift eating patterns and make food consumption more sustainable [14]. Changing the physical and social environment may be more cost-effective than person-directed interventions [15]. The Dutch National Food Consumption Survey 2012–2014 shows that 19% of food consumption (in grams) in the Netherlands of adults aged 19–50 years takes place at work (including foods brought from home) [16], making the workplace the most important out-of-home location for food consumption of this age group. In order to reduce environmental impact of food consumption, stimulating the consumption of plant-based foods at work is a promising strategy. Lunch would be the most promising meal for this, since in the Netherlands it is most common to have lunch at work and not breakfast or dinner. In addition, public procurement can shape production and consumption trends, having the potential to enlarge the market for environmentally friendly products, including foods [14]. The European Commission has underlined this potential by publishing the communication ‘Public procurement for a better environment’ [17].
At the National Institute for Public Health and the Environment, a government organization in the Netherlands, a regular lunch provided at lunch meetings consists primarily of animal-based foods: bread rolls with meat or cheese, and cow milk. Two alternative lunches were developed: one in which the animal-based foods were fully replaced by plant-based alternatives, and one in which both the animal-based foods and the plant-based foods were served. The aim of this study was to compare the environmental impact and nutrient content of these three lunches, as well as the appreciation and tastiness of these lunches as perceived by employees of the National Institute for Public Health and the Environment.
2. Materials and Methods
2.1. Study Setting and Participants
This study was conducted at the National Institute for Public Health and the Environment, located in Bilthoven, the Netherlands. All employees of three departments within the institute were invited by e-mail to attend three lunch lectures, where a lunch was provided at no cost. In this manuscript, the term “lunch” refers to the meal and the term “lunch lecture” is used for describing the event. The three departments included in this study were the Centre for Sustainability, Environment and Health (sustainability department), the Centre for Zoonoses and Environmental Microbiology (zoonoses department), and the Sector Public Health and Health Services (public health department). The lunch lectures took place between October 2014 and January 2015, as part of a regular cycle of lunch lectures organized for each individual department. Three lunch lectures were included for each department, adding up to a total of nine lunch lectures included in this study.
In the invitation, employees were informed that, during the lunch lecture, a study would take place regarding the lunch being served, and they were also informed that they would be asked to fill out a short questionnaire. The aim of the study was not explained in order to minimally influence the participants’ perception of the lunches being served. Employees were encouraged to attend all three lunch lectures, but were free to attend the number of lunch lectures they wanted. In total, 174 people participated in this study, of which 20 people attended all three lectures organized for their department.
2.2. Study Design
The three lunches differing in proportion of animal-based foods were developed in consultation with the catering company at the National Institute for Public Health and the Environment. All lunches were buffet-style meals, and study participants were free to choose between all foods offered as part of the buffet, as well as the amount of food consumed.
The first lunch was the standard lunch that is usually served at lunch meetings, which consists for an important part of animal-based foods: bread rolls with meat or cheese, and cow milk. An alternative lunch was developed in which the bread toppings were replaced with plant-based alternatives and cow milk was replaced by a soy drink and water. Other factors than the proportion of animal-based foods were kept constant: the type of bread used was the same for both lunches, as well as the number of different bread toppings and the other foods on offer, such as fruit. The third lunch was a combination of the standard lunch and plant-based alternative: all foods offered in the standard lunch and the plant-based lunch were included, making the number of foods to choose from in the third lunch higher (n = 12) than in the other two (n = 7).
Each lunch was served once during the three lunch lectures for each department, the order in which the lunches were served being the same for each department (with the standard animal-based lunch served at the first lunch lecture and the combination lunch served at the last lunch lecture).
Before the start of the lunch lectures, all participants received a printed questionnaire to be filled out during or immediately after the lunch lecture. Questionnaires were handed in by participants directly after the lunch lecture. The questionnaire consisted of questions on (1) Participant characteristics (8 items): Participants were asked to report their age and sex and the department where they worked. In addition, participants were asked to write down the telephone extension number of their workplace as a personal identification code, making it possible to link questionnaire data of the same participant for different lunch lectures. Participants were also asked to report their frequency of meat consumption and whether they ate anything within the two hours prior to the lunch lecture (if yes, participants were asked to fill out what they ate). Participants who wanted to be informed about the study results could fill-out their e-mail address; (2) Appreciation and tastiness of the lunch on offer as a whole (2 items): rated with scores from 1 to 10 with 1 meaning no appreciation/not tasty and 10 meaning high appreciation/very tasty; (3) Product choice: Participants were asked to fill out which foods they chose from the lunch buffet and the amount they chose of each food; (4) Appreciation and tastiness of individual food items chosen: For all foods chosen from the lunch buffet, participants were asked to rate appreciation and tastiness with scores from 1 to 10 with 1 meaning no appreciation/not tasty and 10 meaning high appreciation/very tasty. We included tastiness and appreciation as separate factors since participants might appreciate the various lunches for other reasons than taste (such as visual attractiveness, healthiness or environmental sustainability). In order not to direct the participants to think in a specific way, the interpretation of the term ‘appreciation’ was left to the participant, since reasons for appreciating a lunch may vary widely.
There was room for comments at the end of the questionnaire. There was no separate consent form that had to be signed by participants, as consent was implied by completion of the questionnaire.
2.3. Environmental Impact of Foods
To be able to determine the environmental impact of food consumed during the three lunches, life cycle assessments (LCAs) were performed by Blonk Consultants (dataset version 2014) using Agri-footprint [18]. GHG emission in kg CO2-equivalents and land use in m2*year were used as indicators of environmental impact. The functional unit was 1 kg prepared product at plate, and economic allocation was used. In the LCAs, the total amount of emissions and resources used were calculated throughout the whole life cycle of a food (i.e., cradle to plate assessment): from primary production, processing, use of packaging and transport to storage (including energy for cooling and freezing of products) and preparation of food. Life cycle inventory (LCI) data were collected from primary sources and literature and were representative for the Dutch situation. This means that LCI data were based on foods as they are commonly consumed in the Netherlands, and were not specific for the foods as served during the three lunches in this study. For example, energy use for the preparation of foods was based on average cooking times and energy sources as used by households in the Netherlands, and not on the exact energy use by the caterer. Similarly, LCI data for each food were based on a market mix (based on import and export data) representative for the Dutch situation, and not specifically on the country of origin of the foods as used by the caterer. Land use change was not included, which may result in lower estimations of GHG emissions compared to when land use change would have been included. This could especially be relevant for soy-based foods (vegetarian luncheon meat, soy drink) or animal-based foods, depending on whether land use change is included as direct or indirect land use change. Food waste was included by using food group specific percentages for avoidable and unavoidable food losses throughout the food chain. It was assumed that losses during cultivation were included in the yields, and food losses and food waste in other parts of the food chain were based on literature sources. Food waste in the consumer phase was based on food group-specific (e.g., vegetables, fruit, bread, dairy, meat, etc.) average food waste in Dutch households. It was not specific for out-of-home consumption nor corrected for the exact food waste at the three lunches included in this study. The time horizon for the calculations was 100 years. LCA data were available for 19 of the 23 foods included in the study. Extrapolations were made to the other four foods included in this study, based on similarities in type of food, production method, and ingredient composition. The environmental impact of food consumption during each lunch for each individual was calculated by multiplying the amount of each food chosen by the values for GHG emission and land use per kg of that food.
2.4. Nutrient Content of Food
To calculate energy (in kcal) and nutrient intake (for the nutrients carbohydrates, (saturated) fat, protein, fiber, calcium, sodium, zinc, retinol activity equivalents, vitamin B1 and vitamin C) during each lunch, data from the Dutch Food Composition Database (NEVO Table 2013/4.0) were used [19]. Data for one of the foods included in this study (tomato tapenade) were not available from the Dutch Food Composition Database, so data from another food with similar nutrient composition (dried tomatoes in oil, based on comparison with tomato tapenade label information) were used. The nutrient intake during each lunch for each individual was calculated by multiplying the amount of each food chosen by the nutrient content of that food (for the selected nutrients). The micro-nutrients (except vitamin C and sodium) for which intake levels are reported consist of a selection of nutrients for which either meat or dairy is the most important contributor in the Dutch diet [20]. Vitamin C was added because out of the nutrients for which vegetable consumption contributes to the intake, the contribution to vitamin C is largest [20]. Sodium was added as proxy for salt because the majority of the Dutch population exceeds recommended maximum intake levels for salt [21], so a reduction in salt intake is desirable.
2.5. Data Analysis
Results were reported for the three lunches separately. Differences in characteristics of the study population between the three lunches were assessed using one-way ANOVA for continuous variables and Chi-square test for categorical variables. Differences in appreciation and tastiness for the three lunches, as well as differences in environmental impact and nutrient content, were assessed using the Kruskal–Wallis test and Mann–Whitney tests for post-hoc analysis, since the variables were not normally distributed. Spearman’s correlation coefficient was calculated to assess the correlation between appreciation and tastiness of the three lunches as a whole and for all individual foods grouped together. As for the appreciation and tastiness of the three lunches as a whole, we also assessed differences between subgroups of the study population based on gender, department, frequency of meat consumption and having eaten something within the two hours before the lunch lecture. A one sample binomial test was used to check for differences in the proportion of plant-based foods and animal-based foods chosen in the combination lunch. P-values lower than 0.05 were considered statistically significant. Bonferroni corrections were used for tests with multiple comparisons. All analyses were performed using Statistical Analysis Software (SAS) version 9.4 (SAS Institute Inc., Cary, NC, USA).
3. Results
Table 1 shows the characteristics of the study population for each of the three lunches (i.e., each group). More women than men participated in this study. The mean age of participants was 40–43 years in the three groups. The majority of the participants ate meat, but not on a daily basis. None of the variables in Table 1 were significantly different between groups attending the three lunches.
Table 2 shows the composition and costs for all three lunches, and displays between brackets the number of times that individual foods were consumed in each lunch. The standard animal-based lunch is associated with the lowest costs (based on the price charged per person by the caterer), while the combination lunch is associated with the highest costs. The price difference can be explained by a higher cost price of the plant-based foods for the caterer, more ingredients per bread roll for the plant-based bread rolls, more preparation time for the plant-based bread rolls and a higher number of foods available in the combination lunch.
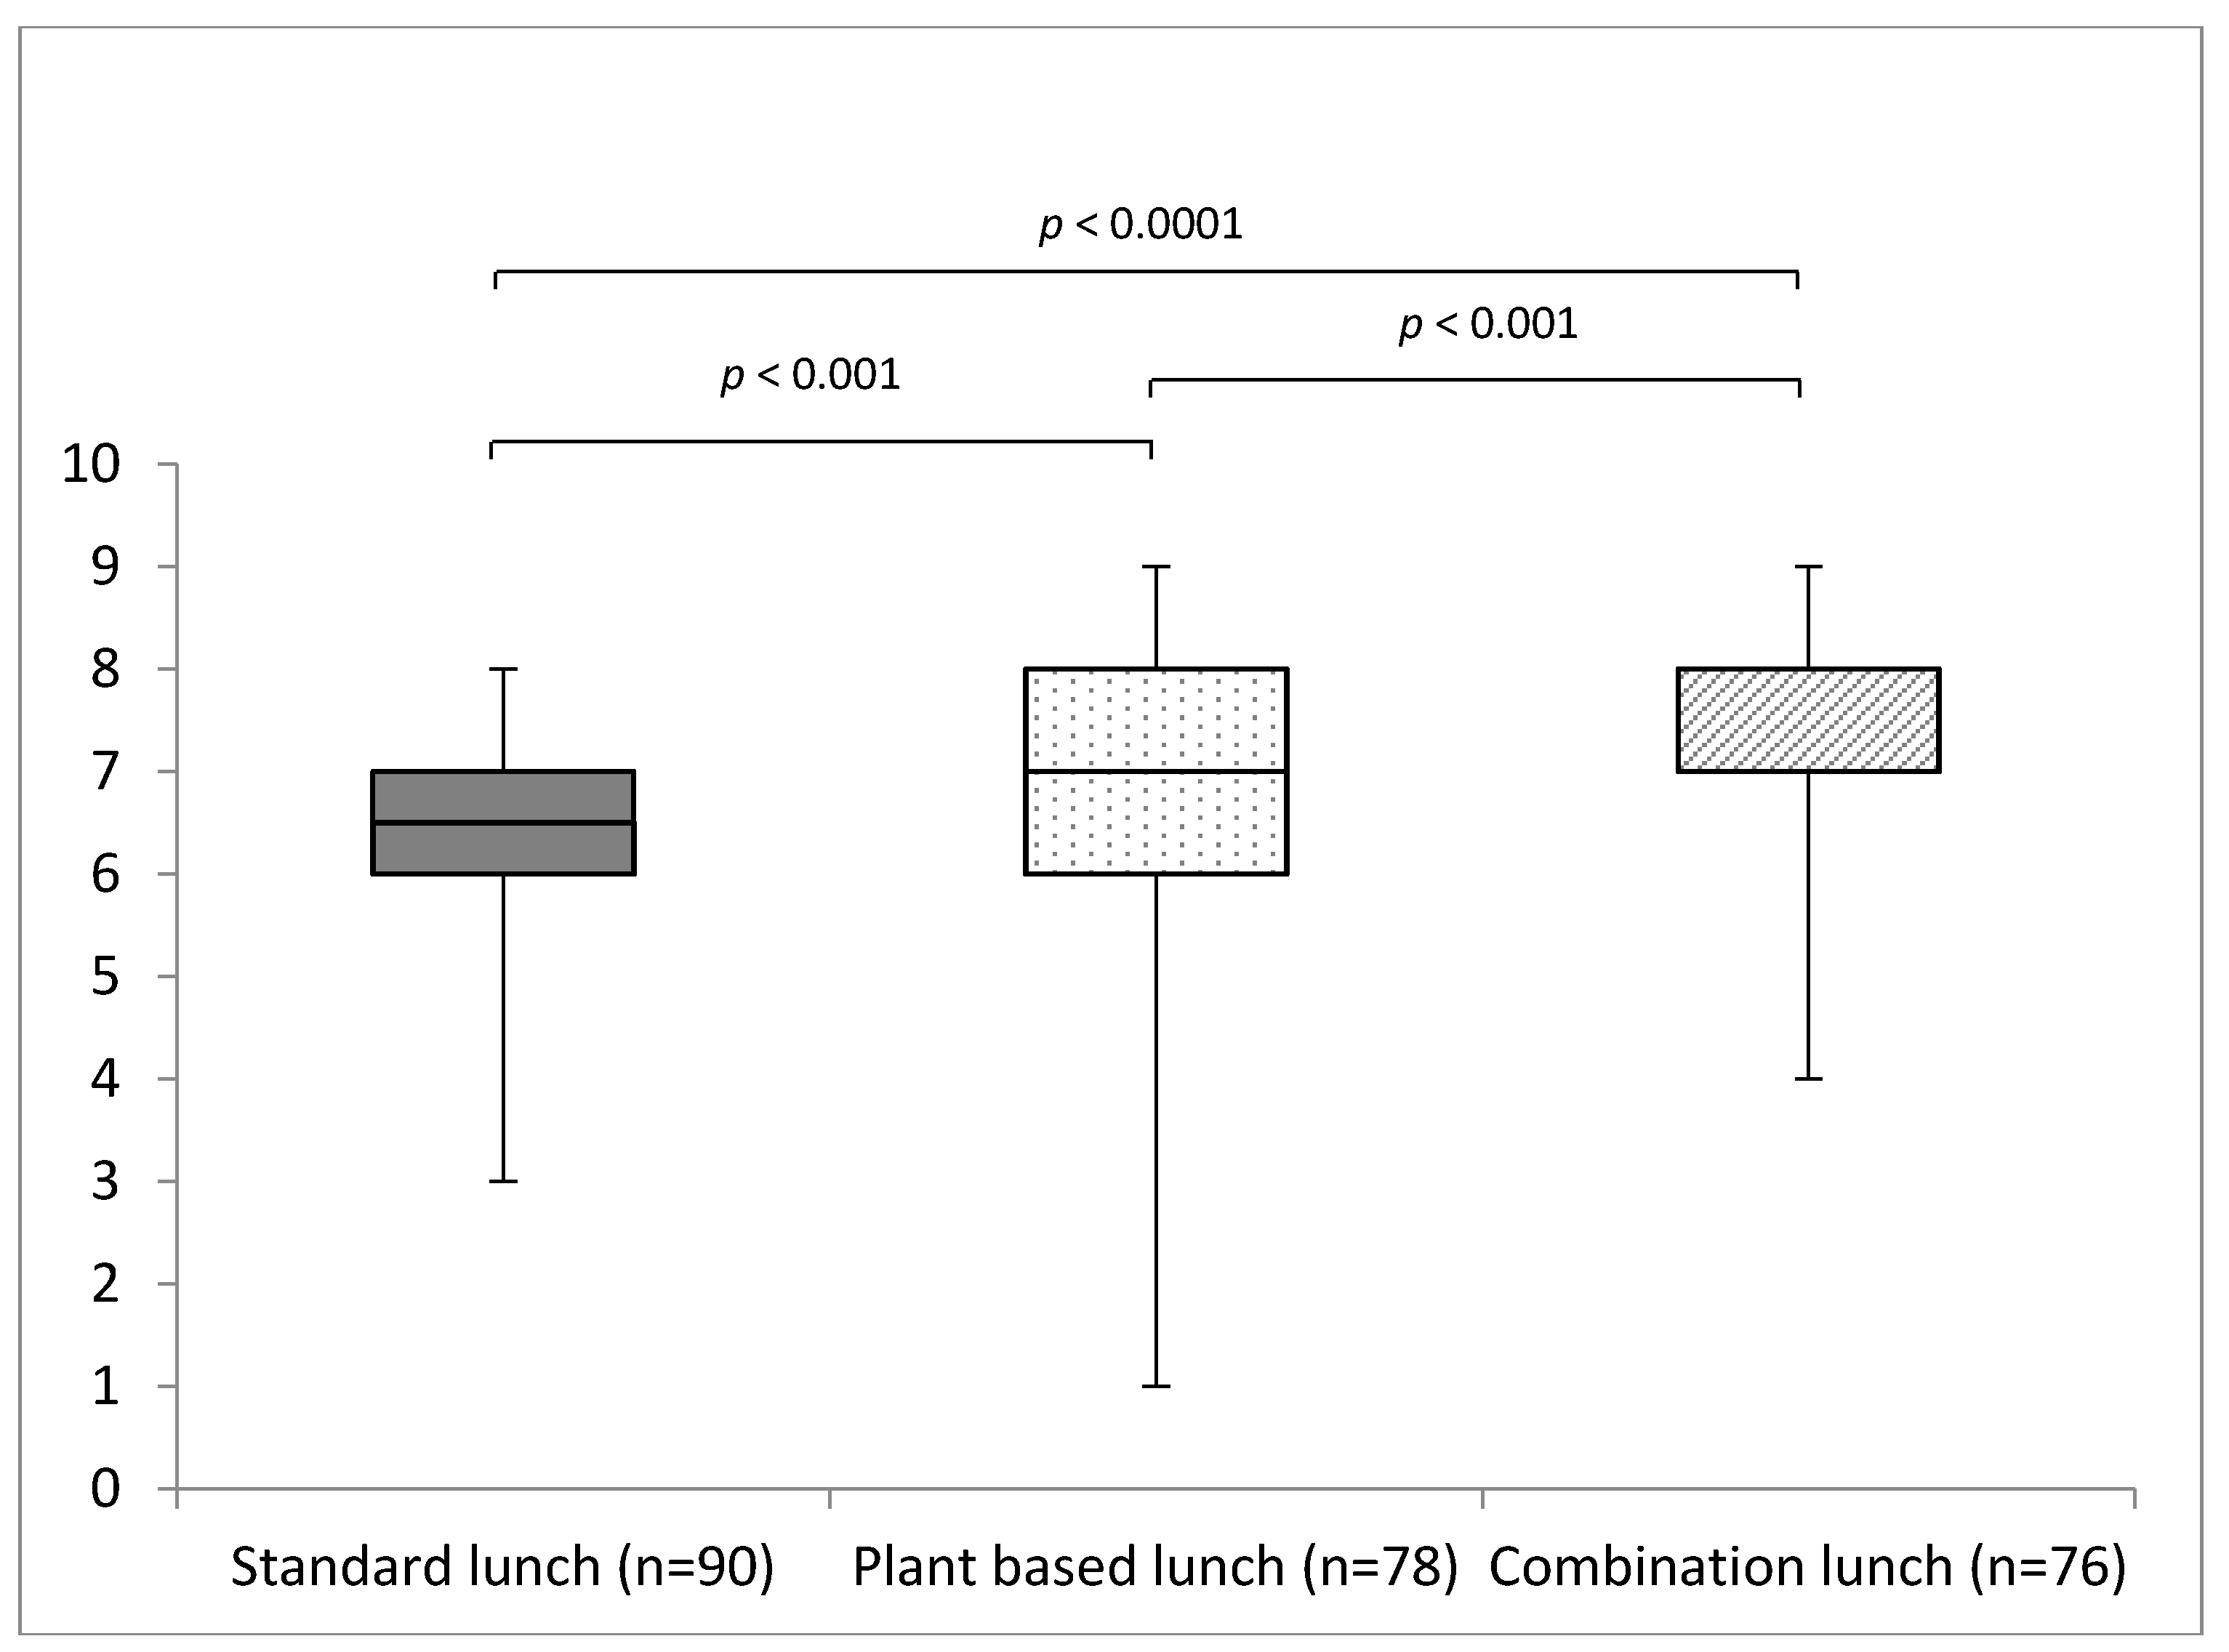
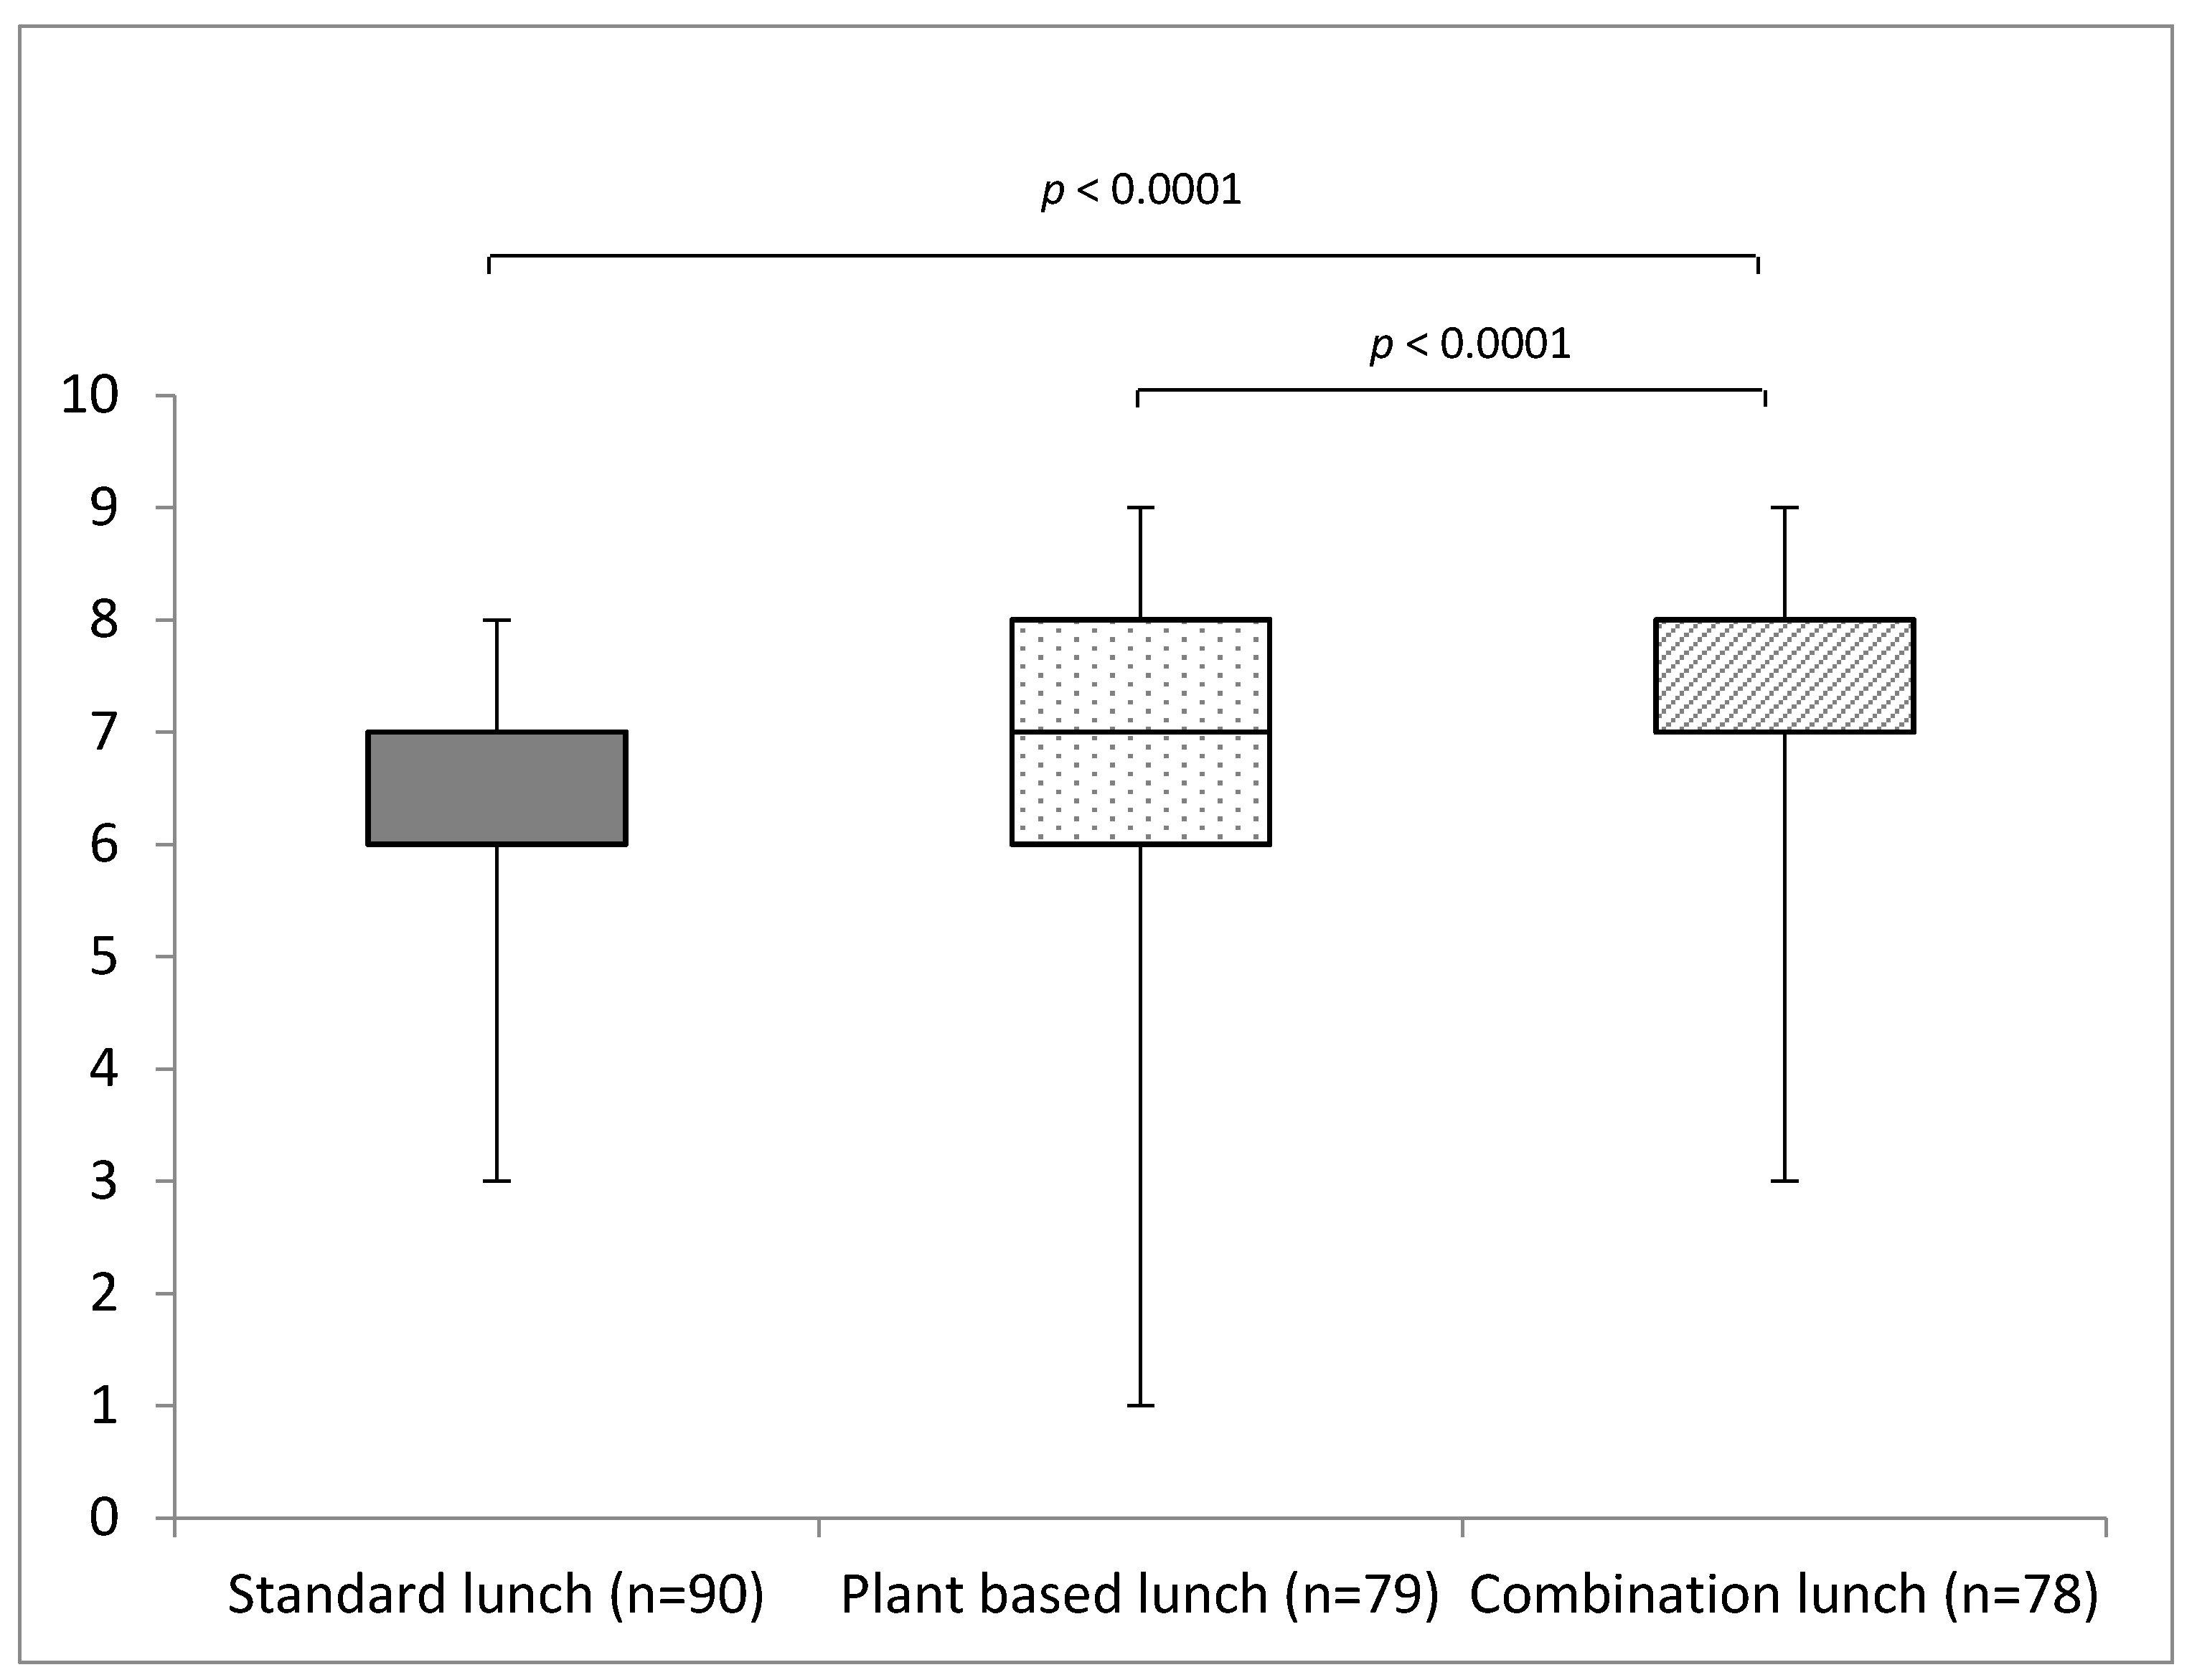
Figure 1 and Figure 2 show the appreciation and tastiness for the three lunches as a whole. The combination lunch scored higher on appreciation and tastiness than the standard and plant-based lunch. The tastiness of the plant-based lunch received a higher score than the standard lunch, but differences in appreciation did not reach significance by a small margin (p = 0.05). Appreciation and tastiness were strongly correlated, for the lunch as a whole as well as for individual foods (in both cases the Spearman correlation coefficient was 0.81 with p < 0.0001).
In the combination lunch, the plant-based bread rolls (n = 106, excluding currant buns) were chosen more often than the animal-based bread rolls (n = 81; see Table 2), but this difference did not reach significance (one sample binomial test, p = 0.08). As for appreciation and tastiness (see Table 3), the plant-based bread rolls scored significantly higher than the animal-based bread rolls in the combination lunch (p < 0.0001 for appreciation and p = 0.001 for tastiness). In both the plant-based and combination lunch, the bread roll with vegetarian luncheon meat was chosen least often of the three plant-based bread rolls. Regarding the drinks in the combination lunch, milk and buttermilk (n = 49) were chosen significantly more often than water and the soy drink (n = 17; p = 0.0001). Appreciation and tastiness were not significantly different between the groups ‘milk and buttermilk’ and ‘soy drink and water’ in the combination lunch (p = 0.516 and p = 0.794, respectively).
The environmental impact and nutrient content of food consumption per person in the three lunches are shown in Table 4. GHG emissions and land use were lowest for the plant-based lunch (with median values of 0.3 kg CO2-eq and 0.4 m2*year respectively) and highest for the animal-based lunch (with median values of 0.8 kg CO2-eq and 0.7 m2*year respectively). With slightly lower (but not significantly different) energy intake than in the standard lunch, the intakes of fiber and vitamin C were higher in the plant-based lunch compared to the standard lunch, and intakes of sodium (salt), saturated fat, protein, calcium and zinc were lower. In the combination lunch, energy, carbohydrates and vitamin B1 intakes were higher than in the other two lunches. In addition, total fat, protein, sodium, zinc and retinol activity equivalent intakes were higher than in the plant-based lunch, and fiber and vitamin C intakes were increased compared to the standard lunch. The intake of saturated fat and calcium was lower than in the standard lunch but higher than in the plant-based lunch.
Having eaten something within two hours before the lunch lecture did not have any significant effects on appreciation and tastiness for the lunches as a whole, nor on energy intake during lunch. The number of days per week that participants ate meat was not associated with the appreciation and tastiness for the standard lunch and combination lunch, but there was an association between frequency of meat consumption and appreciation and tastiness for the plant-based lunch. Participants who consumed meat 5 to 7 days per week had a significantly lower appreciation for the plant-based lunch than participants who never consumed meat or who consumed meat 1 to 4 days per week (Mann-Whitney test, p = 0.0028 and p = 0.0002 respectively). As for tastiness, participants who consumed meat 5 to 7 days per week rated the plant-based lunch significantly lower than people who consumed meat 1 to 4 days per week (p = 0.013), but there was no significant difference with participants who never consumed meat. However, looking at appreciation and tastiness of the three lunches within the subgroup of the most frequent meat consumers, ratings for the animal-based and plant-based lunch were not significantly different and only the combination lunch was rated significantly higher. Women appreciated the standard lunch significantly higher than men did (Mann–Whitney test, p = 0.010). As for differences between departments included in the study, the zoonoses department rated the plant-based lunch significantly lower than the public health and sustainability departments, for appreciation (Mann-Whitney test, p < 0.0001 for comparisons with both the other sectors) as well as tastiness (p = 0.002 and p = 0.008 respectively). Tastiness of the combination lunch was rated higher by the public health department compared to the zoonoses department (p = 0.008).
4. Discussion
Previous research has shown that worksite interventions can have a positive effect on dietary behavior [22,23]. Research so far has however focused on health promotion, while environmental impact (carbon footprint) has also been identified in focus groups as an important value for foodservices at the workplace [24]. To our knowledge, this study is the first to integrate nutrient content and environmental impact of lunches provided at the workplace, while also taking appreciation and tastiness into account. Our results show that including plant-based foods next to animal-based foods in a buffet-style lunch at the workplace can reduce the environmental impact and increase appreciation and tastiness compared to a standard animal-based lunch. Serving only plant-based foods can lead to even further reductions in environmental impact, while also scoring higher on tastiness than a standard animal-based lunch. Serving plant-based foods in a buffet-style lunch at the workplace also seems to result in more favorable nutrient intakes.
In the combination lunch, energy intake increased and calcium intake decreased, but saturated fat intake also decreased and fiber, vitamin B1 and vitamin C intakes increased compared to the standard lunch. In the plant-based lunch there was no increase in energy intake compared to the standard lunch, while the intakes of saturated fat and sodium (salt) were reduced and the intakes of fiber and vitamin C were increased. However, zinc, calcium and protein intakes were reduced. Data on body mass index, daily food/nutrient intake or nutrient status were not available for the population under study, but considering that in the Netherlands 50% of the adult population is overweight or obese [25], an increase in energy intake (such as in the combination lunch) is not desirable. Reductions in the intake of saturated fat and salt (sodium) such as in the plant-based lunch would be desirable, since the majority of the Dutch population has intakes above the recommended maxima [20,21]. Since the habitual protein intake in the Netherlands is above the estimated average requirement for almost all adults [20], reductions in protein intake are unlikely to cause problems. Increased fiber intakes are beneficial because the large majority of the Dutch population does not meet recommended fiber intakes [20]. Whether reduced intakes of calcium and zinc during lunch will cause problems is difficult to determine, but we know that the prevalence of inadequate calcium intake in the Netherlands is low and that the majority of the population has a zinc intake above the estimated average requirement [20]. In addition, dinner and not lunch is the most important meal for zinc intake, and intake of calcium is spread throughout the day [20]. Aside from nutrient intakes, we know that the majority of the Dutch population has a meat consumption above the maximum in the Dutch food based dietary guidelines, and less than 10% meet the recommended intake of vegetables [26]. Replacing meat-based bread toppings with vegetables will therefore bring food consumption more in line with dietary guidelines.
The number of foods consumed per person was highest in the combination lunch (e.g., on average 3.0 bread rolls per person compared to 2.6 in the standard lunch and 2.5 in the plant-based lunch; Table 2). Previous research has shown that increased food variety can increase food and energy intake [27], so possibly the larger number of foods on offer in the combination lunch resulted in increased food consumption. Food consumption was however only measured for the lunch provided, so we could not assess if the higher energy intake in the combination lunch was compensated for by decreased energy intakes later in the day. Results from experimental studies show that energy compensation varies but is more likely to occur when the additional energy comes from solid food [28], as was, at least to some extent, the case in this study.
Women appreciated the animal-based lunch more than men did in this study, which is surprising, since men are generally more likely to have a higher meat consumption and lower use of meat replacers [11,20,29,30]. The participants with the most frequent meat consumption (5 to 7 days per week) had a lower appreciation for the plant-based lunch than participants who consumed meat less frequently. However, considering only the group of participants with the most frequent meat consumption, there was no statistically significant difference in appreciation between the animal-based and plant-based lunch, while the combination lunch was appreciated significantly more. This implies that a plant-based lunch may be just as well accepted as an animal-based lunch by people who consume meat most days of the week.
One of the strengths of this study is that it was performed in a real-life setting, as previous research has shown that acceptability of foods and food intake as measured in laboratory settings may be different from those in real-life settings [31,32]. In addition, environmental impact and nutrient intake were based on the foods actually chosen by participants (consumption) instead of being based on the composition of the lunch as provided by the caterer. The results of this study are therefore based on actual choices made in practice, instead of theoretical differences. Another strength is that we incorporated perceived tastiness and appreciation into the study, since liking for the sensory aspects of food is an important factor in dietary choices [33]. We included tastiness and appreciation as separate factors since participants might appreciate the various lunches for other reasons than sensory characteristics (such as healthiness and environmental sustainability). In practice however, ratings for tastiness and appreciation were strongly correlated, emphasizing that lunches should be tasty in order to be appreciated.
A limitation of this study is that the plant-based lunch for the zoonoses department was not delivered as agreed upon by the caterer. The lunch was not delivered on time: it was delivered once the lunch lecture had already started, which will have caused some inconvenience. The number of bread rolls delivered was also lower than planned. The lunch did not contain the bread roll with vegetarian luncheon meat, and in addition there was no beetroot on the bread roll with hummus. This could explain the lower rating for appreciation and tastiness for the plant-based lunch by this department. The range of values given for appreciation and tastiness was largest for the plant-based lunch (Figure 1 and Figure 2), because of some very low ratings. When the zoonoses department is excluded from the analyses, the minimum value for appreciation of the plant-based lunch becomes 4, and that for tastiness becomes 3, similar to the minimum values for the other lunches. This means that the most negative ratings for the plant-based lunch were given by the zoonoses department. The difference in appreciation and tastiness between the plant-based and the standard animal-based lunch in this study may therefore be seen as conservative estimates. It is likely that the plant-based lunch would have received higher scores for appreciation and tastiness by participants from the zoonoses department if the lunch would have been provided in the same way as for the other two departments.
We relied on GHG emissions and land use as indicators for environmental impact. While these indicators are highly correlated to some other indicators of environmental impact [34], it does not mean that reductions in GHG emissions and land use lead to similar reductions in all other indicators. Additional research would be necessary to quantify the environmental impact of the three lunches for other indicators, such as water use or eutrophication. In addition, environmental impact data were specific for the Dutch situation and could be different in other countries. Environmental impact of food consumption as calculated in this study was not specific for out-of-home consumption or buffet-style lunches provided by a caterer. While we do not expect that including more specific environmental impact data will influence the main results of this study, future research could take this into account in order to obtain more detailed results.
Because we were interested in the type of foods people would prefer to choose from the lunch buffet, we made sure all foods were available in ample amounts. This resulted in some leftovers and food waste, which is also a general characteristic of buffet-style meals [35,36]. From a sustainability perspective, food waste should be avoided and therefore a buffet-style lunch may not be the preferable form. Offering the foods in more limited amounts may be better for the prevention of food waste, but could have an effect on appreciation and tastiness of the lunch because it will limit choice. It was beyond the scope of this study to test this, but it should be kept in mind for future research or for the implementation of the results of this study in practice.
This study can be seen as a first exploration into well-accepted lunches at the workplace with reduced environmental impact, but the results should be extrapolated to other situations with caution. Additional research is necessary to determine if the results remain valid in the long-term and in different populations. For example, the plant-based lunch and combination lunch were novel to the participants while the standard lunch was not, so additional research is necessary to rule out that the observed increases in tastiness and appreciation were (partly) attributable to the novelty of the lunches. In addition, for reasons of practicality, the lunches were always served in the same order within this study, so any effect of the order in which the lunches were consumed cannot be ruled out. Some plant-based bread rolls contained more than one bread topping (e.g., hummus and beet root), while the animal-based bread rolls contained only one topping. Therefore, the plant-based lunch could be considered more luxurious and the higher appreciation for the plant-based bread rolls may be partly attributable to this aspect. Finally, the population included in this study is not representative for the general population. Participants were all highly educated and, since the participants worked for the Dutch National Institute for Public Health and the Environment, all participants will have been interested in health and/or environmental sustainability to some extent. However, previous research in another sector has also found that changing the food environment at the workplace can improve nutrient intakes [37]. Despite these limitations, the results do show that plant-based lunches can lead to more environmentally friendly, nutritious and tasty lunches in a real-life setting, and that it is worthwhile to continue research into this field to further develop our knowledge on the improvement potential that plant-based lunches at work hold.
5. Conclusions
Including plant-based foods in a buffet-style lunch provided at the workplace can reduce environmental impact and improve nutrient intake while increasing tastiness. In this study, a lunch with both plant-based and animal-based foods was appreciated the most, but was also associated with increased energy intake. Including plant-based foods only also lead to improved tastiness compared to a standard animal-based lunch, while resulting in even larger reductions in environmental impact than the combination lunch and increased intakes of fiber and decreased intakes of sodium (salt) and saturated fat compared to a standard lunch. This first exploration into serving plant-based lunches at work shows that further research into this field is worthwhile.
Acknowledgments
We thank Marinka Brosens and Marije Seves for their contributions to the study design, data collection and the performance of exploratory data analyses. This work was performed with an internal budget for strategic research. No external funds were used for this study.
Author Contributions
Elisabeth H. M. Temme conceived and designed the experiments; Elisabeth H. M. Temme performed the experiments; Mirjam E. van de Kamp analyzed the data; Mirjam E. van de Kamp wrote the paper. Elisabeth H. M. Temme critically reviewed the paper and approved the final version.
Conflicts of Interest
The authors declare no conflict of interest.
References
- Tukker, A.; Huppes, G.; Guinée, J.; Heijungs, R.; de Koning, A.; van Oers, L.; Suh, S.; Geerken, T.; van Holderbeke, M.; Jansen, B. Environmental Impact of Products (EIPRO); Analysis of the Life Cycle Environmental Impacts Related to the Final Consumption of the EU-25; IPTS: Seville, Spain, 2006. [Google Scholar]
- Garnett, T. Where are the best opportunities for reducing greenhouse gas emissions in the food system (including the food chain)? Food Policy 2011, 36 (Suppl. 1), S23–S32. [Google Scholar] [CrossRef]
- Hallström, E.; Carlsson-Kanyama, A.; Börjesson, P. Environmental impact of dietary change: A systematic review. J. Clean. Prod. 2015, 91, 1–11. [Google Scholar] [CrossRef]
- Perignon, M.; Vieux, F.; Soler, L.-G.; Masset, G.; Darmon, N. Improving diet sustainability through evolution of food choices: Review of epidemiological studies on the environmental impact of diets. Nutr. Rev. 2017, 75, 2–17. [Google Scholar] [CrossRef] [PubMed]
- Biesbroek, S.; Bueno-de-Mesquita, H.B.; Peeters, P.H.; Verschuren, W.M.; van der Schouw, Y.T.; Kramer, G.F.; Tyszler, M.; Temme, E.H. Reducing our environmental footprint and improving our health: Greenhouse gas emission and land use of usual diet and mortality in EPIC-NL: A prospective cohort study. Environ. Health 2014, 13, 27. [Google Scholar] [CrossRef] [PubMed]
- Aleksandrowicz, L.; Green, R.; Joy, E.J.; Smith, P.; Haines, A. The impacts of dietary change on greenhouse gas emissions, land use, water use, and health: A systematic review. PLoS ONE 2016, 11, e0165797. [Google Scholar] [CrossRef] [PubMed]
- Scarborough, P.; Allender, S.; Clarke, D.; Wickramasinghe, K.; Rayner, M. Modelling the health impact of environmentally sustainable dietary scenarios in the UK. Eur. J. Clin. Nutr. 2012, 66, 710–715. [Google Scholar] [CrossRef] [PubMed]
- Van de Kamp, M.E.; Seves, S.M.; Temme, E.H.M. Reducing GHG emissions while improving diet quality: Exploring the potential of reduced meat, cheese and alcoholic and soft drinks consumption at specific moments during the day. 2018; submitted. [Google Scholar]
- Vieux, F.; Darmon, N.; Touazi, D.; Soler, L.G. Greenhouse gas emissions of self-selected individual diets in France: Changing the diet structure or consuming less? Ecol. Econ. 2012, 75, 91–101. [Google Scholar] [CrossRef]
- Tobler, C.; Visschers, V.H.; Siegrist, M. Eating green. Consumers’ willingness to adopt ecological food consumption behaviors. Appetite 2011, 57, 674–682. [Google Scholar] [CrossRef] [PubMed]
- De Boer, J.; Schösler, H.; Aiking, H. Towards a reduced meat diet: Mindset and motivation of young vegetarians, low, medium and high meat-eaters. Appetite 2017, 113, 387–397. [Google Scholar] [CrossRef] [PubMed]
- Sijtsema, S.J.; Haaster-de Winter, M.A.; Verain, M.C.D. Interplay Sustainable and Healthy?; Sustainable Food from the Consumer Perspective; LEI Wageningen UR: The Hague, The Netherlands, 2012. [Google Scholar]
- Schösler, H.; de Boer, J.; Boersema, J.J. Can we cut out the meat of the dish? Constructing consumer-oriented pathways towards meat substitution. Appetite 2012, 58, 39–47. [Google Scholar] [CrossRef] [PubMed] [Green Version]
- Garnett, T.; Mathewson, S.; Angelides, P.; Borthwick, F. Policies and actions to shift eating patterns: What works? Foresight 2015, 515, 518–522. [Google Scholar]
- Chokshi, D.A.; Farley, T.A. The cost-effectiveness of environmental approaches to disease prevention. N. Engl. J. Med. 2012, 367, 295–297. [Google Scholar] [CrossRef] [PubMed]
- Van Rossum, C.T.M.; Buurma-Rethans, E.J.M.; Vennemann, F.B.C.; Beukers, M.; Brants, H.A.M.; de Boer, E.J.; Ocke, M.C. The Diet of the Dutch: Results of the First Two Years of the Dutch National Food Consumption Survey 2012–2016; National Institute for Public Health and the Environment: Bilthoven, The Netherlands, 2016.
- Commission of the European Communities. Communication from the Commission to the European Parliament, the Council, the European Economic and Social Committee and the Committee of the Regions; Public Procurement for a Better Environment; Commission of the European Communities: Brussels, Belgium, 2008. [Google Scholar]
- Blonk, H.; Ponsioen, T.; Kool, A.; Marinussen, M. The Agri-Footprint Method—Methodological Lca Framework, Assumptions and Applied Data; Blonk Milieu Advies: Gouda, The Netherlands, 2011. [Google Scholar]
- The National Institute for Public Health and the Environment. Nevo-Online Version 2013/4.0. Available online: http://nevo-online.rivm.nl/ (accessed on 11 February 2015).
- Van Rossum, C.T.M.; Fransen, H.P.; Verkaik-Kloosterman, J.; Buurma-Rethans, E.J.M.; Ocke, M.C. Dutch National Food Consumption Survey 2007–2010. Diet of Children and Adults Aged 7 to 69 Years; The National Institute for Public Health and the Environment: Bilthoven, The Netherlands, 2011.
- Temme, E.H.M.; Hendriksen, M.A.H.; Milder, I.E.J.; Toxopeus, I.B.; Westenbrink, S.; Brants, H.A.M.; van der A, D.L. Salt reductions in some foods in The Netherlands: Monitoring of food composition and salt intake. Nutrients 2017, 9, 791. [Google Scholar] [CrossRef] [PubMed]
- Mhurchu, C.N.; Aston, L.M.; Jebb, S.A. Effects of worksite health promotion interventions on employee diets: A systematic review. BMC Public Health 2010, 10, 62. [Google Scholar] [CrossRef] [PubMed] [Green Version]
- Engbers, L.H.; van Poppel, M.N.M.; Chin, A.; Paw, M.J.M.; van Mechelen, W. Worksite health promotion programs with environmental changes. A systematic review. Am. J. Prev. Med. 2005, 29, 61–70. [Google Scholar] [CrossRef] [PubMed]
- Price, S.; Hartwell, H.; Hemingway, A.; Chapleo, C. Workplace foodservice; perception of quality and trust. Appetite 2016, 97, 169–175. [Google Scholar] [CrossRef] [PubMed]
- Statistics Netherlands. Length and Weight of People, Underweight and Overweight. 1981. Available online: http://statline.cbs.nl/StatWeb/publication/?DM=SLNL&PA=81565NED (accessed on 22 June 2017).
- Van Rossum, C.T.M.; Buurma, E.; Vennemann, F.B.C.; Beukers, M.; Drijvers, J.M.; Ocke, M. Memo Food Consumption in 2012–2014 Compared to the Wheel of Five 2016; The National Institute for Public Health and the Environment: Bilthoven, The Netherlands, 2017.
- Sørensen, L.B.; Møller, P.; Flint, A.; Martens, M.; Raben, A. Effect of sensory perception of foods on appetite and food intake: A review of studies on humans. Int. J. Obes. 2003, 27, 1152–1166. [Google Scholar] [CrossRef] [PubMed]
- Almiron-Roig, E.; Palla, L.; Guest, K.; Ricchiuti, C.; Vint, N.; Jebb, S.A.; Drewnowski, A. Factors that determine energy compensation: A systematic review of preload studies. Nutr. Rev. 2013, 71, 458–473. [Google Scholar] [CrossRef] [PubMed]
- Schosler, H.; de Boer, J.; Boersema, J.; Aiking, H. Meat and masculinity among young chinese, turkish and dutch adults in the netherlands. Appetite 2015, 89, 152–159. [Google Scholar] [CrossRef] [PubMed] [Green Version]
- Lea, E.; Crawford, D.; Worsley, A. Consumers’ readiness to eat a plant-based diet. Eur. J. Clin. Nutr. 2006, 60, 342–351. [Google Scholar] [CrossRef] [PubMed]
- De Graaf, C.; Cardello, A.V.; Kramer, F.M.; Lesher, L.L.; Meiselman, H.L.; Schutz, H.G. A comparison between liking ratings obtained under laboratory and field conditions: The role of choice. Appetite 2005, 44, 15–22. [Google Scholar] [CrossRef] [PubMed]
- Stroebele, N.; De Castro, J.M. Effect of ambience on food intake and food choice. Nutrition 2004, 20, 821–838. [Google Scholar] [CrossRef] [PubMed]
- Eertmans, A.; Baeyens, F.; van den Bergh, O. Food likes and their relative importance in human eating behavior: Review and preliminary suggestions for health promotion. Health Educ. Res. 2001, 16, 443–456. [Google Scholar] [CrossRef] [PubMed]
- Health Council of the Netherlands. Guidelines for a Healthy Diet: The Ecological Perspective; Health Council of the Netherlands: The Hague, The Netherlands, 2011. [Google Scholar]
- Silvennoinen, K.; Heikkilä, L.; Katajajuuri, J.-M.; Reinikainen, A. Food waste volume and origin: Case studies in the finnish food service sector. Waste Manag. 2015, 46, 140–145. [Google Scholar] [CrossRef] [PubMed]
- Gustavsson, J.; Cederberg, C.; Sonesson, U.; van Otterdijk, R.; Meybeck, A. Global Food Losses and Food Waste: Extent, Causes and Prevention; FAO: Rome, Italy, 2011. [Google Scholar]
- Lassen, A.D.; Thorsen, A.V.; Sommer, H.M.; Fagt, S.; Trolle, E.; Biltoft-Jensen, A.; Tetens, I. Improving the diet of employees at blue-collar worksites: Results from the ‘food at work’ intervention study. Public Health Nutr. 2011, 14, 965–974. [Google Scholar] [CrossRef] [PubMed]
Figure 1.
Appreciation of the three lunches as a whole, scores from 1 to 10. n = the number of people that rated the lunch.
Figure 1.
Appreciation of the three lunches as a whole, scores from 1 to 10. n = the number of people that rated the lunch.

Figure 2.
Tastiness of the three lunches as a whole, scores from 1 to 10. n = the number of people that rated the lunch.
Figure 2.
Tastiness of the three lunches as a whole, scores from 1 to 10. n = the number of people that rated the lunch.

Table 1.
Characteristics of the study population for each of the three lunches.
| Standard Lunch (Animal-Based Foods) (n = 91) | Plant-Based Lunch (n = 81) | Combination Lunch (n = 83) | |||||||
|---|---|---|---|---|---|---|---|---|---|
| n | Mean | SD | N | Mean | SD | n | Mean | SD | |
| Age (year) | 91 | 43 | 11 | 81 | 40 | 12 | 83 | 41 | 11 |
| n | Proportion | N | Proportion | n | Proportion | ||||
| Gender | |||||||||
| Male | 30 | 33% | 31 | 38% | 40 | 48% | |||
| Female | 61 | 67% | 50 | 62% | 43 | 52% | |||
| Frequency of meat consumption | |||||||||
| Never | 8 | 9% | 10 | 12% | 8 | 10% | |||
| 1–2 days per week | 18 | 20% | 12 | 15% | 10 | 12% | |||
| 3–4 days per week | 19 | 21% | 19 | 23% | 23 | 28% | |||
| 5–6 days per week | 35 | 38% | 25 | 31% | 32 | 39% | |||
| Daily | 11 | 12% | 15 | 19% | 10 | 12% | |||
| Ate something within two hours before lunch lecture | 49 | 54% | 41 | 51% | 42 | 52% | |||
| Department | |||||||||
| Sustainability department | 26 | 29% | 27 | 33% | 18 | 22% | |||
| Zoonoses department | 26 | 29% | 31 | 38% | 35 | 42% | |||
| Public health department | 32 | 35% | 20 | 25% | 28 | 34% | |||
| Other department | 7 | 8% | 3 | 4% | 2 | 2% | |||
None of the variables were significantly different between the three lunches (ANOVA for continuous variables, Chi-square test for categorical variables, p < 0.05).
Table 2.
Composition of the three lunches included in this study with the number of times each food was consumed in brackets.
Table 2.
Composition of the three lunches included in this study with the number of times each food was consumed in brackets.
| Foods and Drinks | Standard Lunch (Animal-Based Foods) (n = 91) | Plant-Based Lunch (n = 81) | Combination Lunch (n = 83) |
|---|---|---|---|
| Animal-based | |||
| Brown wheat bread roll with 48+ Gouda cheese | X (87) | X (39) | |
| White wheat bread roll with ham | X (39) | X (25) | |
| White wheat bread roll with salami | X (30) | X (17) | |
| Cow milk | X (37) | X (27) | |
| Cow buttermilk | X (29) | X (22) | |
| Plant-based | |||
| Brown wheat bread roll with grilled vegetables and tomato tapenade | X (74) | X (58) | |
| White wheat bread roll with hummus and beetroot | X (57) | X (39) | |
| White wheat bread roll with vegetarian luncheon meat | X (11) | X (9) | |
| Soy drink (sweetened) | X (29) | X (8) | |
| Tap water | X (26) | X (9) | |
| Currant bun | X (81) | X (61) | X (58) |
| Fruit | X (51) | X (38) | X (30) |
| Price per person (€) * | 5.30 | 6.95 | 7.75 |
* Price per person excluding taxes, based on lunch as offered by the caterer and not on actual food consumed.
Table 3.
Appreciation and tastiness for individual foods served as part of the three lunches.
| Standard Lunch (Animal-Based Foods) (n = 91) | Plant-Based Lunch (n = 81) | Combination Lunch (n = 83) | ||||
|---|---|---|---|---|---|---|
| n * | Median Score (IQR) | n * | Median Score (IQR) | n * | Median Score (IQR) | |
| Appreciation | ||||||
| Animal-based foods | ||||||
| Brown wheat bread roll with 48+ Gouda cheese | 74 | 7.0 (6.0–7.0) | 36 | 7.0 (7.0–8.0) | ||
| White wheat bread roll with ham | 34 | 6.0 (5.0–7.0) | 21 | 7.0 (7.0–8.0) | ||
| White wheat bread roll with salami | 27 | 6.0 (5.0–7.0) | 16 | 7.0 (6.5–8.0) | ||
| Cow milk | 35 | 8.0 (7.0–8.0) | 23 | 8.0 (7.0–9.0) | ||
| Cow buttermilk | 26 | 8.0 (7.0–8.0) | 20 | 8.0 (8.0–8.0) | ||
| Plant-based foods | ||||||
| Brown wheat bread roll with grilled vegetables and tomato tapenade | 65 | 8.0 (7.0–8.0) | 52 | 8.0 (7.8–9.0) | ||
| White wheat bread roll with hummus and beetroot | 55 | 8.0 (6.0–8.0) | 33 | 8.0 (8.0–9.0) | ||
| White wheat bread roll with vegetarian luncheon meat | 10 | 7.0 (6.0–8.0) | 8 | 7.0 (7.0–7.5) | ||
| Soy drink (sweetened) | 28 | 6.5 (5.0–8.0) | 7 | 7.0 (6.0–9.0) | ||
| Tap water | 22 | 8.0 (6.0–10.0) | 7 | 9.0 (8.0–10.0) | ||
| Currant bun | 74 | 7.0 (7.0–8.0) | 54 | 7.0 (7.0–8.0) | 47 | 8.0 (7.0–8.0) |
| Fruit | 38 | 8.0 (7.0–8.0) | 34 | 8.0 (7.0–9.0) | 18 | 8.0 (7.0–9.0) |
| Tastiness | ||||||
| Animal-based foods | ||||||
| Brown wheat bread roll with 48+ Gouda cheese | 70 | 7.0 (6.0–7.0) | 36 | 7.0 (7.0–8.0) | ||
| White wheat bread roll with ham | 32 | 7.0 (6.0–7.0) | 22 | 7.0 (7.0–8.0) | ||
| White wheat bread roll with salami | 26 | 6.5 (5.0–7.0) | 15 | 7.0 (6.5–8.0) | ||
| Cow milk | 31 | 7.0 (7.0–9.0) | 20 | 8.0 (7.0–9.0) | ||
| Cow buttermilk | 24 | 8.0 (7.0–8.0) | 19 | 8.0 (7.0–8.0) | ||
| Plant-based foods | ||||||
| Brown wheat bread roll with grilled vegetables and tomato tapenade | 59 | 8.0 (6.0–8.0) | 53 | 8.0 (7.0–8.0) | ||
| White wheat bread roll with hummus and beetroot | 51 | 7.0 (6.0–8.0) | 35 | 8.0 (7.5–9.0) | ||
| White wheat bread roll with vegetarian luncheon meat | 9 | 7.0 (6.0–8.0) | 8 | 7.0 (7.0–8.0) | ||
| Soy drink (sweetened) | 23 | 5.0 (2.0–6.0) | 7 | 7.0 (6.0–8.0) | ||
| Tap water | 20 | 8.0 (6.0–10.0) | 7 | 8.0 (8.0–10.0) | ||
| Currant bun | 71 | 7.0 (7.0–8.0) | 50 | 8.0 (7.0–8.0) | 43 | 8.0 (7.0–8.0) |
| Fruit | 36 | 8.0 (7.0–8.0) | 29 | 8.0 (8.0–9.0) | 16 | 8.0 (7.0–8.5) |
IQR = interquartile range; * n = the number of people that rated the lunch product.
Table 4.
Environmental impact and nutrient content of food consumption per person for each of the three lunches.
Table 4.
Environmental impact and nutrient content of food consumption per person for each of the three lunches.
| Standard Lunch (Animal-Based Foods) (n = 91) | Plant-Based Lunch (n = 81) | Combination Lunch (n = 83) | |
|---|---|---|---|
| Median (IQR) | Median (IQR) | Median (IQR) | |
| GHG emission (kg CO2-eq) | 0.8 (0.7–0.9) a | 0.3 (0.3–0.4) b | 0.7 (0.5–0.9) c |
| Land use (m2*year) | 0.7 (0.6–0.9) a | 0.4 (0.3–0.5) b | 0.6 (0.5–0.8) c |
| Energy (kcal) | 545 (441–672) a | 481 (422–576) a | 613 (527–707) b |
| Carbohydrates (g) | 67 (58–86) a | 68 (56–78) a | 79 (70–92) b |
| Fat (g) | 16 (13–22) ab | 15 (12–17) a | 18 (16–23) b |
| Saturated fat (g) | 8 (7–11) a | 2 (2–3) b | 7 (3–9) c |
| Protein (g) | 27 (22–32) a | 19 (14–19) b | 27 (20–30) a |
| Fiber (g) | 7 (6–8) a | 10 (9–12) b | 10 (8–12) b |
| Calcium (mg) | 468 (310–506) a | 133 (108–253) b | 311 (236–490) c |
| Sodium (mg) | 1182 (757–1322) a | 886 (655–1014) b | 1135 (1013–1400) a |
| Zinc (mg) | 3 (3–4) a | 2 (1–2) b | 3 (2–3) a |
| RAE (μg) | 116 (103–136) a,b | 107 (107–119) a | 123 (107–206) b |
| Vitamin B1 (mg) | 0.2 (0.1–0.3) a | 0.2 (0.2–0.2) a | 0.2 (0.2–0.3) b |
| Vitamin C (mg) | 24 (3–27) a | 31 (31–55) b | 31 (25–55) b |
IQR = interquartile range; GHG = greenhouse gas, RAE = retinol activity equivalents; a,b,c Indicates significant differences between the three lunches, Mann–Whitney test (Bonferroni correction for multiple comparisons).
© 2018 by the authors. Licensee MDPI, Basel, Switzerland. This article is an open access article distributed under the terms and conditions of the Creative Commons Attribution (CC BY) license (http://creativecommons.org/licenses/by/4.0/).
Share and Cite
MDPI and ACS Style
Van de Kamp, M.E.; Temme, E.H.M. Plant-Based Lunch at Work: Effects on Nutrient Intake, Environmental Impact and Tastiness—A Case Study. Sustainability 2018, 10, 227. https://0-doi-org.brum.beds.ac.uk/10.3390/su10010227
AMA Style
Van de Kamp ME, Temme EHM. Plant-Based Lunch at Work: Effects on Nutrient Intake, Environmental Impact and Tastiness—A Case Study. Sustainability. 2018; 10(1):227. https://0-doi-org.brum.beds.ac.uk/10.3390/su10010227
Chicago/Turabian StyleVan de Kamp, Mirjam E., and Elisabeth H. M. Temme. 2018. "Plant-Based Lunch at Work: Effects on Nutrient Intake, Environmental Impact and Tastiness—A Case Study" Sustainability 10, no. 1: 227. https://0-doi-org.brum.beds.ac.uk/10.3390/su10010227
Note that from the first issue of 2016, this journal uses article numbers instead of page numbers. See further details here.