Sustainability Index Evaluation of the Rainwater Harvesting System in Six US Urban Cities


1
Department of Civil and Environmental Engineering, Konkuk University, Seoul 05029, Korea
2
School of Civil and Environmental Engineering, Yonsei University, Seoul 03722, Korea
*
Author to whom correspondence should be addressed.
Sustainability 2018, 10(1), 280; https://0-doi-org.brum.beds.ac.uk/10.3390/su10010280
Submission received: 21 November 2017
/
Revised: 15 January 2018
/
Accepted: 18 January 2018
/
Published: 22 January 2018
(This article belongs to the Special Issue Impacts of Climate Change on Hydrology, Water Quality and Ecology)
Abstract
:This study investigated the sustainability of the rainwater harvesting system (RWHS) by analyzing six urban city sites with different rainfall statistics in the United States. We developed a new RWHS performance model by modifying a spreadsheet-based storage, treatment, and overflow runoff model (SS STORM) and verified its performance by comparing with another analytical RWHS model. The sustainability index (SI) evaluation method was used for a reservoir system and applied to the RWHS, employing modified resilience and vulnerability evaluation methods due to the different characteristics of a reservoir and the RWHS. The performance of modified SS STORM is very similar to that of the analytical method, except in Los Angeles, which is characterized by long inter-event times and low rainfall event depths due to low annual rainfall. The sustainability indices were successfully evaluated depending on both RWHS size and water demand and vary over a wide range as annual rainfall increases. This study proposes a new RWHS performance model and sustainability index evaluation method. Further study should confirm the proposed approach in regions with widely different rainfall characteristics.
1. Introduction
Water resource availability, including water use and supply, is becoming a greater issue as populations and urban areas increase. Rainwater harvesting systems (RWHS) use a rain barrel (or cistern) to collect rainwater from the roofs of buildings that can be used for gardening, flushing toilets, car washing, and even potable demand, as well as for reducing storm water runoff [1,2,3,4,5,6,7]. The concept of RWHS is simple, but measuring rain barrel performance is a challenge. Thus, many RWHS models have been built to investigate system performance [8,9,10,11].
Jenkins et al. [12] suggested the concepts of yield before spillage (YBS) and yield after spillage (YAS) for modeling RWHS performance. A subsequent comparison of the YAS and YBS models concluded that the YAS method generally produces more conservative results of RWHS efficiency [9,13]. Guo and Baetz [11] introduced an analytical method using the statistical distribution of hourly rainfall data in Chicago and Phoenix in the United States. They suggested analytical equations to estimate RWHS reliability and size as a function of RWHS size and water demand, respectively, and evaluated the maximum achievable reliability and water demand. However, an understanding of precipitation characteristics is important, and these relationships were not verified using actual RWHS behavior under observed precipitation. Seo et al. [14] investigated the effects of connecting multiple rain barrels in RWHS using the storage-reliability-yield (SRY) method. They applied the rain barrel connection model to two different user types with a constant roof area. The first type was a homogeneous group composed of users with the same patterns of water use, and the second group involved users with heterogeneous water use patterns. Their results showed that the total rain barrel size can be reduced without reducing RWHS reliability for heterogeneous users, but the same effect was not observed in the homogenous user group. Hanson and Vogel [15] applied the SRY relationship for dam behavior to RWHS performance. However, the SRY method only represented RWHS performance with a ratio model based on relative annual rainfall depth, and RWHS size should have been converted from a ratio of annual rainfall to a size unit. Thus, the SRY method did not show the effects of constant rain barrel sizes or water demand efficiency. Sample and Liu [16] evaluated the effect of water supply and runoff storage on RWHS performance under land use change conditions and for different locations in Virginia, USA, using the Rainwater Analysis and Simulation Program (RASP) model. They also estimated RWHS life cycle net benefits based on various types of land use from water supply to runoff capture reliability. However, most studies of RWHS performance do not include important multivariate effects, such as the combination of reliability, RWHS size, and water demand.
Many sustainability indexes have been employed to evaluate water resource systems [17,18,19,20]. Hashimoto et al. [17] proposed a sustainability evaluation for a reservoir water supply system using reliability, resilience, and vulnerability. Moy et al. [21] and Kundzewicz and Kindler [22] improved upon the sustainability evaluation method and suggested a different evaluation method for resilience and vulnerability using the maximum deficit period and value. Kjeldsen and Rosbjerg [18] compared various reliability, resilience, and vulnerability estimation methods and suggested that maximum values of deficit duration and volume show more consistent results than average values. Sandoval-Solis et al. [20] proposed a geometric average of reliability, resilience, and vulnerability to evaluate the sustainability index (SI) and applied it to the Rio Grande basin water resources and environmental control system to verify the modified SI method. Asefa et al. [23] applied the SI to evaluate the Tampa Bypass Canal and Alafia River. However, these SI evaluation methods did not apply to RWHS performance; thus, it is necessary to investigate and confirm the applicability of current sustainability evaluation methods for RWHS.
The objectives of this study are (1) to develop and verify an RWHS performance model; (2) to apply a SI including reliability, resilience, and vulnerability to the RWHS; and (3) to investigate the performance of the RWHS depending on storage capacity and water demand under different rainfall characteristics. This study applied the model to six cities in the US, with different rainfall characteristics [24], and analyzed model performance indexes.
2. Materials and Methods
2.1. Analytical Approach
This study employed Equations (1) and (2) to determine the reliability and rain barrel size of the RWHS, respectively. These equations are based on the assumption that distributions of event depth, inter-event time, and duration all follow one exponential distribution, as suggested by Adams and Papa [25]. Guo and Baetz [11] described the derivations in detail.
Here, is reliability, is roof area (), is rain barrel size (), is first flush (), is the runoff coefficient, ( = average inter-event time (days)), ( = average event depth ()), and = water use (). This study modified and , in which and are calibration parameters, to adjust the performance. In this study, the roof area (), first flush (), and runoff coefficient () are set as 1 m2, 0 m, and 1, respectively, to simplify the calculation. Therefore, and units were simply presented as depth in m per unit area.
2.2. Physical Model Approach
The spreadsheet-based storage, treatment, and overflow runoff model (SS STORM) was originally developed by Lee et al. [26] to estimate the detention basin size based on storage-released performance by incorporating a linear programming optimization tool. SS STORM uses historical daily rainfall and a computer program (i.e., Excel spreadsheet) to optimize detention basin size for target water quality concentration reduction. The detailed algorithm of the SS STORM for the detention basin size estimation model is described in Lee et al. [26]. This study modified the SS STORM algorithm to estimate RWHS performance instead of the detention basin. The modified SS STORM for RWHS performance is calculated as follows:
where Precip is precipitation (mm), Runoff is runoff per unit area (mm), S1 is storage volume of the unit area before water use (mm), Stor is rain barrel size (mm), S2 is storage volume of the unit area after water use (mm), Useact is actual water use (mm), Usetarget is target water use (mm), i is the time step (daily), and Rei is the reliability of the rain barrel performance. This study exclusively developed Equations (5)–(7) to simulate RWHS performance. Table 1 shows the main features of the RWHS evaluation process between the modified SS STORM in this study and the analytical method by Guo and Baetz [11]. The modified SS STORM does not require parameter estimation but does need rainfall data and there is no limitation of the estimation of RWHS performance. However, the analytical method needs the parameter estimation from the rainfall data but does not use rainfall data itself in the calculation process. Also, it contains the estimation limitation when the denominator in Equation (2) is less than zero.
Runoffi = Precipi
S1i = min (Stor, max(0, S2i−1) + Runoffi)
Useact,i = min(S1i, Usetarget)
S2i = Useact,i − S1i
Rei = if(Useact,I = Usetarget, 1, Useact,i/Usetarget)
2.3. Rainfall Data
For this study, rainfall data were obtained from six cities in the United States: Atlanta, Chicago, Denver, Houston, Los Angeles, and New York (Table 2), using a climate data website (https://www.ncdc.noaa.gov/cdo-web/datatools). Each city is located in different rainfall zones according to [24]. Study periods for all six stations were between 1 January 1971 and 31 December 2010, and daily and hourly rainfall data were used for the modified SS STORM model and application of the analytical method, respectively. This study assumes that inter-event time definition (IETD), a criteria of rainfall events separation during rainfall data, is 12 h for all six cities. From the observed rainfall data, parameters and are the inter-event time of the rainfall events and average event rainfall depth of the rainfall events, respectively, and were estimated. These parameters were used to calculate the parameters and for RWHS performance with the analytical method in Equations (1) and (2).
This study additionally utilized the calibration parameters c and d to adjust parameter ψ and in Equations (1) and (2) from the analytical method [11] to be matched with the reliability performance with the modified SS STORM in Figure 1. Parameters c and d do not contain any physical meaning and represent nominal values. The optimizations of parameters c and d in Table 3 are calculated by the generalized reduced gradient (GRG) nonlinear method.
2.4. Evaluation of Performance Indices
The SI was estimated using a combination of reliability, resilience, and vulnerability of the water resource system; in this case, a reservoir system. This study modified the estimation method for each variable because the performance of the RWHS differs from that of a general reservoir system.
2.4.1. Evaluation of Reliability
The concept of reliability is one of the most widely used performance criteria. It is directly related to the efficiency of the system, and defined as the probability of system availability [17]. The reliability index used in this study was estimated as follows:
where i is the time step (day), n is the total time step (days), and and indicate actual water use (mm/day) and target water use (mm/day), respectively.
2.4.2. Evaluation of Resilience
Resilience indicates a system’s capacity to adapt to changing conditions [27]. Hashimoto et al. [17] suggested estimating resilience as a probability using the average deficit timesteps of a consecutive deficit period and the number of consecutive deficit periods. Moy et al. [21] focused on the maximum number of consecutive deficit events to estimate resilience. Kjeldsen and Rosbjerg [18] showed that the maximum deficit period from Moy et al. [21] is more effective at evaluating reservoir system resilience. Thus, this study chose the modified resilience evaluation method from Kjeldsen and Rosbjerg [18] and Moy et al. [21] because the resilience index should be between 0 and 1 to estimate the SI of the RWHS. The re-scaled resilience index used in this study is as follows:
where is resilience, is duration of the jth failure event, and m is the number of failure events.
2.4.3. Evaluation of Vulnerability
Vulnerability is defined as the severity of system failure [17,20]. Hashimoto et al. [17] used the mean value of deficit events to represent the vulnerability of a reservoir system. However, Moy et al. [21] and Kundzewcz and Kindler [22] concluded that the maximum value of deficit events could more effectively evaluate vulnerability. Thus, this study used the modified vulnerability estimation method from Moy et al. [21] and Kundzewcz and Kindler [22] because the RWHS has different characteristics from a reservoir system. The RWHS often reaches the maximum value of deficit, i.e., an empty RWHS, unlike a reservoir system. The modified vulnerability index used in this study is as follows:
where Vul is vulnerability, is the deficit ratio of the jth failure event (deficit water supply to target water supply), is the duration of the jth failure water supply event, and m is the number of failure events. High vulnerability (close to 1) means that system performance shows high failure severity, and low vulnerability (close to 0) indicates that system performance has low failure severity.
2.4.4. Evaluation of Sustainability
Sustainability represents the integrated performance of the system. Loucks [28] suggested estimating the SI of a reservoir system by multiplying reliability (), resilience (), and 1-vulnerability (. Sandoval-Solis et al. [20] suggested a modified SI using the geometric mean of reliability, resilience, and 1-vulnerability () because the geometric mean can estimate more precise values with scale issue. This study adopted the sustainability estimation method from [20], as follows:
where SI indicates the sustainability index.
3. Results
3.1. Verification of Modified SS STORM Model
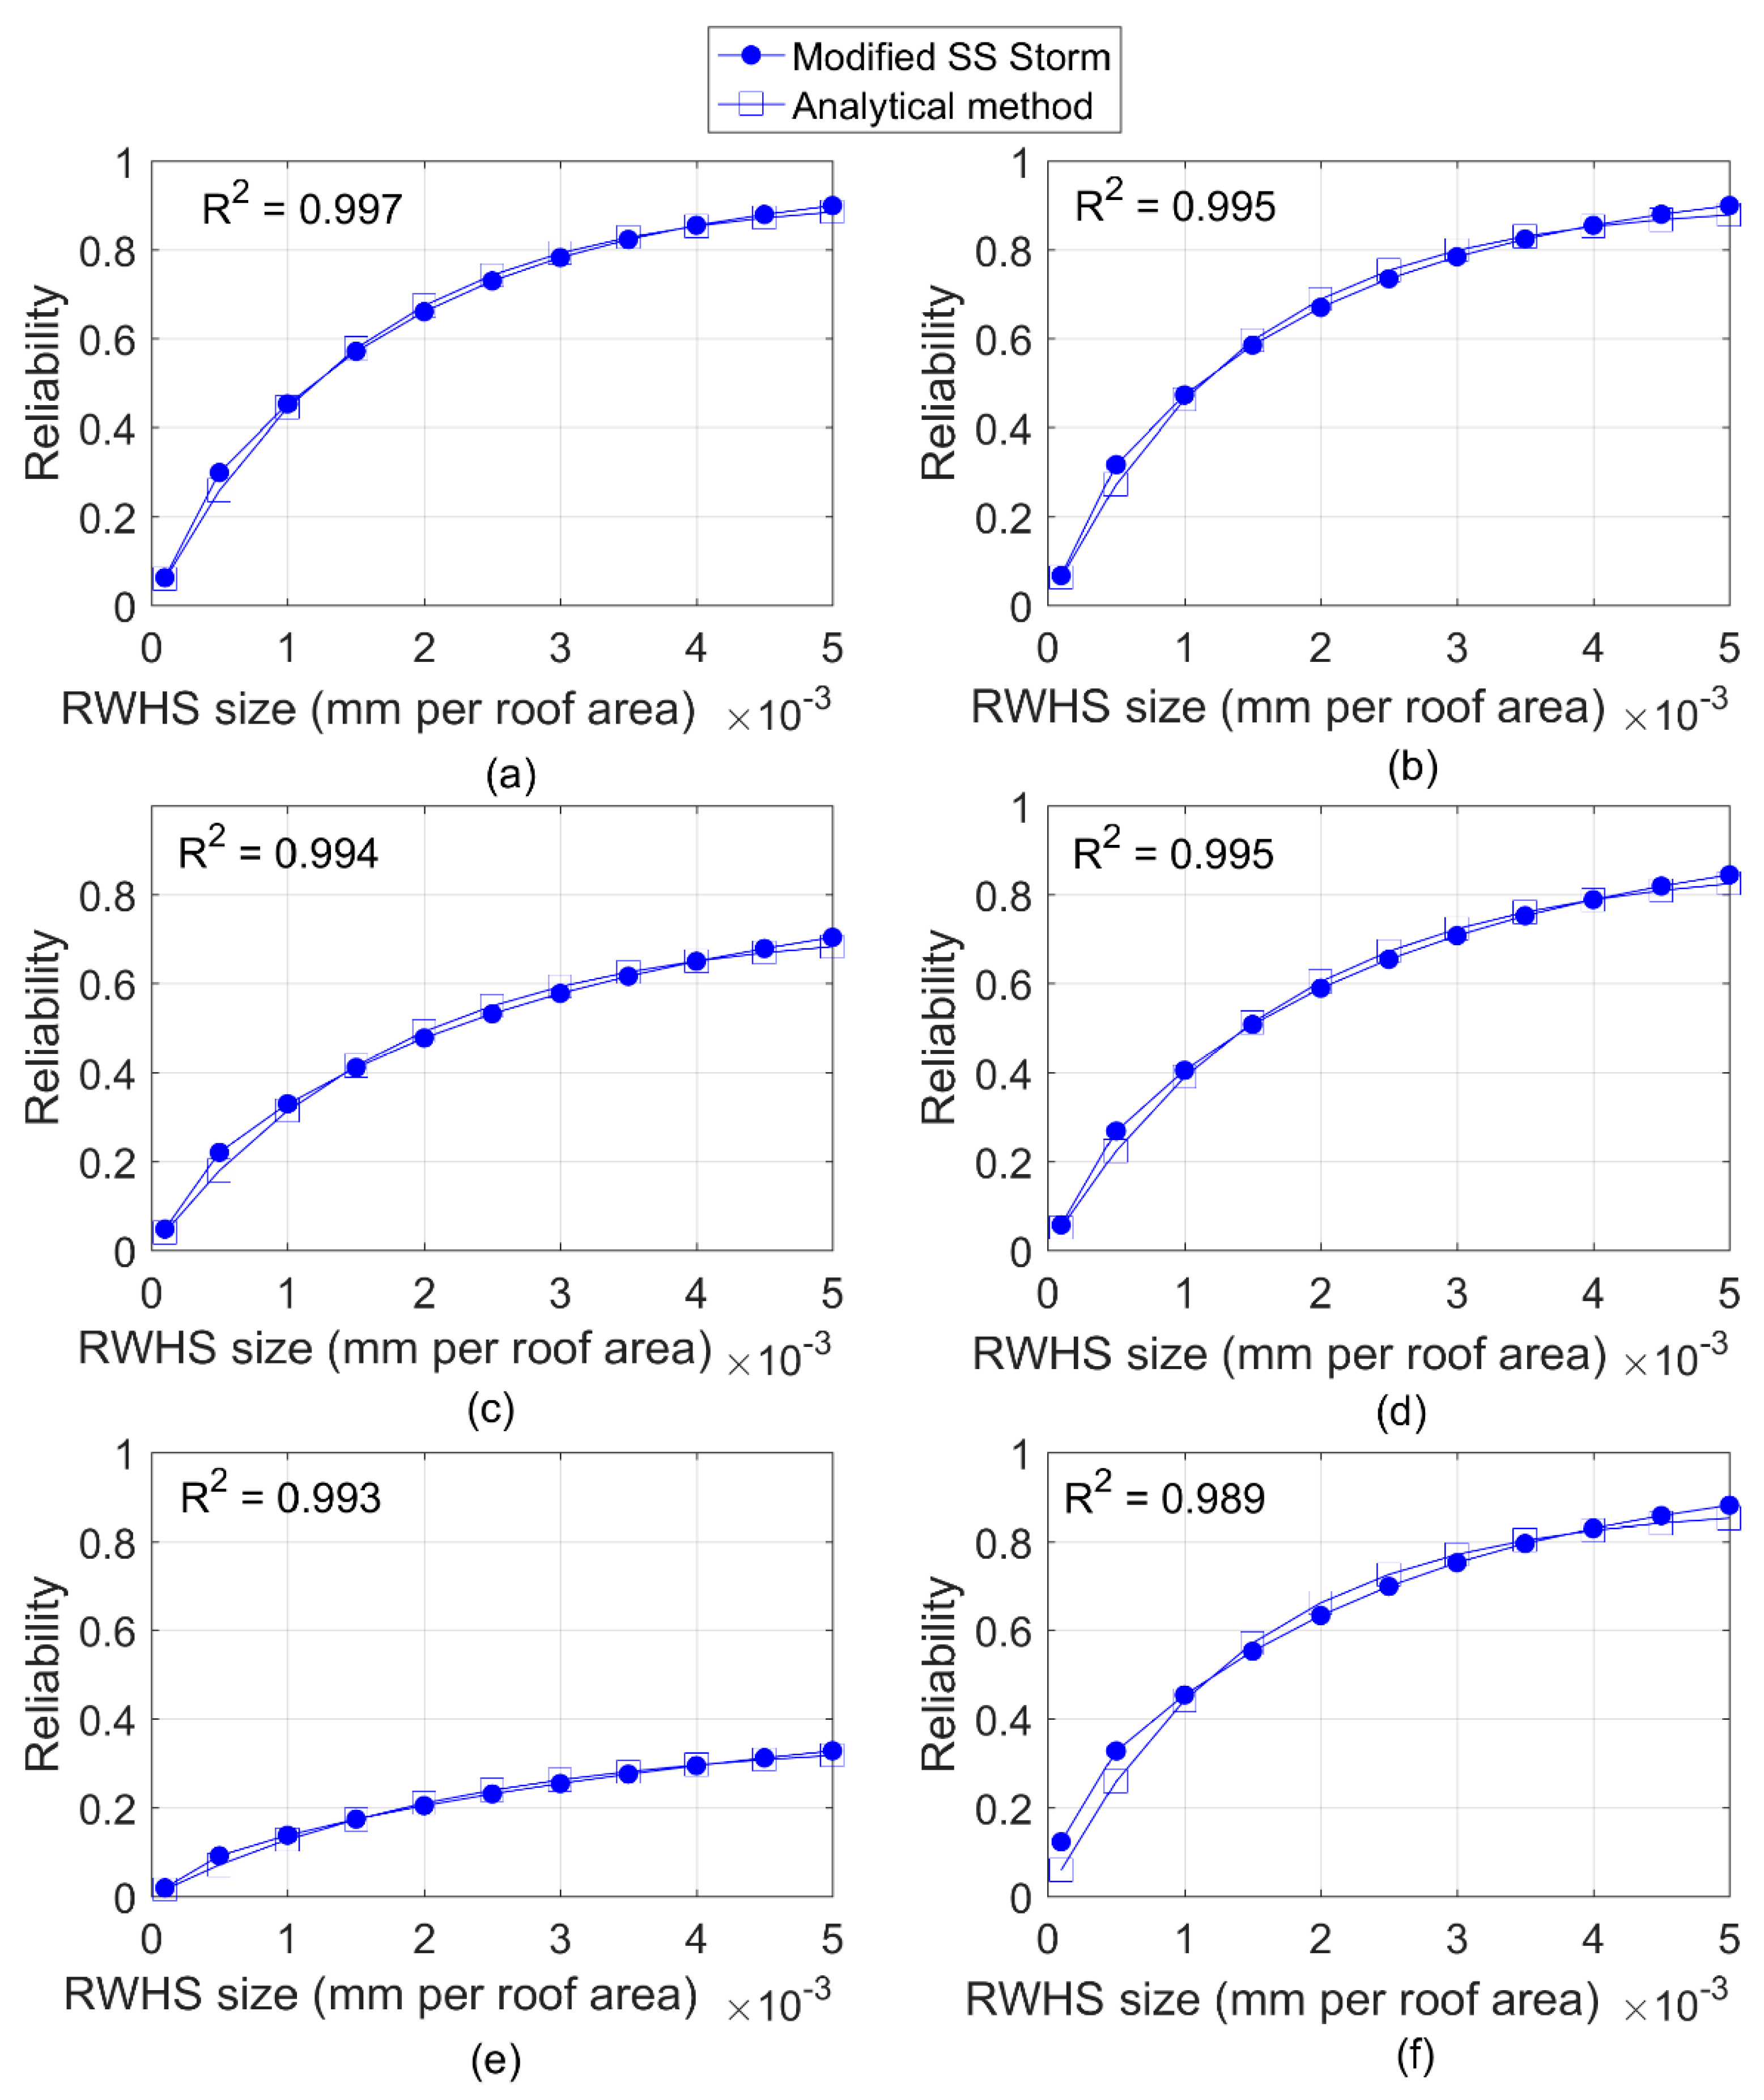
This study verified the various aspects of the modified SS STORM model performance by comparing it with the analytical method. The analytical method added two more parameters to compare with the modified SS STORM. Figure 1 shows the reliability index as a function of RWHS size between the analytical method, for parameter c and d calibration, and the modified SS STORM model. In this case, water demand is kept constant at 0.5 mm/day per roof area. To justify the reliability results of the two methods, this study applied the coefficient of determination (R2). R2 values of all cities are within 0.989–0.997. Thus, the reliability results of the modified SS STORM correlate well with those of the adjusted analytical method. The reliability index is close to 0.8 for an RWHS size of 5 mm per roof area for five of the cities. However, reliabilities in Los Angeles are relatively low, approximately 0.35 for an RWHS size of 5 mm per roof area.
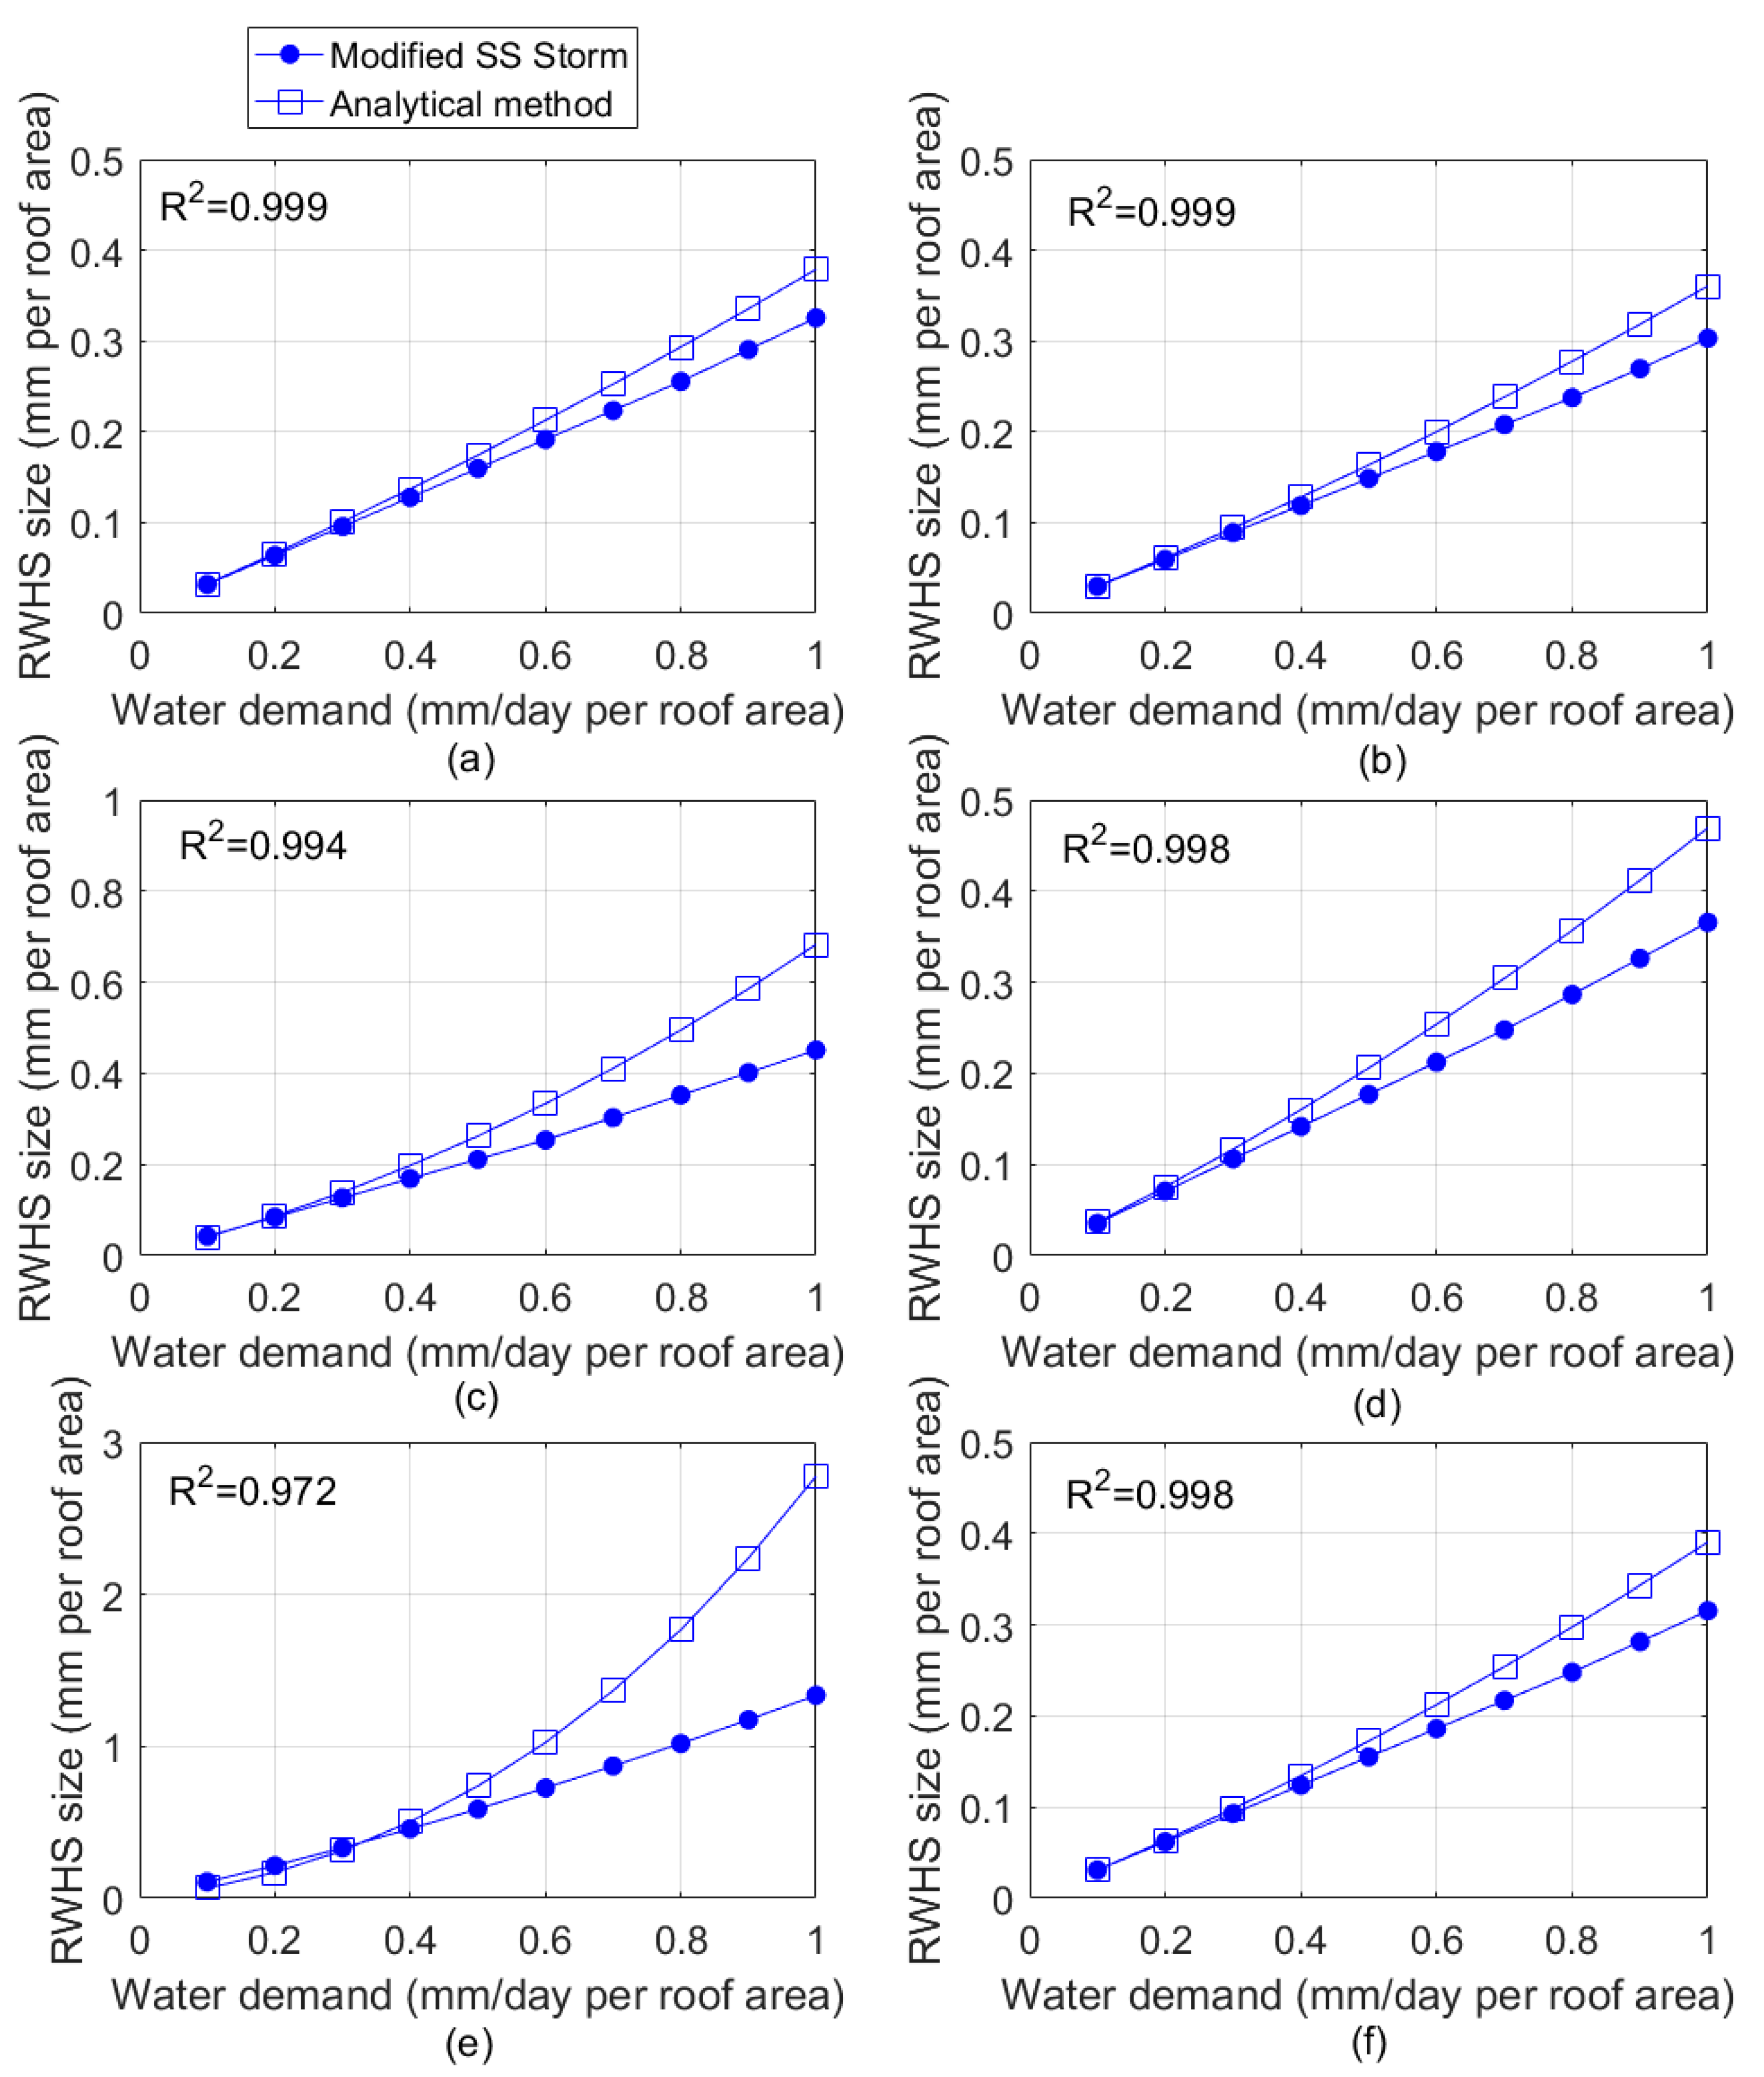
Figure 2 shows the required RWHS size as a function of water demand with a constant reliability of 0.1 for the SS STORM model and adjusted analytical method. With increasing water demand, the required RWHS size is larger in the adjusted analytical method than in the modified SS STORM model. In Los Angeles (LA), required RWHS size is twice as large in the adjusted analytical method for the maximum water demand. The RWHS size estimated by the modified SS STORM is typically more similar to the actual size because this model used the observed hourly rainfall data while the adjusted analytical method uses an exponential distribution of rainfall data.
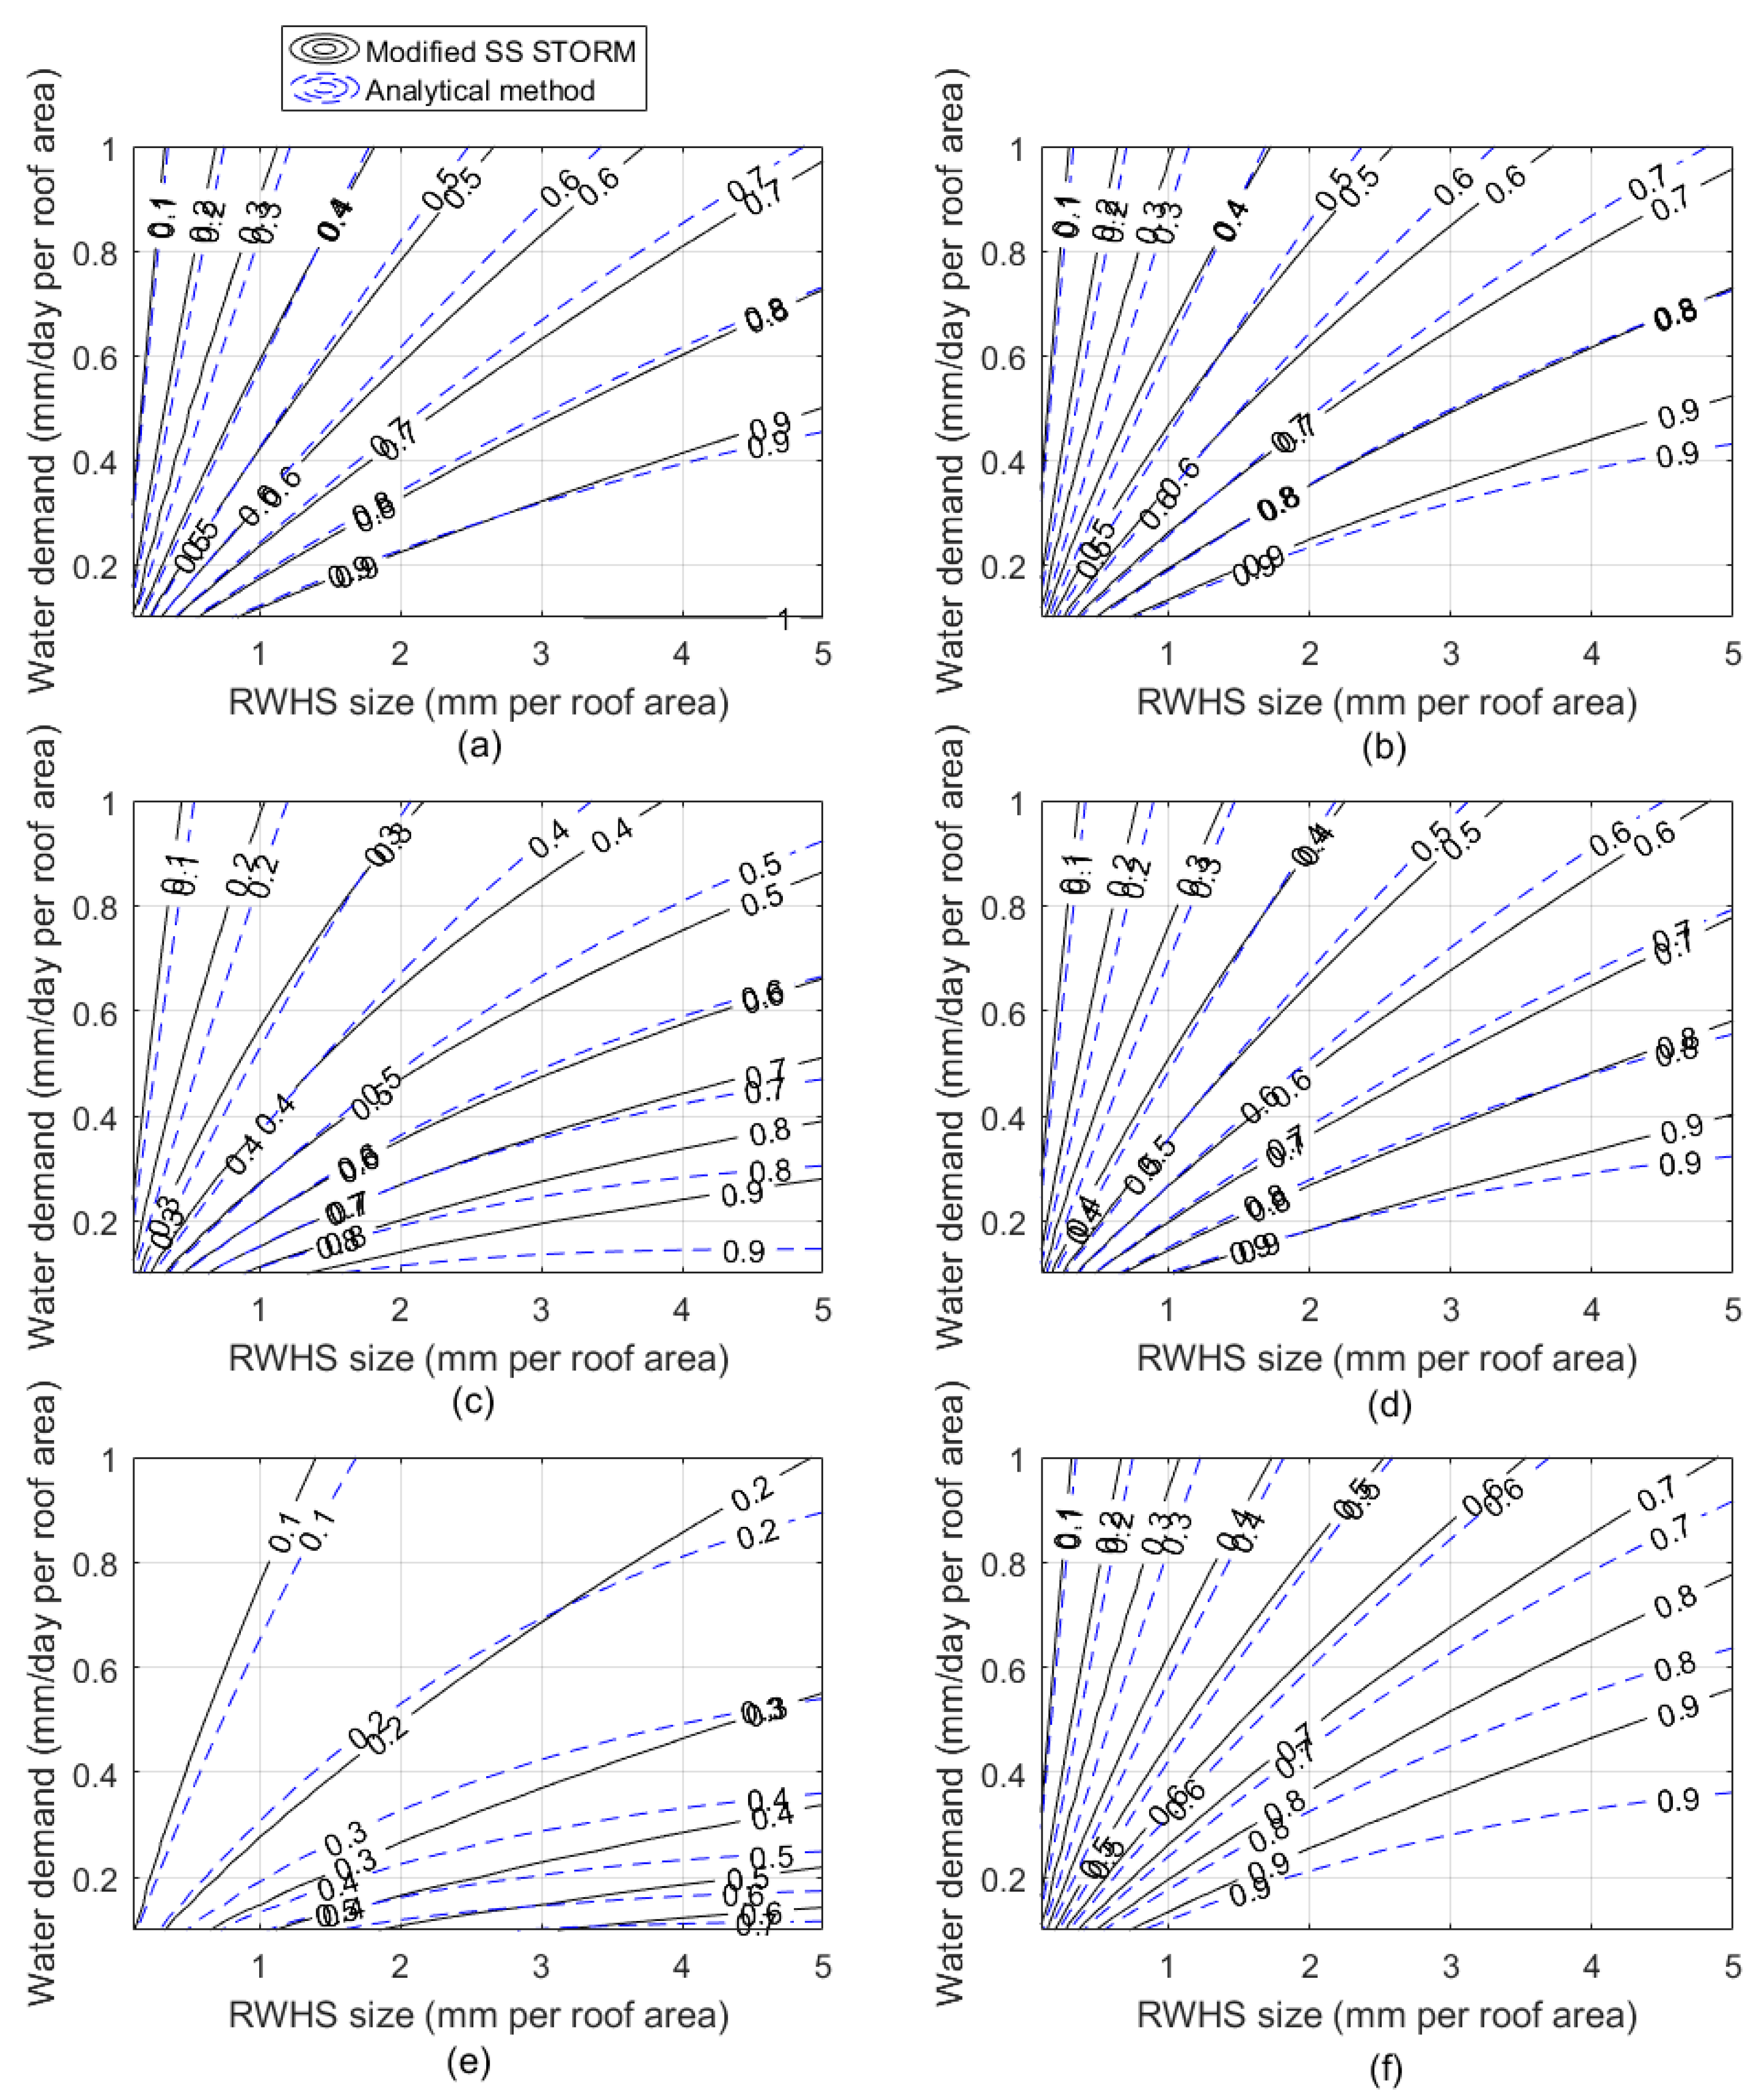
Figure 3 illustrates the reliability indices as a function of both RWHS size and water demand for both methods. Reliabilities for both methods are very similar in all six cities. However, reliability curves for the modified SS STORM model in New York (NY) are greater than those for the calibrated analytical method as reliabilities increase. Also, reliability curves in LA only range from 0.1 to 0.6 compared to 0.1 to 0.9 in the other five cities. Compared to modified SS STORM model results, the analytical method tends to require a larger RWHS size as water demand increases.
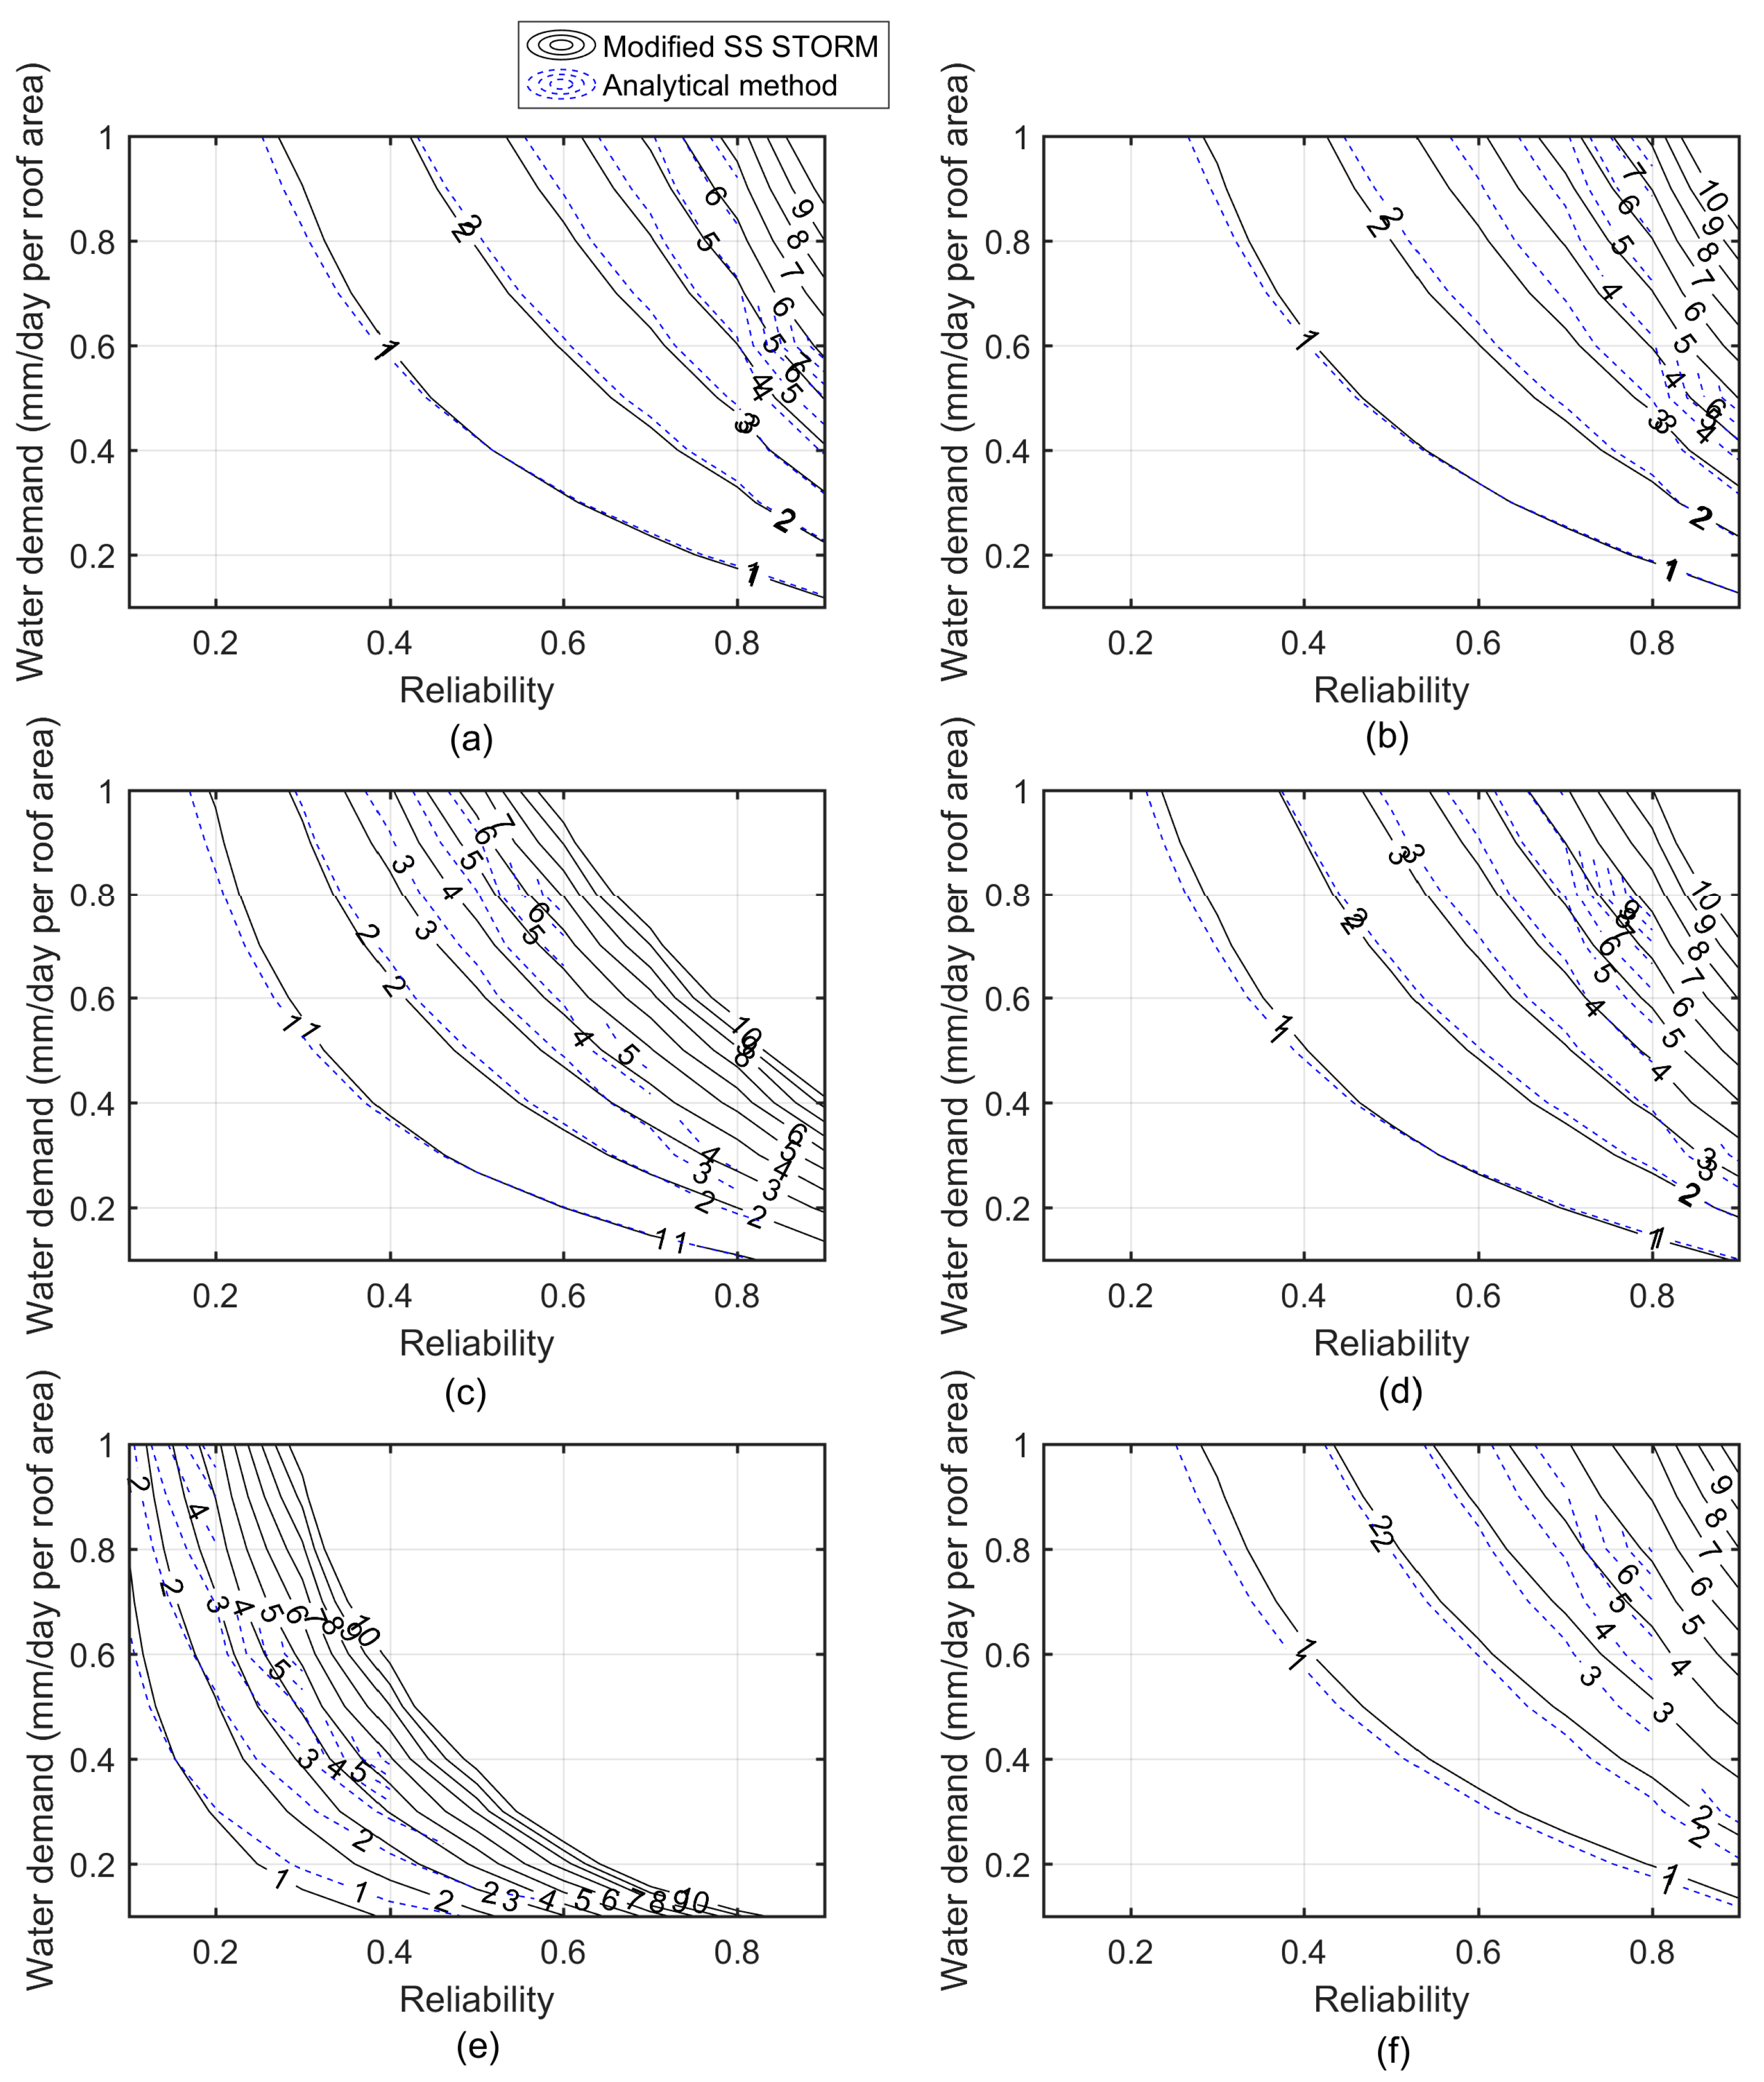
Figure 4 indicates the required RWHS size as a function of both reliability and water demand for the two RWHS performance methods. The required RWHS size increases as reliability and water demand increase. The maximized required RWHS in Atlanta, Chicago, Houston, and New York is approximately 10 mm per roof area, and the maximum required RWHS in LA is much greater than 10 mm per roof area. The required RWHS sizes are very similar according to both methods. However, the analytical method has limitations in calculation of the required RWHS. The required RWHS size in Equation (2) cannot be calculated if is equal to or smaller than . Figure 1, Figure 2, Figure 3 and Figure 4 show that the RWHS results in LA are different to the other five cities. Although LA and Denver have similar annual rainfall depths, RWHS performance in Denver is more like that in Atlanta, Chicago, Houston, and NY than LA. This implies that the long inter-event time and low average storm event depth has a greater effect on RWHS performance than low annual rainfall depth. Except for the results shown in Figure 2e, Figure 1, Figure 2, Figure 3 and Figure 4 show that the modified SS STORM model effectively represents RWHS performance as calculated by the adjusted analytical method.
3.2. Evaluation of RWHS Sustainability
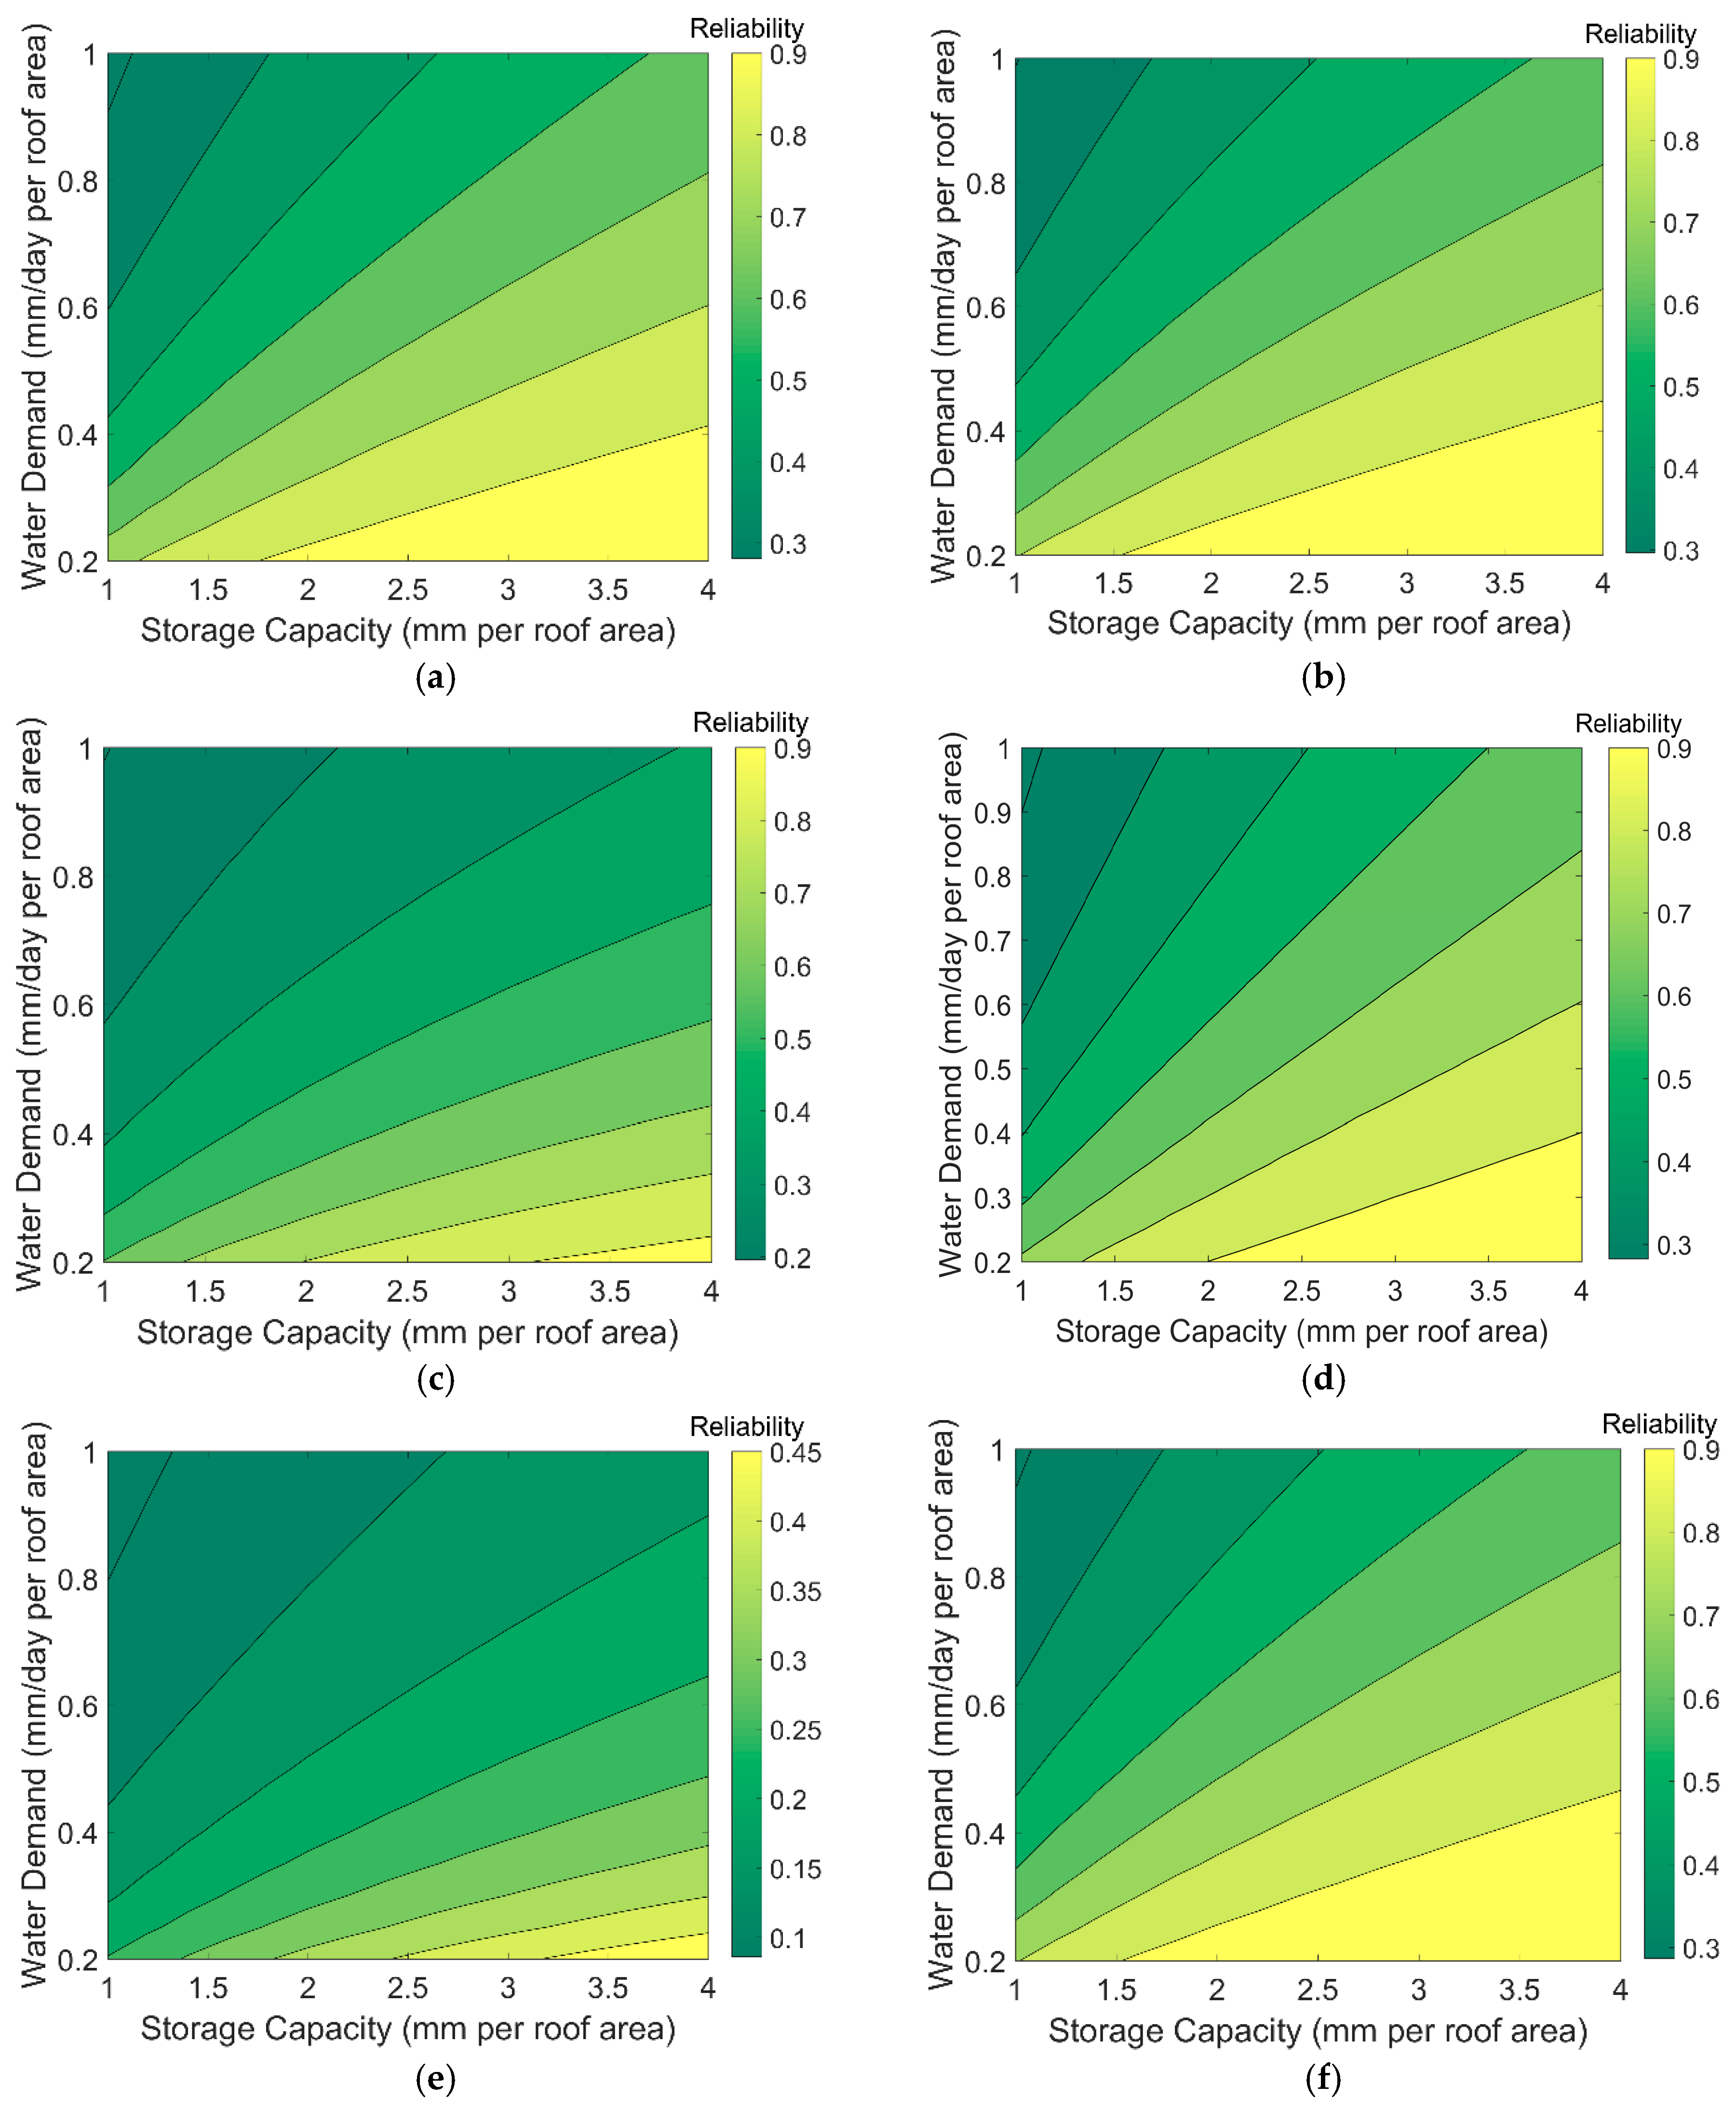
This study evaluated the reliability, resilience, and vulnerability and utilized three indices to evaluate sustainability indices of RWHS performance using the modified SS STORM. Higher scores for reliability, resilience, and a lower vulnerability score denotes greater RWHS sustainability, as shown in Equation (11). Figure 5 shows the reliability of the RWHS as a function of both storage capacity and water demand in six cities. Generally, reliabilities increase as storage capacity increases or water demand decreases. Five cities show reliability values from 0.2–0.9 with a storage capacity of 1.0–4.0 mm per roof area, and a water demand from 0.2–1.0 mm/day per roof area. Reliability values in LA, however, range from 0.1–0.45 for the same conditions. The range of the reliability index is wider than that of the other indices.
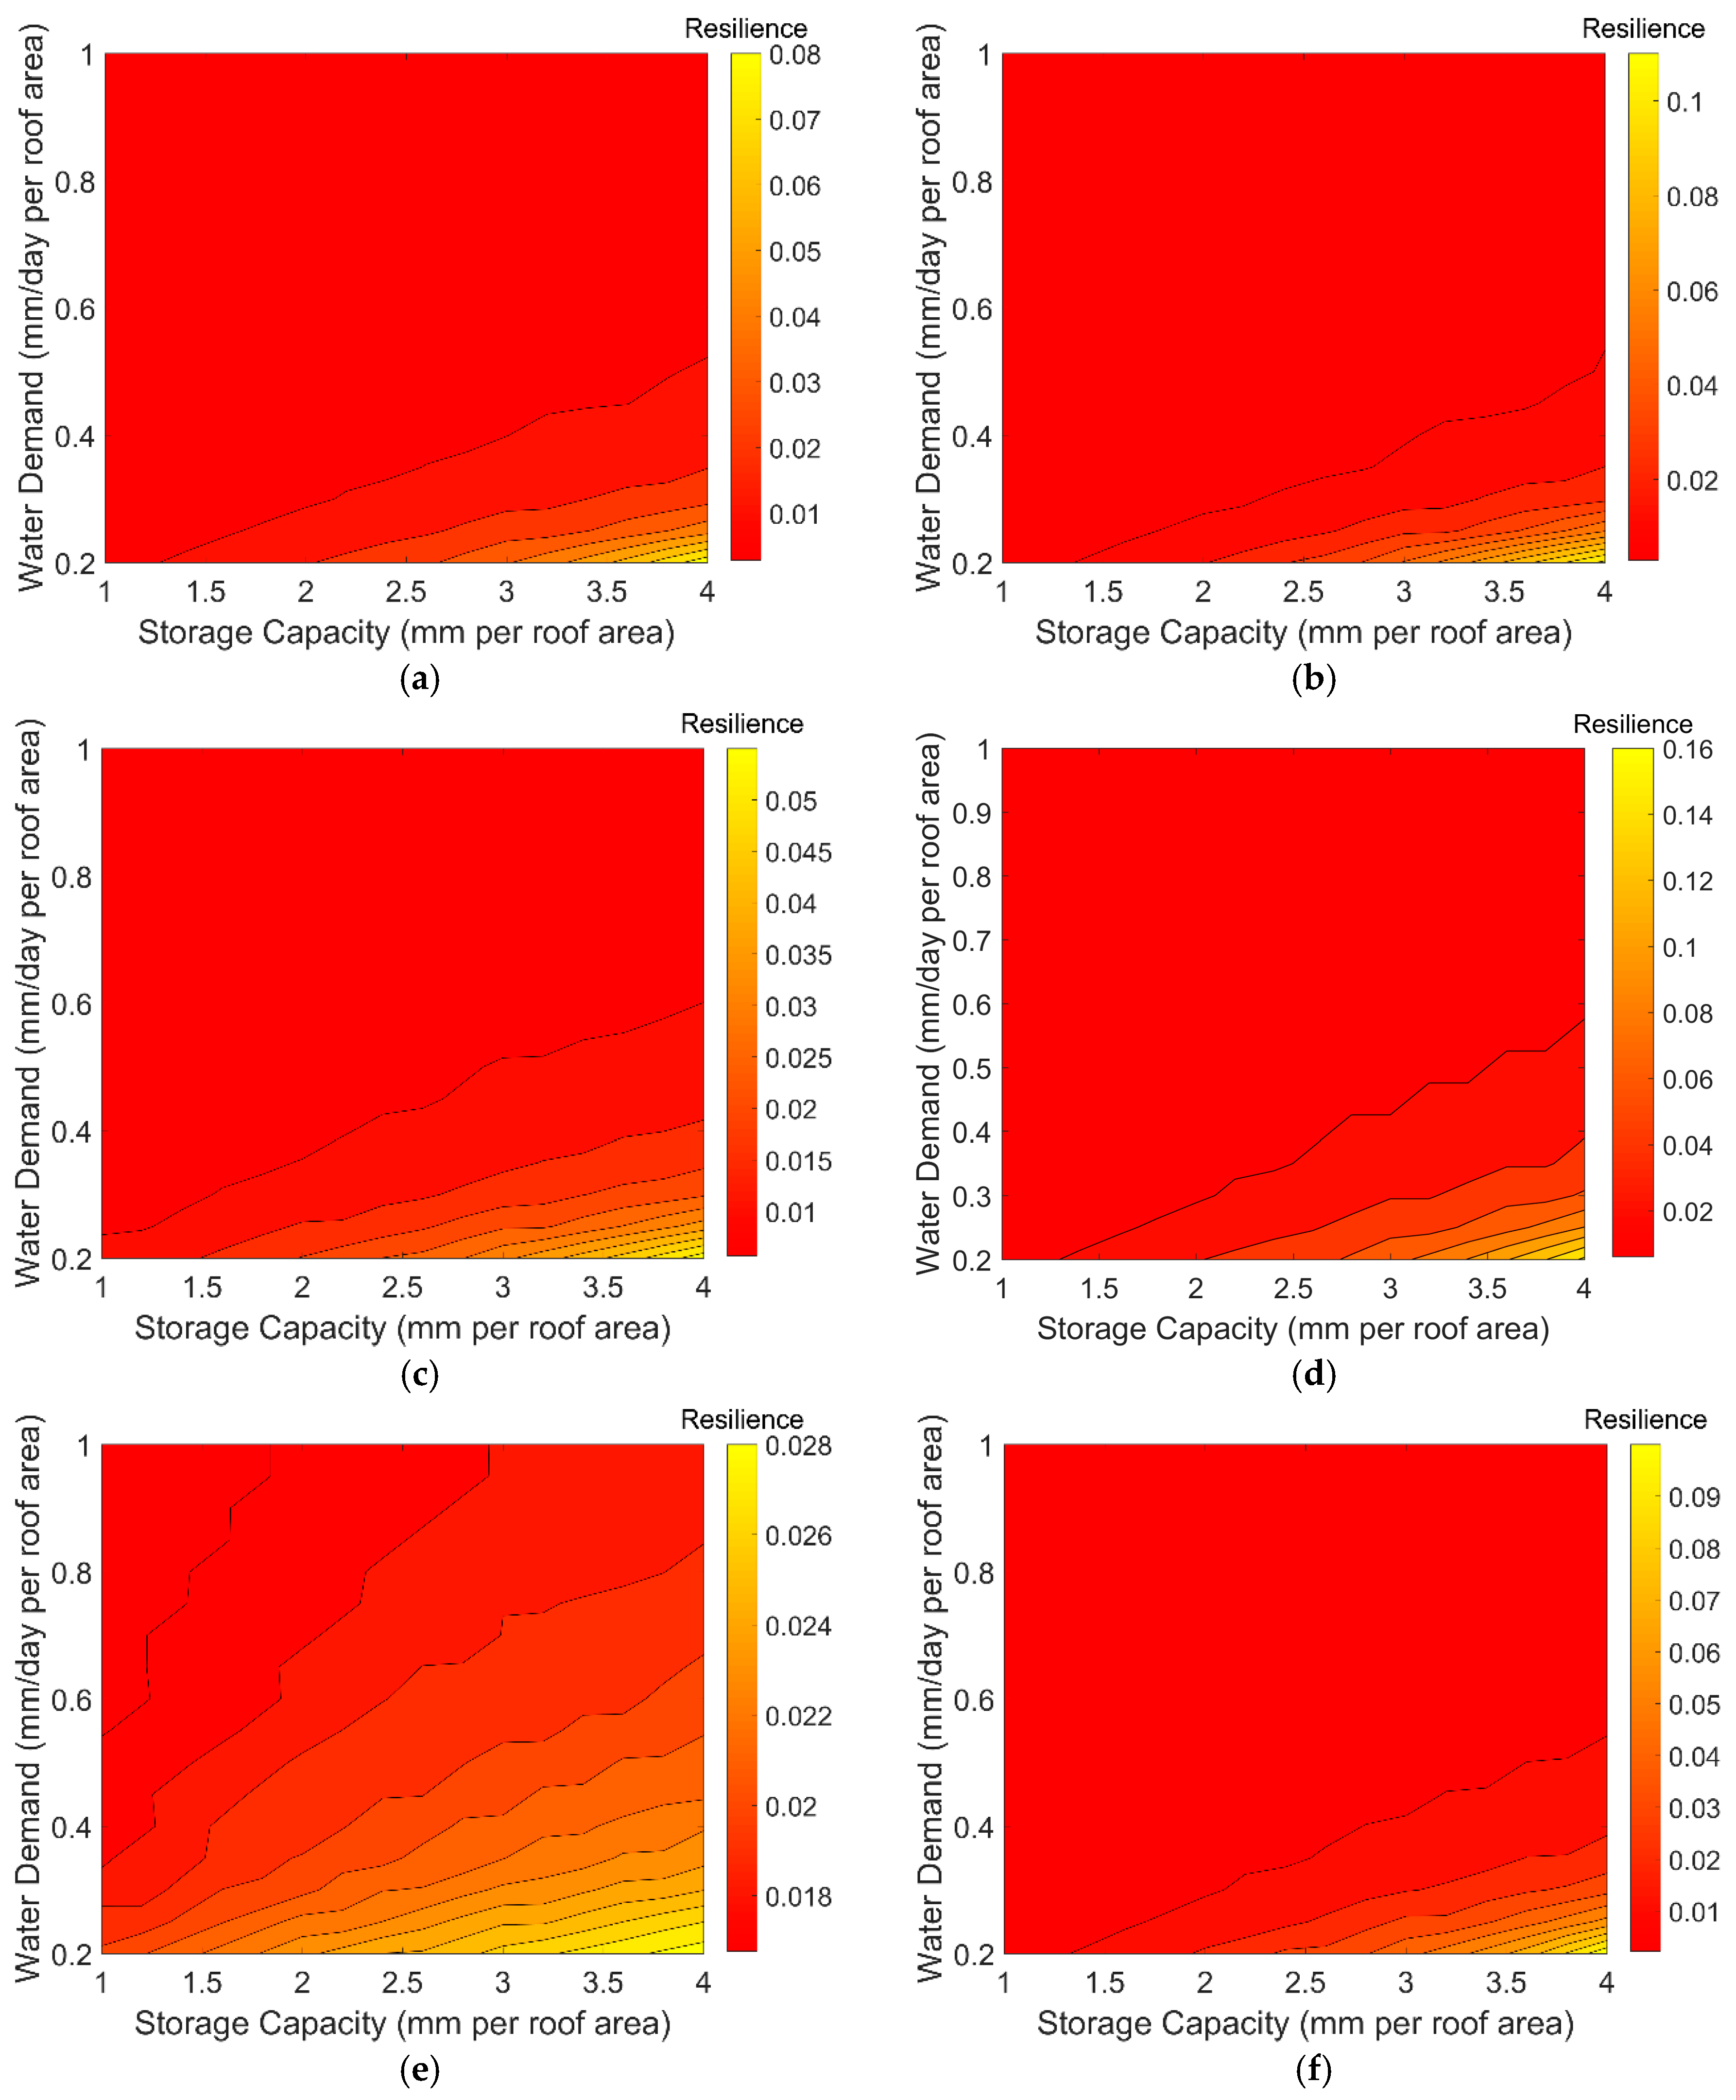
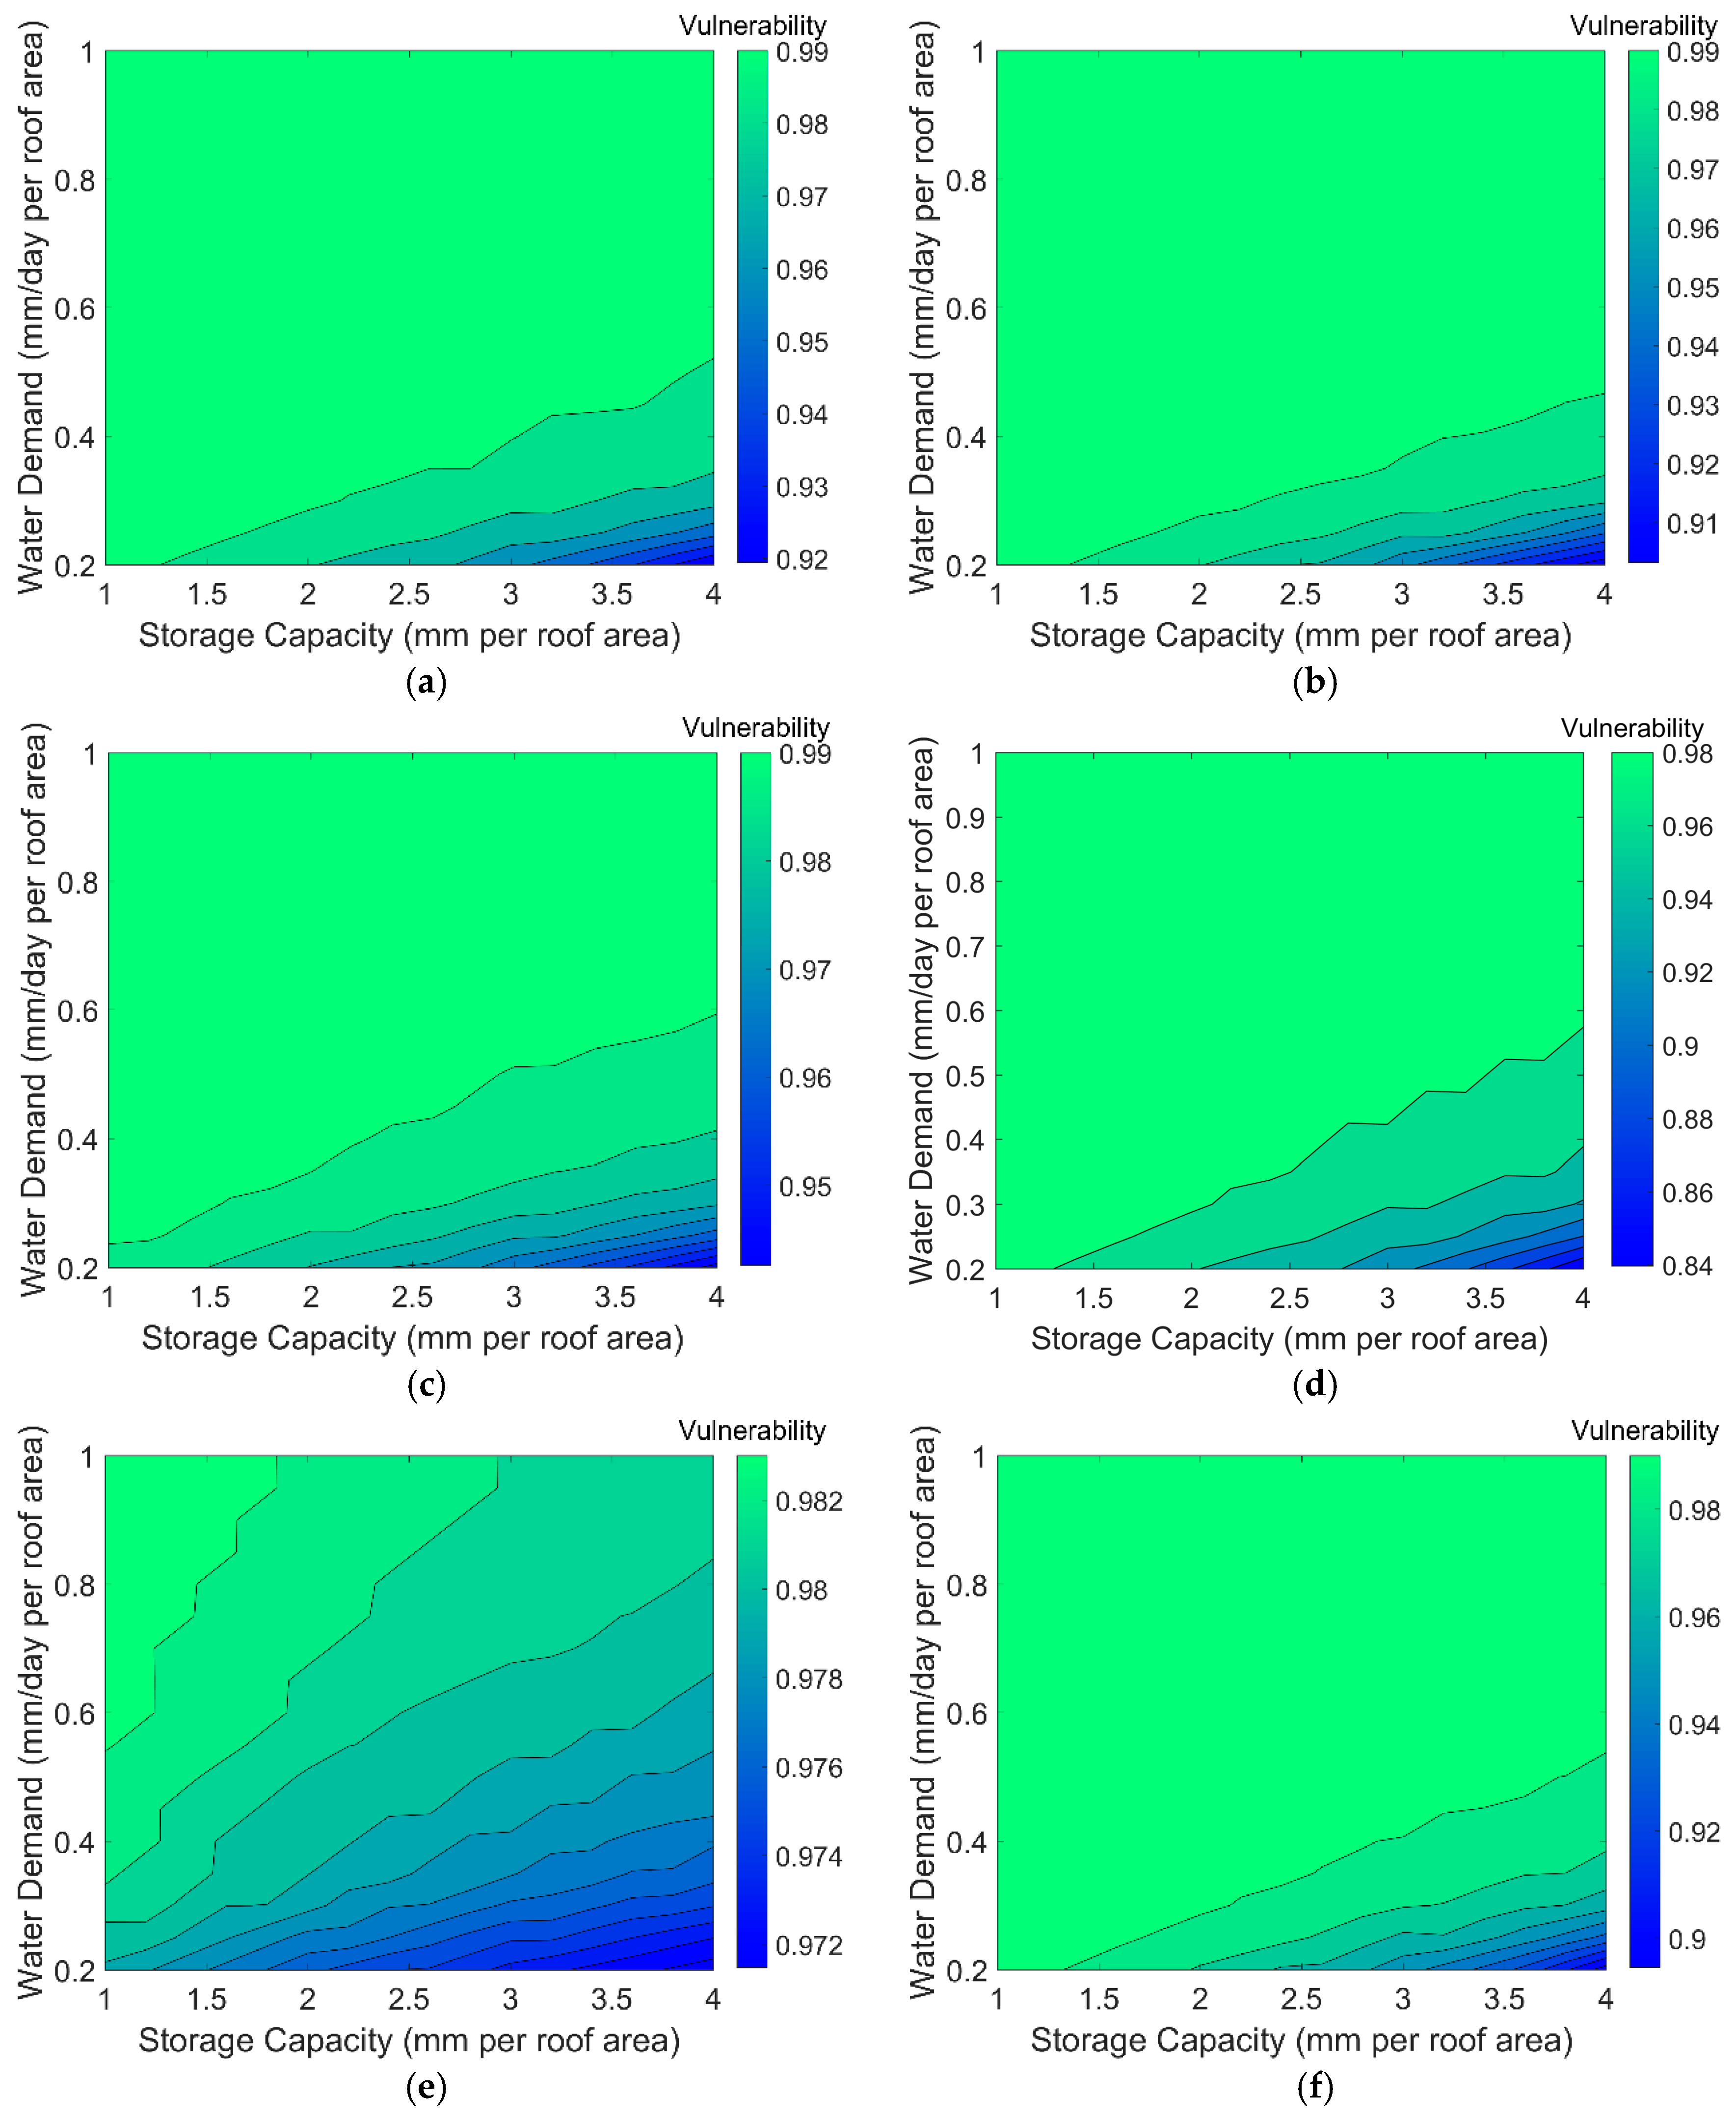
Figure 6 and Figure 7 represent the resilience and vulnerability indexes, respectively, of RWHS performance as a function of both storage capacity and water demand. Resilience increases as storage capacity increases or water demand decreases, indicating the same trend as reliability. Resilience values in Atlanta, Chicago, Houston, and NY range are approximately 0.0–0.16, and approximately 0.0–0.05 in Denver. Resilience values in LA are approximately 0.0–0.028. Overall, the resilience index changes less than the reliability index. In Figure 7, high vulnerability indicates that the RWHS is weak. Vulnerability ranges from 0.84 to 0.99, except in LA, where it varies from 0.97–0.974. The range of vulnerability values is small (0.84–1.0), similar to the range of resilience index (0.0–0.16).
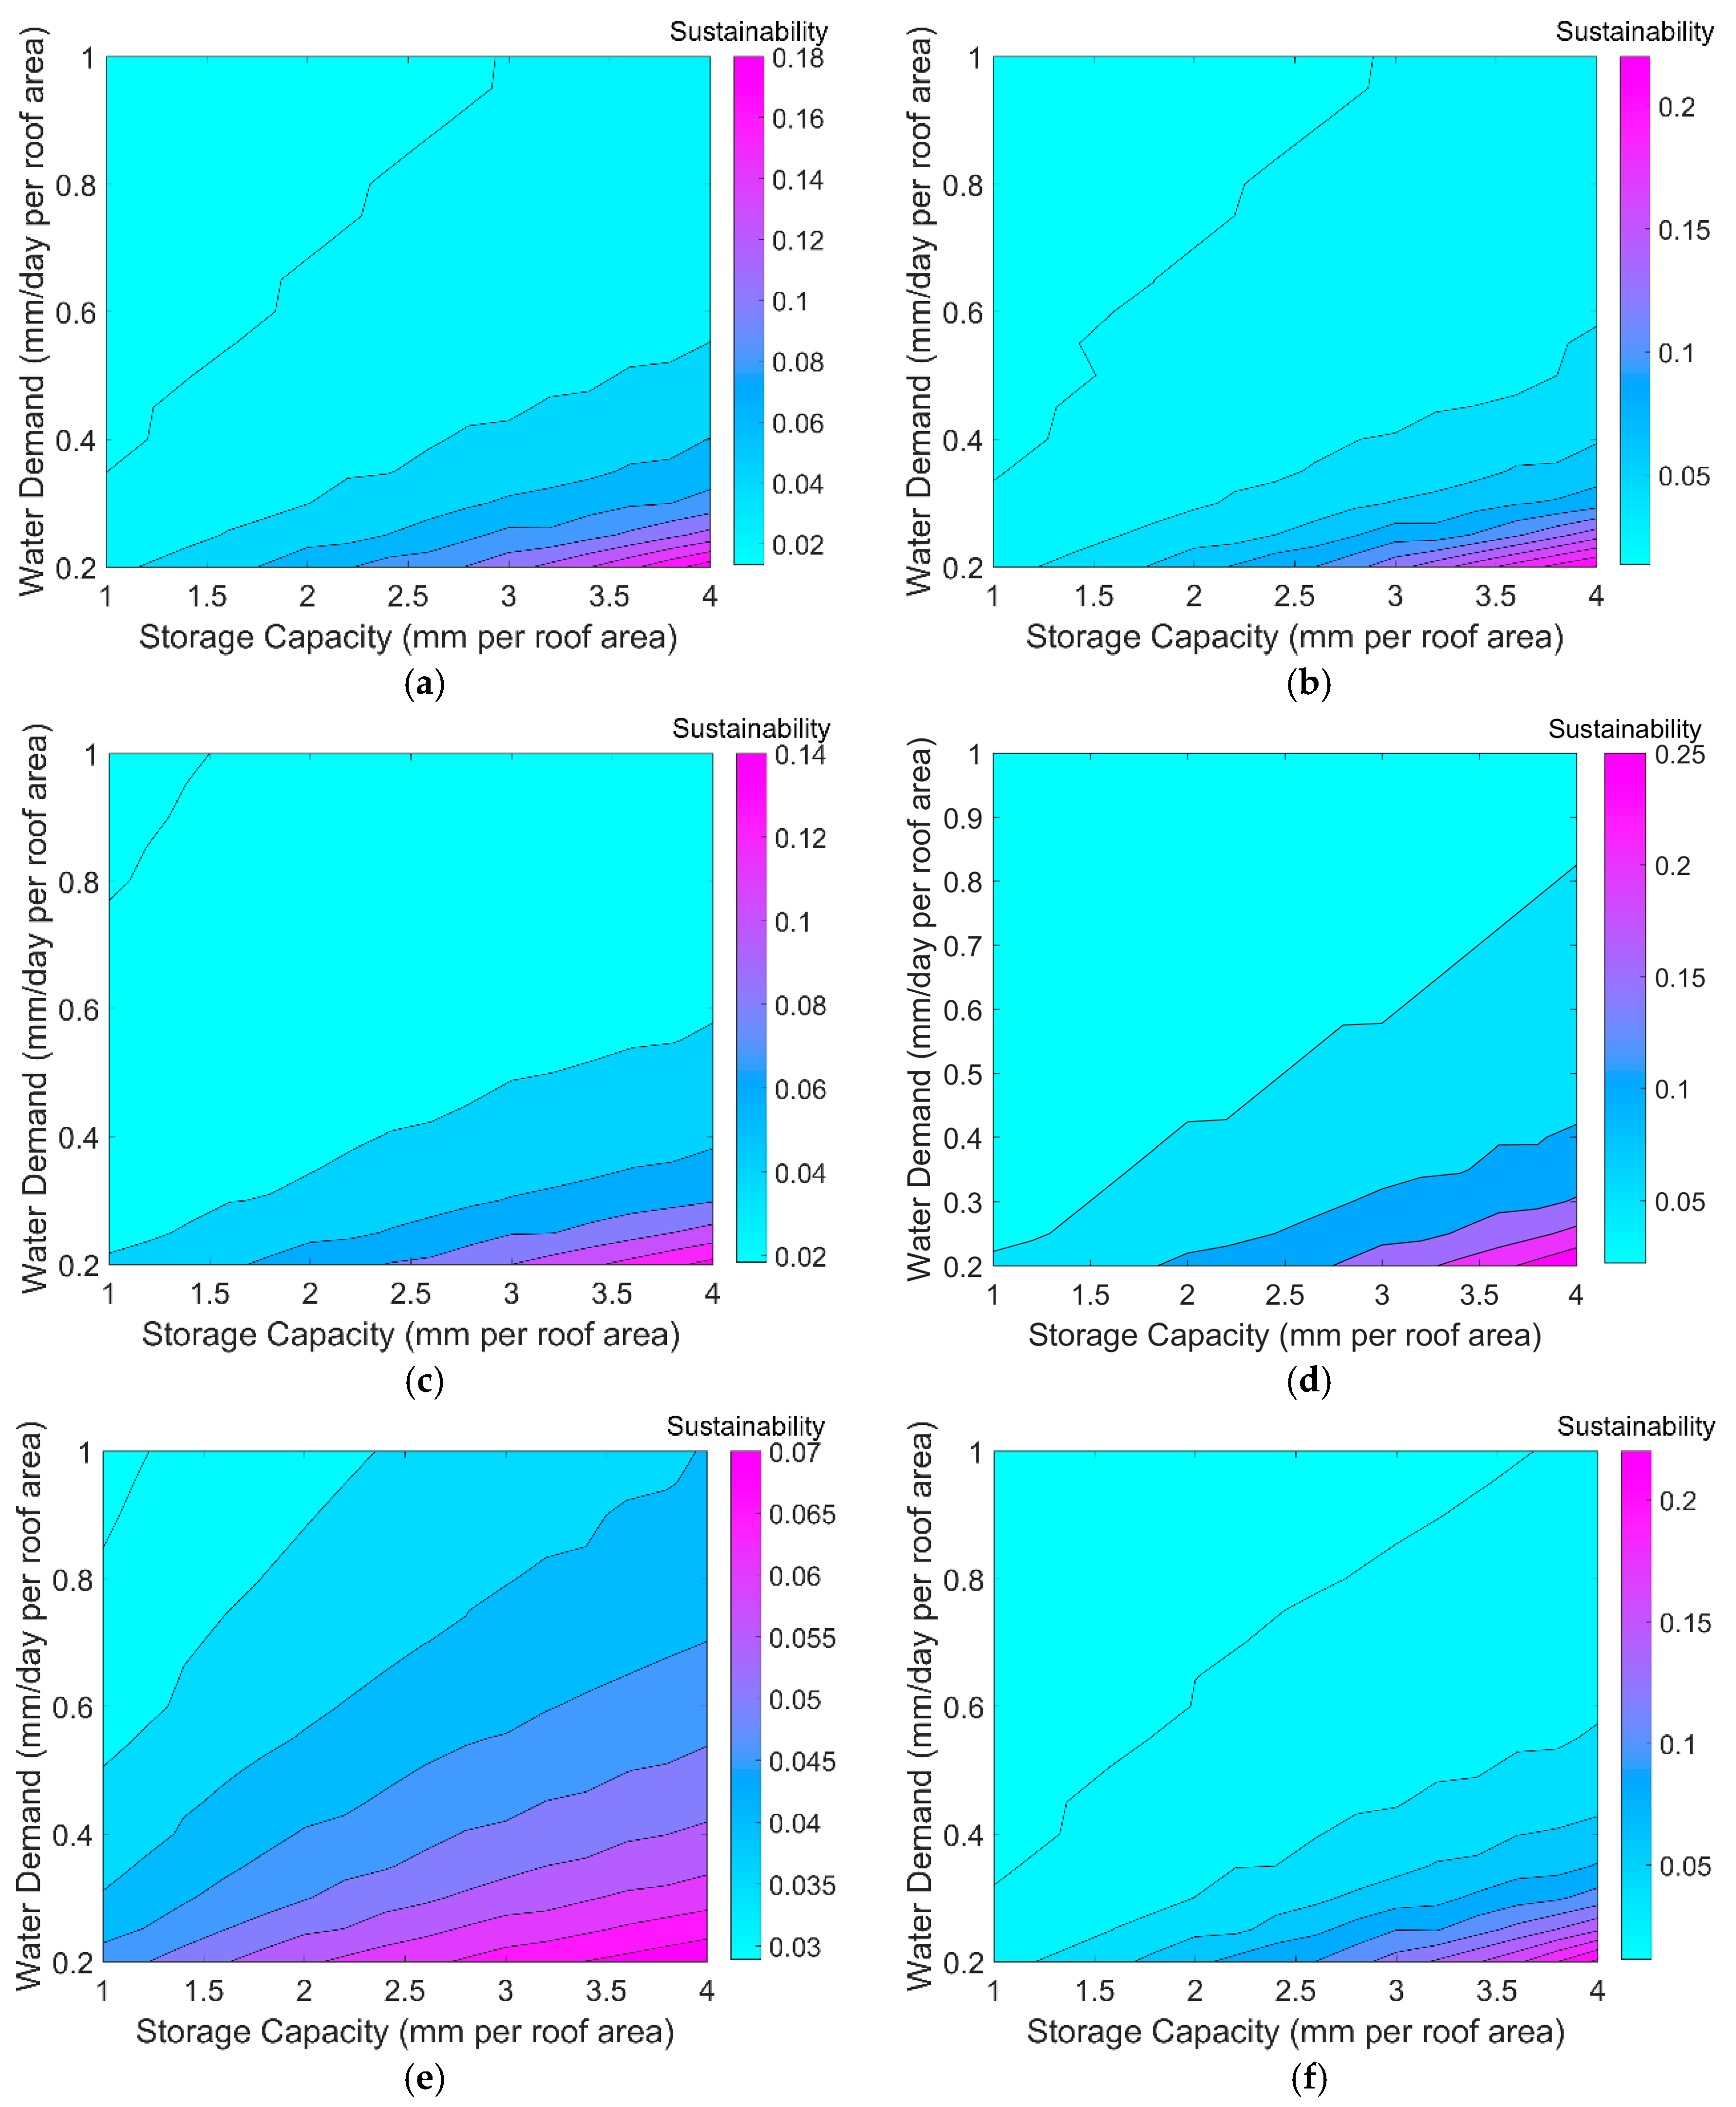
Figure 8 shows the sustainability of RWHS performance as a function of both storage capacity and water demand. Sustainability increases as storage capacity increases and water demand decreases in all six cities. Sustainability in Atlanta, Chicago, Houston, and NY is approximately 0.02–0.25, approximately 0.02–0.14 in Denver, and approximately 0.03–0.07 in LA. Particularly, reliability in LA (0.1–0.45) in Figure 5 and resilience in Denver (0–0.06) in Figure 6 are relatively narrower than the reliability of five cities (0.2–0.9, 0–0.16). Also, Denver and LA (0.94–0.99) in Figure 7 show comparatively higher vulnerabilities than the other four cities (0.84–0.99). These differences induced the difference of the sustainability indices. Also, range of the reliability is widely distributed in all six sites. However, ranges of the resilience and vulnerability indices are different from each city and narrower than the range of the reliability. Thus, the resilience and vulnerability are more effective on sustainability indices than the reliability. Overall, sustainability varies from 0–0.25, which is a wider range than those of resilience and vulnerability, and narrower than the range of reliability values. The cities are categorized with three groups based on the SI: Atlanta, Chicago, Houston, and NY; Denver; and LA. These categories are analyzed according to resilience and vulnerability rather than reliability because of their similar value range. These groups are related to rainfall characteristics. Particularly, annual rainfall, inter-event time of the rainfall events, and average event rainfall depth give a great effect for RWHS SI in Table 2. As annual rainfall and average event rainfall depth increase, the scale of the RWHS SI increases. On the contrary, the scale of the RWHS SI increases as the inter-event time of the rainfall events decreases. Therefore, Atlanta, Chicago, Houston, and NY have higher sustainability indices than Denver and LA.
5. Conclusions
This study developed a new RWHS performance model by the modified SS STORM and verified it through comparison with an analytical method based on a statistical distribution and the rational method. We then investigated the impact of RWHS size and water demand on the sustainability indices including reliability, resilience, and vulnerability. We confirmed a generally good correlation between the analytical method and the modified SS STORM in the six studied cities, which represent different rainfall characteristics. However, the results of the analytical method and the modified SS STORM do not match in LA, which is characterized by a long inter-event time and low rainfall event depths. Furthermore, the analytical method used in this study has limitations evaluating the required RWHS size.
This study modified the evaluation methods for resilience and vulnerability indexes to evaluate the sustainability of RWHS performance in six US cities. Reliability, resilience, and sustainability indices increase—but vulnerability decreases—as RWHS size increases and water demand decreases. Vulnerability represents the inverse concept of other indices. Consequently, the sustainability of RWHS performance increases with increasing reliability and resilience and with decreasing vulnerability. Sustainability values differ according to the rainfall characteristics of the six cities. As annual rainfall decreases, the SI of the RWHS decreases. Based on the results of this study, LA region requires greater roof area and lower water demand per household to increase sustainability indices compared with the other five cities because this area is a semi-arid area and annual rainfall is very low.
This study applied SI, which has been developed by the reservoir system, to the RWHS and evaluates the sustainability of RWHS performance as a function of both RWHS size and water demand. However, this study did not analyze sustainability as a function of roof area because the performance of the modified SS STORM assumed that the roof area was a unit area. For further study, it is necessary to confirm the effect of roof area on modified SS STORM performance by comparing it with other performance models. This study suggested modified methods for resilience and vulnerability evaluations for the RWHS because the existing methods are only applicable for the reservoir system. However, it is necessary that the modified resilience and vulnerability evaluation method for wide application because this study only applied the modified resilience and vulnerability evaluation methods to six cities. Moreover, the modified resilience and vulnerability evaluation methods need to improve that the range of resilience and vulnerability values should be equally distributed from 0 to 1, but the results of this study show narrow ranges from 0.01 to 0.1 and from 0.9 to 0.99 for resilience and vulnerability indices, respectively.
Acknowledgments
This paper was supported by Konkuk University in 2015.
Author Contributions
Daeryong Park and Myoung-Jin Um conceived and designed the research, performed the model simulations, analyzed the data, and wrote the paper together. Authorship must be limited to those who have contributed substantially to the work reported.
Conflicts of Interest
The authors declare no conflict of interest.
References
- Albrechtsen, H.-J. Microbiological investigations of rainwater and graywater collected for toilet flushing. Water Sci. Technol. 2002, 46, 311–316. [Google Scholar] [PubMed]
- Hilten, R.N.; Lawrence, T.M.; Tollner, E.W. Modeling stormwater runoff from green roofs with hydrus-1d. J. Hydrol. 2008, 358, 288–293. [Google Scholar] [CrossRef]
- Petrucci, G.; Deroubaix, J.-F.; De Gouvello, B.; Deutsch, J.-C.; Bompard, P.; Tassin, B. Rainwater harvesting to control stormwater runoff in suburban areas. An experimental case-study. Urban Water J. 2012, 9, 45–55. [Google Scholar] [CrossRef] [Green Version]
- Sazakli, E.; Alexopoulos, A.; Leotsinidis, M. Rainwater harvesting, quality assessment and utilization in kefalonia island, greece. Water Res. 2007, 41, 2039–2047. [Google Scholar] [CrossRef] [PubMed]
- Villarreal, E.L.; Dixon, A. Analysis of a rainwater collection system for domestic water supply in ringdansen, norrköping, sweden. Build. Environ. 2005, 40, 1174–1184. [Google Scholar] [CrossRef]
- Woltersdorf, L.; Jokisch, A.; Kluge, T. Benefits of rainwater harvesting for gardening and implications for future policy in namibia. Water Policy 2014, 16, 124–143. [Google Scholar] [CrossRef]
- Zhang, Y.; Chen, D.; Chen, L.; Ashbolt, S. Potential for rainwater use in high-rise buildings in Australian cities. J. Environ. Manag. 2009, 91, 222–226. [Google Scholar] [CrossRef] [PubMed]
- Basinger, M.; Montalto, F.; Lall, U. A rainwater harvesting system reliability model based on nonparametric stochastic rainfall generator. J. Hydrol. 2010, 392, 105–118. [Google Scholar] [CrossRef]
- Fewkes, A.; Butler, D. Simulating the performance of rainwater collection and reuse systems using behavioural models. Build. Serv. Eng. Res. Technol. 2000, 21, 99–106. [Google Scholar] [CrossRef]
- Ghisi, E.; Montibeller, A.; Schmidt, R.W. Potential for potable water savings by using rainwater: An analysis over 62 cities in southern Brazil. Build. Environ. 2006, 41, 204–210. [Google Scholar] [CrossRef]
- Guo, Y.P.; Baetz, B.W. Sizing of rainwater storage units for green building applications. J. Hydrol. Eng. 2007, 12, 197–205. [Google Scholar] [CrossRef]
- Jenkins, D.; Pearson, F. Feasibility of Rainwater Collection Systems in California. Contribution-California; California Water Resources Center, University of California: Oakland, CA, USA, 1978. [Google Scholar]
- Mitchell, V.G. How important is the selection of computational analysis method to the accuracy of rainwater tank behaviour modelling? Hydrol. Process. 2007, 21, 2850–2861. [Google Scholar] [CrossRef]
- Seo, Y.; Choi, N.J.; Park, D. Effect of connecting rain barrels on the storage size reduction. Hydrol. Process. 2012, 26, 3538–3551. [Google Scholar] [CrossRef]
- Hanson, L.; Vogel, R. Generalized storage-reliability-yield relationships for rainwater harvesting systems. Environ. Res. Lett. 2014, 9, 303–327. [Google Scholar] [CrossRef]
- Sample, D.J.; Liu, J. Optimizing rainwater harvesting systems for the dual purposes of water supply and runoff capture. J. Clean. Prod. 2014, 75, 174–194. [Google Scholar] [CrossRef]
- Hashimoto, T.; Stedinger, J.R.; Loucks, D.P. Reliability, resiliency, and vulnerability criteria for water resource system performance evaluation. Water Resour. Res. 1982, 18, 14–20. [Google Scholar] [CrossRef]
- Kjeldsen, T.R.; Rosbjerg, D. Choice of reliability, resilience and vulnerability estimators for risk assessments of water resources systems. Hydrol. Sci. J. 2004, 49, 755–767. [Google Scholar] [CrossRef]
- McMahon, T.A.; Adeloye, A.J.; Zhou, S.L. Understanding performance measures of reservoirs. J. Hydrol. 2006, 324, 359–382. [Google Scholar] [CrossRef]
- Sandoval-Solis, S.; McKinney, D.C.; Loucks, D.P. Sustainability index for water resources planning and management. J. Water Resour. Plan. Manag. 2011, 137, 381–390. [Google Scholar] [CrossRef]
- Moy, W.S.; Cohon, J.L.; ReVelle, C.S. A programming model for analysis of the reliability, resilience, and vulnerability of a water supply reservoir. Water Resour. Res. 1986, 22, 489–498. [Google Scholar] [CrossRef]
- Kundzewicz, Z.W.; Kindler, J. Multiple Criteria for Evaluation of Reliability Aspects of Water Resource Systems; IAHS Publication: Wallingford, UK, 1995; pp. 217–224. [Google Scholar]
- Asefa, T.; Adams, A.; Kajtezovic-Blankenship, I. A tale of integrated regional water supply planning: Meshing socio-economic, policy, governance, and sustainability desires together. J. Hydrol. 2014, 519, 2632–2641. [Google Scholar] [CrossRef]
- US EPA. Methodology for Analysis of Detention Basins for Control of Urban Runoff Quality; The Office of Water, and Nationwide Urban Runoff Program: Washington, DC, USA, 1986.
- Adams, B.; Papa, F. Urban Stormwater Management Planning with Analytical Probabilistic Models; John Wiley & Sons: Hoboken, NJ, USA, 2000. [Google Scholar]
- Lee, J.G.; Heaney, J.P.; Lai, F.H. Optimization of integrated urban wet-weather control strategies. J. Water Resour. Plan. Manag. 2005, 131, 307–315. [Google Scholar] [CrossRef]
- World Health Organization (WHO). Summary and Policy Implications Vision 2030: The Resilience of Water Supply and Sanitation in the Face of Climate Change; World Health Organization: Geneva, Switzerland, 2009. [Google Scholar]
- Loucks, D.P. Quantifying trends in system sustainability. Hydrol. Sci. J. 1997, 42, 513–530. [Google Scholar] [CrossRef]
Figure 1.
Calibration of reliability results as a function of RWHS size with constant water demand (0.5 mm/day per roof area) between the modified SS STORM model and the analytical method of [11] for (a) Atlanta, (b) Chicago, (c) Denver, (d) Houston, (e) Los Angeles, and (f) New York.
Figure 1.
Calibration of reliability results as a function of RWHS size with constant water demand (0.5 mm/day per roof area) between the modified SS STORM model and the analytical method of [11] for (a) Atlanta, (b) Chicago, (c) Denver, (d) Houston, (e) Los Angeles, and (f) New York.

Figure 2.
Verification of rainwater harvesting system (RWHS) size results as functions of water demand with constant reliability (=0.1) between the modified SS Storm and the analytical method by Guo and Baetz [11] in six cities: (a) Atlanta, (b) Chicago, (c) Denver, (d) Houston, (e) Los Angeles, and (f) New York.

Figure 3.
Verification of reliability results as a function of RWHS size and water demand for the modified SS STORM model proposed in this study and the analytical method of [11]. (a) Atlanta; (b) Chicago; (c) Denver; (d) Houston; (e) Los Angeles; and (f) New York.
Figure 3.
Verification of reliability results as a function of RWHS size and water demand for the modified SS STORM model proposed in this study and the analytical method of [11]. (a) Atlanta; (b) Chicago; (c) Denver; (d) Houston; (e) Los Angeles; and (f) New York.

Figure 4.
Verification of required RWHS size (mm per roof area) as a function of water demand and the reliability between the modified SS STORM and the analytical method by Guo and Baetz [11] for (a) Atlanta, (b) Chicago, (c) Denver, (d) Houston, (e) Los Angeles, and (f) New York.
Figure 4.
Verification of required RWHS size (mm per roof area) as a function of water demand and the reliability between the modified SS STORM and the analytical method by Guo and Baetz [11] for (a) Atlanta, (b) Chicago, (c) Denver, (d) Houston, (e) Los Angeles, and (f) New York.

Figure 5.
Reliability of rainwater harvesting systems as a function of rainwater harvesting storage capacity and water demand in (a) Atlanta, (b) Chicago, (c) Denver, (d) Houston, (e) Los Angeles, and (f) New York.
Figure 5.
Reliability of rainwater harvesting systems as a function of rainwater harvesting storage capacity and water demand in (a) Atlanta, (b) Chicago, (c) Denver, (d) Houston, (e) Los Angeles, and (f) New York.

Figure 6.
Resilience of RWHS as a function of storage capacity and water demand in (a) Atlanta, (b) Chicago, (c) Denver, (d) Houston, (e) Los Angeles, and (f) New York.
Figure 6.
Resilience of RWHS as a function of storage capacity and water demand in (a) Atlanta, (b) Chicago, (c) Denver, (d) Houston, (e) Los Angeles, and (f) New York.

Figure 7.
Vulnerability of RWHS as a function of storage capacity and water demand in (a) Atlanta, (b) Chicago, (c) Denver, (d) Houston, (e) Los Angeles, and (f) New York.
Figure 7.
Vulnerability of RWHS as a function of storage capacity and water demand in (a) Atlanta, (b) Chicago, (c) Denver, (d) Houston, (e) Los Angeles, and (f) New York.

Figure 8.
Sustainability of rainwater harvesting systems as function of rainwater harvesting storage capacity and water demand in six cities; (a) Atlanta, (b) Chicago, (c) Denver, (d) Houston, (e) Los Angeles, and (f) New York.
Figure 8.
Sustainability of rainwater harvesting systems as function of rainwater harvesting storage capacity and water demand in six cities; (a) Atlanta, (b) Chicago, (c) Denver, (d) Houston, (e) Los Angeles, and (f) New York.


Table 1.
Comparison of the modified spreadsheet-based storage, treatment, and overflow runoff model (SS STORM) and the analytical method.
Table 1.
Comparison of the modified spreadsheet-based storage, treatment, and overflow runoff model (SS STORM) and the analytical method.
| Features | The Modified SS STORM | The Analytical Method [11] |
|---|---|---|
| Calculation Procedure | Does not need the parameter estimations | Needs to estimate , from rainfall data |
| rainfall data use | It is necessary | It is not necessary |
| Calculation limitation | Sometimes occur | Does not occur |
Table 2.
Analysis of observed rainfall events in the six studied cities.
| Features | Atlanta | Chicago | Denver | Houston | Los Angeles | New York |
|---|---|---|---|---|---|---|
| COOP ID | 090451 | 111549 | 052220 | 414300 | 045114 | 305803 |
| Station Name | Atlanta Hartsfield International Airport | Chicago O’Hare International Airport | Denver Stapleton | Houston International Airport | Los Angeles International Airport | JFK International Airport |
| Latitude | 33.6301 | 41.995 | 39.7633 | 29.98 | 33.938 | 40.6386 |
| Longitude | −84.4418 | −87.9336 | −104.8694 | −95.36 | −118.3888 | −73.7622 |
| Period | 1 January 1971~31 December 2010 | 1 January 1971~31 December 2010 | 1 January 1971~31 December 2010 | 1 January 1971~31 December 2010 | 1 January 1971~31 December 2010 | 1 January 1971~31 December 2010 |
| (days) | 3.939 | 2.690 | 5.944 | 4.052 | 11.303 | 3.824 |
| () | 0.017 | 0.013 | 0.010 | 0.015 | 0.010 | 0.014 |
| Average annual precipitation () | 1262 | 937 | 396 | 1239 | 378 | 1087 |
Table 3.
Parameters and using the calibration parameters c and d for the analytical method.
| Parameters | Atlanta | Chicago | Denver | Houston | Los Angeles | New York |
|---|---|---|---|---|---|---|
| c | 0.050 | 0.028 | 0.051 | 0.044 | 0.037 | 0.049 |
| d | 0.321 | 0.194 | 0.070 | 0.199 | 0.036 | 0.172 |
| (days) | 0.013 | 0.010 | 0.009 | 0.011 | 0.003 | 0.013 |
| () | 19.4 | 15.1 | 6.8 | 13.6 | 3.7 | 12.3 |
© 2018 by the authors. Licensee MDPI, Basel, Switzerland. This article is an open access article distributed under the terms and conditions of the Creative Commons Attribution (CC BY) license (http://creativecommons.org/licenses/by/4.0/).
Share and Cite
MDPI and ACS Style
Park, D.; Um, M.-J. Sustainability Index Evaluation of the Rainwater Harvesting System in Six US Urban Cities. Sustainability 2018, 10, 280. https://0-doi-org.brum.beds.ac.uk/10.3390/su10010280
AMA Style
Park D, Um M-J. Sustainability Index Evaluation of the Rainwater Harvesting System in Six US Urban Cities. Sustainability. 2018; 10(1):280. https://0-doi-org.brum.beds.ac.uk/10.3390/su10010280
Chicago/Turabian StylePark, Daeryong, and Myoung-Jin Um. 2018. "Sustainability Index Evaluation of the Rainwater Harvesting System in Six US Urban Cities" Sustainability 10, no. 1: 280. https://0-doi-org.brum.beds.ac.uk/10.3390/su10010280
Note that from the first issue of 2016, this journal uses article numbers instead of page numbers. See further details here.