The Diffusion Effect of MSW Recycling


1
Department of Health Care Management, National Taipei University of Nursing and Health Sciences, Taipei 108, Taiwan
2
Department of Business Administration, HungKuo Delin University of Technology, New Taipei City 236, Taiwan
3
Department of Business Administration, National Central University, Taoyuan City 320, Taiwan
*
Authors to whom correspondence should be addressed.
Sustainability 2018, 10(1), 40; https://0-doi-org.brum.beds.ac.uk/10.3390/su10010040
Submission received: 26 October 2017
/
Revised: 6 December 2017
/
Accepted: 21 December 2017
/
Published: 25 December 2017
(This article belongs to the Collection Trends in Municipal Solid Waste Management)
Abstract
:The purpose of this paper is to compare the recycling performance for some waste fractions selected including food waste, bulk waste, paper, metal products, plastics/rubber and glass products and then to develop some directions for the future improvements. The priority of each waste fraction for recycling is also analyzed by using an importance-performance analysis. Traditionally, the recycling rate that is calculated by the ratio of waste recycled to waste collected is used as an indicator to measure recycling performance. Due to a large variation among waste fractions in municipal solid waste (MSW), the recycling rate cannot reflect the actual recycling performance. The ceiling of recycling rate for each waste fraction estimated from the diffusion models is incorporated into a model to calculate recycling performance. The results show that (1) the diffusion effect exists significantly for the recycling of most recyclables but no evidence is found to support the diffusion effect for the recycling of food waste and bulk waste; (2) the recycling performance of waste metal products ranks the top, compared to waste paper, waste glass and other waste fractions; (3) furthermore, an importance-performance analysis (IPA) is employed to analyze the priority of recycling programs and thus this paper suggests that the recycling of food waste should be seen as the most priority item to recycle.
1. Introduction
Due to resources scarcity and environmental concerns, the recycling of municipal solid waste (MSW) is considered to be an effective tool for waste management to sustain development and thus becomes more important in reducing resource scarcity in a growing society [1,2]. Waste recycling in general yields some benefits: resource recovery, the saving of MSW disposal and transportation costs, the assurance of environmental cleaning and the extension of the life spans of MSW disposal facilities. And thus, an improvement in MSW recycling performance should be focused in addition to the efficiency enhancement of MSW management relating to MSW disposal facilities [3,4,5].
The principles of “reduce, recycle, reuse” has been accepted as a top guide for the management of municipal solid waste (MSW) in Taiwan. The MSW recycling has increased 33 folds over the period of 1998–2016, increasing from 111,753 tons in 1998 to 3,690,910 tons in 2016. And thus, the first purpose of this paper is to analyze the recycling performance of some waste fractions selected. Traditionally, the recycling rate is used as an indicator to measure recycling performance. However, recycling rate is calculated by the ratio of waste recycled to waste collected. Such a measure seems not possible to reflect the actual performance of recycling because the amount of each waste fraction in MSW varies greatly. And thus, a new formula is developed in this paper to calculate recycling performance by incorporating the ceiling of recycling rates that is estimated and obtained by the diffusion model presented in this article. This paper also evaluates the relative recycling performance among some waste fractions and then to develop some directions for the future improvements. The priority of each waste fraction for recycling is also analyzed by using an importance-performance analysis.
Most articles examine the impacts of household or citizen behaviors on MSW recycling [6,7], or compare the education programs to increase public participation in recycling program [8,9]. Many researchers emphasize that the environmental education can promote the improvement of recycling rate for encouraging the public to participate in the recycling programs. On the other hand, some researchers focus on the economic and social factors, which affect the success of recycling programs [10,11].
Very few papers highlight the diffusion effect in affecting MSW recycling performance. Chen and Chang [12] examine the interaction of diffusion effects and learning effects for MSW recycling using the aggregate data, reaching conclusions which suggest that (1) both diffusion effects and learning effects have significant impacts on MSW recycling and (2) environmental policy plays an important role in affecting MSW recycling. In general, diffusion models have been widely employed to forecast the spread of an innovation over time [13,14,15]. As Kemp [16] defines environmental technology as “each technique, process or product which conserves or restores environmental qualities” and classify it into six categories including: (1) pollution control technologies; (2) waste management; (3) clean technology; (4) recycling: waste minimization through the re-use of materials recovered from waste streams; (5) clean products; and (6) clean-up technology, this paper suggests that MSW recycling can be seen as an environmental technology. And thus, the diffusion of MSW recycling is modeled as a diffusion process of environmental technology.
2. Research Methods
Diffusion is defined as “the process in which an innovation is communicated through certain channels over time among the members of a social system. It is a special type of communication, in that the messages are concerned with new ideas” [17]. The diffusion process, in practice, reflects a communication process about the spread of information and the timing of individual adoptions [17,18]. Redmond [19] argues that “In a broader sense, however, the process of diffusion involves the spread of newness through society, which entails broad-scale changes in both behaviors and perceptions”.
In the end of the previous century, Taiwan EPA started to promote the recycling of municipal solid waste (MSW) through a variety of instruments. Environmental education was a major method adopted by Taiwan EPA through advertisements in broadcasting systems, subsidies to environmental groups and the cooperation with the public TV to engage in environmental programs and what not to develop the concept of environmental ethics and the consensus of public participation in environmental protection. The sorting knowledge is promoted or reported through environmental films on TV channels, outdoor electronic media and printed media to help citizens with the sorting of MSW at home. On the other hand, a penalty was imposed to reduce the inappropriate sorting.
In practice, the sorting by households at home is vital to the success of MSW recycling and the diffusion of environmental education may affect household behaviors. Chen and Chang [12] propose that the diffusion effect is an important factor to affect the recycling performance. And thus, MSW recycling is treated as an innovative service and households are seen as adopters in this paper. The recycling performance is regarded as the result that households adopt the innovative service of MSW recycling provided by the government.
Many researchers focus on the communication technologies and examine the diffusion across countries [20,21], the substitution of new generation mobile phone for fixed networks [22] or the difference in diffusion patterns across countries that express diversity in social, cultural and economic characteristics of countries [23,24,25]. Bohlin et al. [20] examine the diffusion of new generation products of mobile telecommunication technologies. They find that the factors including per capita income, urbanization and Internet/broadband penetration and regulation have positively influenced diffusion across all generations of mobile telecommunication products. Michalakelis et al. [22] focus on telecommunication products and services and examine the generational substitution effects due to the emergence of new generation products stemming from rapid technological changes. Kogut and Macpherson [26] see economic policies as innovations and examine the impacts of three types of economic policy innovations including privatization, central bank independence and pension reform on social welfare. Their results find that the diffusion of economic policy innovations depends on the mobility of economists. Redmond [19] discusses the factors involving social comparison, the network structure of interpersonal communications, prestige seeking and its impact on the speed of technology diffusion. He finds that social networks may encourage the adoption of new technologies but some networks also may inhibit or discourage such adoptions. Peres et al. [27] employs diffusion models to examine the diffusion process of innovative products and services across markets and brands.
The Bass model has been widely employed for empirical studies to capture a wide variety of diffusion patterns [28,29]. Many researchers have applied the Bass model to the testing or forecasting of sales of a new product in various fields (Song et al. [30] and Dekimpe et al. [31] for telecommunication; Fok and Franses [32] for scientific research). In general, the Bass model is expressed by a differential equation shown as:
where n(t) is the accumulated adopters at time , and are coefficients of external and internal influence respectively and is the ceiling of adopters. The Bass model assumes that the potential adoption is influenced by two types of communication channels: external influence of mass mediated process and internal influence through verbal communication that interacts between adopters and non-adopters in a social group. The first term explains the factor for the adoption due to mass media as it depends only on the number of non-adopters in the system. The second term describes the adoption due to word of mouth interaction. And thus, Equation (1) is employed to examine the diffusion effect of MSW recycling among various recyclables. As the amount of each waste fraction in the MSW generated is not equal, it difficult to compare the diffusion effect among various waste fraction. And thus, this paper employs the recycling rate to represent the accumulated adopters. By rearranging Equation (1) and converting it into a difference equation, we obtain Equation (2).
where denotes the difference of recycling rate for each waste fraction of recyclables, represents the accumulated recycling rate at time (t − 1) and is a random error term with mean 0 and variance ; and are uncorrelated so that their covariance is zero, i.e., for all t and s; t s. Comparing Equation (2) with Equation (1), we obtain:
Many researchers have employed the Bass model to estimate the parameters , and [33,34,35]. Based on these studies, the estimated coefficient for external force , internal force and the ceiling of recycling rate is obtained by solving the simultaneous equations of Equations (3)–(5) and listed in Equations (6)–(8).
On the other hand, the performance of recycling for ith waste fraction is estimated by:
Data
Table 1 shows the amount of MSW generated and recycled over the period of 1998–2016. The MSW generated kept a decreasing trend but the waste recycled grew by 24.98% annually, increasing from 111,753 tons in 1998 to 4,327,760 tons in 2016. In 2016, about 58.01% of MSW generated was recycled to produce secondary materials. Taiwan EPA classifies waste recycled into three main streams: recyclables, food waste and bulk waste. In 2016, total waste recycled amounted to 4,327,760 tons, accounting for 58.01% of MSW generated. Among the three streams, recyclables ranked the top, accounting for 77.42% of total waste recycled. In consideration of historical trends, Table 1 indicates that recyclables increased from 111,753 tons in 1998 to 3,690,910 tons in 2016, food waste increased from 167,304 tons in 2003 to 575,932 tons in 2016 and bulk waste increased from 29,575 tons in 2005 to 60,918 tons in 2016.
The major fractions of recyclables include waste paper, waste metal products, waste glass products, waste plastics/rubbers and a small portion of recyclables consists of textile products, home electrical appliances, batteries, information and communication products, etc. In 2016, waste paper recycled reached to 1,975,503 tons, accounting for 54.26% of recyclables, compared to waste metal products 758,945 tons (20.85%), waste plastics/rubber 358,792 tons (9.85%) and waste glass products 276,695 tons (7.60%). The sum of these four waste fractions accounts for 92.56% of total recyclables.
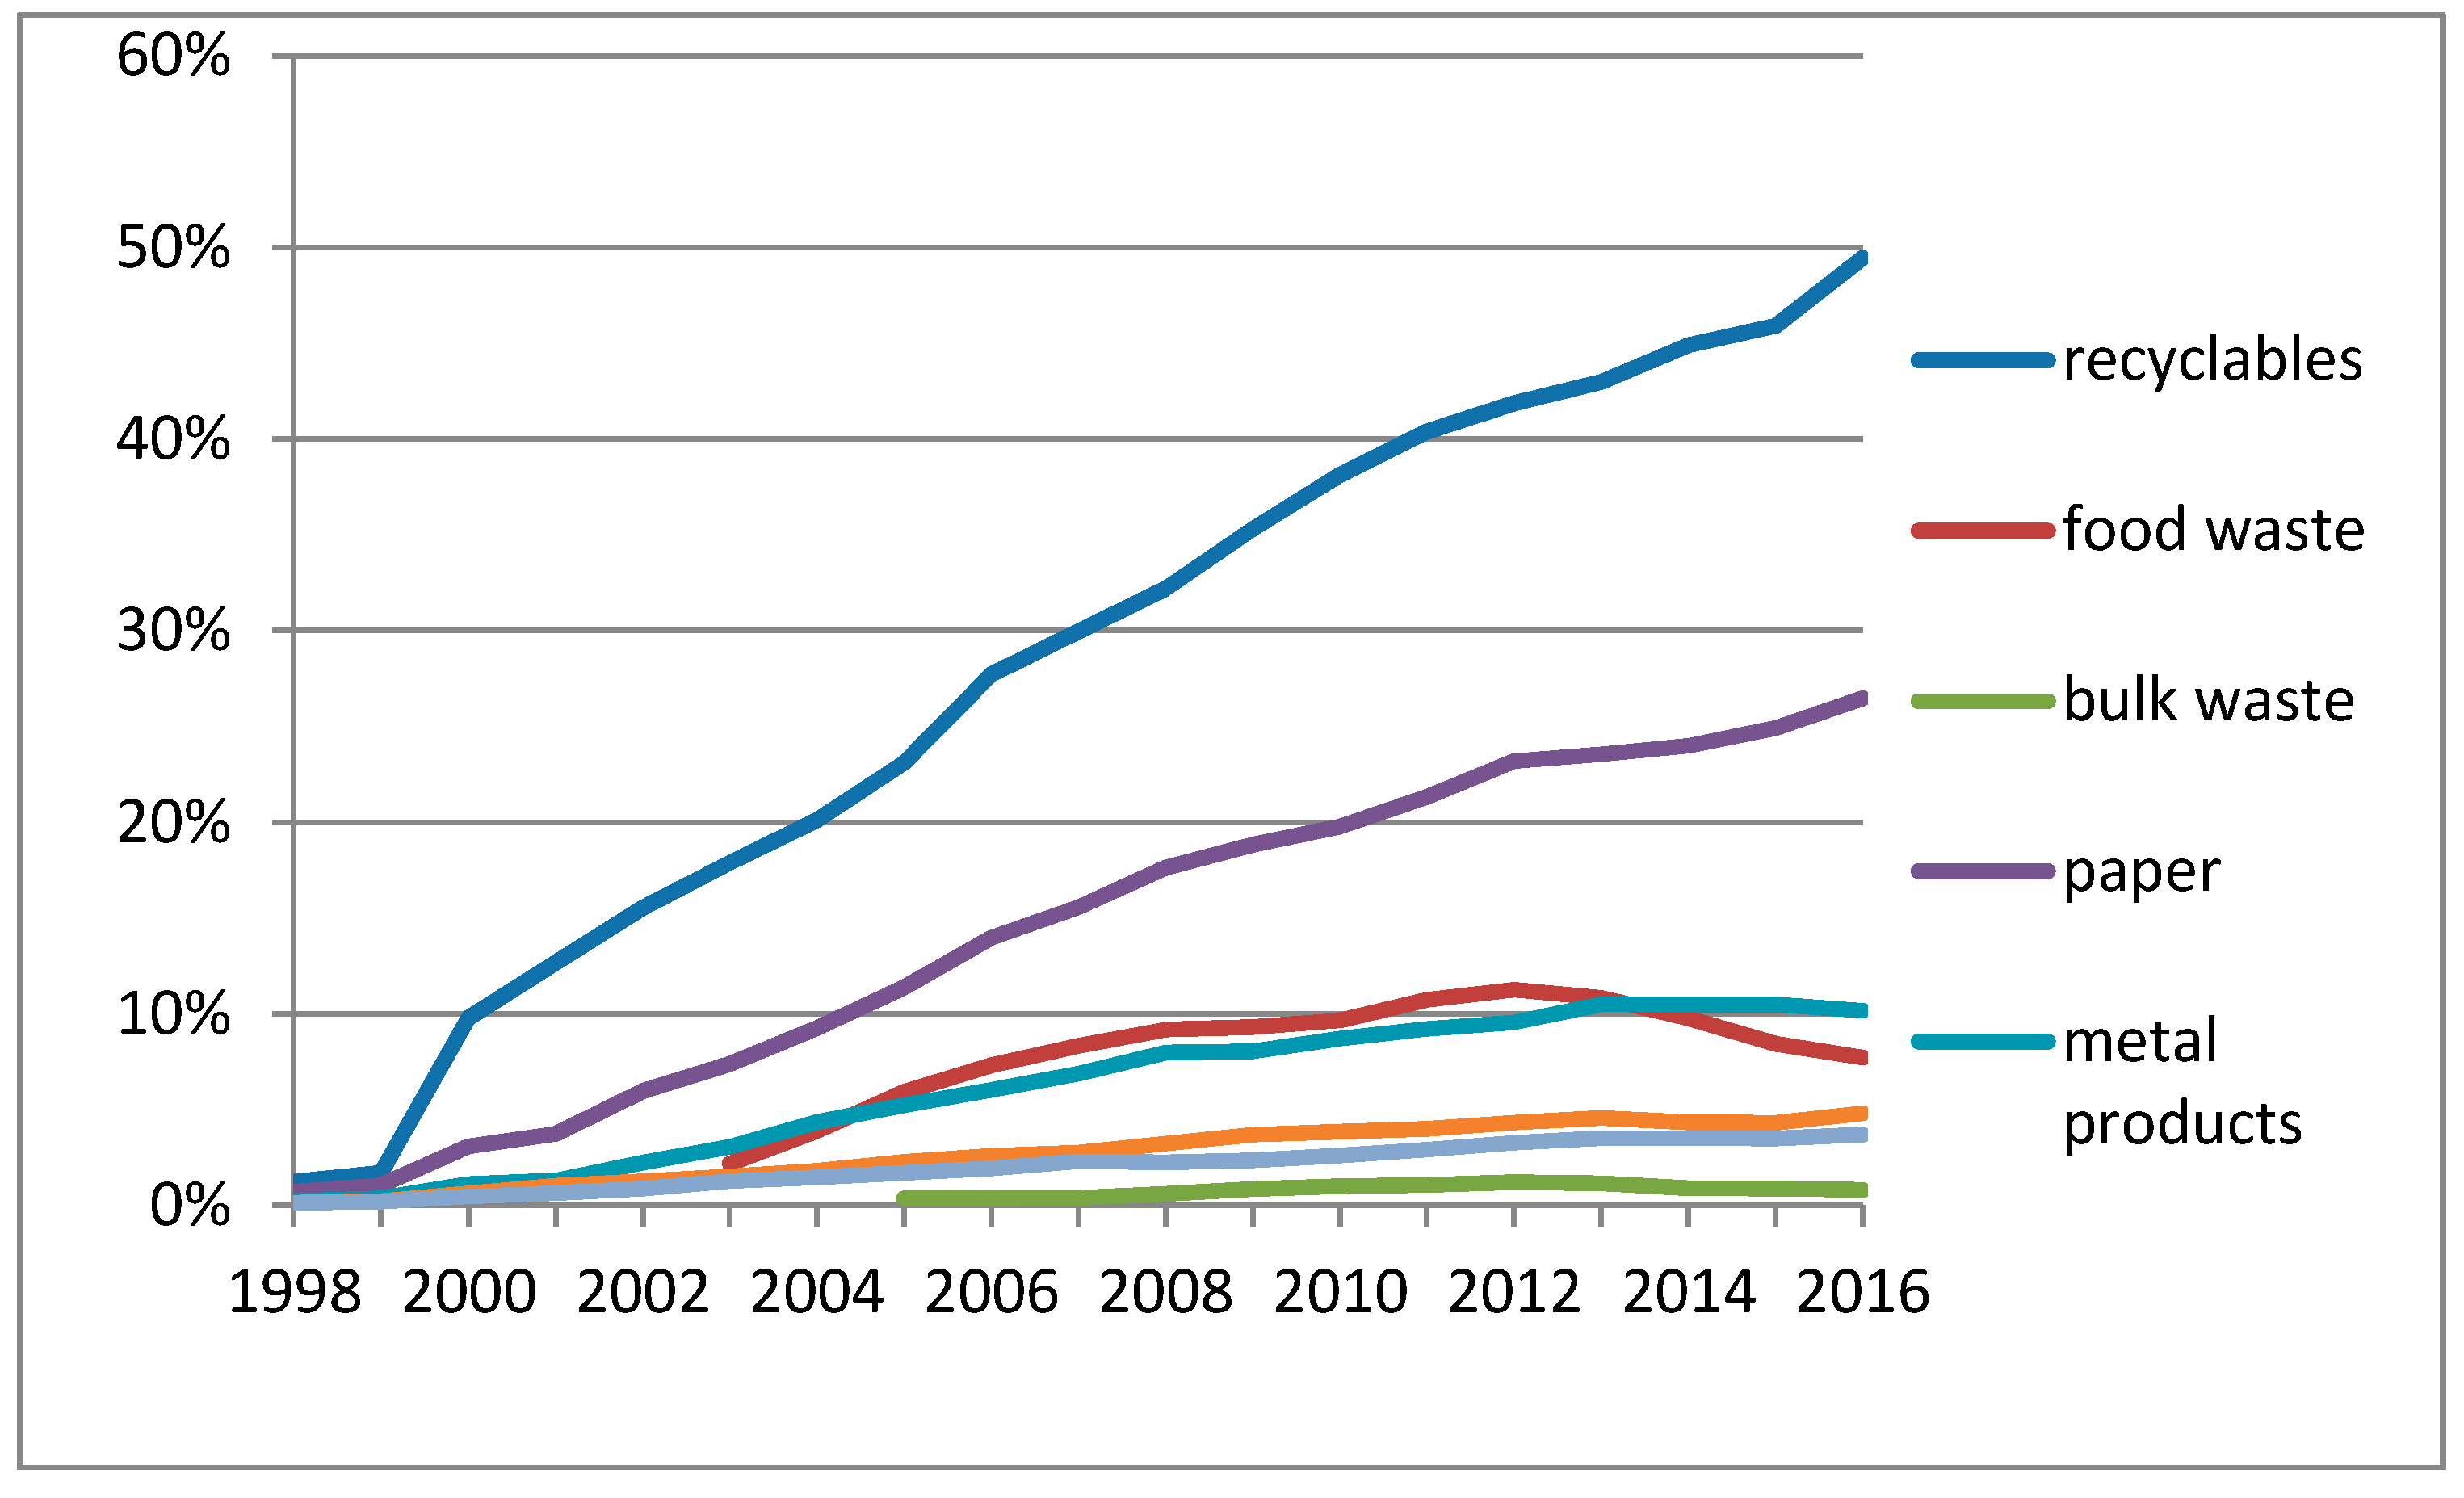
Overall, this paper selects six categories of waste fractions for analysis, including: food waste, bulk waste, paper, metal products, plastics/rubber and glass products. Since the amount of MSW generated decreases over time, we employ the recycling rate instead of the recycling amount to measure diffusion effects. The recycling rate for the waste fraction selected over the period 1998–2016 is illustrated in Figure 1, in which we find that recycling rates for all these waste fractions have kept an increasing trend over time. The recycling rate of recyclables increased from 1.25% in 1998 to 49.47% in 2016 and that of food waste increased from 2.19% in 2003 to 7.72% in 2016. The bulk waste increased from 0.38% in 2005 to 0.82% in 2016.
In 2016, about 0.44 tons of recyclables containing various recyclable resources including paper, metal products, glass, plastics and rubbers are collected and recycled in each ton of MSW. Among the various waste fractions of recyclables, the recycling rate of waste paper reached 26.48% in 2016, ranking the top, followed by metal products with recycling rate of 10.17%, plastics/rubbers of 4.81% and glass of 3.71%. The recycling rate for the remaining recyclables including textile products, home electrical appliances, batteries, information and communication products, agricultural chemical containers and others is only 2.41% in 2016.
3. Research Results
By using an ordinary least squares estimation, the coefficient of Equation (2) for recyclables, food waste, bulk waste, paper, metal products, plastics/rubber and glass products are listed in Table 2. The results show that the recycling of recyclables, waste paper and waste metal products works in a logistic pattern over time as the coefficient of square recycling rate is significantly negative. And thus, we conclude that diffusion effects exist for the recycling of aggregated recyclables, the fraction of waste paper and waste metal products. On the other hand, no evidence is found to support that diffusion effects which exist for the recycling of food waste, bulk waste, waste glass and waste plastics/rubber.
The existence of diffusion effects for waste metal products and waste paper may attribute to the establishment of recycling system consisting of collecting, sorting, recovery and the market of secondary materials. Rogers [17] suggests that the compatibility with social values, beliefs and past experiences may play an important role in affecting the adoption rate. The effectiveness of MSW recycling in general depends on the household’s environmental awareness and behaviors with sufficient knowledge to keep materials separated [11]. In fact, some researchers have emphasized that knowledge in recycling is very important for successful MSW management. Currently, MSW sorting by households at home has been successfully performed in Taiwan and attained high efficiency [36]. The communications and information flow are sufficient between households and governmental administrative units to adopt new knowledge or regulation. Taiwan’s household’s participation in MSW recycling is recognized and supposedly play a vital role in affecting recycling performance.
The estimates of , and are shown in Table 3, in which the rate of diffusion through external force for waste paper recycling is smaller than waste metal products but the rate of diffusion through internal force is almost the same between the two waste fractions. The variation of diffusion rate may be accounted for by the market structure and size of secondary materials. Currently, the regenerated steel and irons in Taiwan can satisfy about 60% of local market demand and thus about of 40% of waste metal products should be imported. Starting from 2006, four waste metal re-processing plants were subsidized to crush the waste car and to regenerate metal materials. About 85% of the shredded steel and irons are consumed by electric arc furnace plants [37].
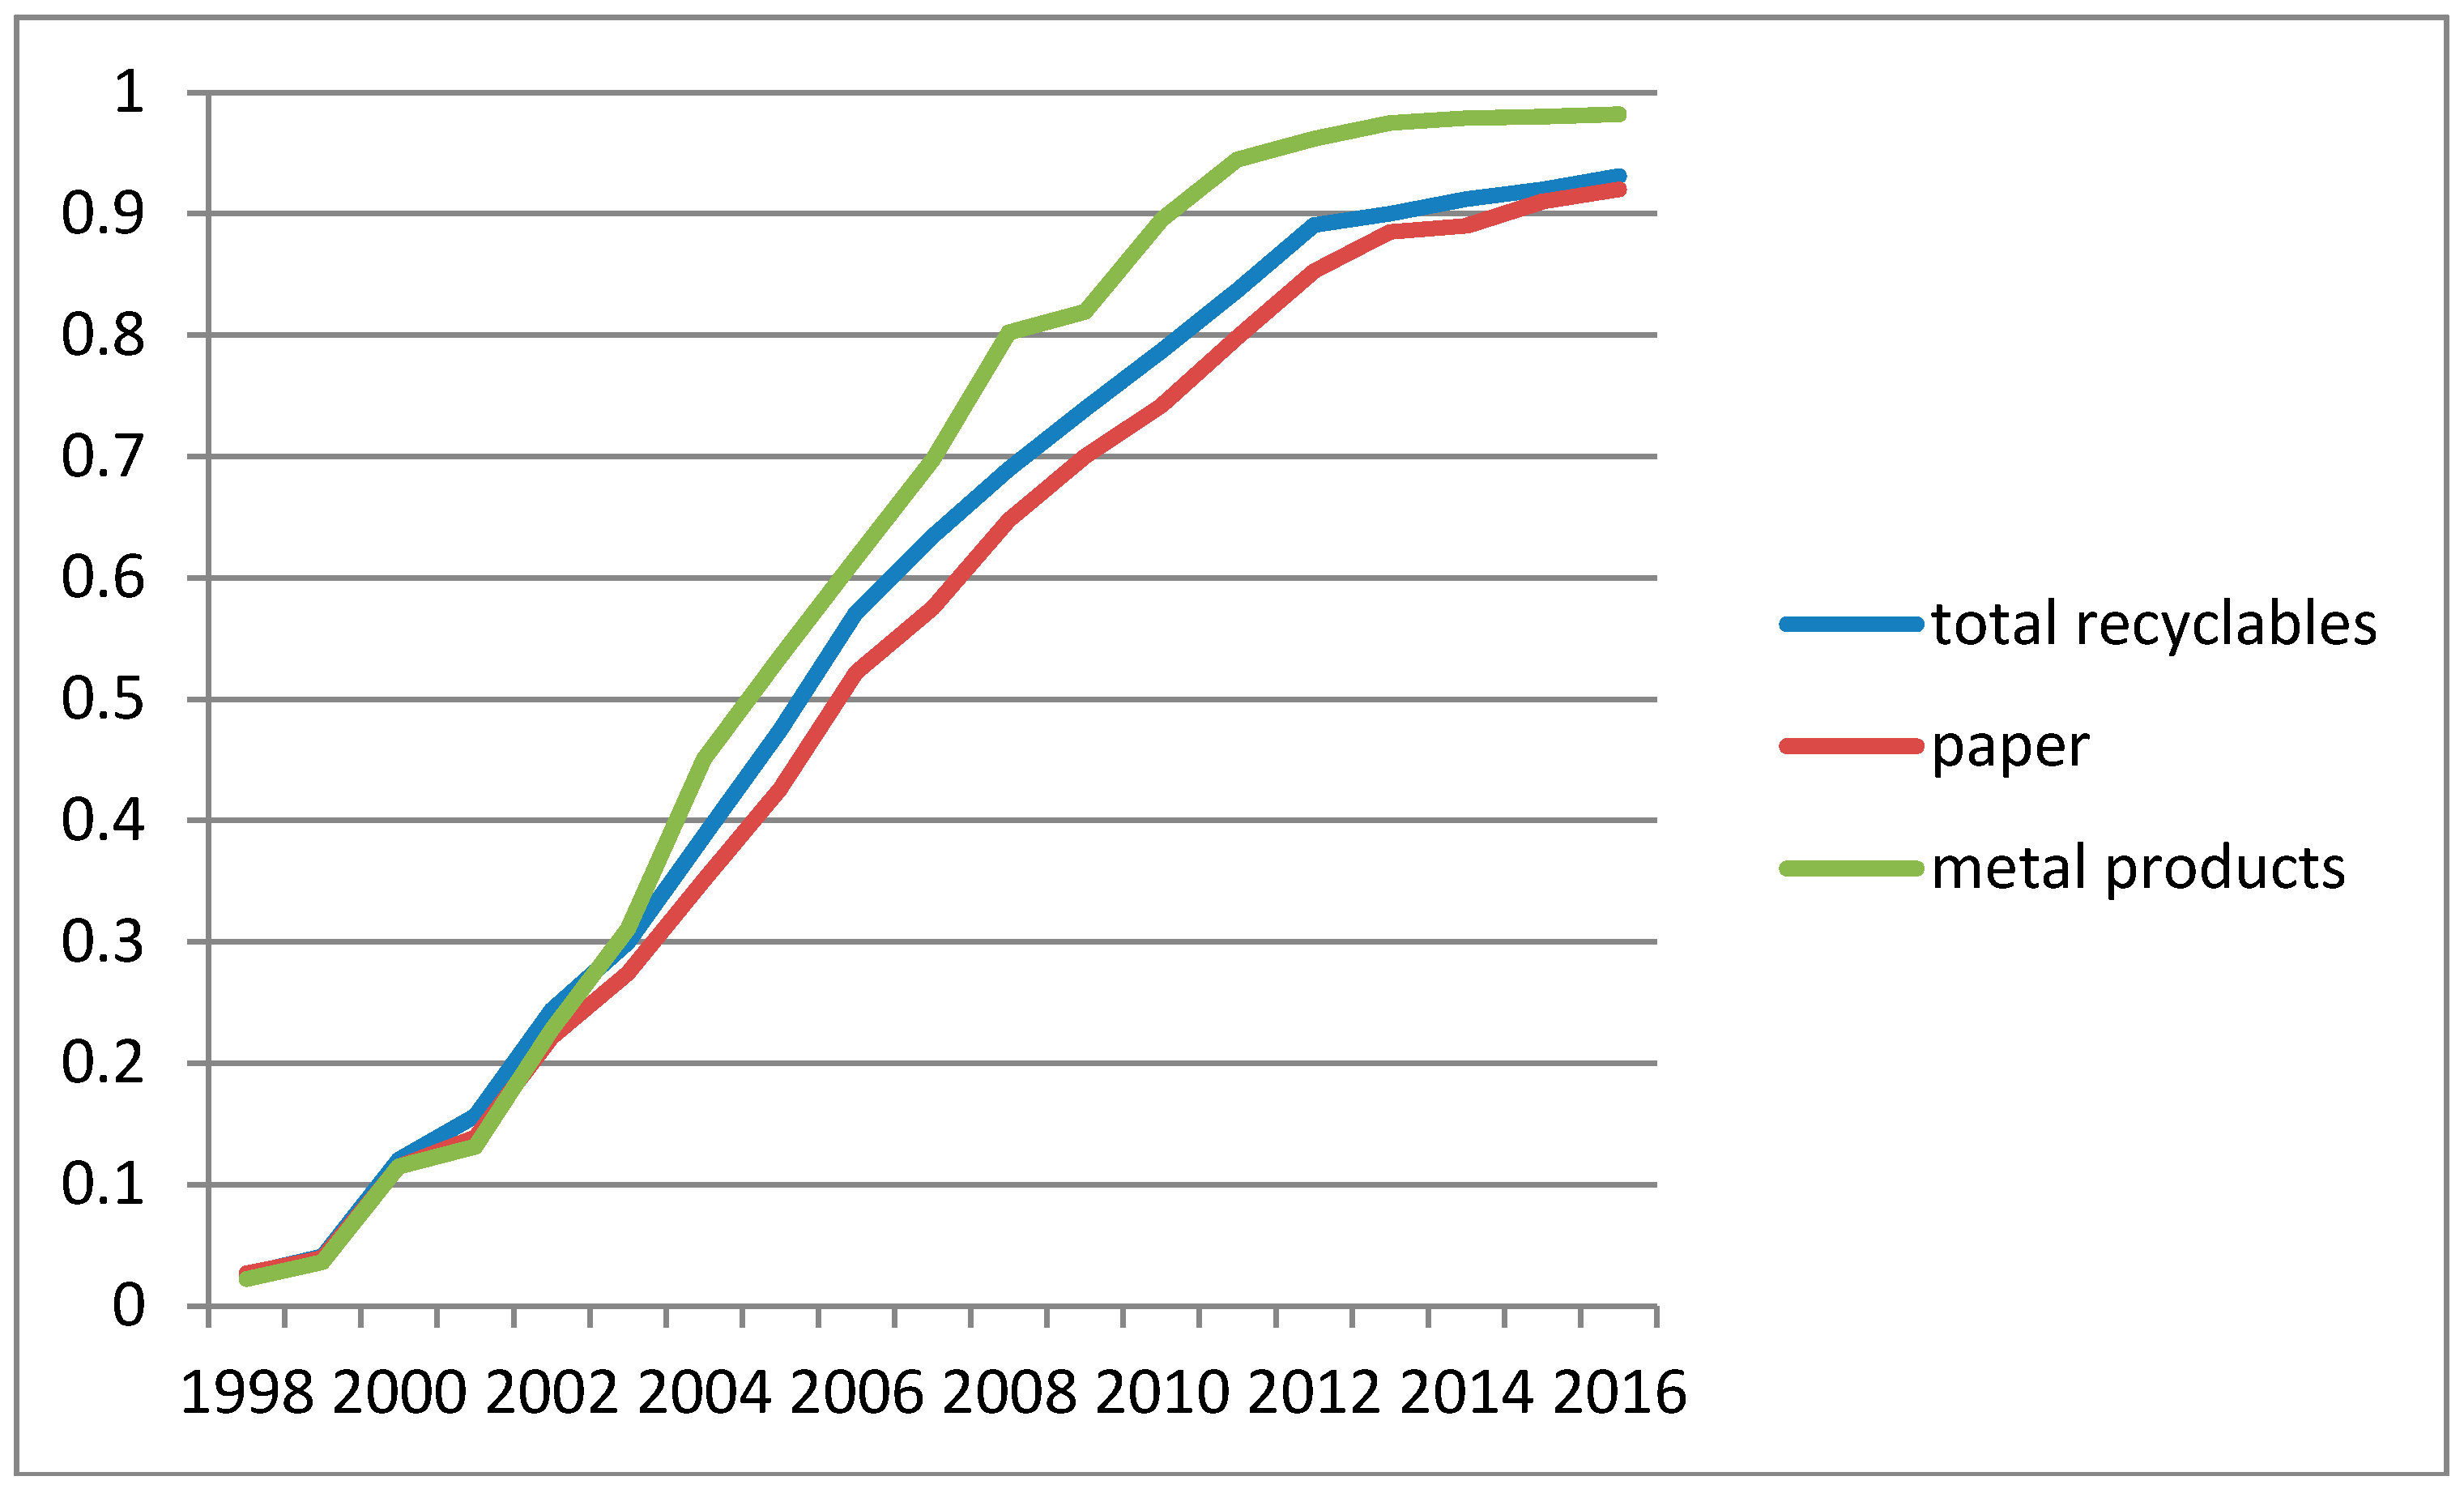
Based on Equation (9), recycling performance is calculated and the trend of recycling performance for aggregate recyclables, waste paper and waste metal products are illustrated in Figure 2. The recycling performance of each waste fraction seems to have kept a rising trend over the period of 1998–2012 for these three waste fractions. The recycling of waste metal products has started to perform better than waste paper since 2002 and ranked the top in 2012. In 2012, recycling performance for recyclables, waste paper and waste metal products has reached 89.09%, 85.27% and 96.17%, respectively. The comparison among these three waste fractions shows that the recycling of metal products has almost reached its potential recycling rate.
4. Importance-Performance Analysis
The importance-performance analysis (IPA) has been widely used to analyze customer satisfaction, containing two dimensions: importance of quality attributes and attributes performance. Rada et al. [38] also propose that the different treatment of recycling may bring the different efficiency of recycling. Therefore, we employ it to form a priority program for waste recycling in this paper. The importance of waste recycling for each waste fraction is depicted along the x-axis and recycling performance along the y-axis in this paper. Recycling performance is measured in terms of the relative attainment rate that is calculated according to Equation (9) for recyclables, waste metal products and waste paper. In contrast, food waste, waste glass and waste plastics/rubber are not found to have significant diffusion effects. Hence, the content of these three waste fractions in MSW before sorting is used as the ceiling of recycling rate respectively. Currently, bulk waste is collected and transferred to the re-manufacturing plant, owned and operated by the government for once or twice only in a year. The content of bulk waste in MSW is not available and thus bulk waste is excluded for importance-performance analysis.
On the other hand, the attribute importance is measured by the relative benefit of waste recycling (sorting, collecting and material recovery). Since all the incinerators have been equipped with energy recovery systems in Taiwan, some waste fractions such as paper, plastics films, etc., can be seen as compensatory fuels for power generation. In this case, the calorific value of each waste fraction, contributing to outputs of electricity production, is used as the measure of relative importance. The data of caloric values for food waste, paper, metal products, glass and plastics/rubber shown in Chen and Chen [39] are employed. As the caloric values of these waste fractions vary greatly, the relative importance (RI) is developed in terms of
where is the caloric value of ith waste fraction, is the average of caloric values for all waste fractions selected and is the standard error.
The relative performance and importance for these selected waste fractions are shown in Figure 3, dividing the matrix into four quadrants. Waste metal products and glass fall in Quadrant I with recycling performance of 0.9617 and 0.8504, respectively. As zero caloric values for these two waste fractions, the relative importance is 1.3961. This means that the recycling of waste metal products and glass should keep going to maintain the sustainable competitive advantage.
Food waste falls in Quadrant IV, representing high scores 0.8767 of recycling importance but low scores 0.3918 of recycling performance. In 2012, the recycling rate for food waste was 11.17% only but MSW for final disposal still contained 38.33% food waste. The results suggest that MSW management authorities should pay more attention to the recycling of food waste and see it as the most priority item to recycle. In fact, food waste should be avoided to enter incinerator due to its negative impacts on the both the incinerators and the environment [39]. Chen and Chen [39] compare material recycling and energy recycling for some waste fractions and suggests that material recovery for food waste is more appropriate due to its low caloric value of 4.18 MJ/kg. The results of IPA imply that recycling of food waste requires immediate attention and thus MSW management should see it as a priority task by providing new mechanism to speed up diffusion effects and encourage recycling performance.
On the other side of the coin, waste paper and plastics/rubber fall in Quadrant II and Quadrant III, implying less importance to recycle. As Quadrant III represents excessive inputs of resources for recycling and thus the resource for recycling waste paper should be deployed elsewhere. Among the waste recycled, recycling rate of waste paper was 22.99% in 2012, ranked the top, higher than food waste (11.17%), metal products (9.47%), plastics/rubber (4.29%) and glass products (3.24%). Chen and Chen [39] suggest that waste paper may be more appropriate to dispose through energy recovery rather than material recovery due to high waste caloric values contained in waste paper. Therefore, management authorities may divert efforts of recycling from waste paper to other waste fractions. Finally, Quadrant III represents low importance and low performance for material recycling. The waste fraction of plastics/rubber falling in this quadrant has recycling performance of 37.51% and attributes importance of −2.9528 with high caloric value of 35 MJ/kg.
In practice, plastics materials are difficult to be recovered as they are mostly used as packaging materials that are made of composite materials consisting of plastics film, paper. All foil, or other materials. Plastics packaging materials having high caloric value and seen as a bio-fuel may be more appropriate to recovery energy through incineration process. This paper suggest that recycling of waste plastics/rubber should be seen as a low priority item for MSW management.
5. Discussion
Since all waste fractions of recyclables are equally sorted, some other factors except for household participation may explain the difference in the existence of diffusion effects among these waste fractions of recyclables. The other reason for explaining the variation of diffusion effects across these waste fractions may attribute to the market demand for secondary materials and the relevant recycling system. In practice, a lot of secondary material markets have been formed in Taiwan including recyclable waste collectors, recyclable waste distributors, recovery plants, secondary materials dealers and the buyers for secondary materials. Recovery and/or regeneration of most waste fractions such as waste metal products, waste paper and waste plastics has been conducted in Taiwan through the integration of collectors, scrap dealers, regeneration (recovery) plants and other recycling facilities. With the recent investments in the recycling industry, almost all types plastic materials, glass, paper and metals can be recycled at industrial levels in Taiwan. However, the market for other waste fractions is still lacking due to a low market demand.
Among these waste fractions, the material recovered from waste papers, waste metal products and waste PET containers has a stable market and can compete with international market prices. Waste paper are collected through the scrap/waste dealers and delivered to material recovery plants to produce paper stock through a series process of sorting, grading and baling. The paper stock recovered is sold on the market to paper recycling mills or paper products making plants for the manufacturing of paper products.
In 2011, Taiwan’s market demand for waste metals reached 11.7 million tons and still kept rising with an average annual growth rate estimated at 4.97%. Currently, 25 electric furnace steel mills have been established with a total capacity of 14.2 million tons [37]. In general, approximately 1.1 metric tons of steel scrap can produce 1 metric ton of crude steel. Due to high dependence on importation of steel scrap, the market demand for waste metals is stable and thus recycling of waste metal products becomes an economic behavior.
The stream of waste plastics contains a variety of materials such as PET, PP and PE accounting for 89.4% of waste plastics recycled [37]. The rest of waste plastics sources come from the waste electronic appliances. Basically, the quality of regenerated plastics is lower than virgin materials and thus reduces its demand in local market. Currently, about 70% of secondary materials recovered from waste plastics are sold in domestic markets and the rest is exported [37]. Due to difficult recovery for some packaging materials made of plastics and other composite materials, these packaging materials containing plastics are in practice incinerated with general MSW for energy recovery. Theoretically, waste tires can be re-manufactured or regenerated through thermal cracking to produce rubber. However, the major application of waste tires collected are used as fuels for co-generation plants or cements plants in Taiwan. Due to the limited application of waste plastics and rubber, the diffusion effect for the recycling of plastics/rubber is not found significant in this study. The lack of market demands for secondary plastics materials and the adoption of incineration disposal with energy recovery for some plastics may be the key factor for explaining the insignificant diffusion effects for the recycling of plastics/rubbers.
Most of waste glass is collected from waste glass containers, accounting for 87.7% of waste glass recycled and the rest is contributed by other sources including wasted TV CRT, computer monitors and lightening [37]. Currently, no market exists for waste glass and thus it reduces the diffusion of waste glass recycling.
The food waste collected is currently delivered to pig farms as pig feed or composting plants for the conversion of food waste into fertilizers in Taiwan. As food waste comes from a variety of sources like households, restaurants and military organizations, the sanitary quality is very difficult to monitor and control. The pathogens may be contained in the food waste and a relatively high risk of disease infection exists. The infection rate of toxoplasmosis is 48% for the pig farm fed by food waste, higher than 8.3% by formula feed. And thus, Council of Agriculture in charge of agriculture development policy is opposed to expanding the application of pig feed for food waste [40]. The lack of diffusion effects for food waste may attribute to the limited applications of food waste and the lack of competition pressure for the organic fertilizers composted from food waste collected.
The biological composting for food waste has been proved to be a successful method both in a technical perspective and economic evaluation and generally accepted as a rapid and simple process to stabilize and reduce the waste mass. It is also seen as the most natural way of recycling through biological reactions to achieve environmental self-cleaning among the various disposal options [41,42]. However, the cost of organic fertilizer composted from food waste still lacks competitiveness with respect to chemical fertilizers. According to Council of Agriculture [43], the market share of organic fertilizer is less than 10% of total fertilizer consumption. Considering the high volume of food waste generated, Taiwan EPA started to promote the food waste recycling in 2003. After then, the food waste recycling rate increased from 2.27% in 2003 to 11.17% in 2016 [44]. Currently, the MSW disposed still contains food waste 38.33% and hence this paper suggests that MSW management authority should focus on the recycling of food waste.
In general, recovery plants aim at maximizing profits and thus may work as a pulling force for sorting and collecting of recyclable wastes. The price competition and quality of secondary materials make a significant influence on the demands for the recyclable waste. In fact, waste recycling and recovery of valuable materials will be conducted autonomously if the recycling provides profits or at least a substantial saving on waste disposal costs [45].
6. Conclusions
In this paper, the existence of diffusion effects varies across different waste fractions. Waste metal products and waste paper are found to have significant diffusion effects while the rest lacks evidence. We conclude that (1) the diffusion effect exists significantly for the recycling of most recyclables but no evidence is found to support the diffusion effect for the recycling of food waste and bulk waste; (2) the recycling performance of waste metal products ranks the top, compared to waste paper, waste glass and other waste fractions; (3) the recycling of food waste should be seen as the most priority item to recycle. The contribution of this paper at least can be shown in three aspects: (1) the new formula that incorporates the ceiling of recycling rate to measure recycling performance seems to be more realistic and effective to reflect recycling performance compared to recycling rate; (2) the results of the empirical analysis on the diffusion effect for various waste fractions highlights the role of secondary materials markets in affecting the diffusion of MSW recycling; (3) the importance-performance analysis provides a recycling priority program to support the policy making and planning.
Acknowledgments
The research was supported in part by Ministry of Science and Technology under grant MOST 106-2410-H-227-001 to Yi-Tui Chen.
Author Contributions
Yi-Tui Chen conceived the study; Yi-Tui Chen analyzed the data; Fu-Chiang Yang structured the article; Yi-Tui Chen and Shih-Heng Yu wrote the draft; Fu-Chiang Yang edited the manuscript. All authors have approved the final manuscript.
Conflicts of Interest
The authors declare no conflict of interest.
References
- Ragazzi, M.; Catellani, R.; Rada, E.; Torretta, V.; Salazar-Valenzuela, X. Management of municipal solid waste in one of the Galapagos Islands. Sustainability 2014, 6, 9080–9095. [Google Scholar] [CrossRef] [Green Version]
- Ferronato, N.; Torretta, V.; Ragazzi, M.; Rada, E.C. Waste mismanagement in developing countries: A case study of environmental contamination. UPB Sci. Bull. 2017, 79, 185–196. [Google Scholar]
- Rada, E.C.; Ragazzi, M.; Fedrizzi, P. Web-GIS oriented systems viability for municipal solid waste selective collection optimization in developed and transient economies. Waste Manag. 2013, 33, 785–792. [Google Scholar] [CrossRef] [PubMed]
- Teixeira, C.A.; Russo, M.; Matos, C.; Bentes, I. Evaluation of operational, economic and environmental performance of mixed and selective collection of municipal solid waste: Porto case study. Waste Manag. Res. 2014, 32, 1210–1218. [Google Scholar] [CrossRef] [PubMed]
- Ferreira, F.; Avelino, C.; Bentes, I.; Matos, C.; Teixeira, C.A. Assessment strategies for municipal selective waste collection schemes. Waste Manag. 2017, 59, 3–13. [Google Scholar] [CrossRef] [PubMed]
- Ranieri, E.; Rada, E.C.; Ragazzi, M.; Masi, S.; Montanaro, C. Critical analysis of the integration of residual municipal solid waste incineration and selective collection in two Italian tourist areas. Waste Manag. Res. 2014, 32, 551–555. [Google Scholar] [CrossRef] [PubMed]
- Zheng, P.; Zhang, K.; Zhang, S.; Wang, R.; Wang, H. The door-to-door recycling scheme of household solid wastes in urban areas: A case study from Nagoya, Japan. J. Clean. Prod. 2017, 163, S366–S373. [Google Scholar] [CrossRef]
- De Oliveira Neto, G.C.; de Jesus Cardoso Correia, A.; Schroeder, A.M. Economic and environmental assessment of recycling and reuse of electronic waste: Multiple case studies in Brazil and Switzerland. Resour. Conserv. Recycl. 2017, 127, 42–55. [Google Scholar] [CrossRef]
- Mcdonald, S.; Oates, C. Reasons for non-participation in a kerbside recycling scheme. Resour. Conserv. Recycl. 2003, 39, 369–385. [Google Scholar] [CrossRef]
- Ueberschaar, M.; Geiping, J.; Zamzow, M.; Flamme, S.; Rotter, V.S. Assessment of element-specific recycling efficiency in WEEE pre-processing. Resour. Conserv. Recycl. 2017, 124, 25–41. [Google Scholar] [CrossRef]
- Perrin, D.; Barton, J. Issues associated with transforming household attitudes and opinions into materials recovery: A review of two kerbside recycling schemes. Resour. Conserv. Recycl. 2001, 33, 61–74. [Google Scholar] [CrossRef]
- Chen, Y.T.; Chang, D.S. Diffusion effect and learning effect: An examination on MSW recycling. J. Clean. Prod. 2010, 18, 496–503. [Google Scholar] [CrossRef]
- Hyysalo, S.; Johnson, M.; Juntunen, J.K. The diffusion of consumer innovation in sustainable energy technologies. J. Clean. Prod. 2017, 162, S70–S82. [Google Scholar] [CrossRef]
- Sohn, S.Y.; Ahn, B.J. Multigeneration diffusion model for economic assessment of new technology. Technol. Forecast. Soc. Chang. 2003, 70, 251–264. [Google Scholar] [CrossRef]
- Kemp, R.; Volpi, M. The diffusion of clean technologies: A review with suggestions for future diffusion analysis. J. Clean. Prod. 2008, 16, S14–S21. [Google Scholar] [CrossRef]
- Kemp, R. Environmental Policy and Technical Change: A Comparison of the Technological Impact of Policy Instruments; Edward Elgar Publishing: Brookfield, VT, USA, 1997. [Google Scholar]
- Rogers, E.M. Diffusion of Innovation, 4th ed.; The Free Press: New York, NY, USA, 2003. [Google Scholar]
- Gatignon, H.; Robertson, T. Innovative decision processes. In Handbook of Consumer Behavior; Kassarjian, R., Ed.; Prentice-Hall: Englewood Cliffs, NJ, USA, 1991; pp. 313–333. [Google Scholar]
- Redmond, W.H. Interconnectivity in diffusion of innovations and market competition. J. Bus. Res. 2004, 57, 1295–1302. [Google Scholar] [CrossRef]
- Bohlin, A.; Gruber, H.; Koutroumpis, P. Diffusion of new technology generations in mobile communications. Inf. Econ. Policy 2010, 22, 51–60. [Google Scholar] [CrossRef]
- Takieddine, S.; Sun, J. Internet banking diffusion: A country-level analysis. Electron. Commer. Res. Appl. 2015, 14, 361–371. [Google Scholar] [CrossRef]
- Michalakelis, C.; Varoutas, D.; Sphicopoulos, T. Innovation diffusion with generation substitution effects. Technol. Forecast. Soc. Chang. 2010, 77, 541–557. [Google Scholar] [CrossRef]
- Stremersch, S.; Tellis, G.J. Understanding and managing international growth of new products. Int. J. Res. Mark. 2004, 21, 421–438. [Google Scholar] [CrossRef]
- Talukdar, D.; Sudhir, K.; Ainslie, A. Investigating new product diffusion across products and countries. Mark. Sci. 2002, 21, 97–114. [Google Scholar] [CrossRef]
- Valle, A.D.; Furlan, C. Diffusion of nuclear energy in some developing countries. Technol. Forecast. Soc. Chang. 2014, 81, 143–153. [Google Scholar] [CrossRef]
- Kogut, B.; Macpherson, J.M. The mobility of economists and the diffusion of policy ideas: The influence of economics on national policies. Res. Policy 2011, 40, 1307–1320. [Google Scholar] [CrossRef]
- Peres, R.; Muller, E.; Mahajan, V. Innovation diffusion and new product growth models: A critical review and research directions. Int. J. Res. Mark. 2010, 27, 91–106. [Google Scholar] [CrossRef]
- Benvenutti, L.M.M.; Ribeiro, A.B.; Uriona, M. Long term diffusion dynamics of alternative fuel vehicles in Brazil. J. Clean. Prod. 2017, 164, 1571–1585. [Google Scholar] [CrossRef]
- Turk, T.; Trkman, P. Bass model estimates for broadband diffusion in European countries. Technol. Forecast. Soc. Chang. 2012, 79, 85–96. [Google Scholar] [CrossRef]
- Song, Y.; Lee, S.; Zo, H.; Lee, H. A hybrid Bass–Markov model for the diffusion of a dual-type device-based telecommunication service: The case of WiBro service in Korea. Comput. Ind. Eng. 2015, 79, 85–94. [Google Scholar] [CrossRef]
- Dekimpe, M.G.; Parker, P.M.; Sarvary, M. Staged estimation of international diffusion models: An application to global cellular telephone adoption. Technol. Forecast. Soc. Chang. 1998, 57, 105–132. [Google Scholar] [CrossRef]
- Fok, D.; Franses, P.H. Modeling the diffusion of scientific publications. J. Econom. 2007, 39, 376–390. [Google Scholar] [CrossRef] [Green Version]
- Van den Bulte, C.; Stremersch, S. Social contagion and income heterogeneity in new product diffusion: A meta-analytic test. Mark. Sci. 2004, 23, 530–544. [Google Scholar] [CrossRef]
- Venkatesan, R.; Krishnan, T.V.; Kumar, V. Evolutionary estimation of macrolevel diffusion models using genetic algorithms: An alternative to nonlinear least squares. Mark. Sci. 2004, 2, 451–464. [Google Scholar] [CrossRef]
- Van den Bulte, C.; Lilien, G.L. Bias and systematic change in the parameter estimates of macro-level diffusion models. Mark. Sci. 1997, 16, 338–353. [Google Scholar] [CrossRef]
- Chen, C.C. A performance evaluation of MSW management practice in Taiwan. Resour. Conserv. Recycl. 2010, 54, 1353–1361. [Google Scholar] [CrossRef]
- Institute of Environment and Resources. Municipal Solid Waste Source Reduction and Extended Producer Responsibility Project 2014. Available online: http://www.ier.org.tw/J3/index.php/zh/research/2014/253-103-2 (accessed on 4 April 2017).
- Rada, E.C.; Ragazzi, M.; Ionescu, G.; Merler, G.; Moedinger, F.; Raboni, M.; Torretta, V. Municipal solid waste treatment by integrated solutions: Energy and environmental balances. Energy Procedia 2014, 50, 1037–1044. [Google Scholar] [CrossRef] [Green Version]
- Chen, C.C.; Chen, Y.T. Energy recovery or material recovery for MSW treatments. Resour. Conserv. Recycl. 2013, 74, 37–44. [Google Scholar] [CrossRef]
- Song, H.T. From the pig farm policy to the prevention of swine fever and foot-and-mouth disease. China Husb. 1998, 7, 20–26. (In Chinese) [Google Scholar]
- Caputo, A.C.; Pelagagge, P.M. RDF production plants: I Design and costs. Appl. Therm. Eng. 2002, 22, 423–437. [Google Scholar] [CrossRef]
- Slater, R.A.; Frederickson, J. Composting municipal waste in the UK: Some lessons from Europe. Resour. Conserv. Recycl. 2001, 32, 359–374. [Google Scholar] [CrossRef]
- Council of Agriculture. Yearly Report of Taiwan’s Agriculture. 2017. Available online: http://www.afa.gov.tw/content_en.aspx?a=2&pcatid=1&ycatid=1&lcatid=147 (accessed on 8 March 2017).
- Taiwan EPA. Yearbook of Environmental Protection Statistics; Taiwan EPA: Taipei, Taiwan, 2017. [Google Scholar]
- Chen, C.C. An evaluation of optimal application of government subsidies on recycling of recyclable waste. Pol. J. Environ. Stud. 2005, 14, 143–150. [Google Scholar]
Figure 1.
The trend of recycling rate among waste fractions.

Figure 2.
The comparison of recycling performance among total recyclables, waste paper and waste metal products.
Figure 2.
The comparison of recycling performance among total recyclables, waste paper and waste metal products.

Figure 3.
The map of IPA for waste fractions selected.


Table 1.
Amount of MSW collected, disposed and recycled unit: tons.
| Year | MSW Generated | MSW Disposed | Waste Recycled | |||
|---|---|---|---|---|---|---|
| Sub-Total | Recyclables | Food Waste | Bulk Waste | |||
| 1998 | 8,992,240 | 8,880,487 | 111,753 | 111,753 | n.a. | n.a. |
| 1999 | 8,715,575 | 8,565,699 | 149,876 | 149,876 | n.a. | n.a. |
| 2000 | 8,353,368 | 7,875,511 | 853,990 | 853,990 | n.a. | n.a. |
| 2001 | 7,839,173 | 7,254,841 | 1,056,753 | 1,056,753 | n.a. | n.a. |
| 2002 | 7,601,958 | 6,723,639 | 1,241,837 | 1,241,837 | n.a. | n.a. |
| 2003 | 7,355,335 | 6,139,050 | 1,547,759 | 1,379,158 | 167,304 | n.a. |
| 2004 | 7,554,870 | 5,862,890 | 1,852,069 | 1,552,804 | 299,265 | n.a. |
| 2005 | 7,775,064 | 5,525,253 | 2,303,432 | 1,809,656 | 464,201 | 29,575 |
| 2006 | 7,738,531 | 5,032,672 | 2,758,934 | 2,160,112 | 570,176 | 28,646 |
| 2007 | 7,975,686 | 4,873,237 | 3,076,212 | 2,382,191 | 662,791 | 31,230 |
| 2008 | 7,607,798 | 4,374,154 | 3,163,220 | 2,427,561 | 691,194 | 44,466 |
| 2009 | 7,729,231 | 4,223,484 | 3,522,535 | 2,735,591 | 721,472 | 65,473 |
| 2010 | 7,870,665 | 4,072,603 | 3,884,998 | 3,035,617 | 769,164 | 80,217 |
| 2011 | 7,485,229 | 3,610,848 | 3,943,740 | 3,052,215 | 811,199 | 80,326 |
| 2012 | 7,470,569 | 3,379,390 | 4,024,558 | 3,101,035 | 834,541 | 88,983 |
| 2013 | 7,332,694 | 3,253,304 | 4,032,544 | 3,153,406 | 795,213 | 83,924 |
| 2014 | 7,369,439 | 3,218,030 | 4,096,770 | 3,310,560 | 720,373 | 65,837 |
| 2015 | 7,229,290 | 3,153,771 | 3,992,901 | 3,319,617 | 609,706 | 63,578 |
| 2016 | 7,461,342 | 3,045,299 | 4,327,760 | 3,690,910 | 575,932 | 60,918 |
Table 2.
The test of diffusion effects.
| Aggre. Recycle. | Food Waste | Bulk Waste | Paper | Metal | Glass | Plastics/Rubber | |
|---|---|---|---|---|---|---|---|
| 0.0188 ** (2.7467) a | 0.0221 ** (3.0926) | −0.0052 (−1.4221) | 0.0096 ** (2.4051) | 0.0034 * (1.7227) | 0.0019 * (1.9249) | 0.0022 * (2.1665) | |
| 0.1921 ** (2.2707) | −0.1212 (−0.5006) | 2.1378 (1.7442) | 0.1828 * (2.0033) | 0.2962 ** (2.2685) | 0.0467 (0.2863) | 0.1324 (1.1480) | |
| −0.4866 ** (−2.3933) | −0.5186 (−0.2839) | −149.12 (−1.7259) | −0.8099 * (−1.9863) | −3.3624 ** (2.9341) | −1.3357 (−0.2452) | −3.3334 (−1.2532) | |
| R2 | 0.3445 | 0.7634 | 0.4721 | 0.2689 | 0.4481 | 0.0087 | 0.1292 |
| obs. no. | 18 | 13 | 11 | 18 | 18 | 18 | 18 |
a The value of t-statistics is expressed in the bracket. ** Represents 95% significance level. * Represents 90% significance level.
Table 3.
The estimates of external force, internal force and ceiling of recycling rate.
| Estimates | Recyclables | Paper | Metal Products |
|---|---|---|---|
| Coefficient of internal force, | 0.2316 | 0.2183 | 0.3311 |
| Coefficient of external force, | 0.0395 | 0.0355 | 0.0349 |
| Ceiling of recycling rate, | 0.4759 | 0.2696 | 0.0985 |
| Recycling rate in 2016 | 0.4240 | 0.2299 | 0.0947 |
| Performance of recycling | 89.09% | 85.27% | 96.17% |
© 2017 by the authors. Licensee MDPI, Basel, Switzerland. This article is an open access article distributed under the terms and conditions of the Creative Commons Attribution (CC BY) license (http://creativecommons.org/licenses/by/4.0/).
Share and Cite
MDPI and ACS Style
Chen, Y.-T.; Yang, F.-C.; Yu, S.-H. The Diffusion Effect of MSW Recycling. Sustainability 2018, 10, 40. https://0-doi-org.brum.beds.ac.uk/10.3390/su10010040
AMA Style
Chen Y-T, Yang F-C, Yu S-H. The Diffusion Effect of MSW Recycling. Sustainability. 2018; 10(1):40. https://0-doi-org.brum.beds.ac.uk/10.3390/su10010040
Chicago/Turabian StyleChen, Yi-Tui, Fu-Chiang Yang, and Shih-Heng Yu. 2018. "The Diffusion Effect of MSW Recycling" Sustainability 10, no. 1: 40. https://0-doi-org.brum.beds.ac.uk/10.3390/su10010040
Note that from the first issue of 2016, this journal uses article numbers instead of page numbers. See further details here.