Article

Spatial-Temporal Dynamics of the Economic Efficiency of Construction Land in the Pearl River Delta Megalopolis from 1998 to 2012

Guangzhou Institute of Geography, Guangzhou 510070, China
*
Author to whom correspondence should be addressed.
Submission received: 14 November 2017 / Revised: 26 December 2017 / Accepted: 27 December 2017 / Published: 28 December 2017
(This article belongs to the Special Issue Methodological Advances in Research on Sustainable Ecosystems)

Abstract

:
Since the 1980s, the rapid, extensive, and dispersed urban expansion in the Pearl River Delta megalopolis (PRDM) has led to landscape fragmentation and the inefficient use of construction land. Like other developed regions in China that are subject to the dual challenges of shortages of construction land and deterioration of the ecological environment, it is becoming increasingly important in the PRDM to improve the land-use efficiency of urban construction. However, current methods for assessing land-use efficiency do not meet the emerging needs of land-use planning and policymaking. Therefore, using the American Defense Meteorological Satellite Program (DMSP)/Operational Linescan System (OLS) nighttime light imagery and Landsat TM data, this study aims to develop a timely and efficient approach to model the high-resolution economic efficiency of construction land (EECL). With this approach, we mapped the reliable EECL of the PRDM at township level and with a one-kilometer grid. Next, the study compared the temporal changes and revealed the spatial-temporal dynamics in order to provide a scientific reference for informed land-use planning and policymaking. The results show that since 1998, the economic efficiency of construction land in the PRDM increased in general but varied significantly throughout the area. Further, these disparities widened from 1998 to 2012 between the PRDM’s inner and peripheral circles. Only one-fifth of the towns and subdistricts were categorized as fast-growth or ultrafast-growth, with the majority located in the most developed areas of the PRDM’s inner circle. In order to improve the efficiency of construction land in the PRDM and realize sustainable development, differentiated land-use policies for the inner and peripheral circles were proposed. The inner circle should focus on promoting the efficiency of existing construction land and encourage urban renewal, while the peripheral circle should enhance the control of new construction land and improve its efficiency.

1. Introduction

Traditional economic growth has brought an amazing economic boom to China over the last 30 years [1], but at the cost of the heavy consumption of land resources and a massive loss of natural habitat [2], leading to low efficiency and fragmented construction [3,4]. How to balance the economic development and ecological environment protection is still a huge challenge that many countries are meeting [5,6,7,8]. Intensive and effective use of construction land has been proposed as the solution to these problems [9,10]. In order to improve the efficiency of construction land and economic development, the Chinese government has implemented a series of land-use policies and strategies, such as market-oriented land-use reform, which aims to increase the price of industrial land [11], and the recent strategy of ecological civilization construction. Moreover, improving land-use efficiency has become a pivotal solution for resolving conflict between socioeconomic development, environmental needs, and high-quality farmland conservation in China, especially in a rapidly urbanizing area such as the Pearl River Delta megalopolis (PRDM). Thus, mapping more elaborate land-use efficiency is necessary in order to inform policymaking.
The economic efficiency of construction land (EECL) is the most frequently used proxy of land-use efficiency. It is measured as non-agricultural gross domestic product (NAGDP) per unit of construction land [12]. Studies that have focused on the EECL in China have usually analyzed the holistic timeline of land-use economics or the comprehensive efficiency of a county, city, or economic zone [13,14,15,16] because of data deficiency. Some megalopolis-level studies have also analyzed the spatial-temporal changes of land-use efficiency. However, most studies have based their research at city level [17,18], which means that they show little about the spatial dynamics of urban land-use efficiency. Thus, a gap exists between land-use efficiency analysis and informed policymaking. Geographic information system (GIS) could be an important tool to bridge the gap. Some researches even develop a GIS-based spatial decision support systems and apply it to water and energy management [19,20,21].
Remote sensing is one of the most effective ways to obtain geographic spatial information. The Operational Linescan System (OLS) of the American Defense Meteorological Satellite Program (DMSP) can detect not only the glare from urban areas but also the low light from small settlements and traffic streams. Hence, the remote sensing of nighttime light could provide a straightforward way to map the distribution of human activities and their intensity [22]. Abundant research has demonstrated the significant spatial correlation between nighttime lights and socioeconomic indexes. This correlation indicates that nighttime light imagery can be used for the spatial analysis of socioeconomic indexes. Elvidge et al. examined 21 nations’ data and found that human activities were highly correlated with nighttime light values; thus, nighttime light data could be used to estimate population, GDP, and electric power consumption [23]. They further validated the strong spatial-linear relationship between nighttime light areas and socioeconomic indexes using data from over 200 nations for 1994 to 1995 [24]. Doll et al. used radiance–GRP relationship models to create the first global GDP map of the relationship between nighttime light areas and GDP using regional GDP maps (at five kilometer resolution) of America and 12 Member States of the European Union, excluding Luxembourg [25,26]. Ghosh et al. achieved an accurate estimate of actual state-level economic development in America and Mexico by constructing a regression model of nighttime light data and economic statistics [27]. The authors suggested that this model could be used to verify official economic statistics. Thereafter, they mapped global GDP using regression models based on groups in order to reduce the errors in global GDP estimations [28]. Studies have also carefully considered radiance–DP (RAD–GDP) relationships at national, provincial, and county levels; however, very few have discussed such a relationship in a large metropolitan region. A megalopolis is a strongly homogeneous zone of economic activity compared with a country or region. This homogeneity may help to reduce estimating errors and thereby build a better linear RAD–GDP model inside a megalopolis.
New DMSP data products produced by National Oceanic and Atmospheric Administration–National Geophysical Data Center (NOAA-NGDC) already include a one-kilometer gridded global GDP map, which was produced using Ghosh et al.’s method [27,28]. In recent years, related research has begun to focus on China, constructing regional models of GDP and light values [29,30,31] and creating a one-kilometer GDP grid with shift-share method [29]. However, these maps based on global or national level models had not been validated and the estimation errors were too large to provide scientific and thus applicable references for regional land-use policy. Consequently, it is necessary to develop a more efficient regional model to map high-resolution and reliable GDP and the EECL by using the characteristics of economic and lighting patterns in a large metropolitan region. In this study, we chose the PRDM as the research area to construct and verify the regional model. The study was designed as follows (see Figure 1): (1) the extraction of the RAD of construction land in 1998, 2006, and 2012 in the PRDM using a combination of Landsat TM data and nighttime light imagery; (2) the construction of a RAD–NAGDP regression model at county level and the modeling of further downscaling to township level and even to a one-kilometer grid; and (3) analysis of the spatial variations of the EECL in the PRDM and their evolution since 1998 in order to inform land-use policy proposals for the PRDM in the transition period.

2. Materials and Methods
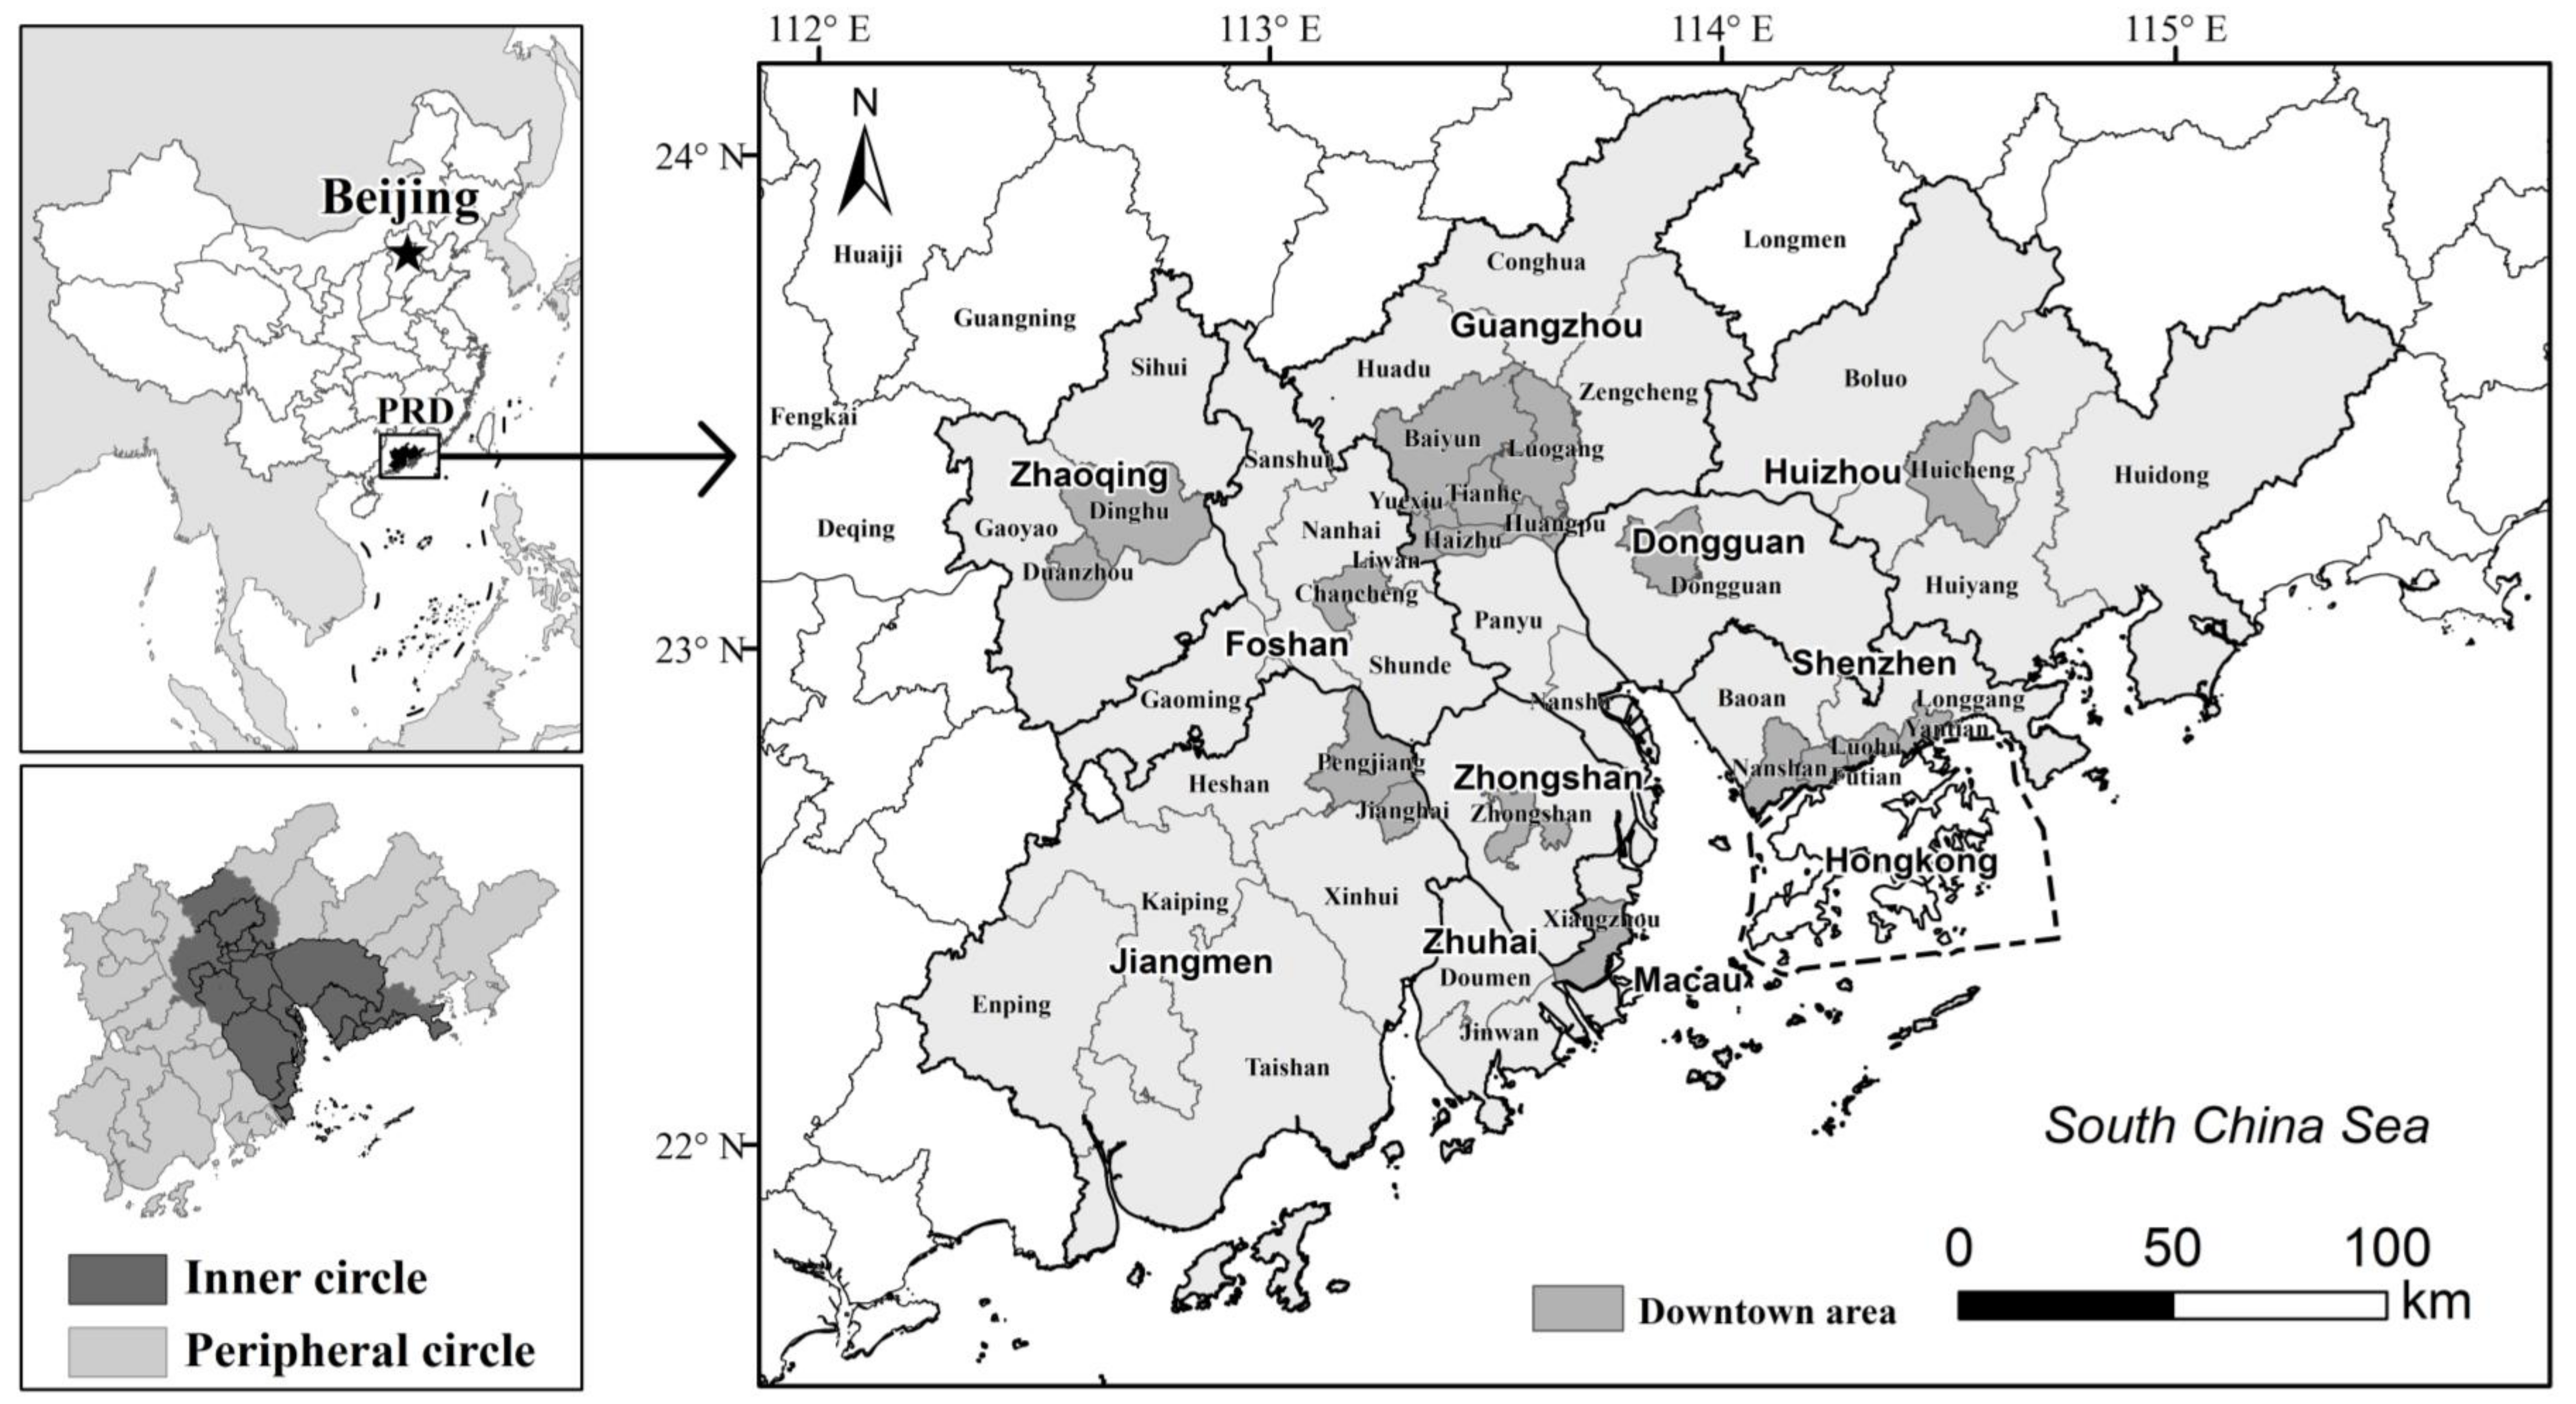
2.1. Study Area

The PRDM (see Figure 2), located in south China, is one of the most densely populated and rapidly urbanizing areas in the country. Since the launch of China’s reform and opening-up policy in 1978, the PRDM has become one of the three fastest-growing economic regions of China. The PRDM’s GDP increased at an astonishingly high annual rate of 18.6% from 1978 to 2012 and accounted for 8.4% of China’s total GDP in 2012. Alongside such rapid economic and population growth, construction land in the PRDM has expanded dramatically during the last 20 years, from less than 3000 km2 to approximately 8000 km2, to cover approximately one-fifth of the total land area. The PRDM is referred to as one of the densest networks of cities. It includes nine cities and 43 counties in Guangdong Province, ranging over a total area of 41,735 km2 with a population of nearly 57 million. The nine cities are Guangzhou, Shenzhen, Zhuhai, Dongguan, Zhongshan, Foshan, Huizhou (excluding Longmen County), Jiangmen, and Zhaoqing (excluding the four counties of Guangning, Huaiji, Fengkai, and Deqing). The PRDM can be approximately divided into two economic subregions: the inner and peripheral circles. The former is the most densely populated and fastest-growing area in the PRDM, while the latter, in contrast, has experienced relatively gradual economic growth and lower population density.
Since the 1980s, because of the low-priced and abundant land resources and a favorable location (adjacent to Hong Kong), the PRDM has attracted substantial foreign investment from developed countries and regions such as Hong Kong, Taiwan, the United States, and various countries in Europe. Such investment has driven rapid economic growth and decentralized urban sprawl [32]. Alongside the fast urban expansion, the absence of planning control in semi-urban areas (e.g., the urban fringes and urbanized villages) has led to massively inefficient use of the land called the “three olds” [33]. The “three olds” include three types of land: old town areas, old villages (urbanized villages), and old industrial areas. Urban construction in these areas has been characterized by a land-use pattern of low intensity and high density, along with poor quality urban and rural environments due to a lack of open and green spaces [3]. Because the proportion of construction land is already very high in the PRDM, the shortage of land resources has become the main obstacle to further economic development. The primary solution to this problem is greater land-use efficiency. Thus, the Guangdong government implemented the “three-old redevelopment” policy in 2008 and reduced urban land supply in order to catalyze the renewal of old urban areas and resolve the problem of the land-resource shortage

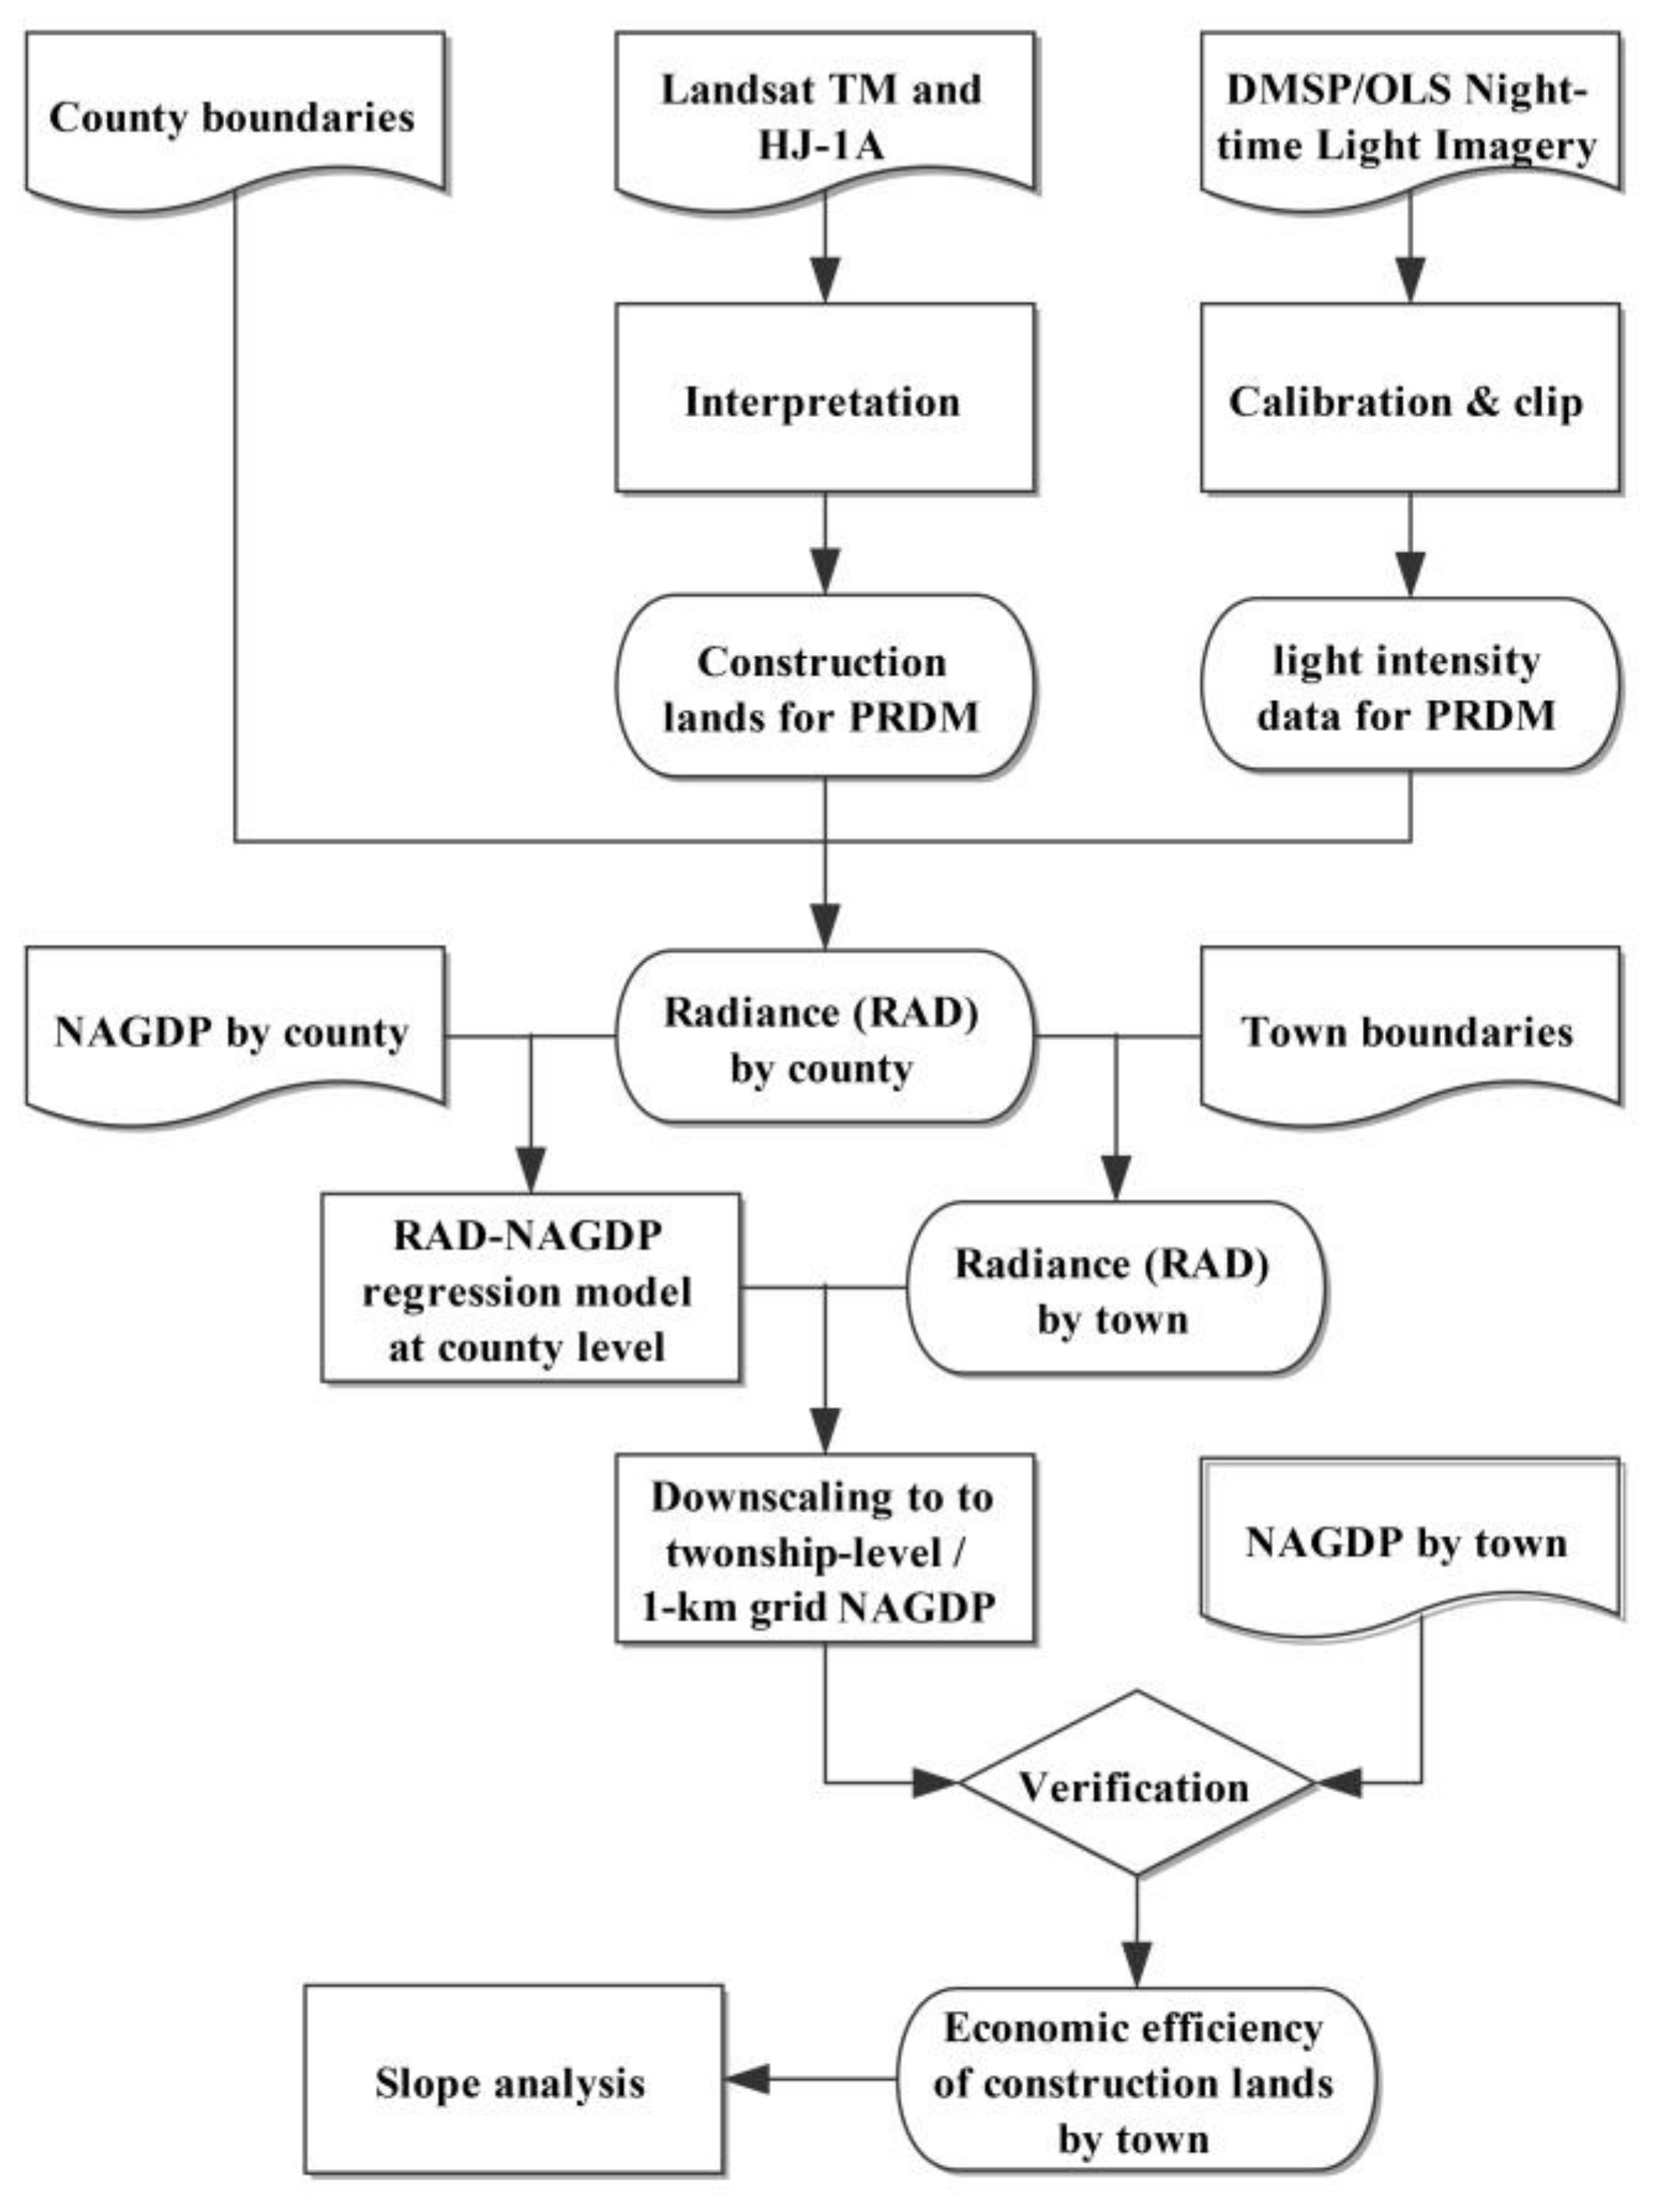
2.2. Remote-Sensing Images: Landsat TM and HJ-1A Satellite

In this study, Landsat TM images from 1998 and 2006 and HJ-1A satellite images from 2012 were used to reveal the PRDM’s construction land. Because Landsat TM ceased in 2012, we used HJ-1A satellite images produced by China as substitutes. Both image types have the same spatial resolution of 30 m. The geometry of all the remote-sensing images was rectified before interpretation. We then employed an artificial visual interpretation method (AVIm) to extract the distribution of built land in the PRDM in 1998, 2006, and 2012. AVIm is a very efficient way to extract targeted spatial and semantic information because it mainly relies on the experience and knowledge of interpreters. Consequently, AVIm is still one of the most important methods for remotely sensed image interpretation [34,35,36]. We preprocessed all the remote-sensing images using ERDAS IMAGINE (version 9.1) software and finalized interpretation with the tool developed in ARC Macro Language based on ArcGIS Workstation (version 9.1) software. Next, we established 1000 random checkpoints (half were in construction land and half were in non-construction land) every three years to assess their overall classification accuracies and Kappa coefficients (see Table 1). All 1000 checkpoints were verified using high-resolution remote-sensing images and field surveys. As Table 1 shows, the classification accuracies are all higher than 90% and the Kappa coefficients are all greater than 0.9. The accuracy tests indicate that the interpretations are reliable; thus, we are able to use them for analysis.
Figure 3 shows the fast expansion of construction land from 1998 to 2012. In 1998, the total area of construction land is 1765 km2, while in 2012, the area has increased to 7018 km2. Most of the new construction land is located in the inner circle, especially in Foshan, Guangzhou, Dongguan, and Shenzhen.

2.3. DMSP-OLS Nighttime Light Imagery
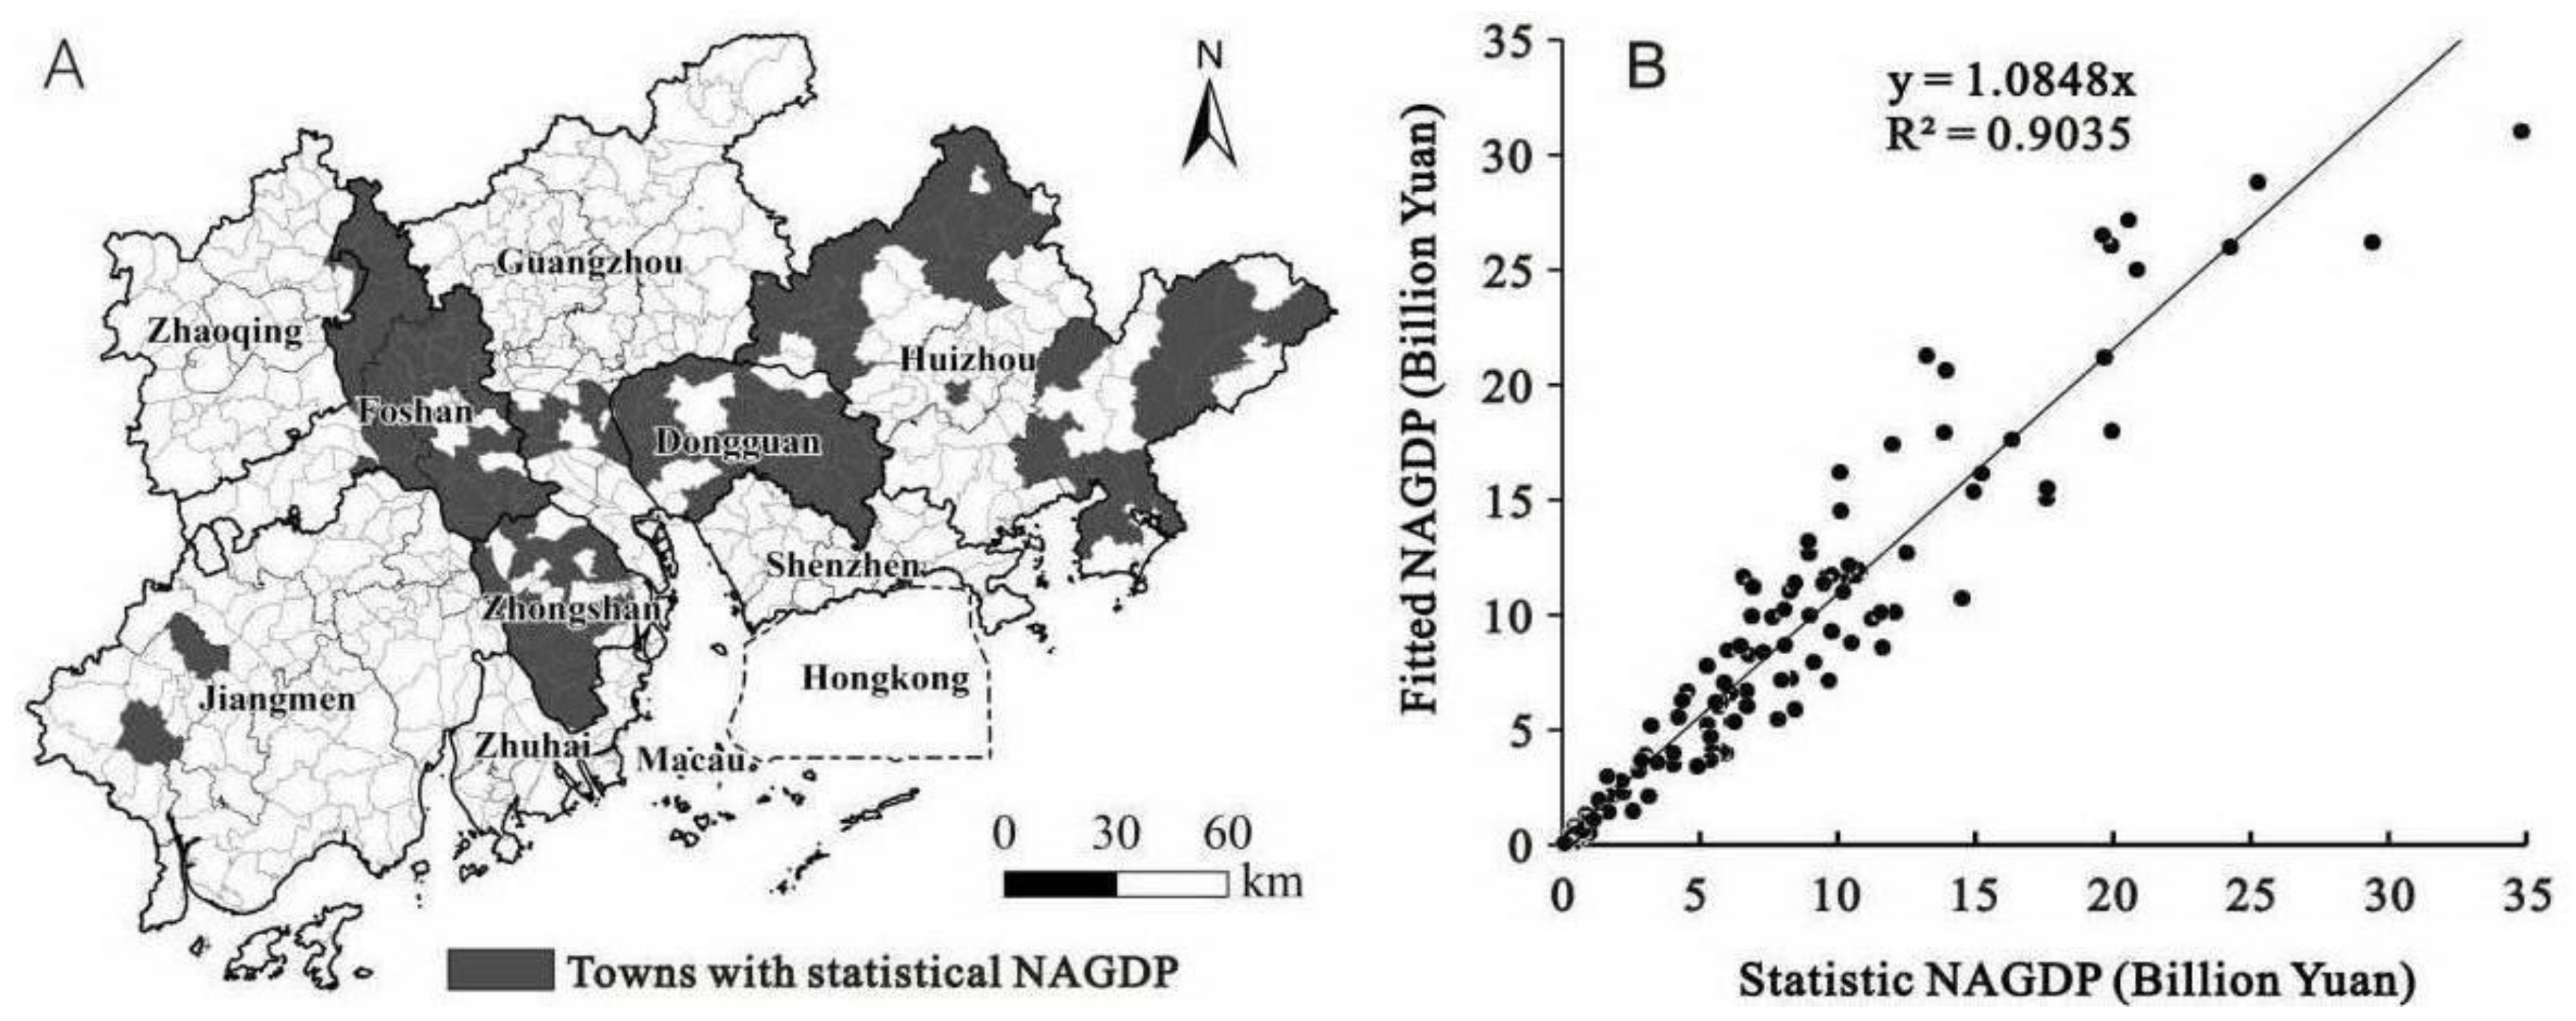
The nighttime light imagery used in this study was derived from Version 4 of the DMSP-OLS Nighttime Lights Time Series (V4DNLTS), which was produced by the NGDC, headed by the NOAA. We downloaded the data set from the NGDC website [37]. V4DNLTS has three product types: cloud-free coverage, raw average light data (without further filtering), and nighttime stable lights (NSL). All of these were processed to remove the effects from sunlight, glare, moonlight, clouds, and auroras [38]. We used the NSL data in this study because they are annual composites of all available archived smooth resolution data for the appropriate years, which meant that background noise (ephemeral events such as fires) was removed and that the data only contained persistent light such as light from cities and towns. The background noise was replaced with zero values. The images were 30 arc second grids with data values ranging from 1 to 63. In all of the NSL images, the data value of each pixel represented the light’s brightness.
The NSL imagery for 1998, 2006, and 2012 were obtained from different sensors, none of which had on-board calibration [39,40]; consequently, differences between the sensors, differences in the crossing times between satellites, and the degradation of sensors caused discrepancies and fluctuations in the data values of the different sensors and years [38,39,40,41]. Thus, the NSL imagery could not be used directly before correction [24,40]. First, we extracted the imagery based on the extent of the PRDM; then, we used the methods developed by Liu et al. [42] to correct the extracted images. Liu et al.’s methods included three steps: (1) intercalibration to improve comparability; (2) intra-annual composition for further denoising; and (3) interannual series correction to make the images from different years more comparable. The modified NSL images from the PRDM are shown in Figure 4. Because all NSL imagery after 2010 was obtained from only one sensor, the NSL imagery in 2012 was processed without intra-annual composition.

2.4. NAGDP

In this study, the NAGDPs of all 43 counties over three years were sourced from the corresponding statistical yearbooks of Guangdong Province and the nine cities. Because of the adjustment of administrative divisions after 2000 in Guangzhou and Zhuhai and the lack of county-level GDP for Shenzhen and Jiangmen (urban districts), there were only 33 county units in 1998. NAGDP data at township level were sourced from the statistical yearbooks or bulletins of the counties. Because all counties did not publish their towns’ NAGDPs, in 2012 the data of only 120 towns from 524 were acquired. In order to mitigate the influence of inflation on GDPs, all statistical NAGDPs were converted to 2010 constant prices with GDP deflectors.

2.5. RAD–NAGDP Regression Model at County Level

RAD is the product of construction land and the corresponding data values in terms of nighttime light imagery. First, we converted the calibrated raster of nighttime light imagery into polygons. We then used the polygons for construction land in 1998, 2006, and 2012 to clip the polygons of nighttime light. Following this, we calculated each polygon’s product of construction land and data values of nighttime light. Last, we added the total products in each county as their own RADs. According to a prior study [30,43,44,45], there is a linear regression relationship between RAD and economic activity; thus, we developed linear RAD–NAGDP regression models for 1998, 2006, and 2012 respectively by using the statistical GDP and RAD for each PRDM county as follows:
G D P n a s = K i × R A D + a i
where G D P n a s is the statistical NAGDP in a county and Ki and ai are the parameters determined by the regression analysis of the sample data. After the values of Ki and ai were derived, we used Equation (1) to estimate county-level NAGDP.
Equations (2)–(4) are the regression models for the estimations of county-level NAGDP in 1998, 2006, and 2012 respectively. The R-squared values of the three models were larger than 0.8, indicating the strong positive correlations between RAD and NAGDP at county level. The three equations’ intercepts were zero; thus, they would not estimate negative NAGDP values [43]. The coefficient (Ki) in the equations increased from 1998 to 2012, revealing that NAGDP grew faster than RAD.
G D P 98 s = 571.70 × R A D
G D P 06 s = 598.07 × R A D
G D P 12 s = 824.40 × R A D

2.6. NAGDP Estimations at Township and 1 km Levels

Based on the assumption that the relationships at county level are still valid at a smaller scale, we estimated the NAGDPs at township level and 1 km resolution. Further, we were able to calibrate the estimations based on the statistical NAGDP of each county in order to produce more accurate GDP maps at township level and 1 km resolution. The equation for this calibration is as follows:
G D P n a , i e r = G D P n a , i e × ( G D P n a s / G D P n a , a l l e )
where G D P n a , i e r is the rectified estimated NAGDP for town i or pixel i (1 km), G D P n a , i e is the unrectified estimated NAGDP of town i or pixel i, G D P n a s is the statistical NAGDP of the county where town i or pixel i is located, and G D P n a , a l l e is the estimated NAGDP of the county where town i or pixel i is located.
In accordance with the RAD–NAGDP empirical equations for the PRDM (Equations (2)–(4), the intercept in Equation (1) is zero. Then, by substituting Equation (1) into Equation (5), we obtained Equation (6) as follows:
G D P n a , i e r = K i × R A D i × G D P n a s / ( K i × R A D a l l ) = G D P n a s × R A D i / R A D a l l
where RADi is the RAD of town i or pixel i and RADall is the RAD of the county that contains town i or pixel i (1 km). Equation (6) clearly indicates that the NAGDP of town i or pixel i (1 km) equals the product of its share of RAD from the county’s total RAD and NAGDP. The spatialization of NAGDP in this study is actually the allocation of NAGDP in accordance with the proportion of RAD (the shift-share method). We then used Equation (6) to calculate the GDP of each town and each 1 km grid of construction land over three years.
It is important to note that the relationships at county level may become invalid at a finer scale; thus, the finer-scale relationship should be validated. In this study, we undertook the validation by using the statistical NAGDPs of 120 towns in 2012 (see Figure 5A). We calculated the R-squared and mean relative error (MRE) in order to score the accuracy of the estimation at township level.
The results of the validation indicate that the relative errors of 77% of the 120 samples were less than 35% and the MRE was 24.17%. Further, the slope of the linear fitting equation (with an intercept of zero) between the estimated NAGDP and statistical NAGDP is close to 1 (see Figure 5B), indicating that the spatialization results reflect the actual distribution of NAGDP at township level in the PRDM. As a result, we can use the results of spatialization for further analysis.

2.7. Estimation of the EECL
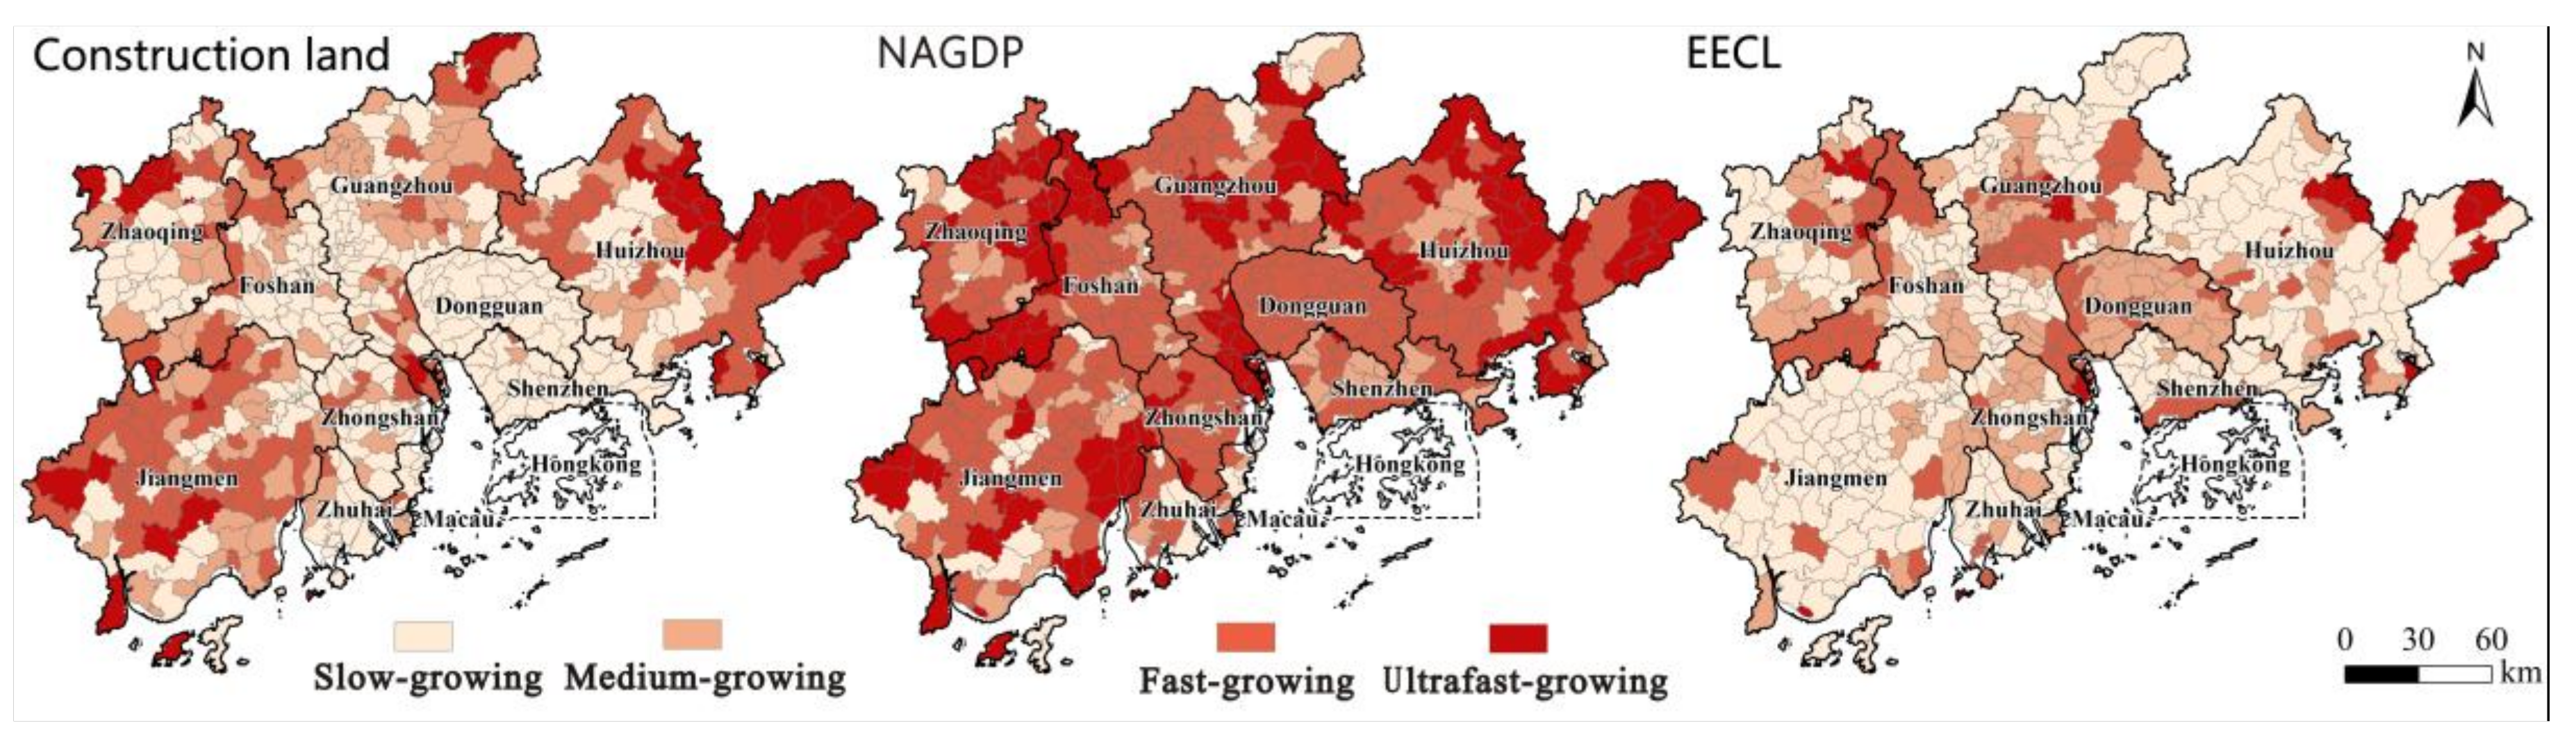
We calculated the EECL at township level and 1 km resolution, with a rectified estimation of NAGDP, in accordance with Equation (7) as follows:
E i = G D P n a , i e r / A i
where Ei is the EECL of town i or pixel i and Ai is the construction land of town i or pixel i.

2.8. Slope Value

The slope of the linear regression model can reveal the variables’ spatial-temporal dynamics (the trends and speeds) [38]. We used Equation (8) to calculate the slope values of the regression models of construction land, NAGDP, and the EECL for each town from 1998 to 2012.
S L O P E = n × Σ i = 1 n t i E i Σ i = 1 n t i Σ i = 1 n t E i n × Σ i = 1 n t i 2 ( n × Σ i = 1 n t i ) 2
where n is the total number of years, ti is year i, and Ei is the EECL of year i. Using the slope value, we determined the increasing type of construction land, NAGDP, and EECL for a town. The classifications of the growth types are presented in Table 2.

3. Results

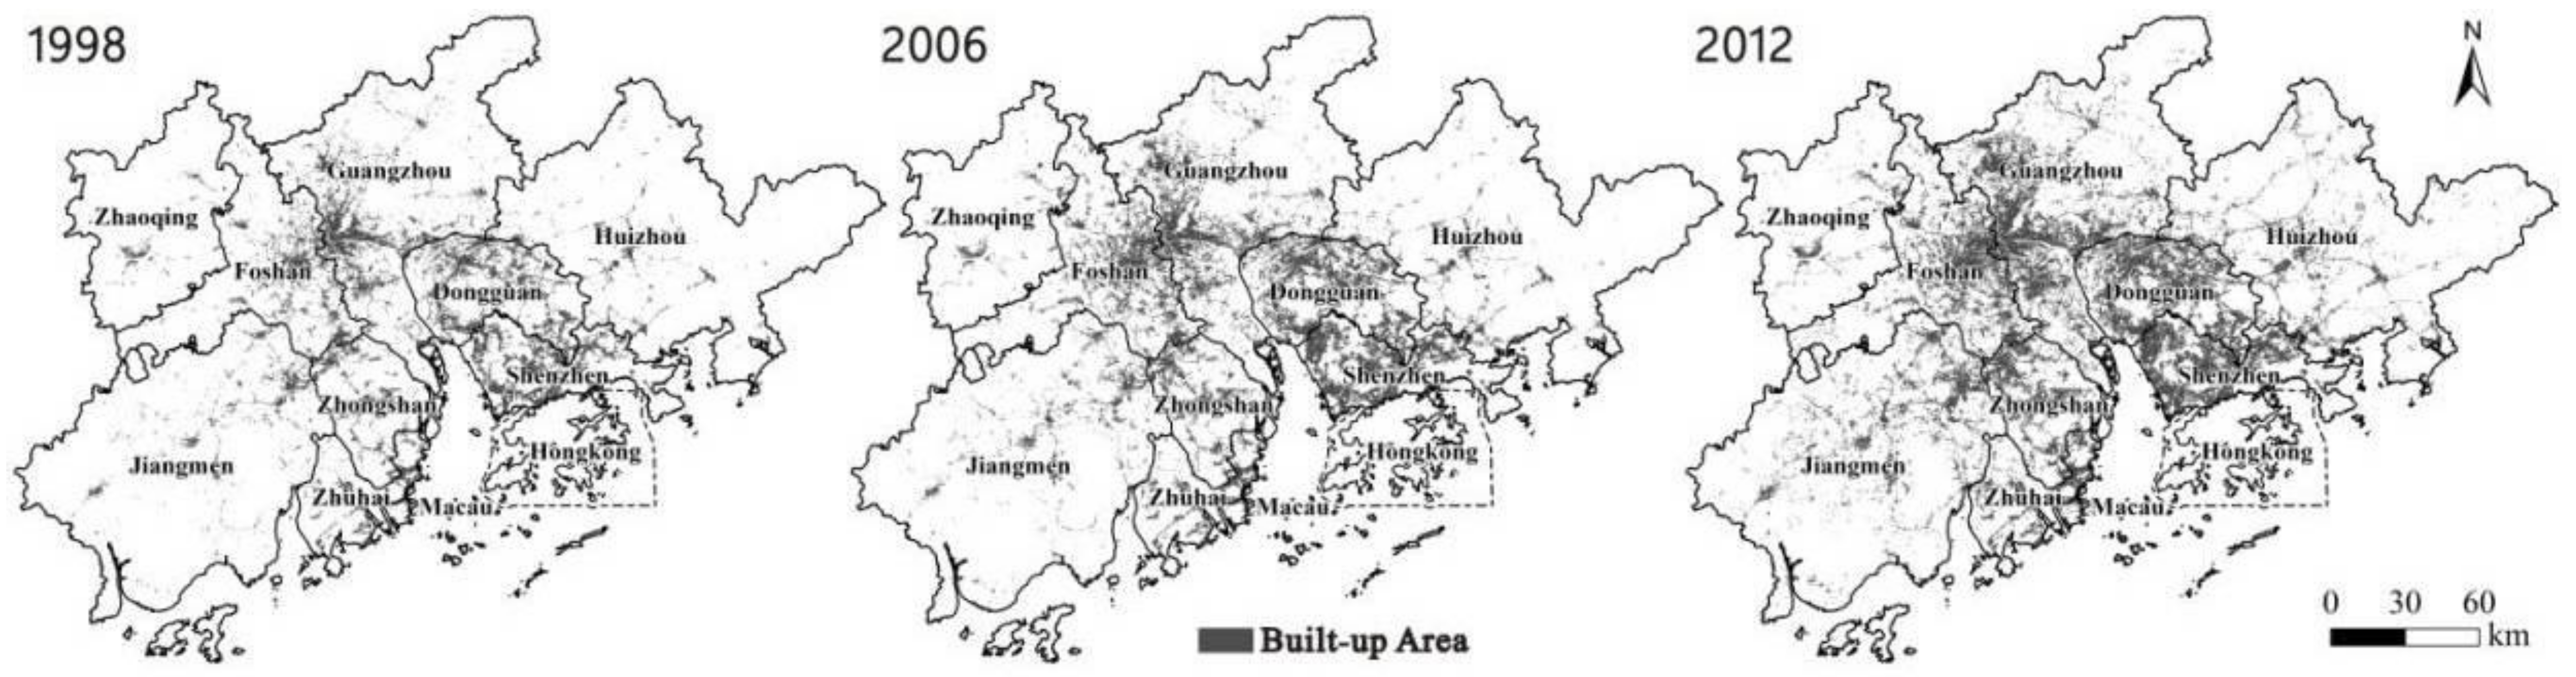
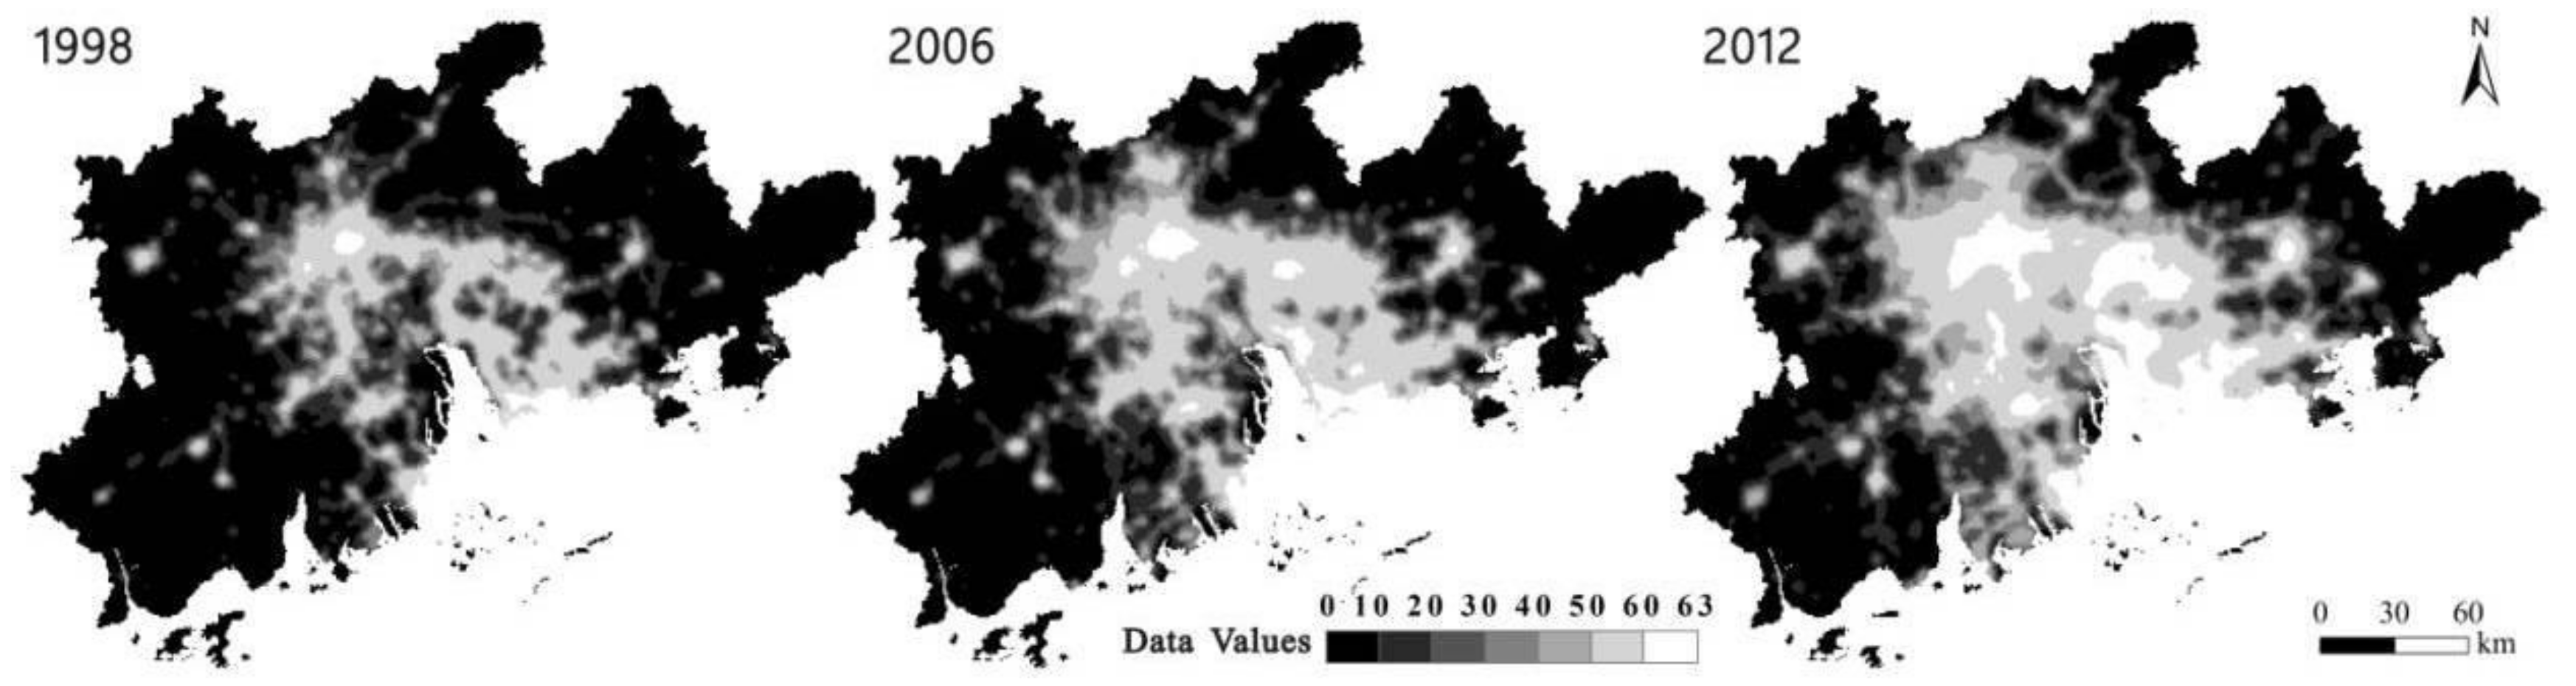
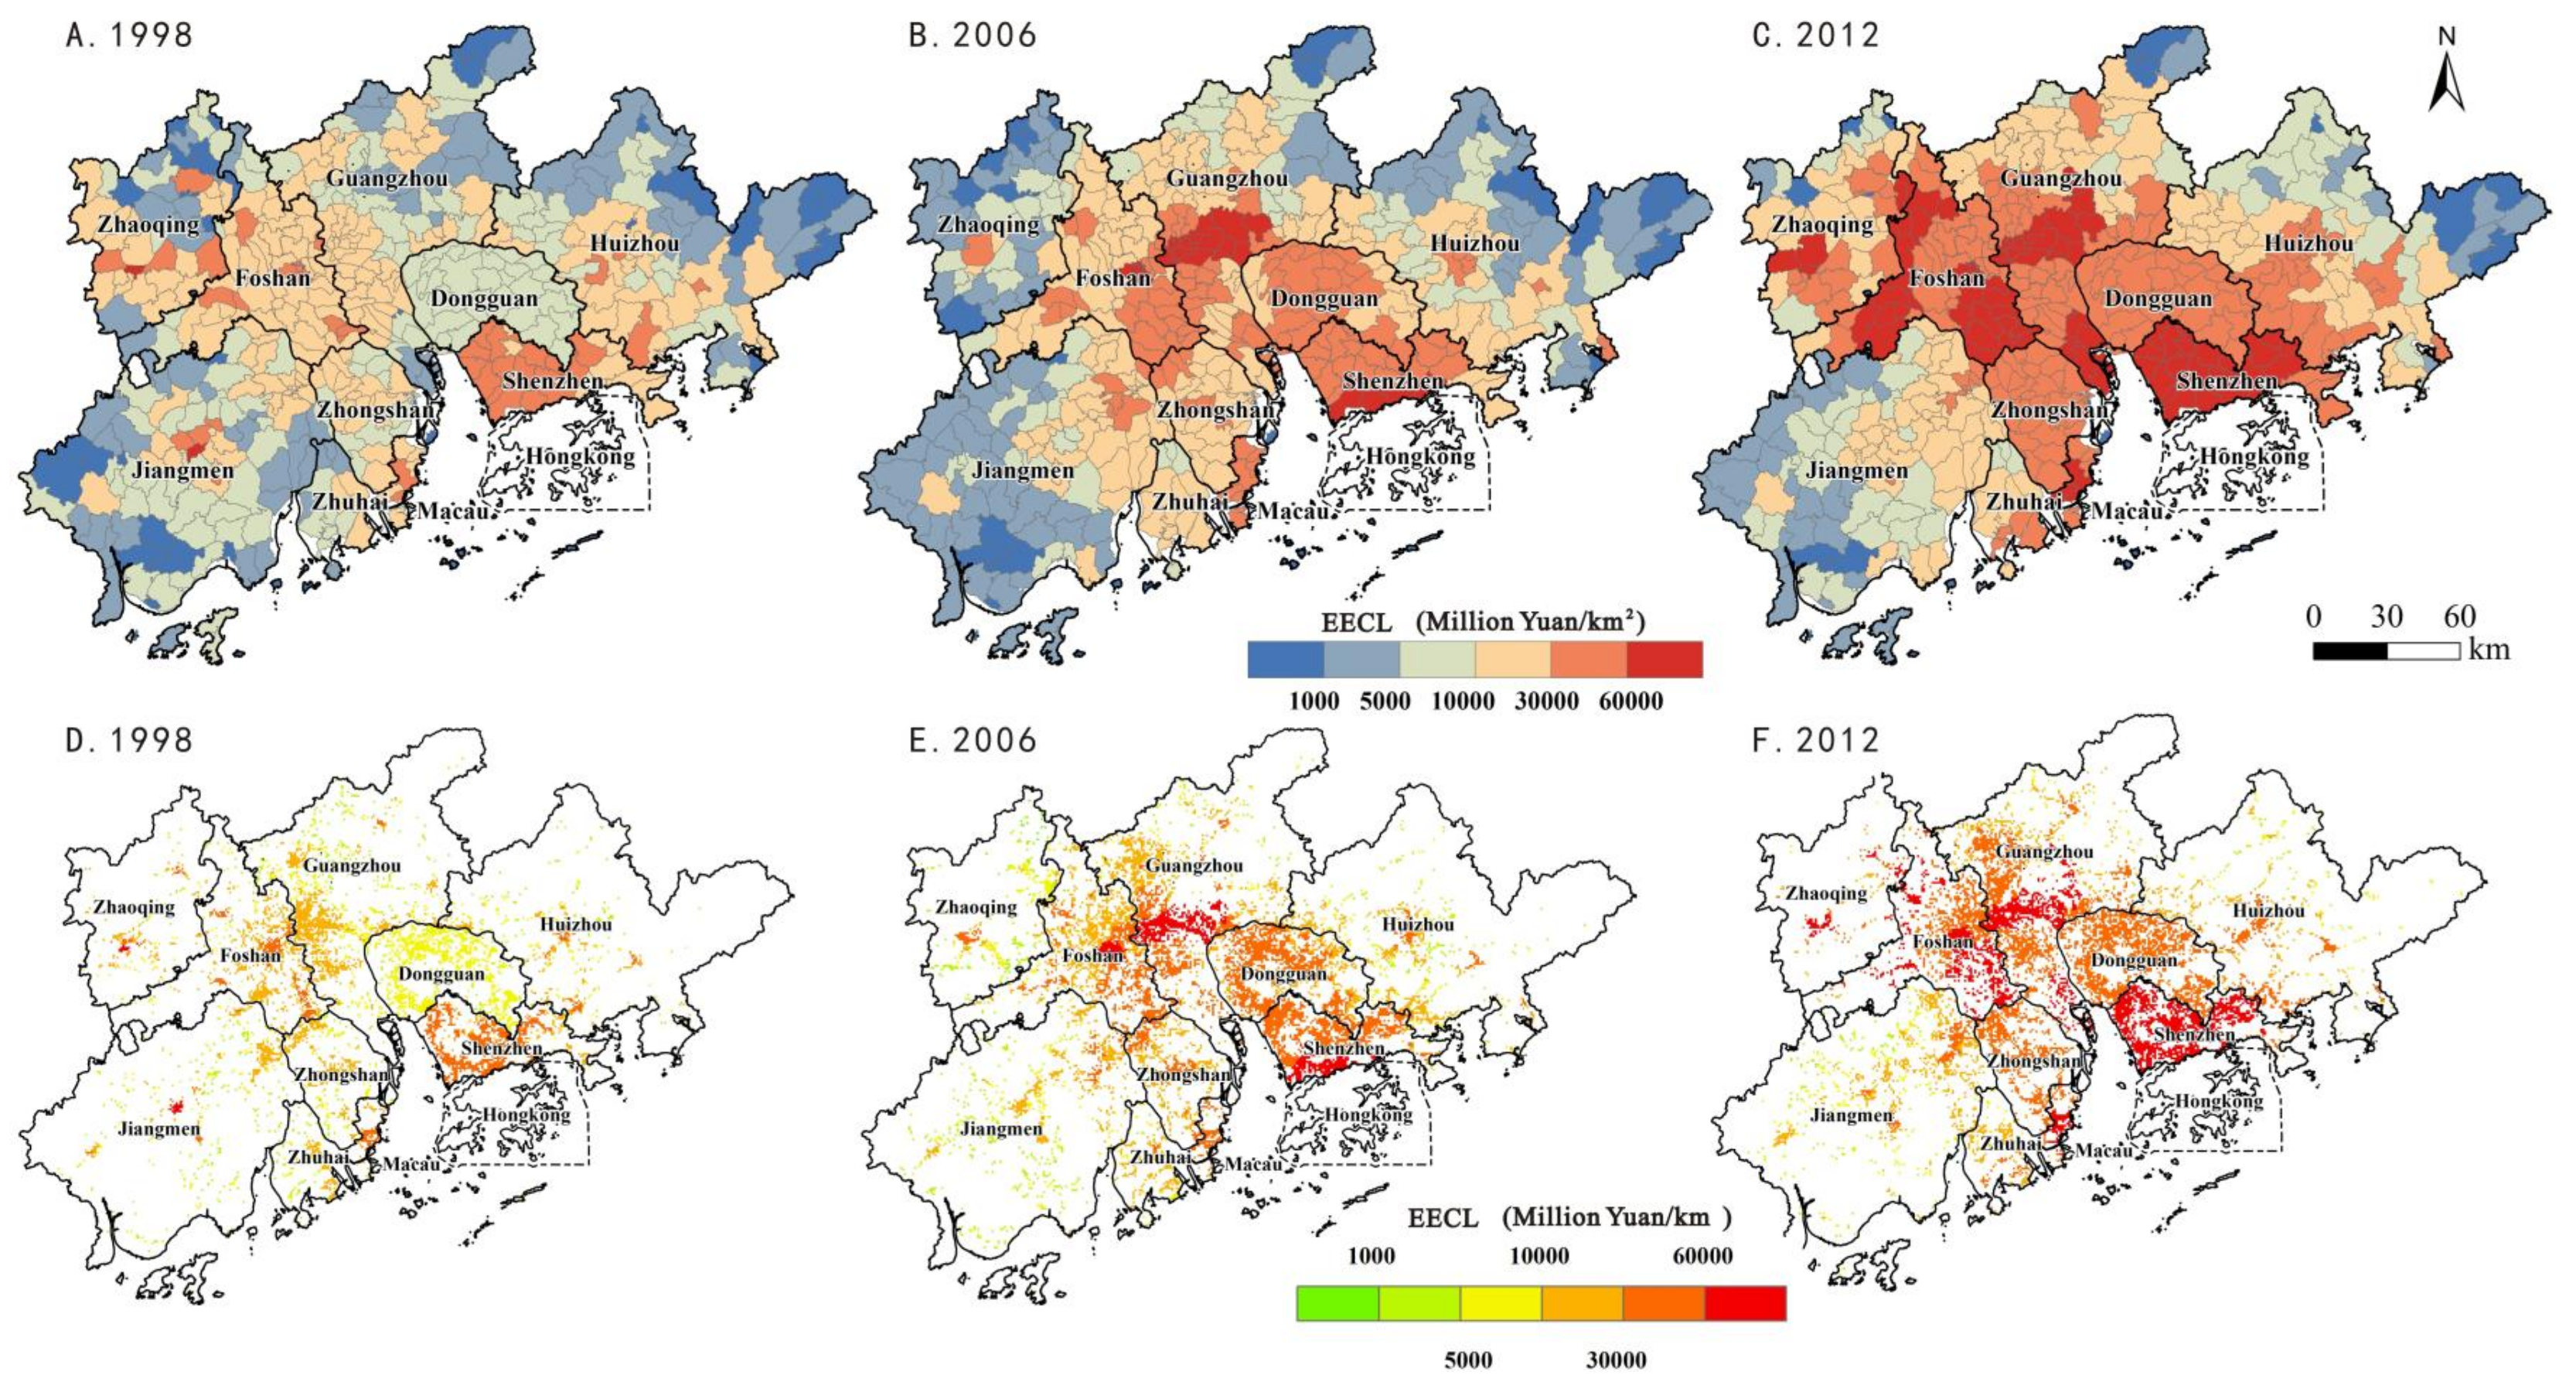
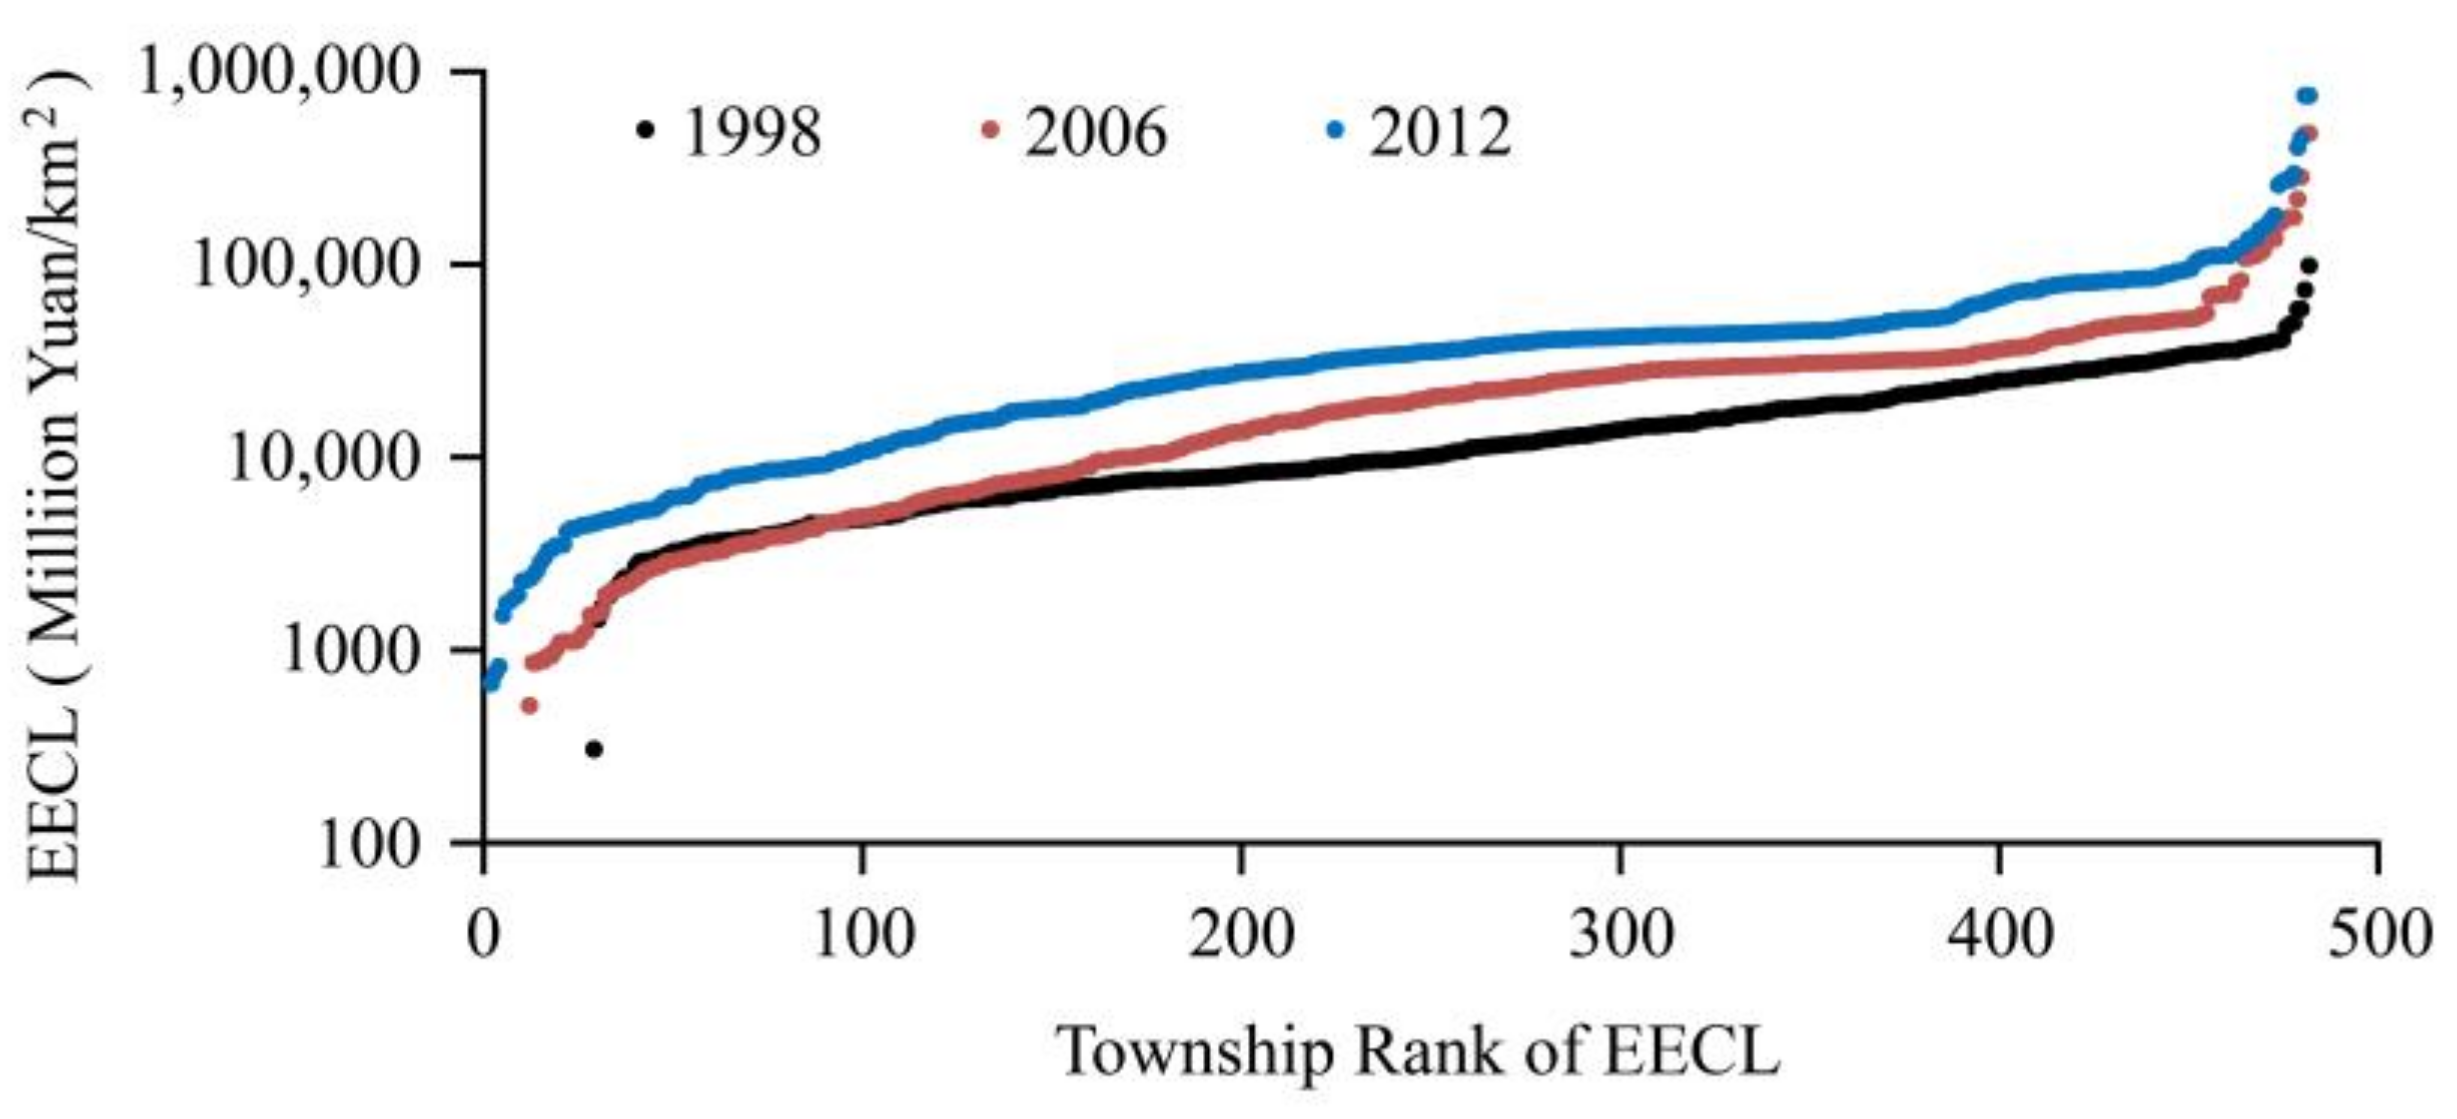
3.1. Spatial and Temporal Dynamics of the EECL

In most PRDM towns, the EECL increases rapidly from 1998 to 2012, especially in the inner circle of the PRDM (see Figure 6). The EECL of 90 towns exceeds 60,000 million yuan per km2 in 2012, whereas the number of towns in 1998 is only two. Moreover, in 1998, areas with high EECL values are mainly distributed in Shenzhen and then expand to the urban centers of Guangzhou, Foshan, Dongguan, and Zhuhai. Indeed, the EECL tends to decrease from the center outward. In 2012, the EECL of most areas in the inner circle has increased to more than 30,000 million yuan per km2. However, in the peripheral circle, except for northwestern PRDM, more than 50% of the EECL values for towns are less than 10,000 yuan per km2.
We can obtain more information about urban expansion from three one-kilometer resolution maps than traditional maps because the former show not only the expansion patterns of construction land but also the economic efficiency of built land. From 1998 to 2006, the PRDM’s newly expanded built land is mainly distributed in the suburbs of the inner circle cities and tends to spread along the major roads [46]. Meanwhile, the EECL has increased very quickly in downtown areas; further, the gaps in the EECL between downtown areas and suburbs has widened. From 2006 to 2012, the expansion of developed land slows significantly, especially in the inner circle as a result of the PRDM’s slow economic growth and the transfer of labor-intensive industries from the PRDM to the developing areas of Guangdong Province. Infilling has become an important type of urban expansion during this period. The highest NAGDP areas (red pixels) have expanded in Guangzhou, Shenzhen, Foshan, and Zhuhai.
Scatter plots of the EECL (see Figure 7) further indicate that the uptrend of these values in the PRDM are very obvious from 1998 to 2012. In 1998, 92% of the EECL values in towns are less than 3000 million yuan per km2. Then, the percentage decreases to 76% in 2006 and 52% in 2012. The highest EECL value decreases surprisingly from 95,848 million yuan per km2 in 1998 to 72,8061 million yuan per km2 in 2012. Meanwhile, the medium EECL value for all the towns increases from one million yuan per km2 to 27,548 million yuan per km2.

3.2. Contrast between the Inner and Peripheral Circles

The PRDM’s inner circle accounts for 29% of the total land area and more than 70% of the NAGDP. Table 3 shows that in 1998, 75% of the total NAGDP is produced in the inner circle; then, this percentage increases to 89% in 2006 and falls slightly to 85% in 2012. Other than the centralized trend in the NAGDP, the percentage of construction land in the inner circle declines from 75% in 1998 to 67% in 2012. The peripheral circle of the PRDM has become a region of rapid urban expansion. As the percentage of the inner circle’s NAGDP increases with the decrease in the percentage of construction land, the gap in the EECL between the inner and peripheral circles broadens distinctly. In 1998, the inner and peripheral circles have almost the same EECL values. The low EECL value in the inner circle in 1998 is very likely related to the massive expansion and inefficient utilization of construction land in Dongguan City. Afterward, the EECL value in the inner circle increases dramatically because of the inner circle’s industrial restructuring. Indeed, the EECL value in the inner circle increases almost fourfold from 1998 to 2012, whereas the EECL value in the peripheral circle increases by only 1.4 times during the same period.

4. Discussion

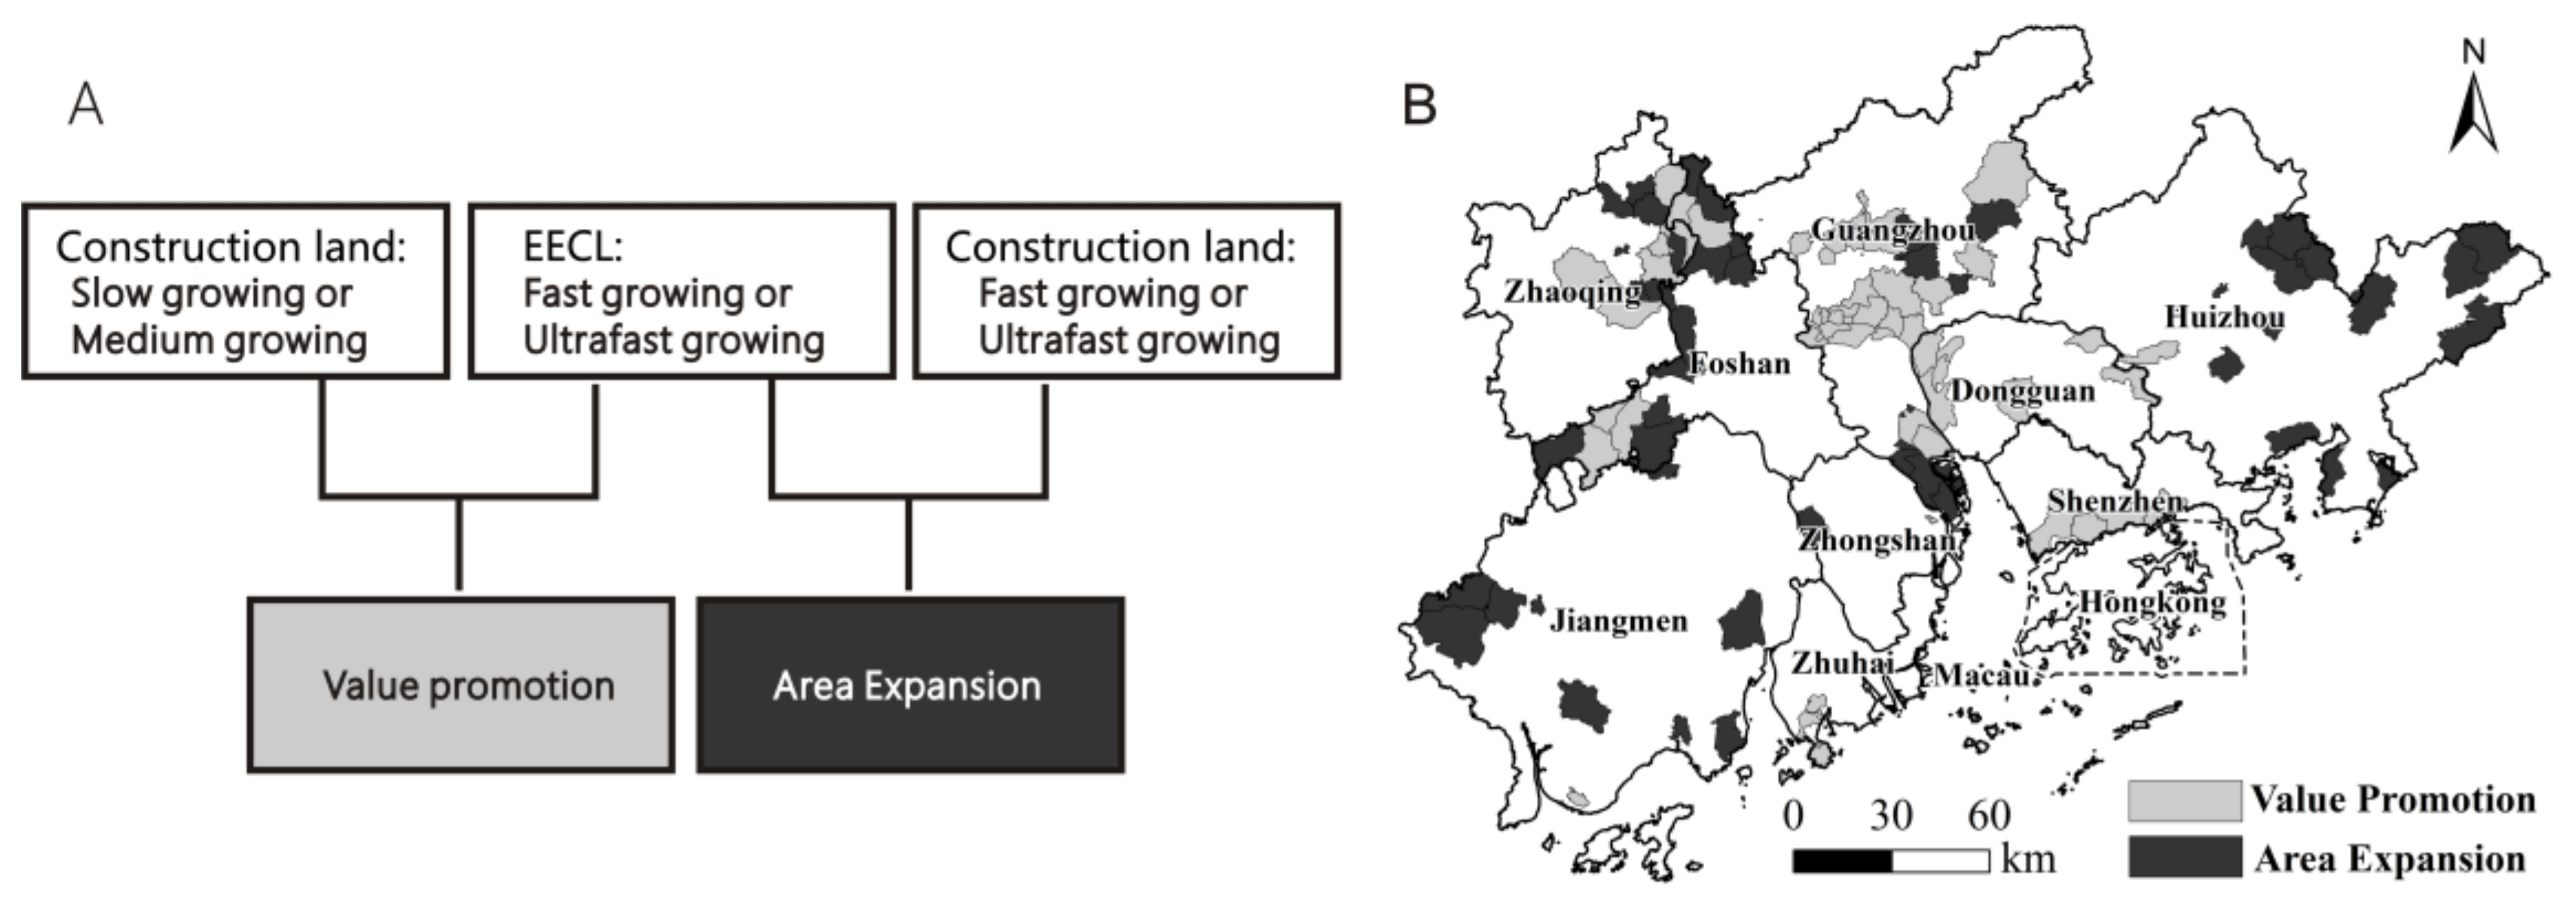
4.1. Types of Economic Growth

The relationship between regional GDP growth and increases in construction land is not constant at different development stages. Usually, in the early stage of industrialization, the increase of construction land contributes significantly to economic growth. However, together with economic growth, the contribution to such growth by land will gradually decline. Hence, by comparing construction land, NAGDP, and EECL growth types, we can learn the different impacts of urban expansion on economic growth in different regions. We calculated each town’s slope values for construction land, NAGDP, and EECL from 1998 to 2012 and then classified all the towns into four growth-based groups based on the criteria shown in Table 2. With regard to construction land, 25% of the towns are fast-growth or ultrafast-growth types (see Figure 8); however, the distribution is opposite to the EECL because the towns are mainly distributed in the PRDM’s peripheral circle. Most towns in the inner circle experience slow increases in construction land. With regard to NAGDP, 66% of the PRDM’s towns are fast-growth or ultrafast-growth types, indicating the fast development of the PRDM’s economy during the study period. With regard to the EECL, 58% of the towns are the slow-growth type; 22% are the medium-growth type; and only 20% are the fast-growth or ultrafast-growth type, with the majority of the latter located in the most developed areas of the PRDM’s inner circle and the developing areas on the PRDM’s periphery.
In Figure 9A, we further classify the towns that belong to fast-growth or ultrafast-growth types of EECL by their types of construction land growth. The first type is “value promotion”. This indicates the increase in the EECL that is attributed to the fast growth of NAGDP on existing construction land [14,47]. Most of these towns are urban city centers (see Figure 9B), which are areas characterized by a scarcity of land resources for urban expansion. The second type is “area expansion”, which means that the fast increase in the EECL is mainly attributed to the rapid increase in construction land. These towns are mainly distributed in the peripheral circle, where there are abundant land resources.

4.2. Policy Implications

The PRDM’s NAGDP increased rapidly from 1998 to 2012. The PRDM’s EECL also exhibited a rising trend, although this was not as significant as the NAGDP increase. This finding implies that the NAGDP’s rapid growth in the PRDM was driven, to some extent, by the high input of land resources. The spatial differentiation of the EECL was obvious in 1998, 2006, and 2012. The EECL declined from the center to the periphery, a characteristic that became more marked over time. Economic activity and construction land were highly clustered in the inner circle; moreover, the EECL was much higher there than in the peripheral circle. With regard to the EECL, the recent increase in built land should be organized in the inner circle in order to meet the goal of pursuing greater economic benefits. However, the overuse of land resources in the inner circle has resulted in a land resource shortage, a problem that has created a bottleneck for further economic and social development. The proportion of the inner circle that has been built upon reached 40% in 2012; further, most of the remaining land is mountain woodland, rivers, reservoirs and high-quality farmland all of which should not be developed. The environmental carrying capacity should also be considered in the context of construction land allocation because prosperous high-density cities in China have nearly exhausted such capacity [48]. The massive and disordered expansion of urban land has caused cultivated land and natural habitat in the inner circle to decrease quickly, thereby undermining sustainability and eventually resulting in an ecological problem of landscape fragmentation and ecosystem service function decline [3]. There are now very few available spaces for urban expansion in the inner circle. Thus, it is necessary to control urban expansion and protect pivotal ecological land in the PRDM because this is the only way to realize sustainable development.
Since urban expansion is constrained by land resources and the natural environment, the “three-old” developed land, with its low EECL values, could be the main spaces for urban economic growth [49]. According to the Department of Land and Resources of Guangdong Province, there were approximately 1450 km2 of “three-old” land in the PRDM in 2010, accounting for 18% of the total construction land. Figure 10 shows that of this “three-old” land, three-quarters are located in the inner circle. Such a vast amount of “three-old” land hinders the advance of the EECL. For example, Guangzhou and Shenzhen are the PRDM’s most developed cities. In Guangzhou, 36% of the built land belongs to “three-old” land, whereas the figure in Shenzhen is only 21%. This high proportion of low-efficiency “three-old” land in Guangzhou has led to a relatively lower EECL than that of Shenzhen. The “three-old redevelopment” policy launched in 2008 has facilitated industry transformation and upgrading in the inner circle; moreover, the policy has contributed to the fast EECL growth to some extent (e.g., in downtown Guangzhou, Shenzhen, and Dongguan). The renewal of inefficient developed land and urban consolidation are still critical approaches in the inner circle to upgrade industries and improve the EECL in the future.
From 1998 to 2012, the increase in construction land in the peripheral circle accelerated without corresponding rapid economic growth; thus, the EECL of the peripheral circle lagged behind that of the inner circle. The land-use intensity of the peripheral circle was only 10% in 2012; consequently, the PRDM’s main urban expansion will occur in the peripheral circle in the near future. According to the Master Planning of Land Use in Guangdong Province (2006–2020), 70% of the land quotas for new construction were allocated to the Huizhou, Zhaoqing, and Jiangmen peripheral circles. The land-use policy for the peripheral circle should thus focus on how to achieve the intensive use of newly expanded developed land. The methods could include raising the access threshold of industrial land, constructing intensive industrial parks, and constructing compact structures. By these means, inefficient or low-efficiency urban expansion, such as “three-old” land that was previously built upon in the inner circle, can be avoided. The Chinese Department of Land Management has established a “land development monitoring system” to monitor land-use change and penalize illegal urban sprawl [50]. Under this new strategy of ecological civilization construction for sustainable development, simply monitoring physical expansion is far from enough; dynamic land-use intensity should be included in the monitoring system.
Accordingly, land-use policies should be based on land-use intensity and efficiency in order to help optimal land-resource allocation. This study develops a method of EECL estimation at a high resolution for timely and elaborate monitoring, whereby the local Bureau of Land Management can dynamically and reasonably adjust new development quotas.

4.3. Future Works

This study explores the spatial-temporal dynamics of the EECL in the PRDM and their evolution since 1998 in order to propose informed land-use policy. Due to lack of data, we do not specifically discuss the dynamic mechanism of the spatial difference of EECL. However, it is a matter of great concern to us to understand why the difference between the inner and peripheral circles. In future works, we will further study the influence factors and their mechanism of the expansion of construction land, to explore the root causes of the difference among PRDM. These influence factors, including natural ecological zones, geographical location, the mode of economic development, the land use planning and governance policy, will exert a fundamental impact on the speed, efficiency and mode of land expansion.

5. Conclusions

In this study, a prompt and efficient method for mapping EECL was proposed. This method can be used to facilitate urban land-use planning. We first derived a strong positive RAD–NAGDP relationship at county level in the PRDM for 1998, 2006, and 2012 based on statistical NAGDP, DMSP/OLS nighttime light imagery, and Landsat TM data. We then successfully extrapolated this relationship to township level to map the NAGDP and EECL with an MRE of 24.17%. Although the PRDM’s EECL exhibited a general uptrend from 1998 to 2012, only a quarter of the towns belonged to fast-growth and ultrafast-growth types. The rapid expansion of construction land with relatively slow increases of the EECL has led to a shortage of land resources in the PRDM and ecological problems, especially in the inner circle. In order to cope with such difficulties, we suggested that land-use policymaking should be based on efficient land-use distribution and development. Thus, the land-use policy for the PRDM’s inner circle should focus on the reuse of low-efficiency developed land (“three-old” land); further, the land-use policy in the peripheral circle should focus on efforts to control the expansion of inefficient developed land.

Acknowledgments

This study was supported by the National Natural Science Foundation of China (41671130, 41501144 and 41601151), the Natural Science Foundation of Guangdong Province (2015A030313867), the Highlevel Leading Talent Introduction Program of GDAS (2016GDASRC0101), the Scientific Platform and Innovation Capability Construction Program of GDAS (2016GDASPT-0210), and the Science and Technology Program of Guangzhou, China (201707010427).

Author Contributions

Hongou Zhang proposed the research framework. Yuyao Ye and Shengfa Li drafted the paper. Yongxian Su analyzed the data. Further revision was undertaken by Qitao Wu and Changjian Wang. All authors have read and approved the final manuscript.

Conflicts of Interest

The authors have declared no conflicts of interest in this paper.

References

  1. Normile, D. China’s living laboratory in urbanization. Science 2008, 319, 740–743. [Google Scholar] [CrossRef] [PubMed]
  2. He, C.Y.; Liu, Z.F.; Tian, J.; Ma, Q. Urban expansion dynamics and natural habitat loss in China: A multiscale landscape perspective. Glob. Chang. Biol. 2014, 20, 2886–2902. [Google Scholar] [CrossRef] [PubMed]
  3. Wei, Y.P.; Zhang, Z.Y. Assessing the fragmentation of construction land in urban areas: An index method and case study in Shunde, China. Land Use Policy 2012, 29, 417–428. [Google Scholar] [CrossRef]
  4. Haas, J.; Ban, Y.F. Urban growth and environmental impacts in Jing-Jin-Ji, the Yangtze, River Delta and the Pearl River Delta. Int. J. Appl. Earth Obs. Geoinf. 2014, 30, 42–55. [Google Scholar] [CrossRef]
  5. Brevik, E.C.; Cerdà, A.; Mataix-Solera, J.; Pereg, L.; Quinton, J.N.; Six, J. The interdisciplinary nature of SOIL. Soil 2015, 1, 117–129. [Google Scholar] [CrossRef] [Green Version]
  6. Torre, C.M.; Morano, P.; Tajani, F. Saving soil for sustainable land use. Sustainability 2017, 9, 350. [Google Scholar] [CrossRef]
  7. Arrow, K.; Bolin, B.; Costanza, R.; Dasgupta, P.; Folke, C.; Holling, C.S.; Jansson, B.O.; Levin, S.; Maler, K.G.; Perrings, C.; et al. Economic growth, carrying capacity, and the environment. Science 1995, 268, 520–521. [Google Scholar] [CrossRef] [PubMed]
  8. Breheny, M.J.; Conference, R.S.A.B.S. Sustainable Development and Urban Form; Pion Limited: London, UK, 1992. [Google Scholar]
  9. Halleux, J.M.; Marcinczak, S.; Krabben, E. The adaptive efficiency of land use planning measured by the control of urban sprawl. The cases of the Netherlands, Belgium and Poland. Land Use Policy 2012, 29, 887–898. [Google Scholar] [CrossRef]
  10. Zhao, X.F.; Huang, X.J.; Chen, Y.; Chen, Z.G. Research progress in urban land intensive use. J. Nat. Resour. 2010, 25, 1979–1996. [Google Scholar]
  11. Du, M.J. China’s land policy reflection on the economical and intensive utilization. Ecol. Econ. 2012, 10, 1–8. [Google Scholar]
  12. Wang, L.; Li, C.C.; Ying, Q.; Cheng, X.; Wang, X.Y.; Li, X.Y.; Hu, L.Y.; Liang, L.; Yu, L.; Huang, H.B.; et al. China’s urban expansion from 1990 to 2010 determined with satellite remote sensing. Chin. Sci. Bull. 2012, 57, 2802–2812. [Google Scholar] [CrossRef]
  13. Meng, Y.; Zhang, F.R.; An, P.L.; Dong, M.L.; Wang, Z.Y.; Zhao, T.T. Industrial land-use efficiency and planning in Shunyi, Beijing. Landsc. Urban Plan. 2008, 85, 40–48. [Google Scholar] [CrossRef]
  14. Liu, Z.J.; Huang, H.Q.; Werners, S.E.; Yan, D. Construction area expansion in relation to economic-demographic development and land resource in the Pearl River Delta of China. J. Geogr. Sci. 2016, 26, 188–202. [Google Scholar] [CrossRef]
  15. Xie, H.L.; Wang, W. Spatiotemporal differences and convergence of urban industrial land use efficiency for China’s major economic zones. J. Geogr. Sci. 2015, 25, 1183–1198. [Google Scholar] [CrossRef]
  16. Xie, H.L.; Wang, W. Exploring the spatial-temporal disparities of urban land use economic efficiency in China and its influencing factors under environmental constraints based on a sequential slacks-based model. Sustainability 2015, 7, 10171–10190. [Google Scholar] [CrossRef]
  17. Lin, X.B.; Ma, X.G.; Li, G.C. Estimating land use intensity features for Pearl River Delta urban agglomeration using AHP method. China Popul. Resour. Environ. 2013, 23, 134–137. [Google Scholar]
  18. Chen, W.; Wu, Q. Economic efficiency of urban construction land and its influential factors in Yangtze River Delta. Econ. Geogr. 2014, 34, 142–149. [Google Scholar]
  19. Irfan, M.; Koj, A.; Sedighi, M.; Thomas, H. Design and development of a generic spatial decision support system, based on artificial intelligence and multicriteria decision analysis. GeoResJ 2017, 14, 47–58. [Google Scholar] [CrossRef]
  20. Kazak, J.; van Hoof, J.; Szewranski, S. Challenges in the wind turbines location process in Central Europe—The use of spatial decision support systems. Renew. Sustain. Energy Rev. 2017, 76, 425–433. [Google Scholar] [CrossRef]
  21. Jayarathna, L.; Rajapaksa, D.; Managi, S.; Athukorala, W.; Torgler, B.; Garcia-Valiñas, M.A.; Gifford, R.; Wilson, C. A GIS based spatial decision support system for analysing residential water demand: A case study in Australia. Sustain. Cities Soc. 2017, 32, 67–77. [Google Scholar] [CrossRef]
  22. Elvidge, C.D.; Cinzano, P.; Pettit, D.R.; Arvesen, J.; Sutton, P.; Small, C.; Nemani, R.; Longcore, T.; Rich, C.; Safran, J.; et al. The Nightsat mission concept. Int. J. Remote Sens. 2007, 28, 2645–2670. [Google Scholar] [CrossRef]
  23. Elvidge, C.D.; Baugh, K.E.; Kihn, E.A.; Kroehl, H.W.; Davis, E.R.; Davis, C.W. Relation between satellite observed visible-near infrared emissions, population, economic activity and electric power consumption. Int. J. Remote Sens. 1997, 18, 1373–1379. [Google Scholar] [CrossRef]
  24. Elvidge, C.D.; Imhoff, M.L.; Baugh, K.E.; Hobson, V.R.; Nelson, I.; Safran, J.; Dietz, J.B.; Tuttle, B.T. Night-time Lights of the World: 1994–1995. ISPRS J. Photogramm. Remote Sens. 2001, 56, 81–99. [Google Scholar] [CrossRef]
  25. Doll, C.N.H.; Muller, J.P.; Elvidge, C.D. Night-time imagery as a tool for global mapping of socioeconomic parameters and greenhouse gas emissions. AMBIO 2000, 29, 157–162. [Google Scholar] [CrossRef]
  26. Doll, C.N.H.; Morley, J.G.; Muller, J.P. Geographic Information Issues associated with socio-economic modelling from night-time light remote sensing data. In Proceedings of the ISPRS Congress, Istanbul, Turkey, 12–23 July 2004. [Google Scholar]
  27. Ghosh, T.; Anderson, S.; Powell, R.L.; Sutton, P.C.; Elvidge, C.D. Estimation of Mexico’s informal economy and remittances using night-time imagery. Remote Sens. 2009, 1, 418–444. [Google Scholar] [CrossRef]
  28. Ghosh, T.; Powell, R.L.; Elvidge, C.D.; Baugh, K.E.; Sutton, P.C.; Anderson, S. Shedding light on the global distribution of economic activity. Open Geogr. J. 2010, 3, 147–160. [Google Scholar]
  29. Han, X.D.; Zhou, Y.; Wang, S.X.; Liu, R.; Yao, Y. GDP spatialization in China based on night time image. J. Geo-Inf. Sci. 2012, 14, 128–136. [Google Scholar]
  30. Wang, Q.; Yuan, T.; Zheng, X.Q. GDP Gross Analysis at province-Level in China based on night-time lightastellite imaery. Urban Dev. Stud. 2013, 20, 44–48. [Google Scholar]
  31. Liang, Y.J.; Xu, Z.M. Modelling the spatial distribution of GDP based on night light radiation: A case study in Ganzhou district, Zhangye municipality. J. Glaciogy Geocryol. 2013, 35, 249–254. [Google Scholar]
  32. Ye, Y.Y.; Zhang, H.O.; Xu, X.Q.; Zhou, C.S. Study on the relationship between construction land expansion and economic growth pattern in the Pearl River Delta. Geogr. Res. 2011, 30, 2259–2271. [Google Scholar]
  33. Schoon, S. Chinese strategies of experimental governance. The underlying forces influencing urban restructuring in the Pearl River Delta. Cities 2014, 41, 194–199. [Google Scholar] [CrossRef]
  34. Zhu, S.L.; Zhang, Z.M. Remote Sensing Image Acquisition and Analysis; Science Press: Beijing, China, 2002. [Google Scholar]
  35. Shalaby, A.; Tateishi, R. Remote sensing and GIS for mapping and monitoring land cover and land-use changes in the Northwestern coastal zone of Egypt. Appl. Geogr. 2007, 27, 28–41. [Google Scholar] [CrossRef]
  36. Ghorbani, A.; Pakravan, M. Land use mapping using visual vs. digital image interpretation of TM and Google earth derived imagery in Shrivan-Darasi watershed (Northwest of Iran). Eur. J. Exp. Biol. 2013, 3, 576–582. [Google Scholar]
  37. He, C.Y.; Ma, Q.; Li, T.; Yang, Y.; Liu, Z.F. Spatiotemporal dynamics of electric power consumption in Chinese Mainland from 1995 to 2008 modeled using DMSP/OLS stable nighttime lights data. J. Geogr. Sci. 2012, 22, 125–136. [Google Scholar] [CrossRef]
  38. Version 4 DMSP-OLS Nighttime Lights Time Series. Available online: https://ngdc.noaa.gov/eog/dmsp/downloadV4composites.html (accessed on 10 October 2016).
  39. Baugh, K.; Elvidge, C.D.; Ghosh, T.; Ziskin, D. Development of a 2009 stable lights product using DMSP-OLS data. Proc. Asia-Pac. Adv. Netw. 2010, 30, 114–130. [Google Scholar] [CrossRef]
  40. Elvidge, C.D.; Sutton, P.C.; Ghosh, T.; Tuttle, B.T.; Baugh, K.E.; Bhaduri, B.; Bright, E. A global poverty map derived from satellite data. Comput. Geosci. 2009, 35, 1652–1660. [Google Scholar] [CrossRef]
  41. Zhang, Q.; Seto, K.C. Mapping urbanization dynamics at regional and global scales using multi-temporal DMSP/OLS nighttime light data. Remote Sens. Environ. 2011, 115, 2320–2329. [Google Scholar] [CrossRef]
  42. Liu, Z.; He, C.; Zhang, Q.; Huang, Q.; Yang, Y. Extracting the dynamics of urban expansion in China using DMSP-OLS nighttime light data from 1992 to 2008. Landsc. Urban Plan. 2012, 106, 62–72. [Google Scholar] [CrossRef]
  43. Doll, C.N.H.; Muller, J.-P.; Morley, J.G. Mapping regional economic activity from night-time light satellite imagery. Ecol. Econ. 2006, 57, 75–92. [Google Scholar] [CrossRef]
  44. Amarala, S.; Câmaraa, G.; Monteiro, A.M.V.; Quintanilha, J.A.; Elvidge, C.D. Estimating population and energy consumption in Brazilian Ama-zonia using DMSP night-time satellite data. Comput. Environ. Urban Syst. 2005, 29, 179–195. [Google Scholar] [CrossRef]
  45. Wang, W.; Cheng, H.; Zhang, L. Poverty assessment using DMSP/OLS night-time light satellite imagery at a provincial scale in China. Adv. Space Res. 2012, 49, 1253–1264. [Google Scholar] [CrossRef]
  46. Ye, Y.Y.; Zhang, H.O.; Liu, K.; Wu, Q.T. Research on the influence of site factors on the expansion of construction land in the Pearl River Delta, China: By using GIS and remote sensing. Int. J. Appl. Earth Obs. Geoinf. 2013, 21, 366–373. [Google Scholar] [CrossRef]
  47. Guo, R.M.; Qian, H.S.; Li, M.X.; Li, Y. The relationship between urban expansion and econnomic development of Guangzhou city. Resour. Sci. 2013, 35, 447–454. [Google Scholar]
  48. Jenks, M.; Burgess, R. Compact Cities: Sustainable Urban Forms for Developing Countries; SPON Press: London, UK; New York, NY, USA, 2000. [Google Scholar]
  49. Zhou, X.; Fu, F.Y. Thinking about urban renewal from the “three old reform” renewal in Guangdong Province. Mod. Urban Res. 2011, 8, 82–89. [Google Scholar]
  50. Zhao, P. Managing urban growth in a transforming China: Evidence from Beijing. Land Use Policy 2011, 28, 96–109. [Google Scholar] [CrossRef]
Figure 1. Technical flowchart.
Sustainability 10 00063 g001
Figure 2. Location of the Pearl River Delta megalopolis (PRDM).
Sustainability 10 00063 g002
Figure 3. Expansion of the PRDM’s construction land in 1998, 2006, and 2012.
Sustainability 10 00063 g003
Figure 4. The PRDM’s nighttime light imagery in 1998, 2006, and 2012.
Sustainability 10 00063 g004
Figure 5. Distribution of towns with statistical NAGDP (A) and a scatter plot of simulated and statistical NAGDP at township level (B).
Sustainability 10 00063 g005
Figure 6. Economic efficiency of construction land (EECL) dynamics in the PRDM from 1998 to 2012.
Sustainability 10 00063 g006
Figure 7. Scatter plots of EECL values for the PRDM at township level.
Sustainability 10 00063 g007
Figure 8. Classification maps of construction land, NAGDP, and EECL for the PRDM.
Sustainability 10 00063 g008
Figure 9. Classification (A) and distribution (B) of fast-growing and ultrafast-growing EECL in the PRDM.
Sustainability 10 00063 g009
Figure 10. “Three-old” land area and the EECL of nine cities in the PRDM. (Notes: In this graph, GZ = Guangzhou, SZ = Shenzhen, DG = Dongguan, FS = Foshan, JM = Jiangmen, HZ = Huizhou, ZS = Zhongshan, ZH = Zhuhai, and ZQ = Zhaoqing.)
Sustainability 10 00063 g010
Table 1. The accuracy tests of the remote-sensing image interpretation.
YearClassificationConstruction LandNon-Construction LandOverall Accuracy (%)Kappa Coefficient
1998Construction land4653593.40.917
Non-construction land31469
2006Construction land4752594.70.926
Non-construction land28472
2012Construction land4683293.90.919
Non-construction land39471
Table 2. Classification criteria of growth types based on slope value.
Slow-GrowingMedium-GrowingFast-GrowingUltrafast-Growing
slope value < C i ¯ S i C i ¯ S i C ¯ i 0.5 S i C ¯ i 0.5 S i C i ¯ C ¯ i
Notes: C i ¯ is mean construction land, estimated NAGDP, and the EECL of town i over three years. S i is the standard deviation of town i over three years.
Table 3. Contrast between the inner and peripheral circles in terms of EECL values, construction land, and Non-agricultural gross domestic product (NAGDP) from 1998 to 2012.
AreaEECL (Million Yuan per km2), (Peripheral Circle = 1)Construction Land (km2)
(PRDM = 1)
NAGDP (Billion Yuan)
(PRDM = 1)
199820062012199820062012199820062012
Inner circle19,014 (0.97)51,687 (2.81)75,144 (2.73)2489 (0.75)3528 (0.74)4642 (0.67)4732 (0.75)18,471 (0.89)34,881 (0.85)
Peripheral circle19,549 (1.00)18,407 (1.00)27,523 (1.00)816 (0.25)1240 (0.26)2286 (0.33)1596 (0.25)2283 (0.11)6290 (0.15)

