Case Study on Slope Stability Changes Caused by Earthquakes—Focusing on Gyeongju 5.8 ML EQ


Korea Institute of Civil Engineering and Building Technology, 283, Goyang-daero, Ilsanseo-gu, Goyang-si 10223, Gyeonggi-do, Korea
*
Author to whom correspondence should be addressed.
Sustainability 2018, 10(10), 3441; https://0-doi-org.brum.beds.ac.uk/10.3390/su10103441
Submission received: 16 July 2018
/
Revised: 28 August 2018
/
Accepted: 16 September 2018
/
Published: 27 September 2018
(This article belongs to the Special Issue Natural, Environmental and Anthropic Hazards of Cultural Heritage)
Abstract
:Slope failure is a natural hazard occurring around the world and can lead to severe damage of properties and loss of lives. Even in stabilized slopes, changes in external loads, such as those from earthquakes, may cause slope failure and collapse, generating social impacts and, eventually causing loss of lives. In this research, the slope stability changes caused by the Gyeongju earthquake, which occurred on 12 September 2016, are numerically analyzed in a slope located in the Gyeongju area, South Korea. Slope property data, collected through an on-site survey, was used in the analysis. Additionally, slope stability changes with and without the earthquake were analyzed and compared. The analysis was performed within a peak ground acceleration (PGA) range of 0.0 (g)–2.0 (g) to identify the correlation between the slope safety factor and peak ground acceleration. The correlation between the slope safety factor and peak ground acceleration could be used as a reference for performing on-site slope stability evaluations. It also provides a reference for design and earthquake stability improvements in the slopes of road and tunnel construction projects, thus supporting the attainment of slope stability in South Korea.
1. Introduction
Based on topographic analyses and records of the past, South Korea has long been considered as relatively safer with respect to earthquakes than neighboring countries, such as China and Japan. However, on 12 September 2016, a magnitude-5.8 earthquake (hereinafter referred to as the Gyeongju earthquake) occurred about 11.6 km south-southwest of Gyeongju City, located in the southeastern part of the Korean peninsula. This, as the largest earthquake ever recorded since the beginning of seismological observation in 1905, caused more than 600 aftershocks (until April 2017) [1,2,3]. The Gyeongju earthquake had a depth of approximately 13 km, and many high-frequency components of 13.77 Hz were included in the seismic waves recorded at near stations. Further, it had a duration of approximately 5–7 s, which is shorter than Japan’s most recent earthquakes (the 1995 Great Hanshin earthquake, the 2011 Tōhoku earthquake and tsunami, and the 2016 Kumamoto earthquakes). Thus, it caused relatively lower damage than it should have, considering its significant depth, high vibration, and short duration characteristics [4,5,6].
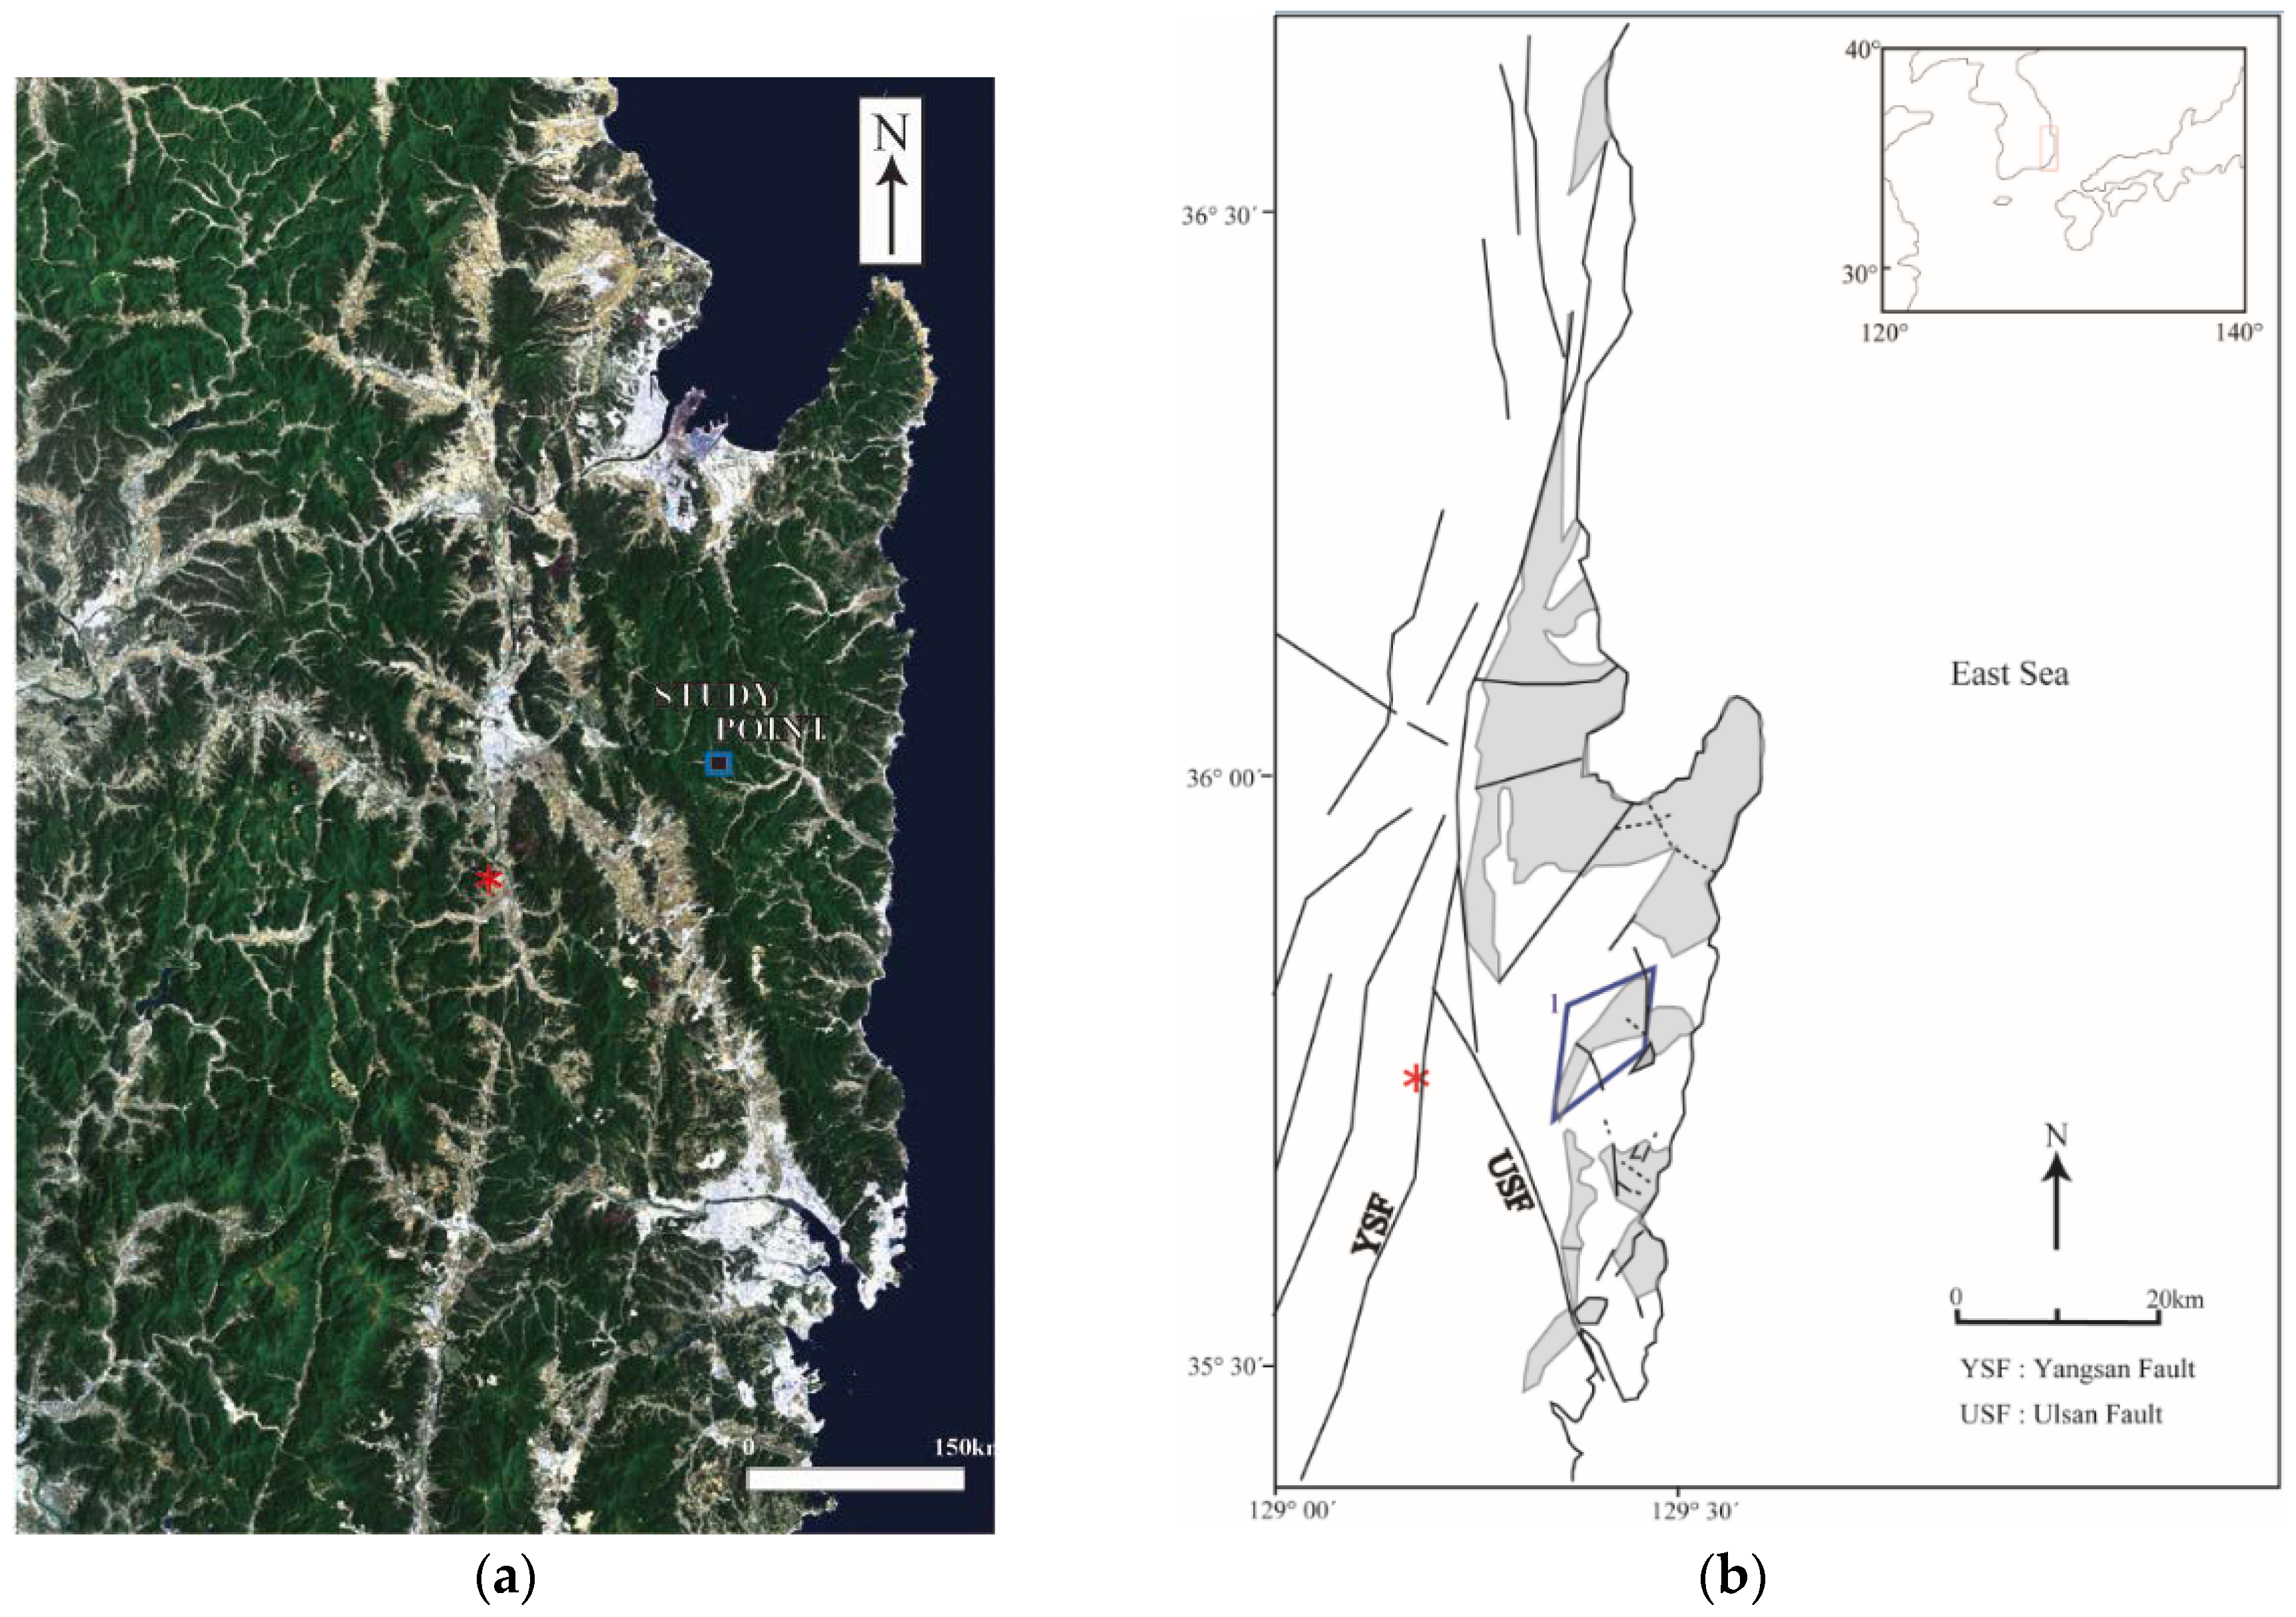
Geologically, Mesozoic and Cenozoic layers are widely distributed in the southeastern part of the Korean peninsula, which is where the Gyeongju earthquake took place, and there are large-scale faults, such as the Yangsan and Ulsan faults. Particularly, most Mesozoic Cretaceous strata are distributed along sediments, which have southeastward slopes, and igneous rocks composed of granite and andesite. Moreover, the tertiary base of the Cenozoic layer is formed in the shape of a basin in which sedimentary and volcanic layers are alternately distributed. The boundary between the Mesozoic layer and the tertiary layer is mostly formed by boundary faults. Further, owing to the boundary between the southwest-northeastward Yangsan fault and the southeast-northwestward Ulsan fault, many of the active faults observed in the Korean peninsula are distributed in this area. Although most faults formed by previous earthquakes are located to the east of the Yangsan fault, it was reported that the 2016 Gyeongju earthquake occurred because of the strike-slip fault located to the west of the Yangsan fault (see Figure 1).
Generally, the term, earthquake, refers to ground vibrations that propagate outwards when the stress accumulated in faults within the Earth’s crust exceeds its limit, causing the fault plane to break along the fault line. Earthquakes may cause significant loss of lives and property damage, as the ground motions generated by earthquakes cause relatively wide areas to vibrate during a certain period of time. They primarily produce huge damage to facilities and slopes located in the target area, and, secondarily, cause collapses [8,9]. Owing to changes in external loads (such as those from earthquakes) and groundwater levels, shear stress is generated within slopes previously stabilized, naturally or artificially. Once the shear strength of the ground is exceeded, slope failure occurs, leading to slope collapse.
Various methods have been applied so far in slope stability analyses. The typical method mainly used in practice is the limit state equilibrium method. However, owing to the advances in the finite element method (FEM), active research has been conducted using it in slope analysis and safety factor calculation. Instead of the limit state equilibrium method, which is widely used in practice, Griffiths and Lane [10], and Fredlund and Scoular [11] employed the FEM for slope safety analysis in their research. The advantages of the FEM include the lack of requirement of destruction of the target slope or assumptions about the cutting plane. Moreover, if there is experimental data on the actual slope, it can be used directly in the analysis. Al-Homoud and Tahtamoni [12] performed research on the analysis and alleviation of the degree of risk of slopes regarding seismic loads. They developed a method and program to analyze three-dimensionally the safety of slopes under seismic loading, considering displacement standards for slope failure and safety factors. The method and program were applied to draw a slope risk map for earthquakes, which could be used for disaster relief, including landslide situations. Li [13] performed in parallel an FEM-based slope safety analysis using the power law for non-linear shear-stress reference values and an analysis based on the limit state equilibrium method, and compared their results. This comparison revealed that the FEM-based analysis provided results that are more accurate. Jibson [14] performed a survey on various methods used for slope safety analysis regarding earthquakes, which included the pseudo-static analysis, limit state equilibrium, and Newmark’s sliding block methods. Furthermore, it was found that many studies are currently being performed on stress-displacement analyses using FEM [15,16,17,18,19,20,21,22,23].
In this research, the slope safety of a soil slope located in the vicinity of Yangbuk-myeon where the Gyeongju earthquake occurred was numerically analyzed. Prior to this, the soil properties of the target slope were examined through an on-site survey, and the Gyeongju earthquake data was used to numerically analyze the slope safety regarding the earthquake’s impact. Additionally, a slope safety analysis was performed by increasing the scale of the earthquake to examine the correlation between the slope safety factor and earthquake scale. This correlation can be used as a reference value for slope safety evaluation in sites, such as roads and tunnels, and as a reference value for slope design and safety improvement against earthquakes. Thus, it is possible to contribute to securing slope stability through continuous contrast study against the earthquake.
2. Theoretical Background and Mathematical Formulation
Theoretical Background for Slope Stability
The term, slope stability, can be defined to assess the degree of resistance to the collapse of the slope based on its factor of safety. The factor of safety is a value that results from dividing the shear strength by the shear stress of the soil of a given slip surface. In other words, it can be defined as the ratio of the forces that block the activity of the slope to the forces that trigger it. Therefore, theoretically, if the calculated factor of safety is above 1.0, the target slope can be judged as safe. Nevertheless, when analyzing the actual behavior of a slope, its soil properties are examined through an on-site survey. However, even after a significant on-site survey, uncertainties about properties that cannot be considered (such as strength parameters), external loads that trigger the activity of the slope, and failure models are still present. Owing to such uncertainties, the concept of the allowable factor of safety was introduced [24], and the factor of safety specified in design standards is the allowable factor of safety. Therefore, in practice and for a slope to be deemed safe, its calculated factor of safety must be not above 1.0, but above the allowable safety factor specified in the design standards.
The analysis of the safety of a slope against earthquakes can be divided into two stages. First, the slope response analysis stage, in which the forces that act on the slope when seismic waves are applied, along with the slope acceleration, speed, and displacement, are analyzed. Second, the safety analysis stage, in which the slope safety is analyzed by calculating the factor of safety of the slope where deformation has occurred.
The slope response analysis regarding earthquakes can be divided into the pseudo-static analysis (or equivalent static analysis), which considers seismic loads as static, displacement analysis, which uses the Newmark’s sliding block, and dynamic analysis, which uses the finite difference method and the FEM.
The limit-equilibrium-method based pseudo-static analysis is widely used in practice. The pseudo-static analysis has the advantage of being simple to use, as it evaluates the factor of safety of slopes by converting transient seismic loads into static loads that act in only one direction. However, loads that act on slopes within the vibration duration change constantly and act within short periods of time; thus, calculating the factor of safety by applying them as constant static inertial forces has been reported as being very uncertain [25].
To overcome these limitations of the pseudo-static analysis method, Newmark [26] proposed the activity displacement method. This method presented a displacement analysis method based on the similarity of the movement of a sliding block placed on an inclined plane, with the permanent displacement of a slope occurring owing to seismic loads. When the ground’s vibration acceleration exceeds the yield acceleration, the active soil moves, and permanent deformation occurs until the vibration speed of the active soil and the vibration speed of the ground become the same. Therefore, permanent displacements of a slope can be found by multiple integrations of the difference between the ground’s vibration acceleration and yield acceleration.
Finally, the time history analysis, which is a dynamic analysis method, consists of finding the solution of the equation of motion when dynamic loads act on the target slope, calculating its behavior (displacement, member force, etc.) at any period of time by using the dynamic characteristics and applied loads [27,28]. One of the disadvantages of this method is that the time required for the analysis is much longer than in the other methods because it uses the dynamic characteristics of the target slope and actual seismic wave data. However, it provides high accuracy because the analysis is performed using actual models and input values. The equation of motion used in this method is as follows [28]:
where is the mass matrix, is the damping matrix, is the stiffness matrix, and is the dynamic load generated by seismic waves, whereas are the acceleration, speed, and displacement, respectively.
The calculation of the slope deformation in the dynamic analysis must be consecutively followed by the slope’s factor of safety analysis stage, so that the analysis of the slope stability regarding seismic waves can be performed.
Generally, the analysis methods used in the slope stability analysis are broadly classified into the elastic or elasto-plastic analysis, which considers the ground deformations by means of numerical analysis methods, such as the FEM, and the limit equilibrium method, which analyzes only the mechanical equilibrium relationship of the critical plane in which failure occurs [25]. Fundamentally, the limit equilibrium method not only performs a slope stability analysis, but also explains geotechnical problems, such as soil pressure and bearing power. Moreover, as a method, it deals with the target ground as a single body and considers the forces and moment equilibrium conditions of any failure surface.
Numerical analysis methods, such as the FEM, are actually difficult to use and require substantial analysis time; thus, in practice, the limit equilibrium method is widely used because of its relatively easier analysis. Several methods can be used for analyzing the factor of safety of a slope, including the Fellenius method, Bishop simplified method, Spencer method, Janbu simplified and precision solution methods, and the Morgenstern-Price method [10,25]. In this research, the Bishop simplified method was used to perform the slope stability analysis [29].
According to research conducted on the numerical difference between factors of safety calculated using the various analysis methods, such a difference is very small [30]. However, as an exception, it was reported that the Fellenius method shows a maximum difference of 60% when compared to other methods [31]. In the slope stability analysis, it can be said that the geometric conditions and accurate calculation of slope strength constants have a bigger impact than the numerical analysis method. Moreover, during the slope stability analysis, it is more desirable to compare the factors of safety during active failure depending on the state of the expected active surface considering geotechnical aspects.
In this research, to analyze the stability of a slope regarding earthquakes, the time history analysis, which is a dynamic analysis, was used to perform a response analysis on the member force, acceleration, speed, and displacement occurring in the slope owing to seismic waves. In addition, the Bishop simplified method was used to calculate the factor of safety of the slope in which deformations occurred [29]. For the time history analysis, QUAKE/W software [32], which is widely utilized for slope analysis, was employed, and for the slope factor of safety calculation, SLOPE/W software [33] was used.
3. Research Area Slope Status
3.1. General Status of Slope in South Korea
The Korean national highway slope data have been included in a database during the past 20 years and used for slope management. Among the more than 30,000 slopes distributed along the national highways in South Korea, 71.4% are rock slopes and 28.6% are soil slopes. Owing to geological factors, in the southeastern Gyeongsang province area where the target slope is located, the ratio of rock slopes to soils slopes (76.1% and 23.9%, respectively) is higher than the national distribution ratio. However, the slope height and inclination, which are the characteristics that affect the stability of soil slopes the most, are almost the same as the national average (10.52 m in height and 44.4° of slope). The average height and inclination of soil slopes located in the Gyeongsang province area are 10.0 m and 44.3°, respectively [34]. Therefore, the soil slopes located in the Gyeongsang province area were selected as the target of research, and data obtained by analyzing the impact of the earthquake that took place in the region of Gyeongju was used to identify the stability of soil slopes scattered around the Korean peninsula.
3.2. Research Target Slope Status
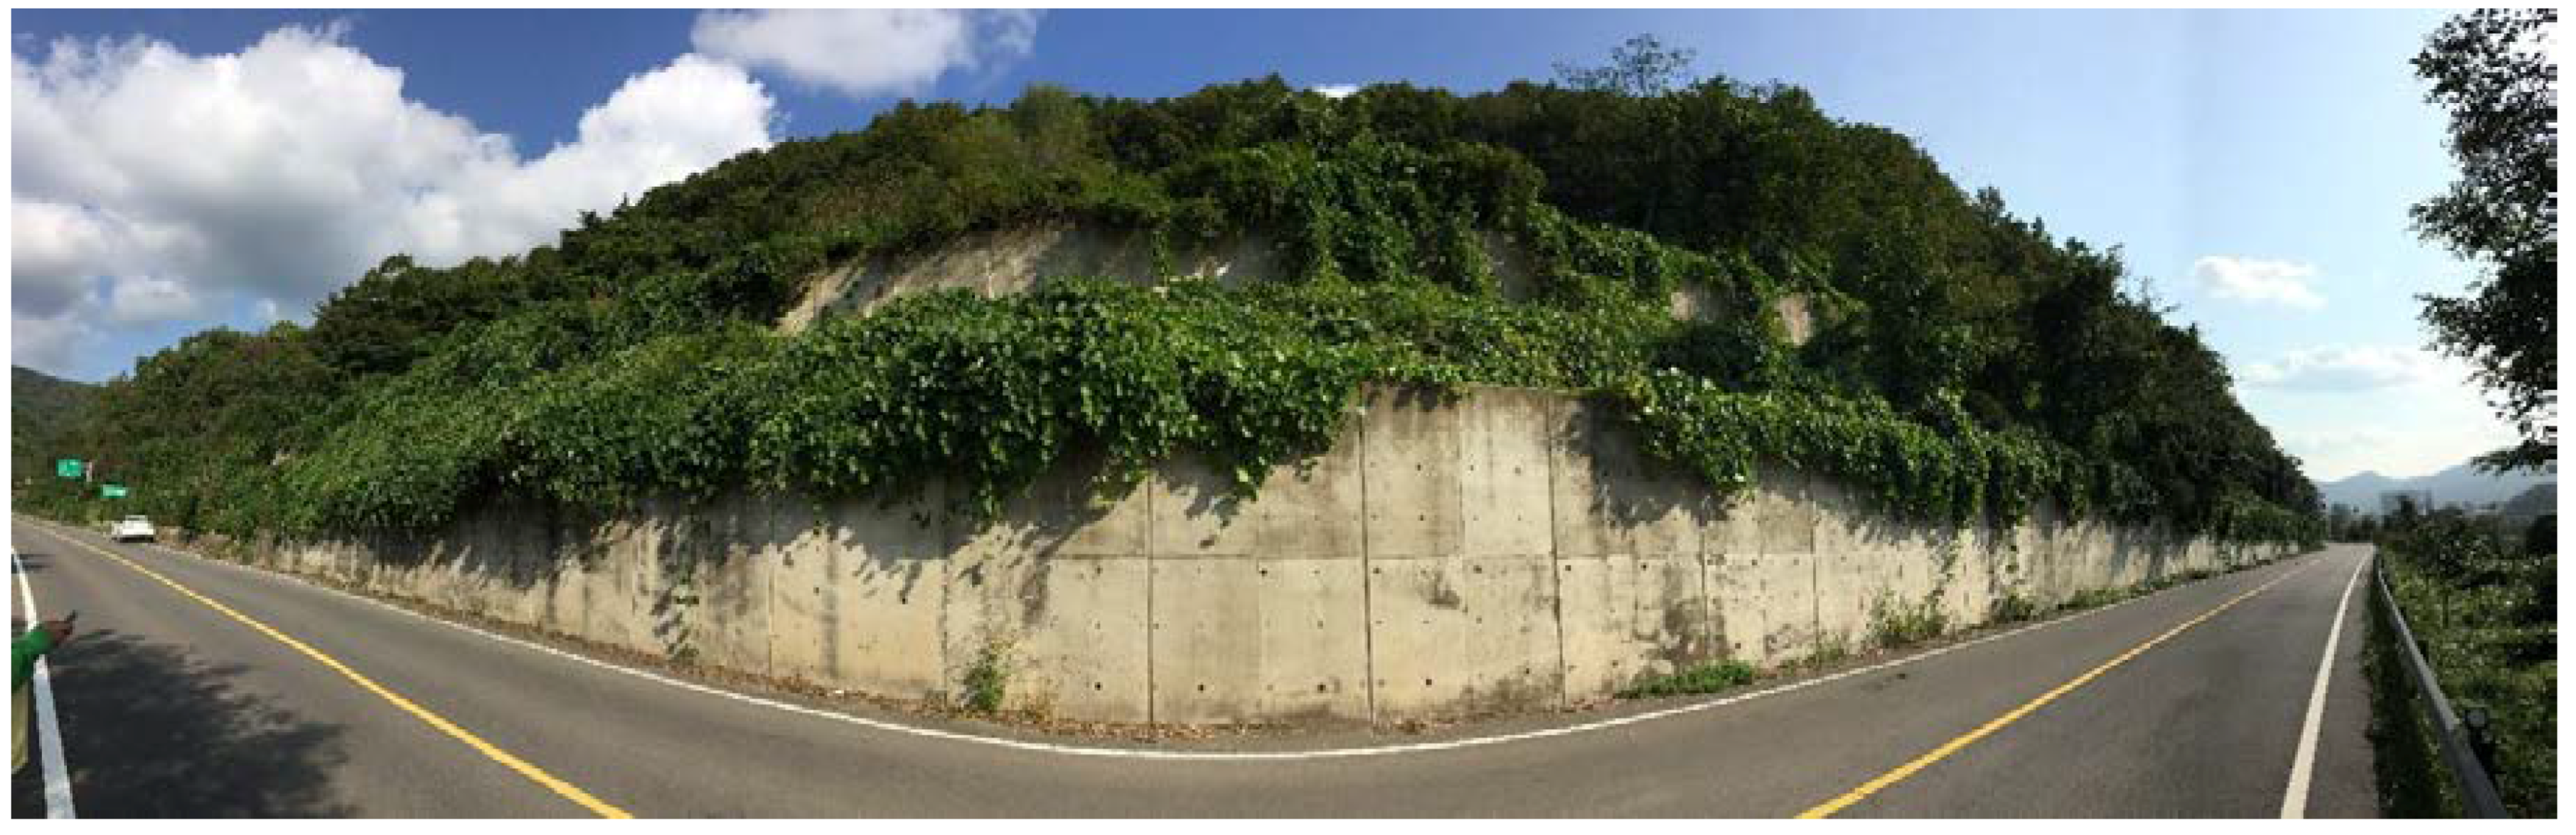
The research target slope is located in the vicinity of Yangbuk-myeon, Gyeongju-si, Gyeongsangbuk-do, southeast of the Korean peninsula, and is placed at the right side of the road at the exit of the Churyeong Tunnel in line 4 of the National road, in the direction from Pohang to Gampo. The target slope was created by an incision of a natural slope because of the road construction (see Figure 2).
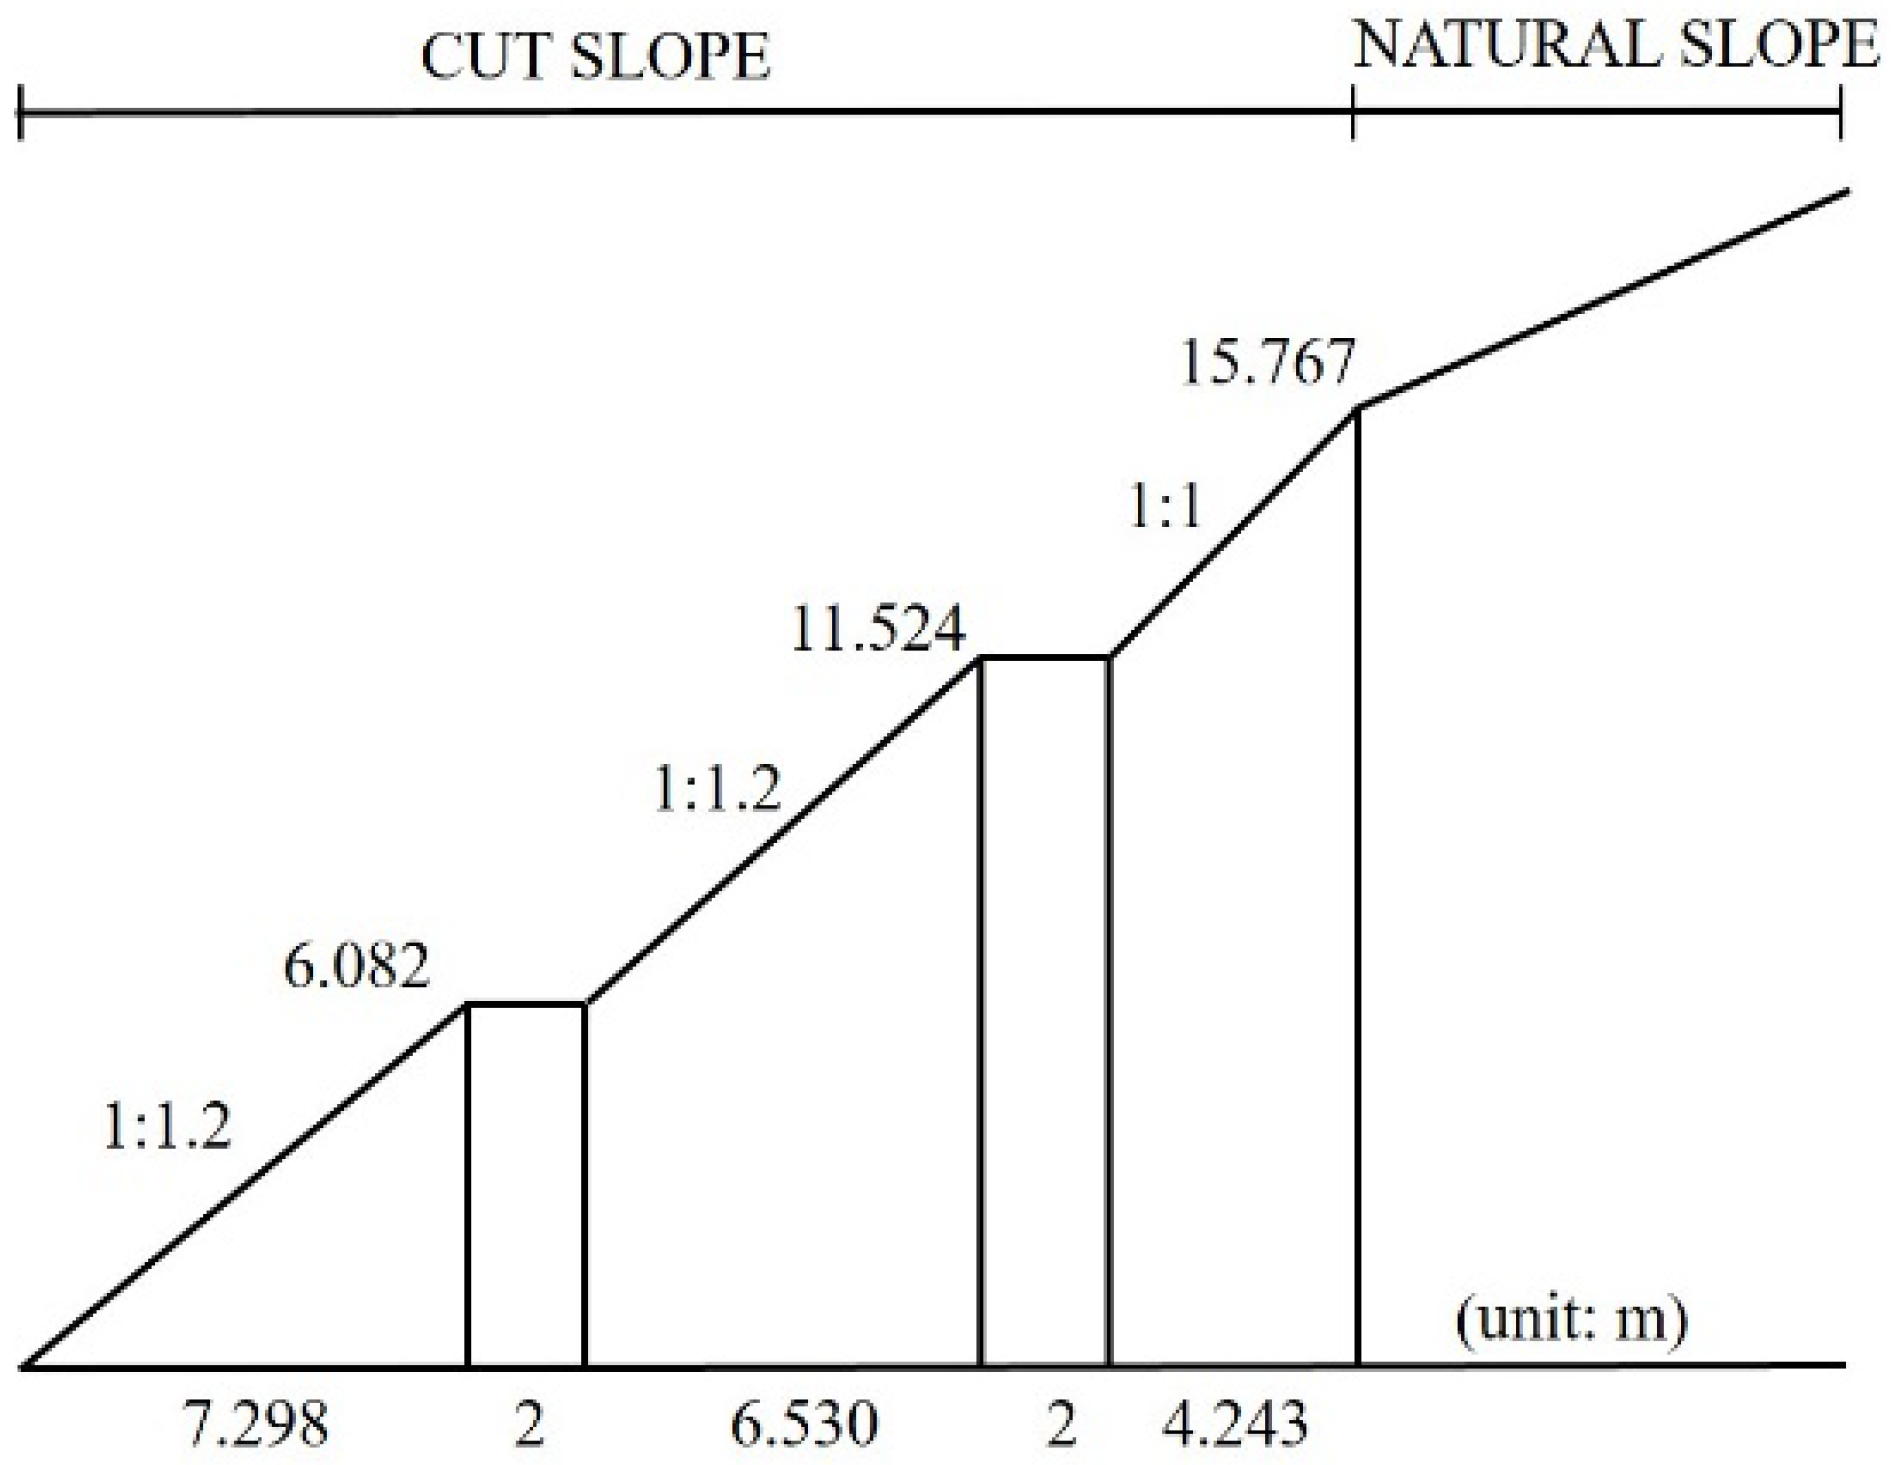
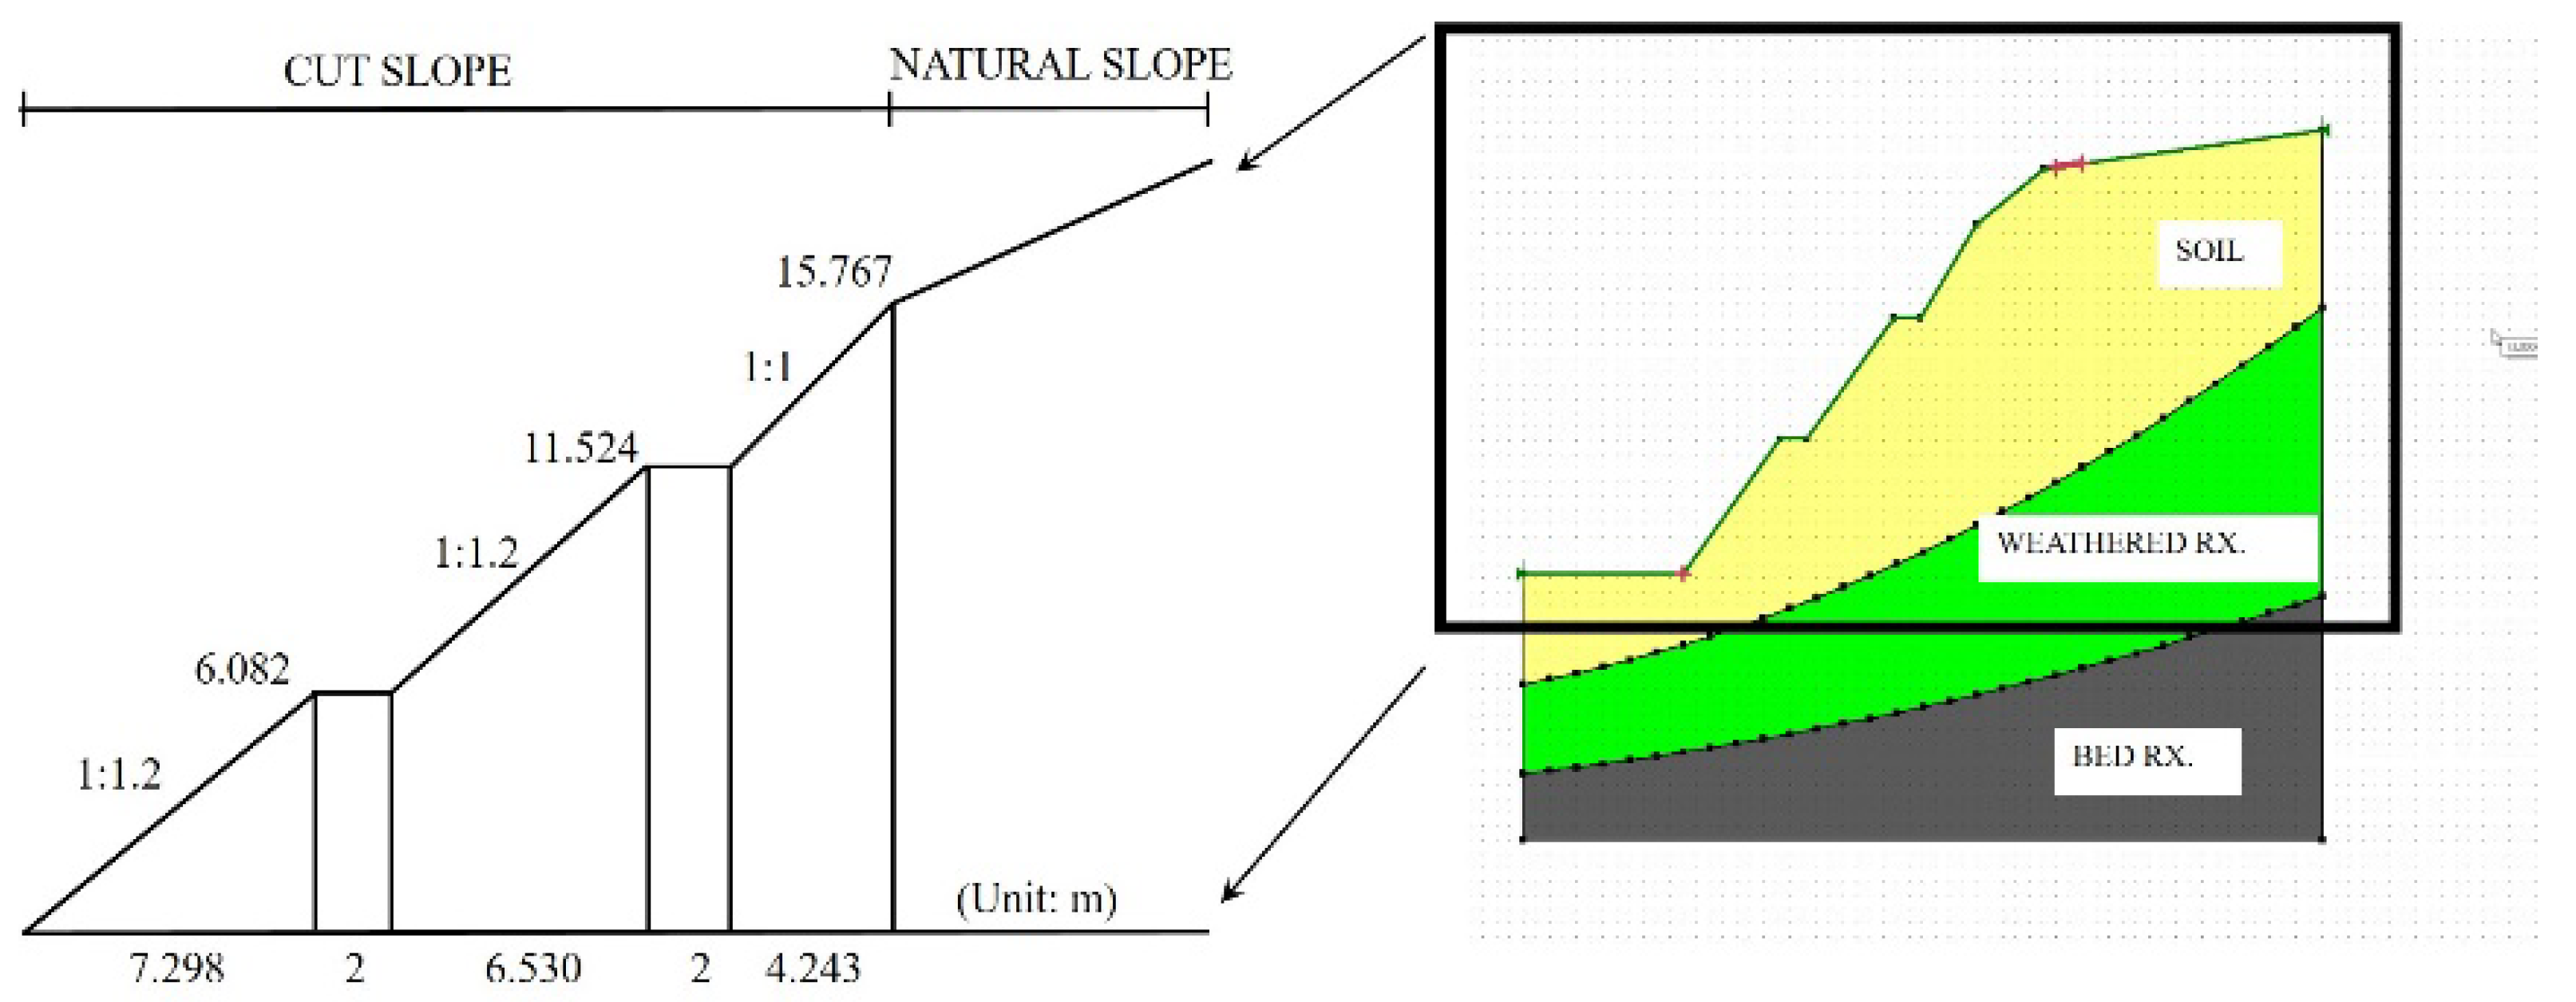
The slope section for the stability analysis was obtained through on-site measurement, depicted in Figure 3. The slope height is about 16 m and has two benches installed. The section gradient is 1:1.0–1:1.2, which satisfies the standard gradient of slopes with soil layers that contain large amounts of sandy soil, which is 1:1.0–1:1.5 [35].
3.3. Strength Constant Prediction for the Slope in the Research Area
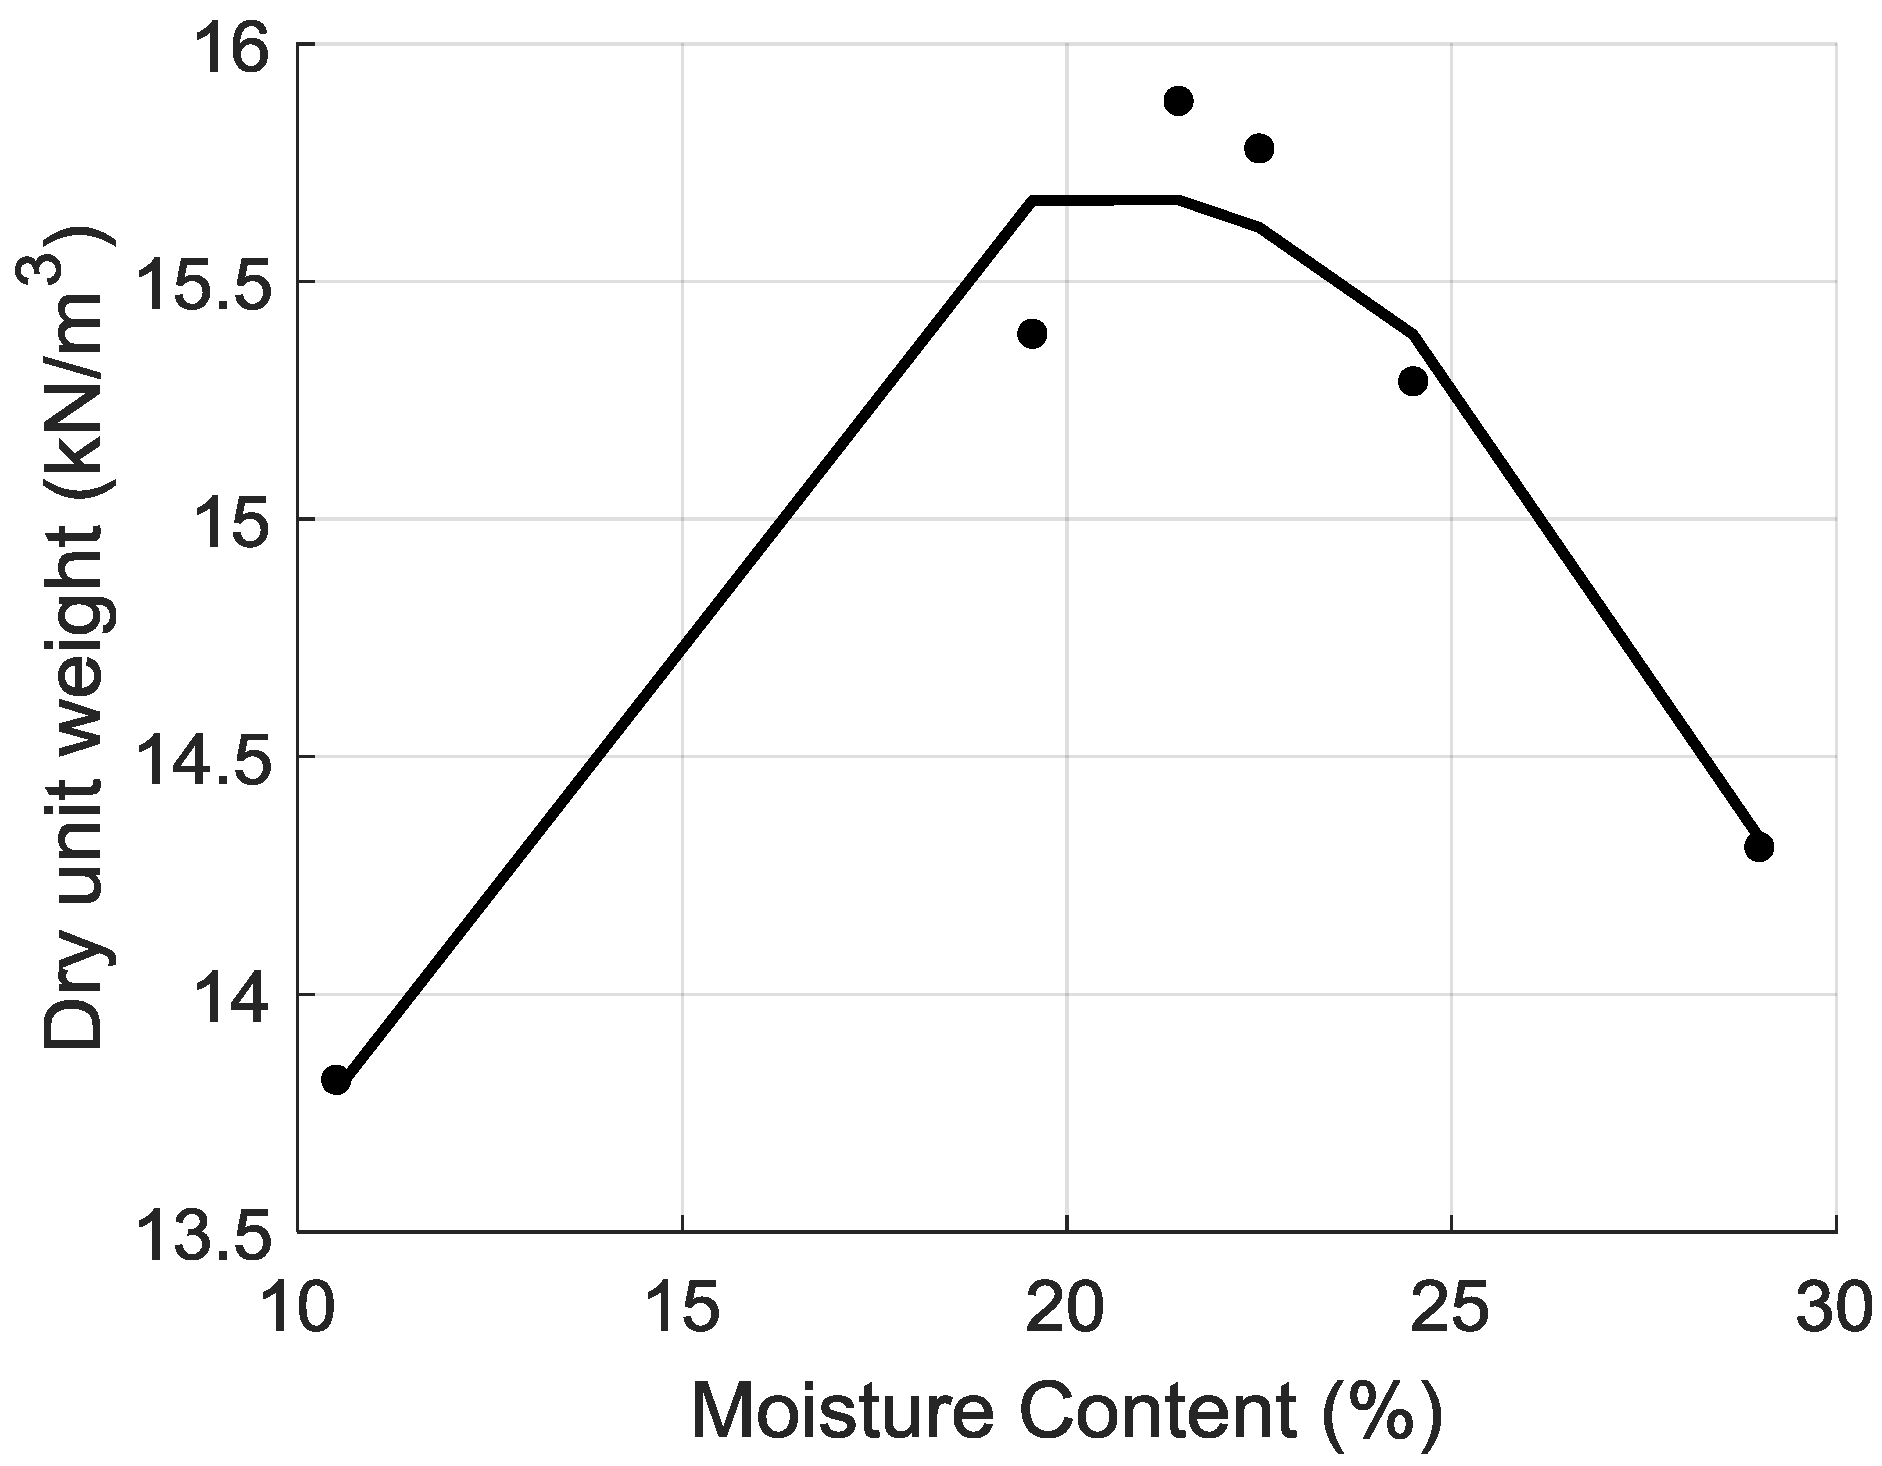
To perform a direct shear test at optimal moisture content, a soil compaction test was performed. The method used in the compaction test was iterative because the collected samples were limited.
The compaction test results, shown in Figure 4, were used to perform a shear test at optimal moisture content and results were tabularized in Table 1. For this, a small shear tester was used, with a rate of strain of 1 mm/min and a normal stress of 29.4 kPa, 88.2 kPa, and 117.6 kPa.
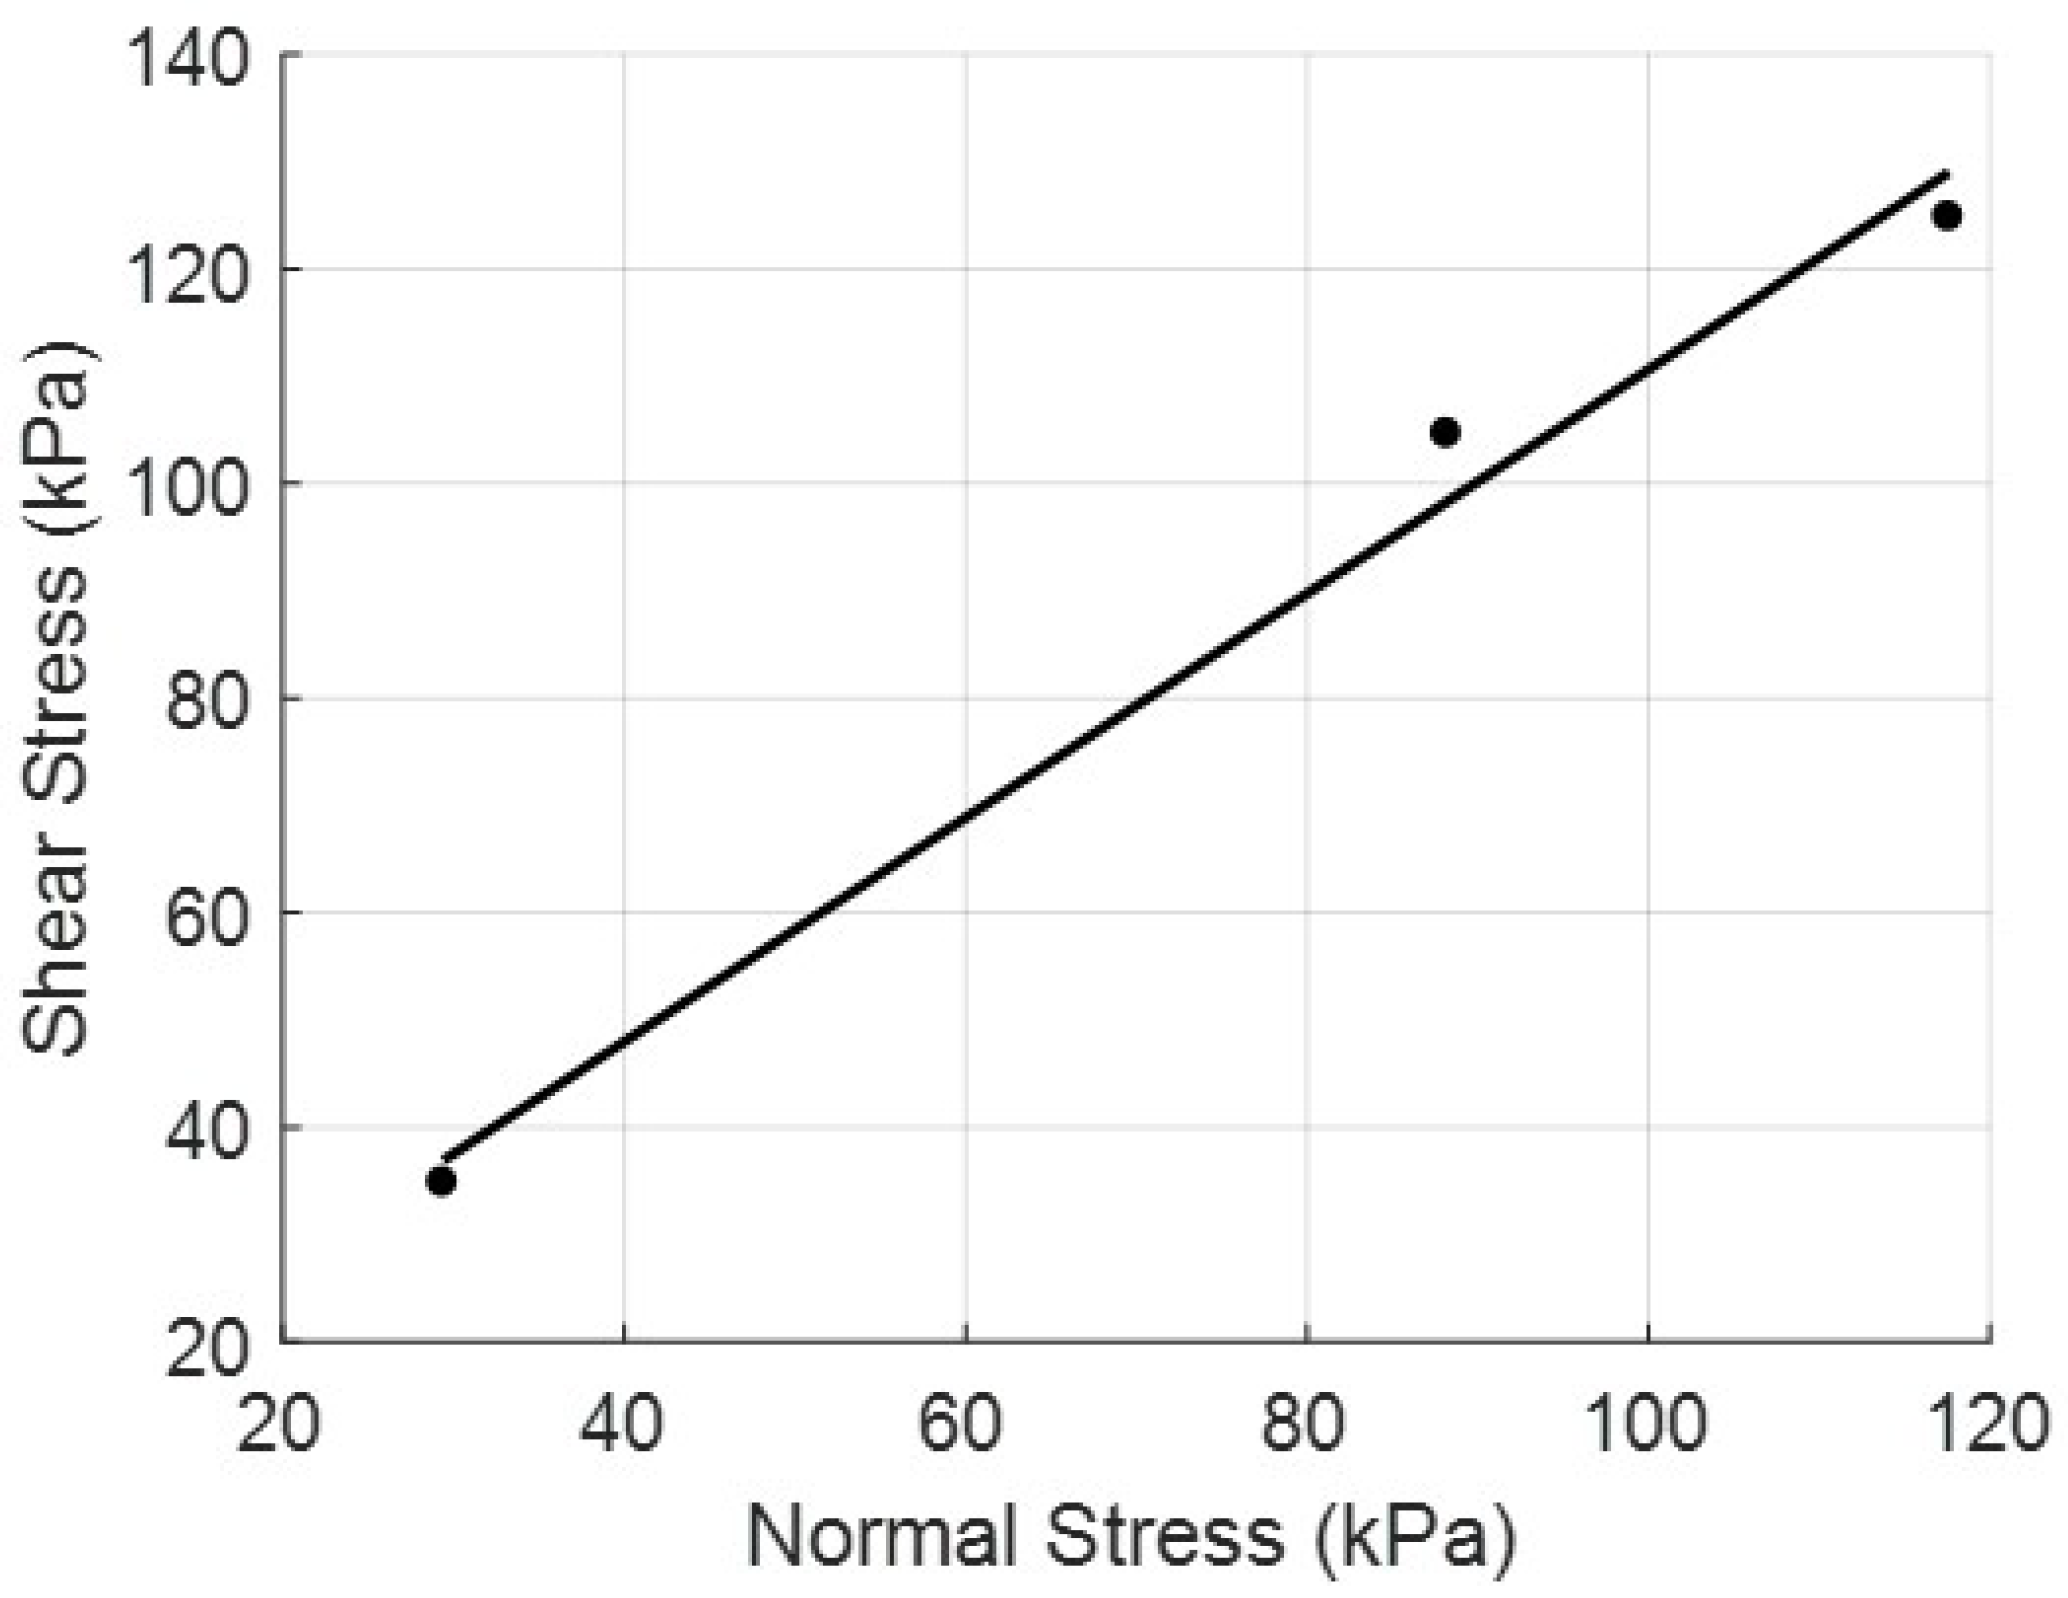
Non-disturbed samples could not be collected owing to a lack of equipment on the site. Because of this, disturbed samples were used to identify the strength constant of the slope soil. Figure 5 shows the shear test results obtained. The soil properties, tabularized in Table 2, of the site were calculated from the relation between the shear stress and normal stress values obtained from these results. In shear test results, the strength constants generally tend to be highly evaluated; thus, a conservative analysis was performed by selecting a lower value. This was done by setting an expected active plane, considering the creep collapse pattern of the slope site, and comparing it with the strength constant value using reverse analysis (see Table 3) [31,36,37]
4. Illustrative Examples
4.1. Slope Stability Analysis of the Target Slope
The slope stability of the target slope located in the area of Gyeongju was numerically analyzed using SLOPE/W software [33]. For the sake of the numerical analysis, the numerical model shown in Figure 6 was developed, and the cross-section was divided into three sections. The properties of each section are listed in Table 4.
It should be noted that the groundwater level/precipitation factors were not considered in the analysis in this research. Many studies have already proven that the groundwater level and precipitation factors have a great impact on slope collapse [23,38,39,40,41,42,43,44,45]. However, because analysis of slope collapse by earthquakes is the important aspect of this research, the influence of groundwater level and precipitation factors on slope stability and collapse were excluded.
The angle of shearing resistance (φ’) value is the same for the same slope, but three cohesion (c’) values were selected. This was selected likewise to determine the range of cohesion (c’) according to the number of cases, which were Case A (when assuming slope collapse), Case B (the reverse analysis value of the target slope), and Case C (the survey value of the target area (Gyeongju area)). Both the strength constant value when the slope collapses and the value obtained through an on-site survey were used, as shown in Table 5. From on-site survey data, 12.78 kPa from Case C [46] and 5.88 kPa from Case B were selected among the values near to an angle of shearing resistance of 34.5º. The above-mentioned three values can be defined as the possible range of strength constants of the target slope. In later analyses, each shall be used as a maximum and minimum value.
Additionally, results of three slope stability analyses without seismic effects are tabularized in Table 6.
4.2. Dynamic Analysis of the Target Slope According to Seismic Waves of Gyeongju
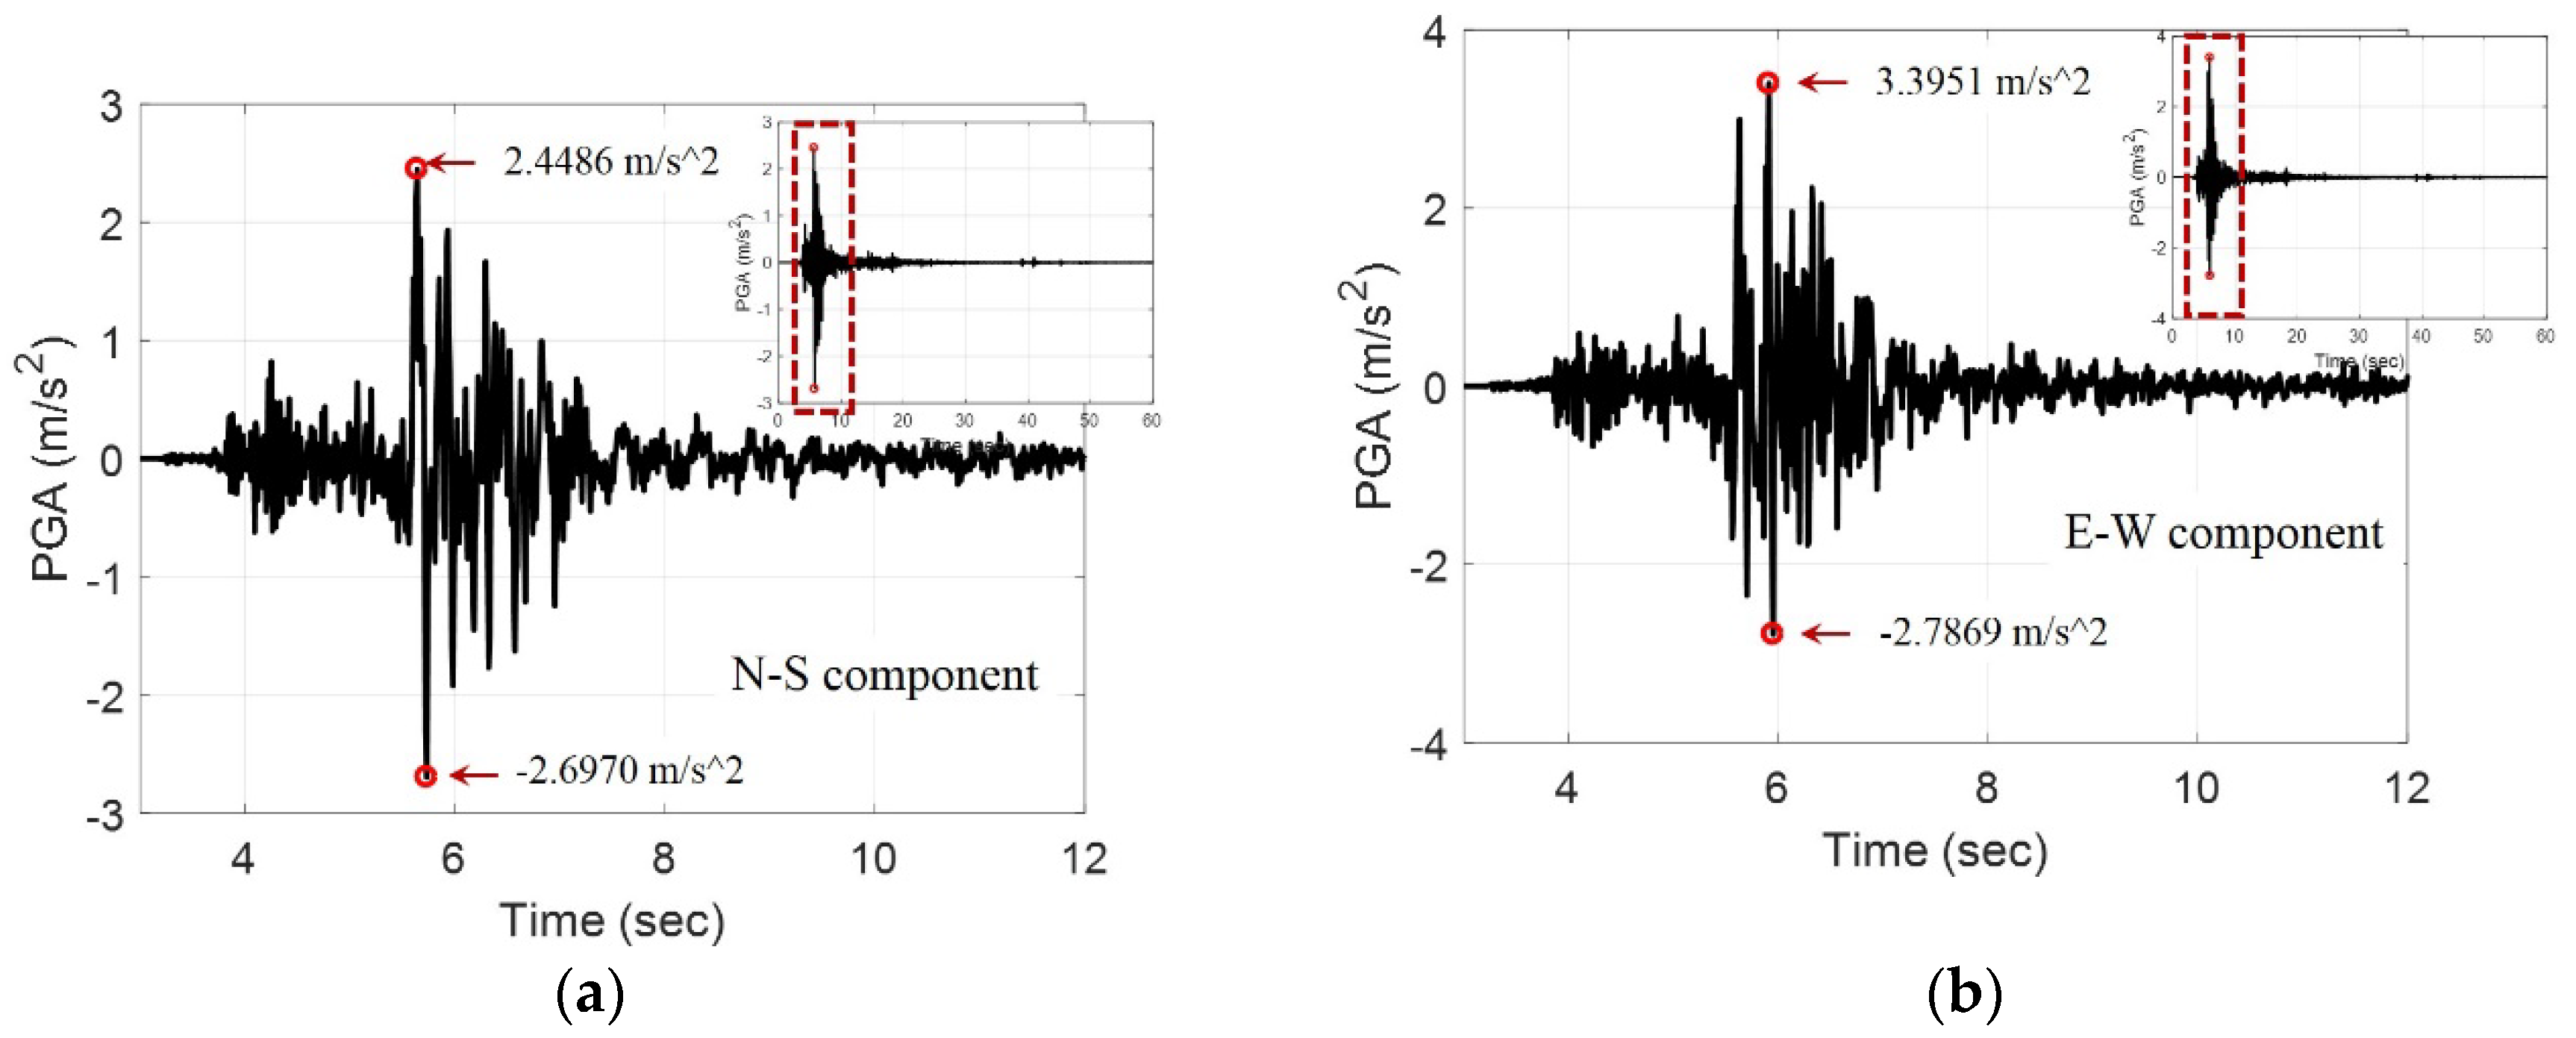
The stability of the target slope was examined with respect to the Gyeongju earthquake. The magnitude 5.8 seismic waves that occurred on 12 September 2016 were used (see Figure 7). The slope stability analysis regarding seismic waves was performed using QUAKE/W and SLOPE/W software [32,33].
As shown in Figure 7, the Gyeongju earthquake was the largest measured earthquake that had occurred inland on the Korean Peninsula since the beginning of seismological observation in 1905. Among the E-W and N-S components, the E-W components with high peak ground acceleration (PGA) were used based on data measured in the station located at Myeonggye-ri, Naenam-myeon, Gyeongju, Gyeongsangbuk-do, which is the measurement point of the Korea Institute of Geoscience and Mineral Resources (KIGAM). Here, the maximum PGA was 3.3951 m/s. The measured seismic waves were applied to the dynamic analysis, and the aforementioned slope stability analysis was performed again considering the seismic effects. The analysis results are shown in Table 7.
It should be noted that the several studies have been conducted by researchers on the influence of vertical seismic waves on the stability of ground structures. However, it is still a subject of debate. For instance, Gazetas et al. [48] and Sarma and Scorer [49] said that the role of the vertical acceleration in slope sliding deformations is so small that it can be neglected. On the contrary, other researchers [15,50,51] claim that the vertical bearing power has an important role. Therefore, the influence of vertical seismic waves was not considered in this study.
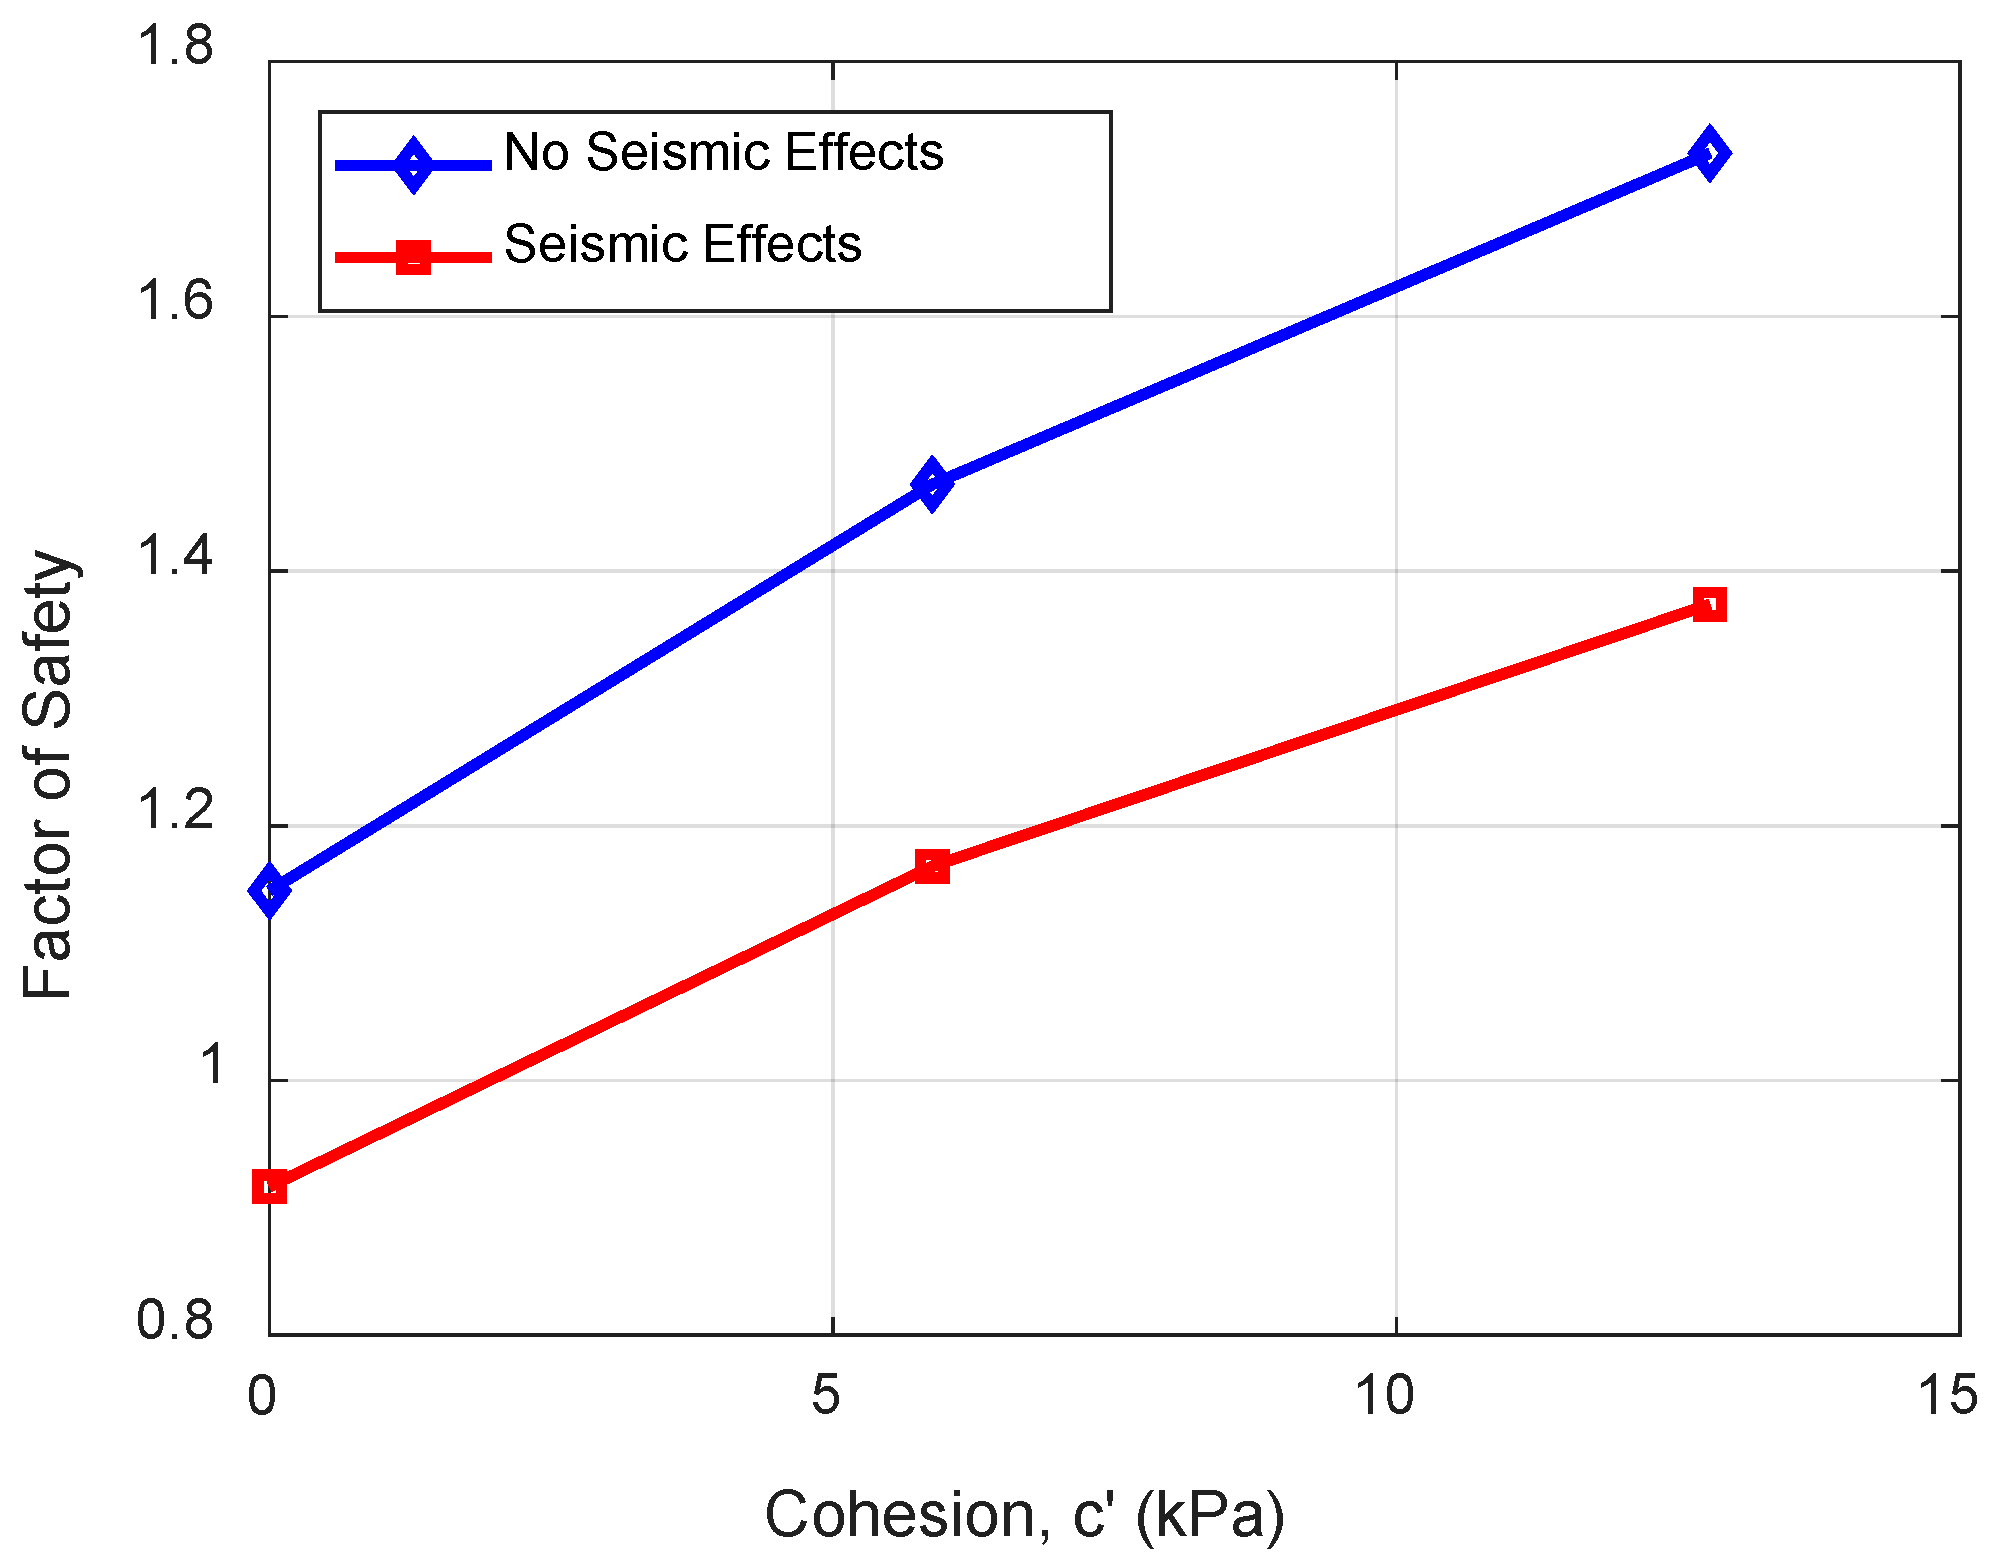
The analysis results revealed that the target slope was numerically safe when selecting a factor of safety of 1.0 as the slope collapse limit. However, it was found that the factor of safety decreases by about 20% depending on the strength constant applied, and according to whether seismic waves are considered or not (see Figure 8).
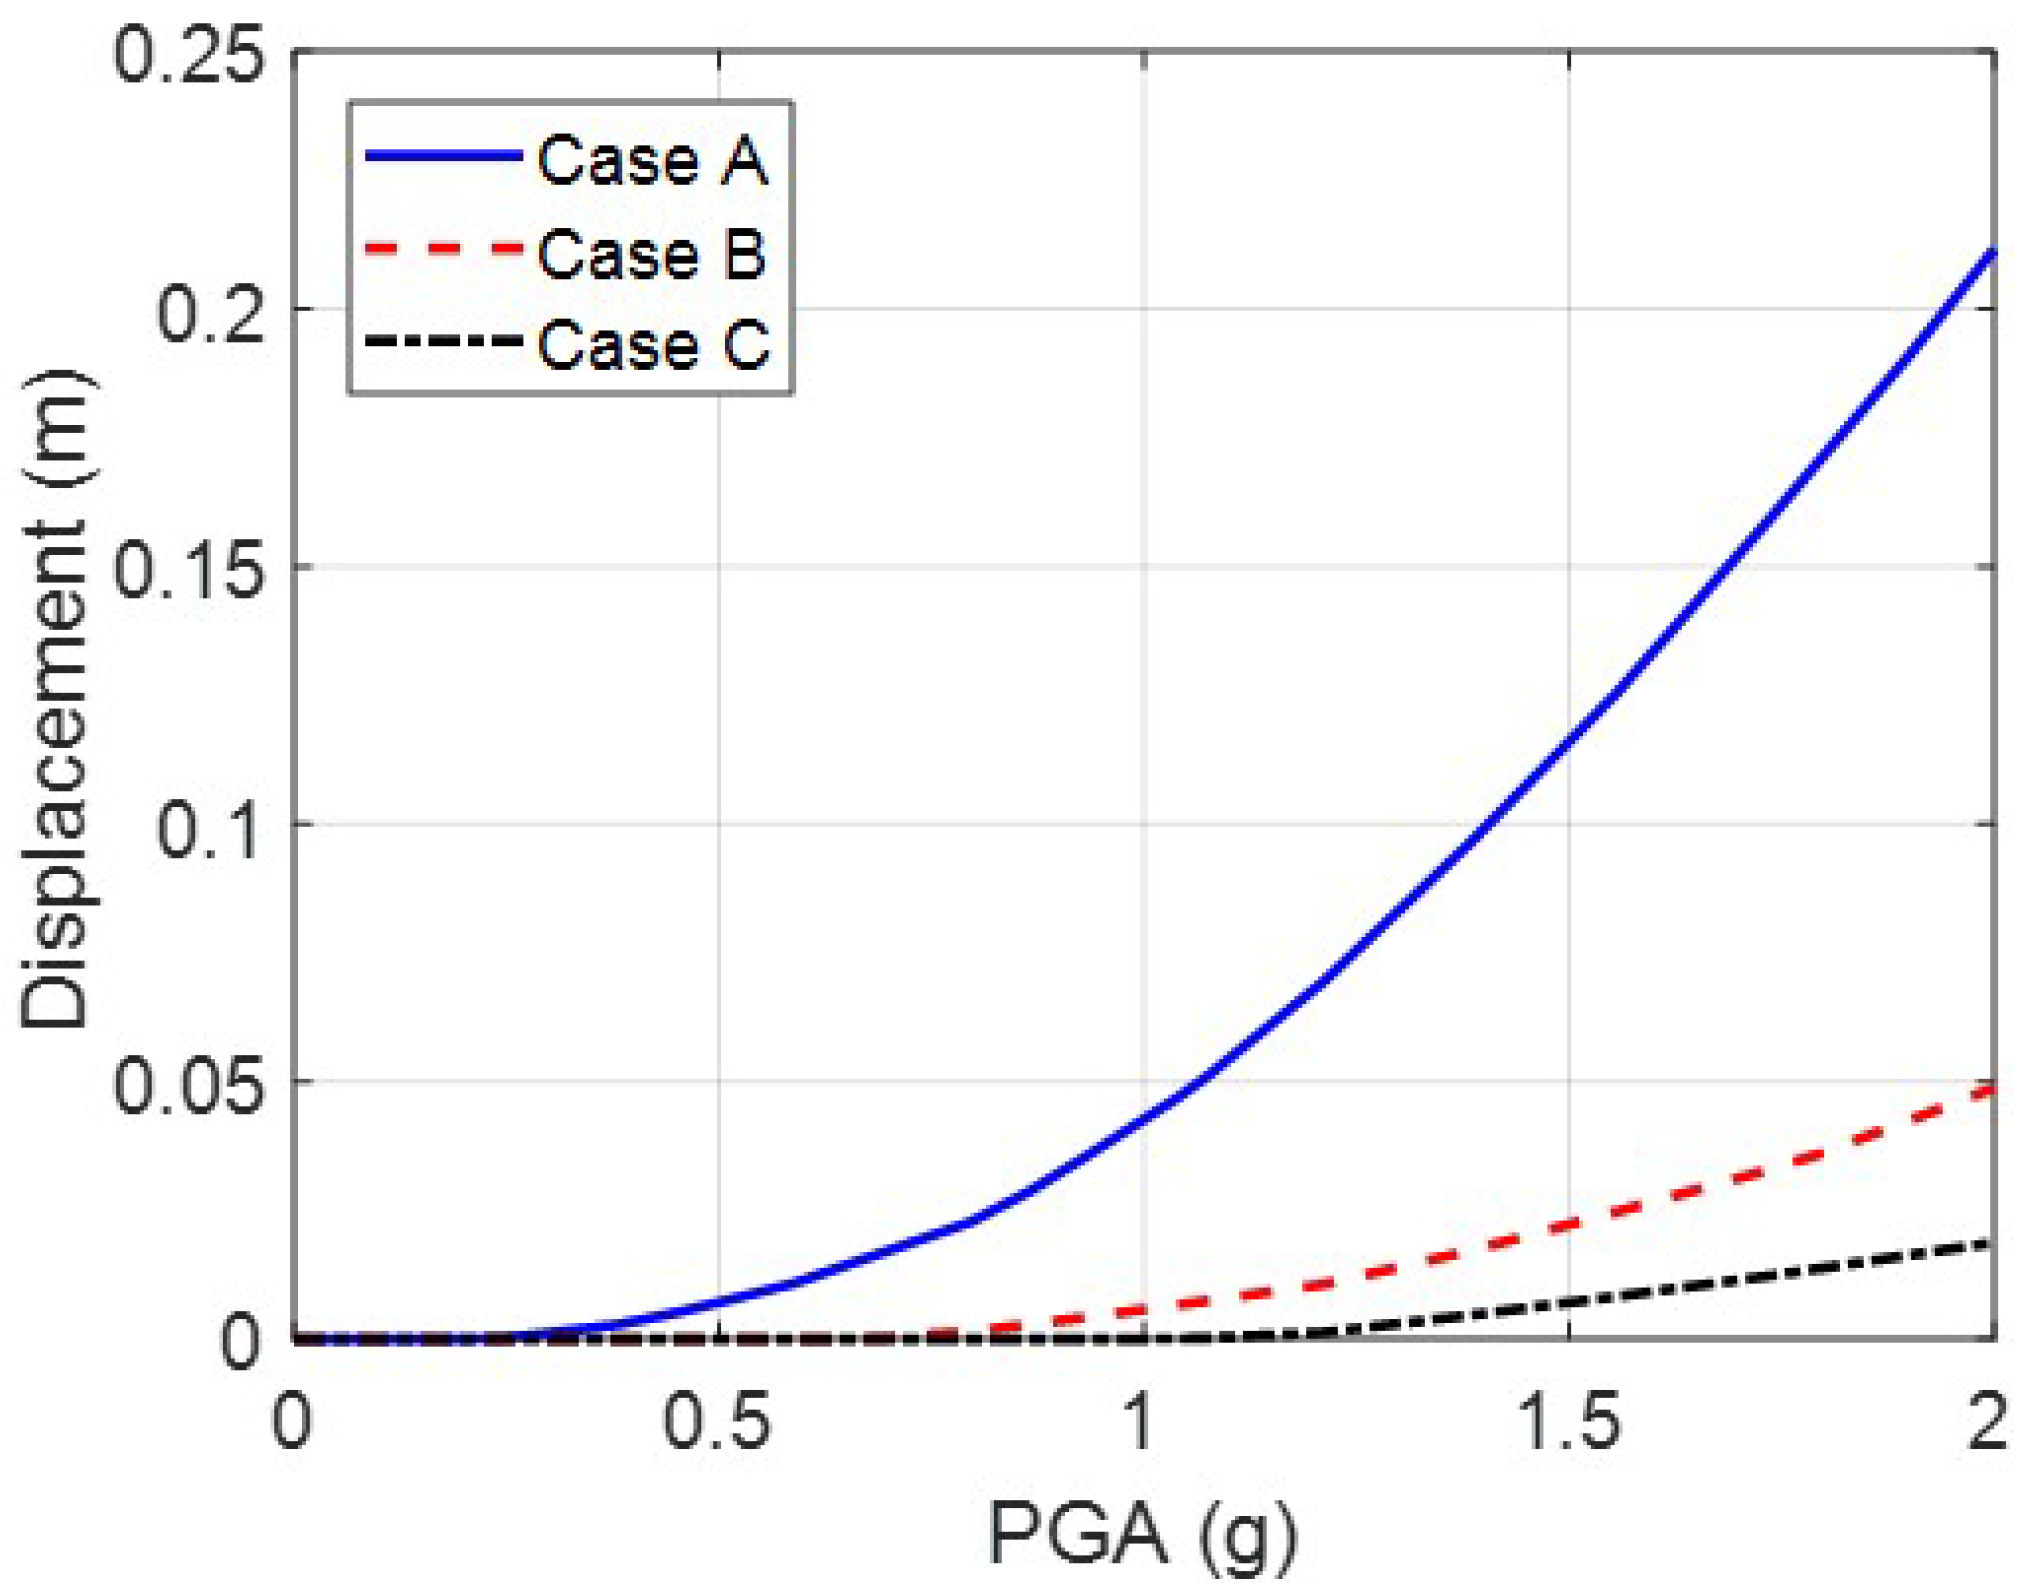
Additionally, to analyze the correlation between the factor of safety of the slope and scale of the earthquake, a slope stability analysis subjected to an earthquake was performed by increasing the peak ground acceleration (PGA) of the seismic waves from 0.0 (g)–2.0 (g) in increments of 0.1. Figure 9 shows the correlation between the seismic wave PGA value used in the analysis and the amount of displacement. According to Figure 9, the deformation for Case A is relatively higher than that of two cases. It can be explained that the strength constant of Case A is the value when the slope is assumed to collapse, so its increment of deformation is relatively higher than that of the others.
It should be commented that the value of 1.0 is adopted as the slope collapse limit in this study. However, there exists several values for the factor of safety as a reference value. For instance, the Korean standard factor of safety of slopes, applied in the analysis to ensure long-term slope face stability, is a value set for encouraging conservative design while ensuring economic feasibility. This standard considers the uncertainty contained in the safety analysis methods and input variables, and is listed in Table 8 [52].
As mentioned before, the factor of safety of slopes can be classified by groundwater levels or rainfalls. In this research, because the purpose is to study changes in slope safety depending on whether or not earthquakes are considered, the numerical analysis of the factor of safety of slopes is performed without considering the wet season, and thus, assuming a dry season state.
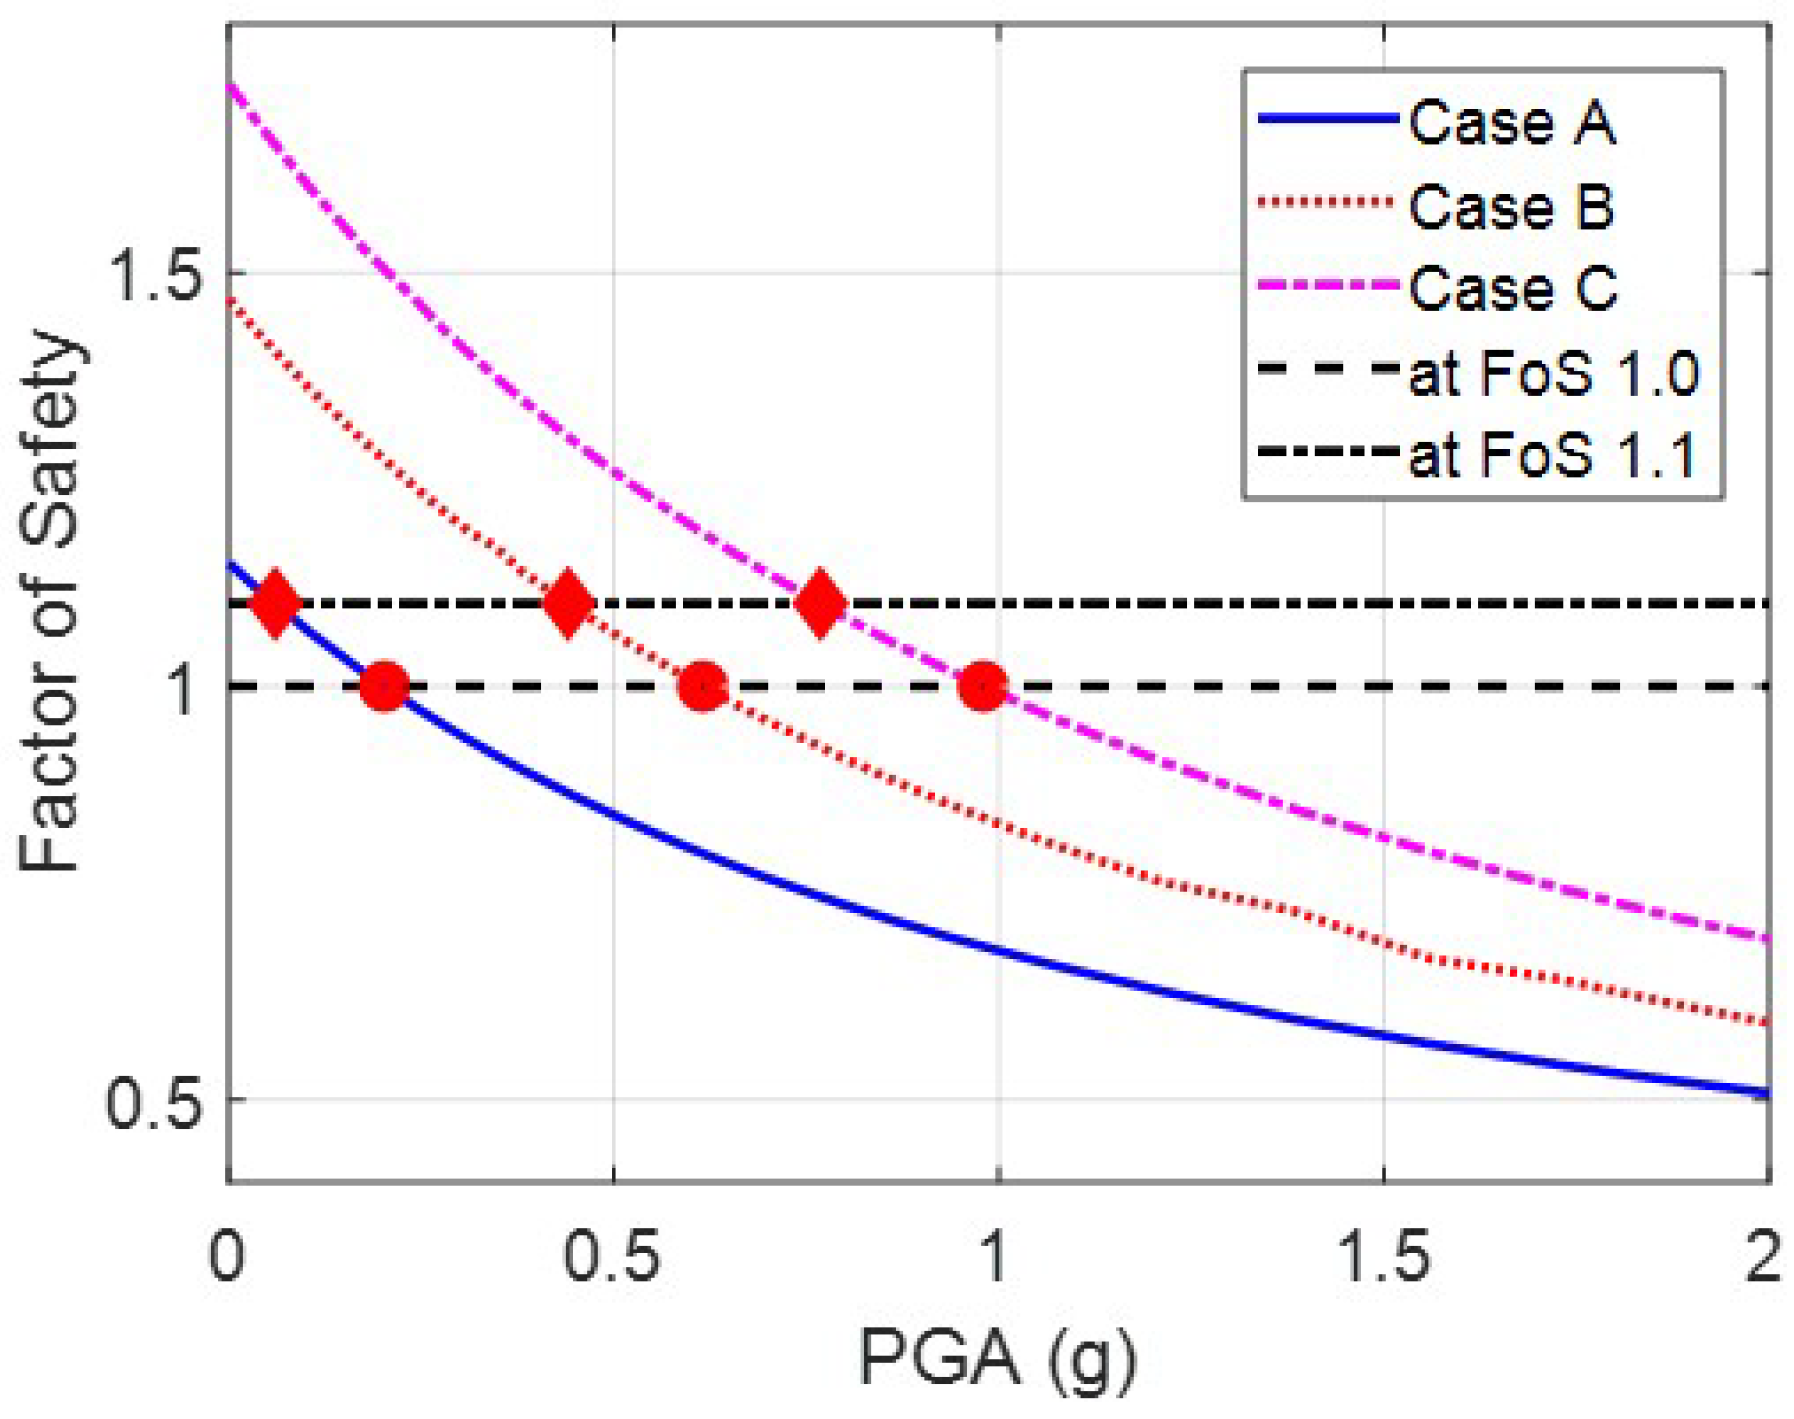
In this study, when the factor of safety value is higher than 1.0, the slope is considered to be safe, and when it is less than 1.0, the slope is considered to have a risk of collapse. Figure 10 shows the PGA (g) value corresponding to a factor of safety of 1.0 and 1.1, from Table 8, for each case. They are tabularized in Table 9 and they can be used as a standard value to examine the stability of slopes during earthquakes.
Additionally, a slope stability analysis was numerically performed while increasing the PGA values for each of the three strength constant values. Based on the analysis results, a nonlinear regression analysis [53] was performed using MATLAB [54] regarding the correlation between the factor of safety of the slope, strength constant value, and PGA value.
The nonlinear regression analysis results regarding the three strength constants revealed that the correlation among the PGA, strength constant, and factor of safety values can be expressed as in Equation (2). It was found that the numerical analysis and regression analysis results match very well when compared regarding each strength constant (see Figure 11).
where, c’ means the cohesion of slopes and x means the PGA (g).
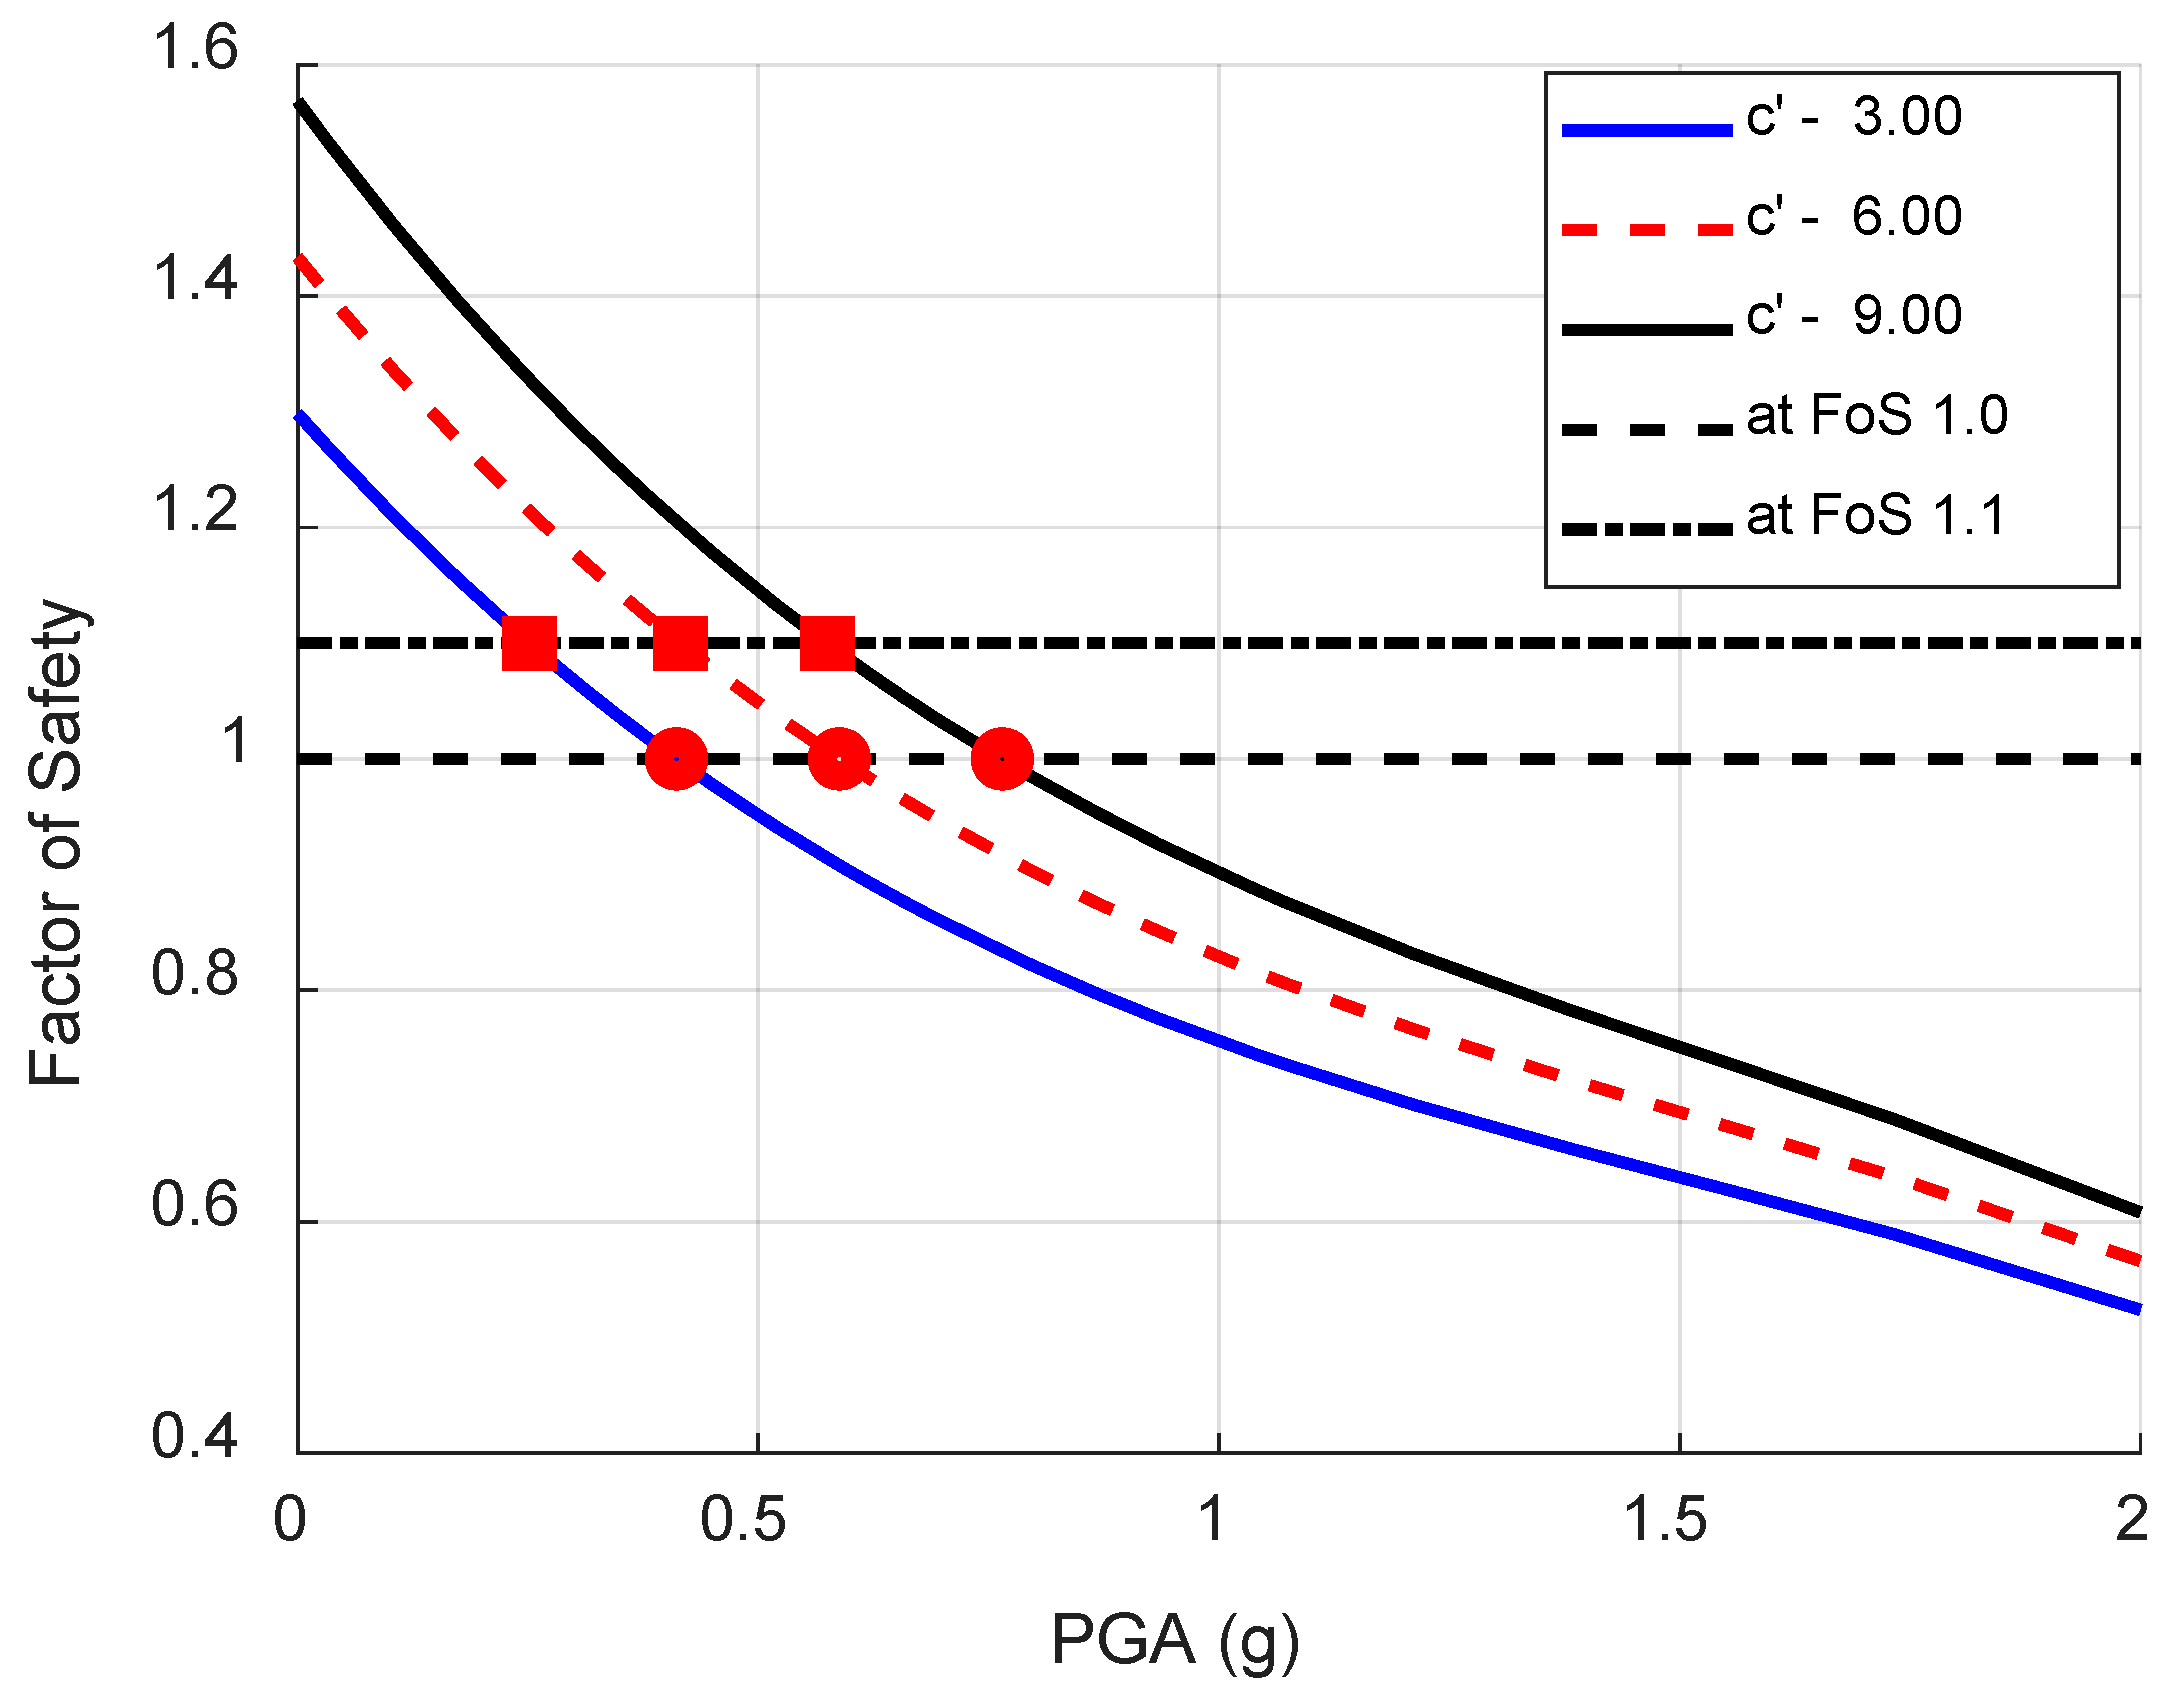
The regression analysis relational equation was used to perform slope collapse analysis for additional strength constant values. The slope factor of safety analysis was performed for cohesion (c’) values of 3, 6, and 9. The results of this analysis are shown in Figure 12 and tabularized in Table 10.
5. Summary and Conclusions
In this study, the tendency of changes in the safety factor of slopes against earthquakes was examined by performing a safety analysis on a slope located in the area of Gyeongju, South Korea. The target slope is representative of the Korean soil slopes. A dynamic analysis was performed using data of seismic waves that had occurred in the area of Gyeongju for three cases. The comparison of the safety factors considering and not considering the seismic waves on the target slope revealed that, in all the three cases, the slope factor of safety decreases by about 20% when seismic waves are considered. Considering that in South Korea, the design generally does not consider earthquakes, the slope earthquake instability can increase, and the possibility that slopes previously considered as safe become instable because of earthquakes cannot be excluded. Therefore, in the future, sufficient consideration to this effect when performing slope reinforcement design is required. Additionally, various strength constant coefficients and Gyeongju seismic-wave PGA values were numerically analyzed, from 0.0 (g) to 2.0 (g). The correlation of the slope factor of safety with strength constants and PGA values was examined by performing a regression analysis based on the analysis results. The PGA values that led to slope collapse were calculated for each of the strength constant cases, considering the factor of safety values that were below 1.0 as a slope collapse. It is expected that the calculated PGA data can be used as reference to evaluate slope collapse in the case of earthquake occurrence.
In this study, the degree of slope instability due to seismic load, which was neglected in the field of slope stability in Korea, has been verified. The relationship between the slope safety factor and the PGA value can predict the tendency of the stability reduction of Korea’s slopes depending on the earthquake magnitude. However, this study has been conducted on the soil slope and may be limited in some cases. In the future, similar research on rock slopes should be additionally and continuously carried out.
Author Contributions
S.P., W.K., and Y.B. conceived and designed the analysis and the experiments; S.P. performed the numerical analysis; J.L. performed the experiments; W.K. analyzed the data; S.P. and Wo.K. wrote the paper.
Funding
This study was supported by the National Research Council of Science & Technology (NST) grant by the Korea government (MSIP) (No. CRC-16-02-KICT) and the Korea Agency for Infrastructure Technology Advancement under the Ministry of Land, Infrastructure and Transport of the Korean government. (Project Number: 18SCIP-B108153-04).
Acknowledgments
The author acknowledges BasisSoft, Inc. for their invaluable comments and technical supports on the numerical analysis during this study.
Conflicts of Interest
The authors declare no conflicts of interest.
References
- Lee, K.; Yang, W.-S. Historical Seismicity of Korea. Bull. Seismol. Soc. Am. 2006, 96, 846–855. [Google Scholar] [CrossRef]
- Cho, H.-Y.; Lee, G.-S. Confidence Interval Estimation of the Earthquake Magnitude for Seismic Design using the KMA Earthquake Data. J. Korean Soc. Coast. Ocean Eng. 2017, 29, 62–66. [Google Scholar] [CrossRef] [Green Version]
- Kim, Y.-S.; Kim, T.; Kyung, J.-B.; Cho, C.-S.; Choi, J.-H.; Choi, C.-U. Preliminary study on rupture mechanism of the 9.12 Gyeongju Earthquake. J. Geol. Soc. Korea 2017, 53, 407–422. [Google Scholar] [CrossRef]
- Wang, Z.; Huang, W.; Zhao, D.; Pei, S. Mapping the Tohoku forearc: Implications for the mechanism of the 2011 East Japan earthquake (Mw 9.0). Tectonophysics 2012, 524, 147–154. [Google Scholar] [CrossRef]
- Matsumoto, S.; Katao, H.; Iio, Y. Determining changes in the state of stress associated with an earthquake via combined focal mechanism and moment tensor analysis: Application to the 2013 Awaji Island earthquake, Japan. Tectonophysics 2015, 649, 58–67. [Google Scholar] [CrossRef]
- Lin, A.; Chiba, T. Coseismic conjugate faulting structures produced by the 2016 Mw 7.1 Kumamoto earthquake, Japan. J. Struct. Geol. 2017, 99, 20–30. [Google Scholar] [CrossRef]
- Son, M. Formation and Development of the Miocene Basin, Southeastern Korea: Structural and Paleomagnetic Approaches. Ph.D. Thesis, Pusan National University, Busan, Korea, 1988. [Google Scholar]
- Van Westen, C.J.; Castellanos, E.; Kuriakose, S.L. Spatial data for landslide susceptibility, hazard, and vulnerability assessment: An overview. Eng. Geol. 2008, 102, 112–131. [Google Scholar] [CrossRef]
- Zaei, M.E.; Rao, K.S. Evaluating the Effect of Strong Earthquake on Slope Instability. Procedia Eng. 2017, 173, 1771–1778. [Google Scholar] [CrossRef]
- Griffiths, D.V.; Lane, P.A. Slope stability analysis by finite elements. Géotechnique 1999, 3, 387–403. [Google Scholar] [CrossRef]
- Fredlund, D.G.; Scoular, R.E.G. Using limit equilibrium concepts in finte element slope stability analysis. In Proceedings of the International Symposium on Slope Stability Engineering, Matsuyama, Japan, 8–11 November 1999; pp. 31–47. [Google Scholar]
- Al-Homoud, A.S.; Tahtamoni, W.W. A reliability based expert system for assessment and mitigation of landslides hazard under seismic loading. Nat. Hazards 2001, 24, 13–51. [Google Scholar] [CrossRef]
- Li, X. Finite element analysis of slope stability using a nonlinear failure Criteria. Comput. Geotech. 2007, 34, 127–136. [Google Scholar] [CrossRef]
- Jibson, R.W. Methods for assessing the stability of slopes during earthquakes—A retrospective. Eng. Geol. 2011, 122, 43–50. [Google Scholar] [CrossRef]
- Zhao, L.-H.; Cheng, X.; Zhang, Y.; Li, L.; Li, D.-J. Stability analysis of seismic slopes with cracks. Comput. Geotech. 2016, 77, 77–90. [Google Scholar] [CrossRef]
- Duncan, J.M. State of the Art: Limit Equilibrium and Finite-Element Analysis of Slopes. J. Geotech. Eng. 1996, 122, 577–596. [Google Scholar] [CrossRef]
- Gupta, V.; Bhasin, R.K.; Kaynia, A.M.; Kumar, V.; Saini, A.S.; Tandon, R.S.; Pabst, T. Finite element analysis of failed slope by shear strength reduction technique: A case study for Surabhi Resort Landslide, Mussoorie township, Garhwal Himalaya. Geomat. Nat. Hazards Risk 2016, 7, 1677–1690. [Google Scholar] [CrossRef] [Green Version]
- Li, D.-Q.; Xiao, T.; Cao, Z.-J.; Phoon, K.-K.; Zhou, C.-B. Efficient and consistent reliability analysis of soil slope stability using both limit equilibrium analysis and finite element analysis. Appl. Math. Model. 2016, 40, 5216–5229. [Google Scholar] [CrossRef]
- Bhandari, T.; Hamad, F.; Moormann, C.; Sharma, K.G.; Westrich, B. Numerical modelling of seismic slope failure using MPM. Comput. Geotech. 2016, 75, 126–134. [Google Scholar] [CrossRef]
- Zhan, Z.; Qi, S. Numerical Study on Dynamic Response of a Horizontal Layered-Structure Rock Slope under a Normally Incident Sv Wave. Appl. Sci. 2017, 7, 716. [Google Scholar] [CrossRef]
- Ma, J.Z.; Zhang, J.; Huang, H.W.; Zhang, L.L.; Huang, J.S. Identification of representative slip surfaces for reliability analysis of soil slopes based on shear strength reduction. Comput. Geotech. 2017, 85, 199–206. [Google Scholar] [CrossRef]
- Xiong, M.; Huang, Y. Stochastic seismic response and dynamic reliability analysis of slopes: A review. Soil Dyn. Earthq. Eng. 2017, 100, 458–464. [Google Scholar] [CrossRef]
- Collins, B.D.; Znidarcic, D. Stability Analyses of Rainfall induced Landslides. J. Geotech. Geoenviron. Eng. 2004, 130, 362–372. [Google Scholar] [CrossRef]
- Lowe, J.I. Stability analysis of Embankments. J. Soil Mech. Found. Div. 1967, 93, 1–33. [Google Scholar]
- Kramer, S.L. Geotechnical Earthquake Engineering, 1st ed.; Prentice Hall Books: Upper Saddle River, NJ, USA, 1996; ISBN 9780135161487. [Google Scholar]
- Newmark, N.M. Effects of Earthquakes on Dams and Embankments. Géotechnique 1965, 15, 139–160. [Google Scholar] [CrossRef]
- Chugh, A.K. Slope stability analysis for earthquakes. Int. J. Numer. Anal. Methods Geomech. 1982, 6, 307–322. [Google Scholar] [CrossRef]
- Chopra, A.K. Dynamics of Structures: Theory and Applications to Earthquake Engineering; Prentice Hall International Series in Civil Engineering and Engineering Mechaniics; Pearson/Prentice Hall: Upper Saddle River, NJ, USA, 2007; ISBN 9780131561748. [Google Scholar]
- Bishop, A.W. The use of the Slip Circle in the Stability Analysis of Slopes. Géotechnique 1955, 5, 7–17. [Google Scholar] [CrossRef]
- Fredlund, D.G.; Krahn, J.; Pufahl, D.E. The relationship between limit equilibrium slope stability methods. In Proceedings of the International Conference on Soil Mechanics and Foudation Engineering, Stockholm, Sweden, 15–19 June 1981; Volume 3, pp. 409–416. [Google Scholar]
- Whitman, R.V.; Bailey, W.A. Use of computers for slope stability analysis. J. Soil Mech. Found. Div. 1967, 93, 475–498. [Google Scholar]
- GEO-SLOPE International Ltd. QUAKE/W 2012; GEO-SLOPE International Ltd.: Calgary, AB, Canada, 2012. [Google Scholar]
- GEO-SLOPE International Ltd. Stability Modeling with SLOPE/W 2012; GEO-SLOPE International Ltd.: Calgary, AB, Canada, 2012. [Google Scholar]
- The Ministry of Land Infrastructure and Transport. Operation of Road Cut Slope Management System in 2013; The Ministry of Land Infrastructure and Transport: Seoul, Korea, 2013.
- Korea Expressway Corp. Road Design Outline 2; Korea Expressway Corp.: Gimcheon-si, Korea, 2002. [Google Scholar]
- Coates, D.F.; Gyenge, M.; Stubbins, J.B. Slope Stability Studies at Knob Lake. In Proceedings of the Third Canadian Symposium on Rock Mechanics, Ottawa, ON, Canada, 15–16 January 1965; pp. 35–49. [Google Scholar]
- Lv, Q.; Liu, Y.; Yang, Q. Stability analysis of earthquake-induced rock slope based on back analysis of shear strength parameters of rock mass. Eng. Geol. 2017, 228, 39–49. [Google Scholar] [CrossRef]
- Ko, C.; Flentje, P.; Chowdhury, R. Interpretation of probability of landsliding triggered by rainfall. Landslides 2004, 1, 263–275. [Google Scholar] [CrossRef]
- Xu, Q.; Zhang, L. The mechanism of a railway landslide caused by rainfall. Landslides 2010, 7, 149–156. [Google Scholar] [CrossRef]
- Lu, N.; Sener-Kaya, B.; Wayllace, A.; Godt, J.W. Analysis of rainfall-induced slope instability using a field of local factor of safety. Water Resour. Res. 2012, 48, W09524. [Google Scholar] [CrossRef]
- Suradi, M.; Fourie, A.B.; Saynor, M.J. An experimental and numerical study of a landslide triggered by an extreme rainfall event in northern Australia. Landslides 2016, 13, 1125–1138. [Google Scholar] [CrossRef]
- Vallet, A.; Charlier, J.B.; Fabbri, O.; Bertrand, C.; Carry, N.; Mudry, J. Functioning and precipitation-displacement modelling of rainfall-induced deep-seated landslides subject to creep deformation. Landslides 2016, 13, 653–670. [Google Scholar] [CrossRef]
- Dai, F.C.; Lee, C.F.; Wang, S.J. Characterization of rainfall-induced landslides. Int. J. Remote Sens. 2003, 24, 4817–4834. [Google Scholar] [CrossRef]
- Conte, E.; Donato, A.; Pugliese, L.; Troncone, A. Analysis of the Maierato landslide (Calabria, Southern Italy). Landslides 2018. [Google Scholar] [CrossRef]
- Conte, E.; Troncone, A. A performance-based method for the design of drainage trenches used to stabilize slopes. Eng. Geol. 2018, 239, 158–166. [Google Scholar] [CrossRef]
- Moon, S.-W.; Yun, H.-S.; Choo, C.O.; Kim, W.-S.; Seo, Y.-S. A Study on Mineralogical and Basic Mechanical Properties of Fault Gouges in 16 Faults, Korea. J. Mineral. Soc. Korea 2015, 28, 109–126. [Google Scholar] [CrossRef]
- Moon, S.-W.; Yun, H.-S.; Kim, W.-S.; Na, J.-H.; Kim, C.-Y.; Seo, Y.-S. Correlation Analysis between Weight Ratio and Shear Strength of Fault Materials using Multiple Regression Analysis. J. Eng. Geol. 2014, 24, 397–409. [Google Scholar] [CrossRef]
- Gazetas, G.; Garini, E.; Anastasopoulos, I.; Georgarakos, T. Effects of Near-Fault Ground Shaking on Sliding Systems. J. Geotech. Geoenviron. Eng. 2009, 135, 1906–1921. [Google Scholar] [CrossRef]
- Sarma, S.; Scorer, M. The effect of vertical acceleration on seismic slope stability. In Proceedings of the International Conference on Performance Based Design in Earthquake Geotechnical Engineering, Tokyo, Japan, 15–18 June 2009. [Google Scholar]
- Ling, H.I.; Leshchinsky, D.; Mohri, Y. Soil slopes under combined horizontal and vertical seismic accelerations. Earthq. Eng. Struct. Dyn. 1997, 26, 1231–1241. [Google Scholar] [CrossRef]
- Zhang, Y.; Chen, G.; Zheng, L.; Li, Y.; Wu, J. Effects of near-fault seismic loadings on run-out of large-scale landslide: A case study. Eng. Geol. 2013, 166, 216–236. [Google Scholar] [CrossRef]
- The Ministry of Land Infrastructure and Transport. Construction Slope Design Standard; The Ministry of Land Infrastructure and Transport: Seoul, Korea, 2016.
- Seber, G.A.F.; Wild, C.J. Nonlinear Regression; Wiley Series in Probability and Statistic; Wiley: Hoboken, NJ, USA, 2003; ISBN 9780471471356. [Google Scholar]
- The MathWorks Inc. MATLAB Version 8.6.0 (R2015b); The MathWorks Inc.: Natick, MA, USA, 2015. [Google Scholar]
Figure 1.
Geological map of the southeastern Korean Peninsula: (a) Regional satellite image of the Cenozoic rocks area, southeast Korean Peninsula (Blue quad angle shows the study point); and (b) regional structural map and distribution area of the Neogene rocks, southeast Korean Peninsula [7] (Gray area).

Figure 2.
Panoramic photograph of the target slope.

Figure 3.
Standard cross-section of the target slope.

Figure 4.
Compaction curve.

Figure 5.
Relationship between normal stress and shear stress according to the shear test results.

Figure 6.
2-D numerical model of the target slope.

Figure 7.
Two components of Gyeongju’s seismic waves: (a) N-S component of the earthquake; and (b) E-W component of the earthquake.
Figure 7.
Two components of Gyeongju’s seismic waves: (a) N-S component of the earthquake; and (b) E-W component of the earthquake.

Figure 8.
Correlation between the strength constant value and the factor of safety when considering seismic effects.
Figure 8.
Correlation between the strength constant value and the factor of safety when considering seismic effects.

Figure 9.
Correlation between slope deformation and peak ground acceleration.

Figure 10.
Correlation between the factor of safety of slopes and peak ground acceleration.

Figure 11.
Comparison between the numerical analysis and regression analysis values, regarding the cohesion of the slope and PGA.
Figure 11.
Comparison between the numerical analysis and regression analysis values, regarding the cohesion of the slope and PGA.

Figure 12.
Regression analysis results for different strength constants.


Table 1.
Compaction test results.
| Maximum Dry Unit Weight (kN/m3) | Optimum Moisture Content (%) |
|---|---|
| 15.88 | 21.45 |
Table 2.
Shear test results.
| c’ (kPa) | φ’ (º) |
|---|---|
| 6.174 | 46.32 |
Table 3.
Strength constant estimated through reverse analysis.
| c’ (kPa) | φ’ (º) |
|---|---|
| 5.88 | 34.5 |
Table 4.
Material properties of the target slope.
| Material | Cohesion (kPa) | Angle of Shearing Resistance (º) | Density (kN/m3) |
|---|---|---|---|
| Soil | 5.88 | 34.5 | 15.88 |
| Weathered Rock | 19.0 | 33.697 | 15.88 |
| Bed Rock | Bedrock (impenetrable) | ||
| Items | Case A | Case B | Case C |
|---|---|---|---|
| Cohesion, c’ (kPa) | 0 | 5.88 | 12.78 |
| Angle of Shearing Resistance, φ’ (º) | 34.5 | 34.5 | 34.5 |
Table 6.
Factor of safety and deformation of the slope without considering seismic effects according to the three strength constants.
Table 6.
Factor of safety and deformation of the slope without considering seismic effects according to the three strength constants.
| Case | Factor of Safety | Deformation(m) |
|---|---|---|
| CASE A | 1.149 | 0. |
| CASE B | 1.468 | 0. |
| CASE C | 1.728 | 0. |
Table 7.
Factor of safety and deformation of the slope regarding seismic waves when considering the three strength constants.
Table 7.
Factor of safety and deformation of the slope regarding seismic waves when considering the three strength constants.
| Factor of Safety | Deformation (mm) | Difference when Compared with Case of not Considering Seismic Effects (%) | |
|---|---|---|---|
| Case A | 0.9167 | 2.2 | 20.2204 |
| Case B | 1.1682 | 0 | 20.4210 |
| Case C | 1.3739 | 0 | 20.4936 |
Table 8.
Korean standard factor of safety applied in slope safety analyses [52].
Table 8.
Korean standard factor of safety applied in slope safety analyses [52].
| Category | Factor of Safety |
|---|---|
| Dry season | FS > 1.5 |
| Wet season | FS > 1.2 FS > 1.3 (when considering rainfall permeation) |
| In case of earthquake | FS > 1.1 |
Table 9.
Factor of safety and its corresponding PGA (g) values for three cases.
| Factor of Safety | PGA (g) | ||
|---|---|---|---|
| Case A | Case B | Case C | |
| 1.0 | 0.5829 | 1.7764 | 2.8285 |
| 1.1 | 0.1736 | 1.2715 | 2.2185 |
Table 10.
Factor of safety and its corresponded PGA (g) values.
| Factor of Safety | PGA (g) | ||
|---|---|---|---|
| c’—3.0 kPa | c’—6.0 kPa | c’—9.0 kPa | |
| 1.0 | 0.4135 | 0.5892 | 0.7635 |
| 1.1 | 0.2533 | 0.4177 | 0.5760 |
© 2018 by the authors. Licensee MDPI, Basel, Switzerland. This article is an open access article distributed under the terms and conditions of the Creative Commons Attribution (CC BY) license (http://creativecommons.org/licenses/by/4.0/).
Share and Cite
MDPI and ACS Style
Park, S.; Kim, W.; Lee, J.; Baek, Y. Case Study on Slope Stability Changes Caused by Earthquakes—Focusing on Gyeongju 5.8 ML EQ. Sustainability 2018, 10, 3441. https://0-doi-org.brum.beds.ac.uk/10.3390/su10103441
AMA Style
Park S, Kim W, Lee J, Baek Y. Case Study on Slope Stability Changes Caused by Earthquakes—Focusing on Gyeongju 5.8 ML EQ. Sustainability. 2018; 10(10):3441. https://0-doi-org.brum.beds.ac.uk/10.3390/su10103441
Chicago/Turabian StylePark, Sangki, Wooseok Kim, Jonghyun Lee, and Yong Baek. 2018. "Case Study on Slope Stability Changes Caused by Earthquakes—Focusing on Gyeongju 5.8 ML EQ" Sustainability 10, no. 10: 3441. https://0-doi-org.brum.beds.ac.uk/10.3390/su10103441
Note that from the first issue of 2016, this journal uses article numbers instead of page numbers. See further details here.