1. Introduction
Agriculture is considered both as a supplier and energy consumer [
1,
2]. In recent years, the agricultural sector in Europe has adopted intensive farming practices to increase plantations productivity and ultimately, meet population demands. However, this led to depletion of natural resources and climate change, among other consequences [
3,
4].
Thomassen and Boer [
5] refer to the existence of a variety of tools and methods that can be used as comparison of environmental impacts and economic costs of agricultural production, namely the Life-Cycle Assessment (LCA).
The LCA is a standardized methodology [
6] to assess sustainability of all industrial processes. However, it can lead to different results, even for very similar products. Following a standardized method helps to build the basics of an LCA (all inventory inputs, functional unit, etc.) however structuring an LCA needs to take into consideration the social impacts and economic viability [
7,
8,
9]. Resulting sustainable solutions can be very efficient in the environmental aspect but impossible to accomplish due to social issues or economically inviable. Sustainability is an anthropocentric idea, before meeting the environmental criteria, it needs to meet the Human population requirements [
7,
10]. Through this methodology, an Energy Life Cycle Assessment (ELCA) is possible to be carried out, limiting only to energy issues [
11]. Commercial and non-commercial production, where fruit production is included, can be converted and standardized in forms of power units. The ultimate goal for energy efficiency improvement is to contribute for a better economy, profitability and competitiveness, and, consequently, a more sustainable agriculture [
1,
2].
Therefore, having in mind the growing peach production in the Portuguese Beira Interior region, a study covering the ELCA will provide further insights to improve energy consumption in production and post-harvest processes, contributing for an environmental impact reduction.
In Europe, Spain is the major producer with more than 1,500,000 tons [
12]. Portugal presents a production of 41,000 tons. The
Beira Interior region is the leading Portuguese peach producing region with 1600 ha, 45.2% of the Portuguese area, and a production of 20,000 tons, 49.2% of the Portuguese production [
13].
2. LCA Applied to Fruit Products: State of the Art
One of the first LCA projects applied to agriculture was developed by Weidema et al. [
14], being an analysis of the environmental impact of a wheat culture in three distinct production systems: intensive, biological and integrated. Kramer et al. [
15] developed a study in a Dutch agricultural production to calculate emissions of carbon dioxide (CO
2), methane (CH
4) and nitrous oxide (N
2O). Margini et al. [
16] proposed a methodology based on LCA with the purpose of assessing the environmental impacts of the pesticides’ application in agriculture.
Milà i Canals et al. [
17] conducted a study based on apple orchards in New Zealand during 1999 and 2000, where they evaluated alternatives that could reduce the environmental impact associated with production. The use of agricultural machinery was the main energy consumer (30% to 50%). In addition, the harvest process was one of the operations that consumed most energy, due to be carried out using hydra-ladders, followed by irrigation, the phytosanitary treatments application, grass groundcover maintenance and pruning.
Alaphillipe et al. [
18] analyzed the environmental impact through the LCA methodology in nine apple orchards located in the south of France. This analysis was based on data collected between 2006 and 2009 in three distinct production systems, namely, low-input orchards, organic and conventional. A mass-based functional unit (FU) was used with a value of 32 tonnes·ha
−1 of apple. Energy expenditure was higher in operations involving plant chemical treatments and fertilization.
A study led by Royan et al. [
1] aimed to analyze the energy consumption, by quantifying energy inputs, as well as the peach production efficiency in an Iran province. In addition, non-renewable energy and renewable energy inputs were considered, as well as the direct and indirect forms of energy. The fuel consumption determined for this application was 175.4 L·ha
−1, equivalent to 9879 MJ·ha
−1.
Hemmati et al. [
19] held an energy analysis in olive production in flat and slope lands, accounting for the direct and indirect energy inputs, as well as renewable and non-renewable energies. This analysis considered energy inputs related to human labor, machinery, diesel consumption, chemical fertilizers, manure, pesticides, water for irrigation and electricity. In this study, diesel consumption in leveled land production was 957 MJ·ha
−1, while, in slope field was 935 MJ·ha
−1, thus higher fuel consumption was observed for flat land. However, total energy input was 15.9 GJ·ha
−1 for flat systems and 23.3 GJ·ha
−1 for slope field, showing a 46.5% higher energy input consumption for slope land.
Due to the increase of farming in Thailand, Soni et al. [
20] developed a study to evaluate energy consumption, as well as the emissions associated with the agricultural practice in 46 rainfed places. This study considered the total energy consumption, including direct or indirect, renewable or non-renewable energy sources. This study concluded that for different cultures, energy inputs are also distinct. In all cultures tested, the fossil fuel (diesel) was the most significant energy input.
In a study by Ingrao et al. [
21], LCA was conducted for peach production to identify and quantify aspects that can be improved and increase the environmental and economic sustainability. This analysis was performed between 2002 and 2011 and divided into two distinct phases. In a first phase, the LCA considered the whole cycle, including the production process with a land-based FU. Whereas the second phase was carried out with an assessment of the possible environmental improvement through a sensitivity analysis. In that study, an average annual production of 31.5 ton·ha
−1 was considered. The consumption of fossil fuels was 8.42 kg·ha
−1, considering that transportation was only assumed as energy input associated with the fertilizers application and packaging in post-harvest process. The irrigation revealed the largest environmental impact due to the high amount of water consumption and large electrical and fossil energy consumption required to pump water.
Keyes et al. [
22] conducted a study on apple production in the Nova Scotia province, in Canada. The study quantified and evaluated resources, such as the energy required for production, storage and transportation. The largest contributors for environmental impacts were associated with harvest operations, diesel consumption and the application of phytosanitary treatments. The energy consumption associated with apple production resulted from the use of fuels was 398 MJ·tonne
−1, from the orchard to the warehouse was 57.6 MJ·tonne
−1, from the warehouse was of 2200 MJ·tonne
−1 and finally, transport to the consumer (about 103 km) was 283 MJ·tonne
−1.
Vinyes et al. [
23] conducted an LCA of peach plantations from the start (tree planting) until the end (extinction, about 15 years later), in order to provide the whole perspective on peach production environmental impacts. Data was obtained in a plantation located in the northeast of Spain. The FU was 1 kg of peaches with four distinct scenarios specified according to the different periods of production. Namely, low production, high production, growing phase and average over the years. The study revealed a variation from 7% to 69% between scenarios, depending on the indicator. In addition, the mass-based study during a year of production might show alterations, especially in a low production scenario. The fuel consumption was (on average) 6.28 kg·ha
−1 for the four scenarios. Authors referred that the operation with the largest energy consumption was the phytosanitary treatment application.
Longo et al. [
24] developed a study applying the LCA for organic apples production in Northern Italy. The study analyzed the inputs of raw materials and energy sources, as well as the production and post-harvest processes and consumer distribution. Most of the energy consumption was due to fertilizers and pesticides application. Post-harvest operations had a negligible energy consumption when compared to the production process.
Also, Ghatrehsamani et al. [
25] developed an energy analysis of peach production in Bakhitari province, in Iran, in order to determine the amount of incoming and outgoing system energy. The direct and indirect sources of energy inputs and the forms of non-renewable and renewable energy were considered. Data collected through questionnaires and interviews to 100 different producers in the region, revealed that diesel consumption was 74.7 L·ha
−1, corresponding to 4206 MJ·ha
−1 of energy consumption.
Due to the growing importance of peach production in Portugal, in particular in the Beira Interior region, this study aims to carry out an energy analysis of the peach life-cycle to determine energy inputs importance in production and post-harvest processes. Considering the major findings of the above-mentioned studies, alternative scenarios were established for result comparison, giving a broader perspective on new energy efficiency opportunities and rationalization improvements.
3. Case Study: ELCA of Beira Interior’ Peach
3.1. Functional Unit
The functional unit (FU) is a measure of performance and can be classified as mass-based or land-based [
26]. The use of a mass-based FU can be complemented with the FU land-based for fruit production, this will provide two distinct results. Both FU are dependent on the study method. The former is used in land-based while the latter is more used for agricultural production guidance [
27]. According to Cerutti et al. [
26], comparing different functional units to the same fruit production system, can provide different situations, especially in cultures with a higher yield, in which there is a significantly better environmental performance using a mass-based FU. On the other hand, to use a land-based FU is more advantageous in fruit crops with a lower yield. To develop the peach ELCA study in the Portuguese
Beira Interior region, the utilized FU was land-based during the production process, since the energy consumption is quite similar in high or low production, due to the fact that the operations carried out in the plantation are not production dependent. In the harvest and post-harvest period, mass-based FU was essential to use since the energy consumption is dependent on the processed fruit amount.
3.2. System Area
The
Beira Interior region peach production was only carried out as an energy analysis, being considered the energy and fossil fuel consumption in the defined borders, in a regional farm,
Quinta dos Lamaçais. Therefore, the experimental data was obtained for each operation carried out in the plantation, the time taken by the tractor to cover each area, the amount of machinery used in each operation, as well as the number of operations carried out in a year vegetative cycle. The dimension of the studied area was the plantation area (3 m × 5 m), the number of trees per row and the number of rows where operations occurred related to the production process. It must be highlighted that this study only covered the impacts associated with one peach production year. A complete study will require monitoring and collect data throughout the peach trees life-cycle, i.e., since the plantation until the tree removal, which would require approximately 15 years for data collection [
21].
3.3. Inventory Analysis
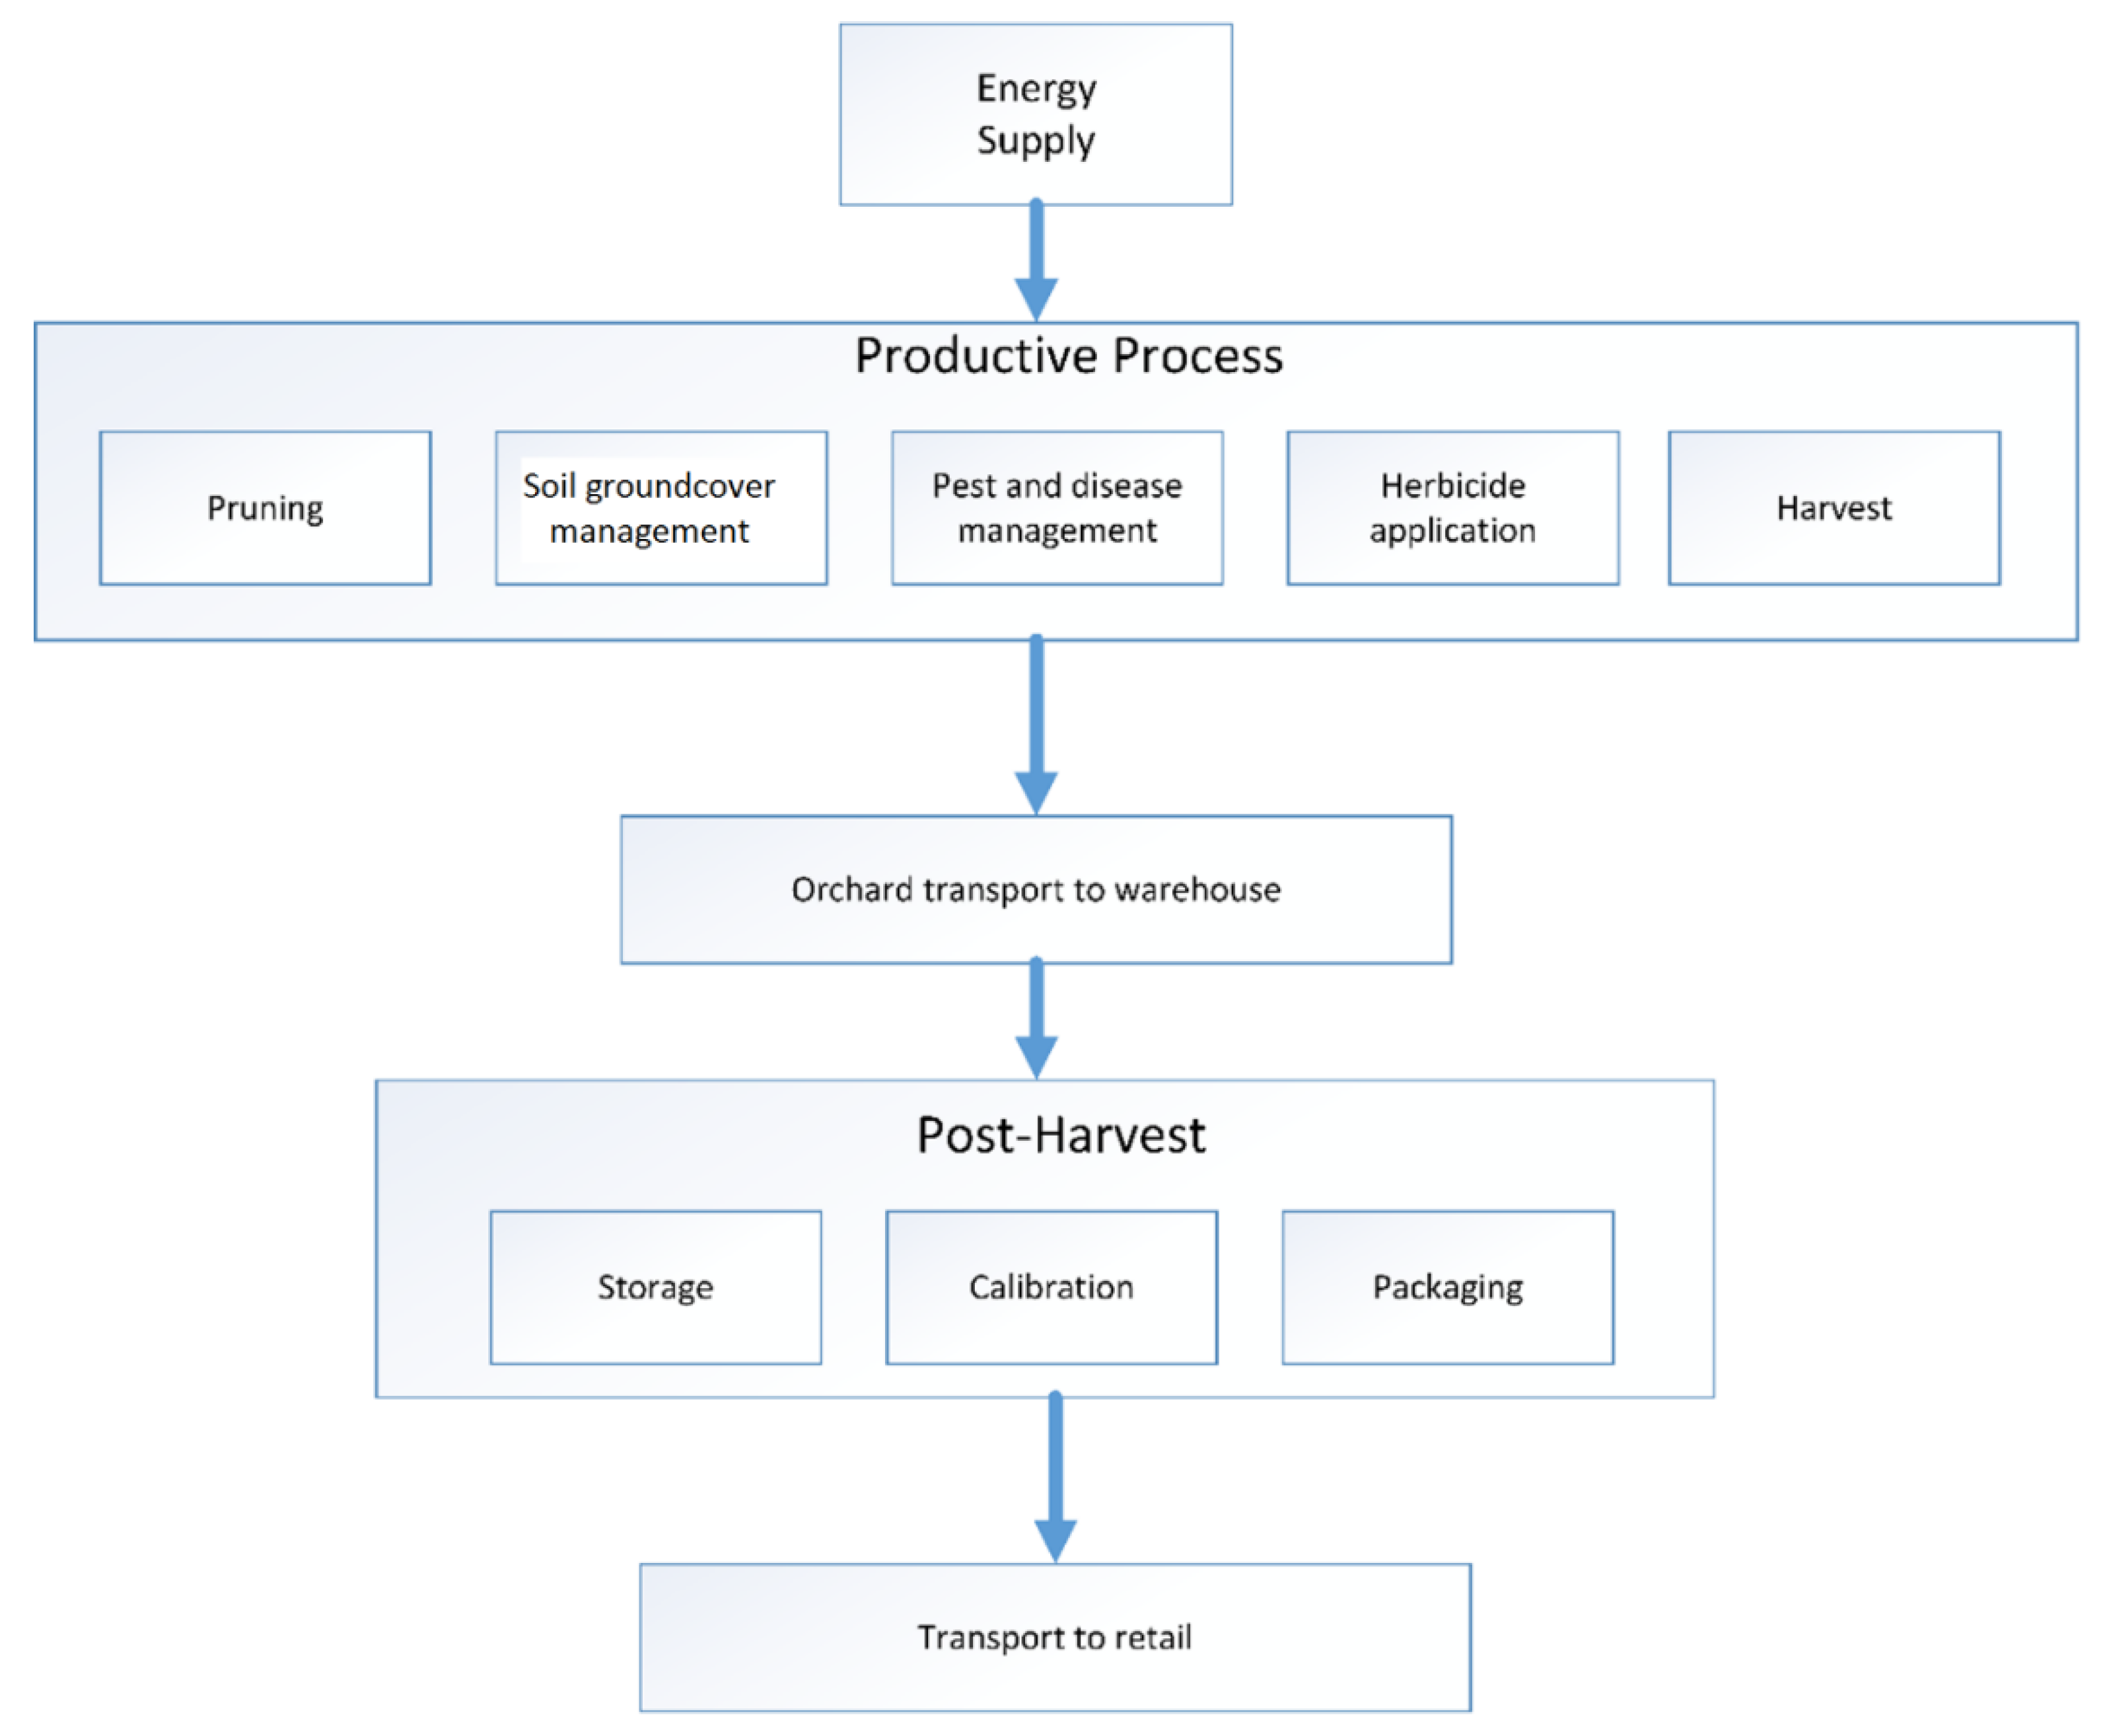
The energy consumption considered operations performed during cultivation and post-harvest periods. Different phases were considered during the period of cultivation, namely, pruning, soil maintenance, spraying, herbicide application, irrigation and harvest. Post-harvest operations include refrigerated storing, processing, packaging and transportation as represented in
Figure 1.
The inventory data collected was carried out during the years 2015 and 2016, which included field collection of data covering field operations and data gathering from previous years, related to the total number of performed plantation operations and the average production per hectare. The energy consumption was determined by calculating the fuel consumed amount per hectare for each operation performed. According to Ghatrehsamani et al. [
25], the equivalent energy factor in Liters of fuel is expressed in Mega Joules (MJ), as shown by Equation (1).
where,
E = Energy consumed in each production operation (MJ·ha−1)
C = Fuel consumed in each operation (L)
A tractor with 60 horse power (hp) and a density of 0.844 L·kg
−1 (ADP, 2009) was considered in the calculation of fuel consumption. According to Freitas [
28], the linear relationship between diesel consumption (expressed L·h
−1) and machine power (expressed in hp) is given by Equation (2).
where,
Cijk = Fuel consumption j during operation i execution using machine k (L·h−1)
P = Power of the machine k used in operation i (hp)
3.4. Post-Harvest Processes
After the harvesting process, the peaches are transported in vans to the warehouse, where they are stored, processed and packaged. Subsequently, these are placed in cooling chambers, staying there until being transported to the retailer. During storage and packaging processes, peaches may suffer some changes if there is a high number of big plastic boxes waiting to be stored and packed. In this way, the peaches are placed in the cooling chambers so there is no quality loss, because the ambient temperature during the harvest season is far superior compared to the storage temperature.
In the farm, peach cooling is done only by refrigerated chambers, not suffering any kind of pre-cooling prior to its entry in these chambers. Once packed, peaches are transported by a forklift to the cooling chamber, where these are stored at a temperature of approximately 2 °C up to a maximum of 15 days, counting from the harvesting date.
The farm under study achieved an annual production of 2553 tons and a power consumption of 509.2 MWh, where the most energy is consumed using the refrigeration chambers [
29,
30,
31]. Therefore, the energy consumption was obtained with the conversion factor of Ghatrehsamani et al. [
25] as shown in Equation (3).
where,
E = Energy consumed (MJ·tonne−1)
CE = Electricity consumed (kWh)
Considering a FU of 1 ton, the annual consumption at the warehouse is 199.5 kWh·tonne−1, that corresponds to 2380 MJ·tonne−1.
The annual warehouse energy consumption was determined by energy audits [
32,
33,
34]. The values shown in
Table 1 include the power consumption of all machines used during processing, storage and packaging of peaches, i.e., all energy consumed by the transporter mats, brushing, stackers and cooling chambers.
3.5. Market Transport
Similar to the study of Pereira et al. [
35,
36], the calculation of transport emissions can be calculated based on
Tier 2 and
Tier 3 methods. In the case of peaches transport, this calculation is divided into two sections, one directed to the Light Duty Vehicles, LDV < 3.5 tons and other for the Heavy-Duty Vehicles, HDV > 3.5 tons. Emission factors were taken from tables considering the year of the vehicle, being 1990 to 1995 for LDV and HDV, respectively, and the fuel type used, more precisely diesel [
37]. Additionally, the calculation of fuel consumption was performed according to EMEP/CORINAIR [
37], which takes into consideration the type of consumed fuel and an average speed of 50 km·h
−1 for the LDV and 90 km·h
−1 for the HDV.
The transport summary of the transportation during post-harvest is shown in
Table 2, which demonstrates the type of vehicle used in each path, the fuel consumption for each vehicle, according to EMEP/CORINAIR [
37], as well as the total distance travelled between the warehouse and orchard with the LDV and between warehouse and retailer for the HDV.
The fuel consumption is calculated according to the distance travelled from the plantation to the warehouse. Since this distance is the same for each operation, fuel consumption will also be identical.
3.6. Test Case Scenarios
3.6.1. Scenarios #1 and #2—Low and High Production Scenarios
Peach production amount obtained per hectare depends of several factors, in particular, climatic conditions and pests and diseases incidence that cause significant production losses [
38]. Thus, annual peach production is important to evaluate in two distinct scenarios, 23 tonne·ha
−1 for high, and 8 tonne·ha
−1 for low production.
The production process is based on the FU of 1 hectare of land. Yet, for the comparison of two scenarios, ELCA uses a FU based on mass (ton). Regarding energy consumption, this remains constant in both production scenarios since all operations are still required.
During post-harvest process, the transportation is considered from plantation to warehouse and from warehouse to retailer. Electricity consumed in the warehouse must be considered. The ELCA outputs considered, include fuel consumption, from plantation processes and transportation.
3.6.2. Scenario 3—Production Cycle with Irrigation Pump
During peach production process, irrigation is a determining factor for tree and fruit development, contributing to a high production quality and quantity. According to Simões et al. [
38], irrigation process depends from meteorological factors, culture, phenological state, root development and soil properties.
In the
Beira Interior region, according to the Directorate General for Agriculture and Rural Development of Portugal (DGADR), the annual water needs for peach trees of
Cova da Beira region are around 4700 m
3·ha
−1, where in July most water gets consumed (1600 m
3·ha
−1), although the water requirement is cultivar dependent. Simões et al. [
38], for
Beira Interior region the water needs is 3080 m
3·ha
−1 for early cultivars and 3340 m
3·ha
−1 for late cultivars. Since the farm under this study, use the Cova da Beira’s irrigation infrastructure system that consists irrigation by gravity, consequently no irrigation pumps are used, this case study allows assessing the energy costs for peach plantation not covered by the State irrigation system.
Regarding the energy consumption per hectare, this is calculated based on Vinyes et al. [
23] method. A specific energy consumption of 1300 kWh·ha
−1 of water pumps for the plantation irrigation and a 7600 m
3·ha
−1 water consumption was determined. According to Vinyes et al. [
23], a necessity of 4700 m
3 of water per year has a specific energy consumption of 804 kWh·ha
−1.
3.6.3. Scenario 4—Pruning Operation with Electric Shears
Pruning operation of fruit trees requires several tools, including small and large shears, pneumatic shears, knives, saws, axes, scythes, stairs, among others [
20]. Commonly, pruning is performed using hydra-ladders connected to an air compressor. A working tractor is constantly required to power the air compressor for using hydra-ladders and pneumatic shears, this requirement generates high costs due to fuel consumption. However, most frequent peach tree pruning technique adopted in the region is the vase (open center) systems, this leads to small trees. Thus, pruning can be performed without the use of hydra-ladders and pneumatic shears. In order to reduce the energy consumption during the pruning operation, electric shears linked to a portable battery carried in a backpack on the operator could replace the current method. Makita shears [
39], have a performance of 10,000 cuts load cycle, the equivalent to 7 work hours. This operation reaches an energy consumption of approximately 0.826 kW·ha
−1, the equivalent to 9.85 MJ, considering 10 shear and a pruning operation time (hours) per hectare. Therefore, energy consumption during peach orchard pruning operation will be much lower by using electric shears compared to pneumatic shear.
4. Results and Discussion
Field energy consumption from different operations resulted in 175.24 kg·ha
−1 of Diesel Consumption, corresponding to 11,693 MJ·ha
−1 (see
Table 1). Warehouse energy consumption is 2380 MJ·tonne
−1 (
Table 3). Transportation energy consumption to the market depends on the type of Light or Heavy-Duty Vehicles (see
Table 4).
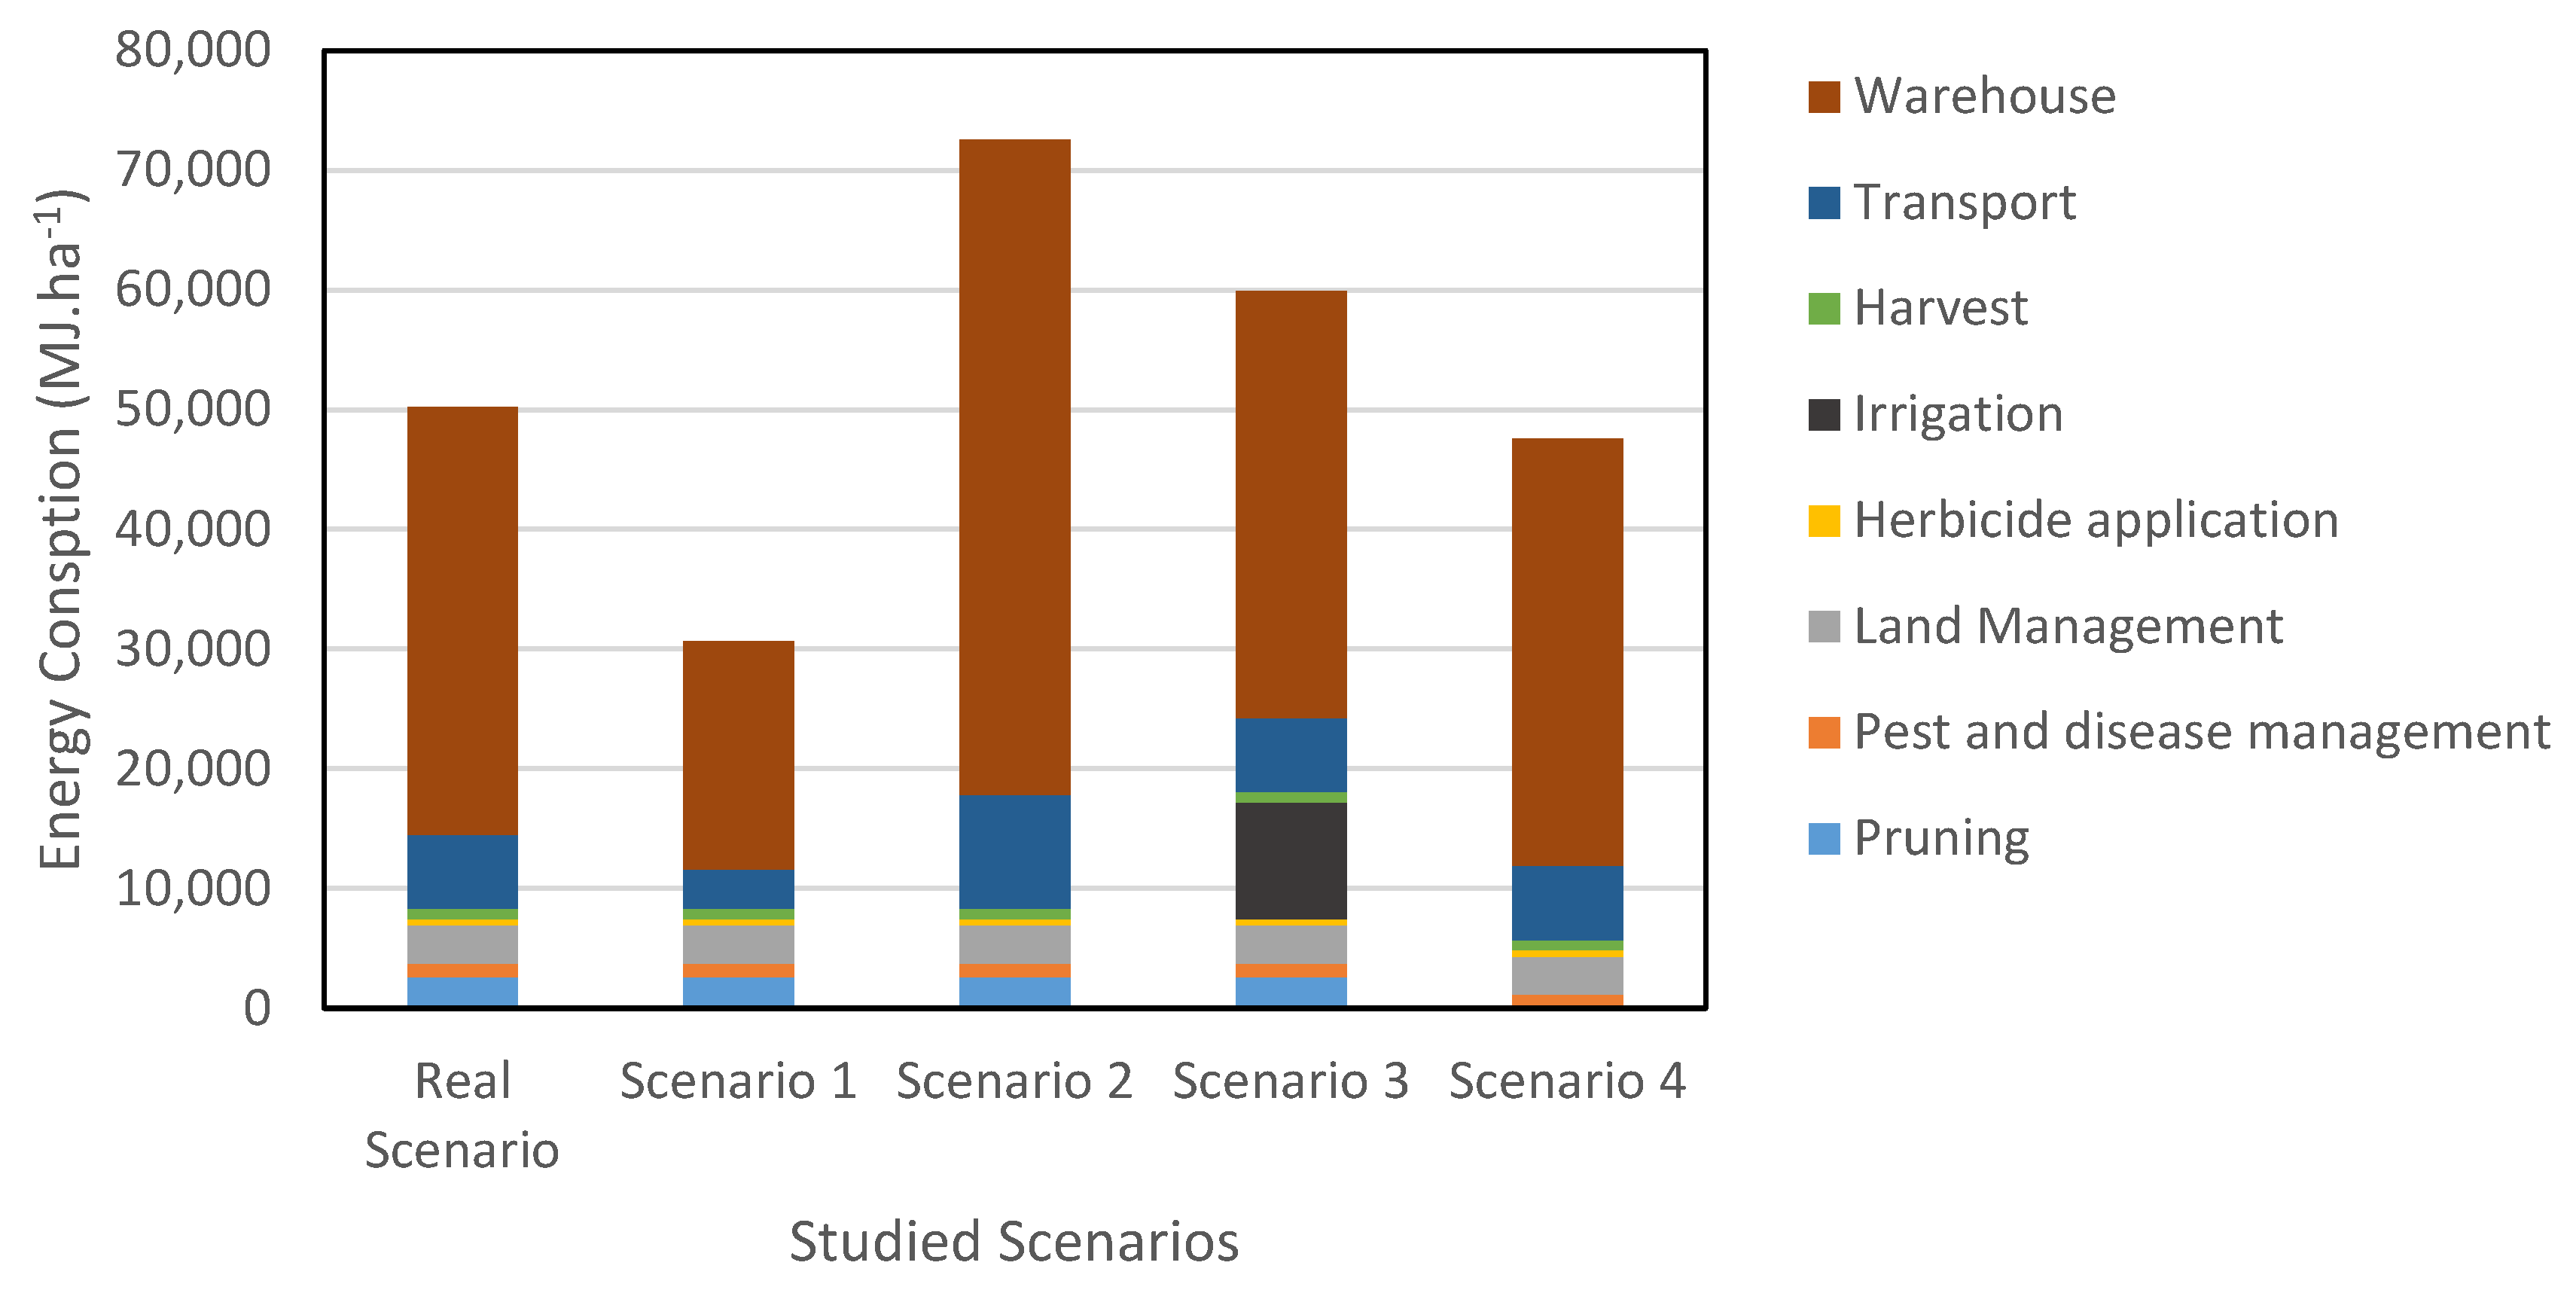
Figure 2 resumes all energy consumption per hectare values for real and test scenarios. Operations conducted in the field has a constant energy consumption per hectare regardless the production level during the production period (low or high production, scenario 1 and 2, respectively). The soil groundcover maintenance is the operation that shows largest energy consumption, since the tractor needs to cut 3 times the grass in each row. The tree line spacing is 5 m, if the flail mower has 2.5 m, the cutting number is reduced to 2 times, consequently this will incur in a third of the energy consumption. For scenario 3, with a pumping irrigation system (instead of gravity irrigation), shows an increase of energy consumption of 9723 MJ·ha
−1. In Scenario 4 considers replacing pneumatic shears by electric shears, show an energy saving of approximately 99.6% in this operation.
Through the analysis of
Table 5, the use of electric shears in the pruning operation are beneficial, resulting in a reduction of the energy consumption in 2614 MJ·ha
−1. In the post-harvest processes, transport and warehouse energy consumptions and warehouse are altered in different scenarios, because energy consumptions are related to annual production per hectare (tonne·ha
−1) variations. Comparing the real scenario with the low and high production scenarios, there is an energy difference of 19,544 MJ·ha
−1 and 22,336 MJ·ha
−1, respectively. Warehouse energy consumption corresponds to the largest share. This fact is largely due to the refrigeration system to extend peach useful life, ensuring the product freshness, quality and food safety. Transportation energy consumption is relevant, although not as significant as the warehouse energy consumption.
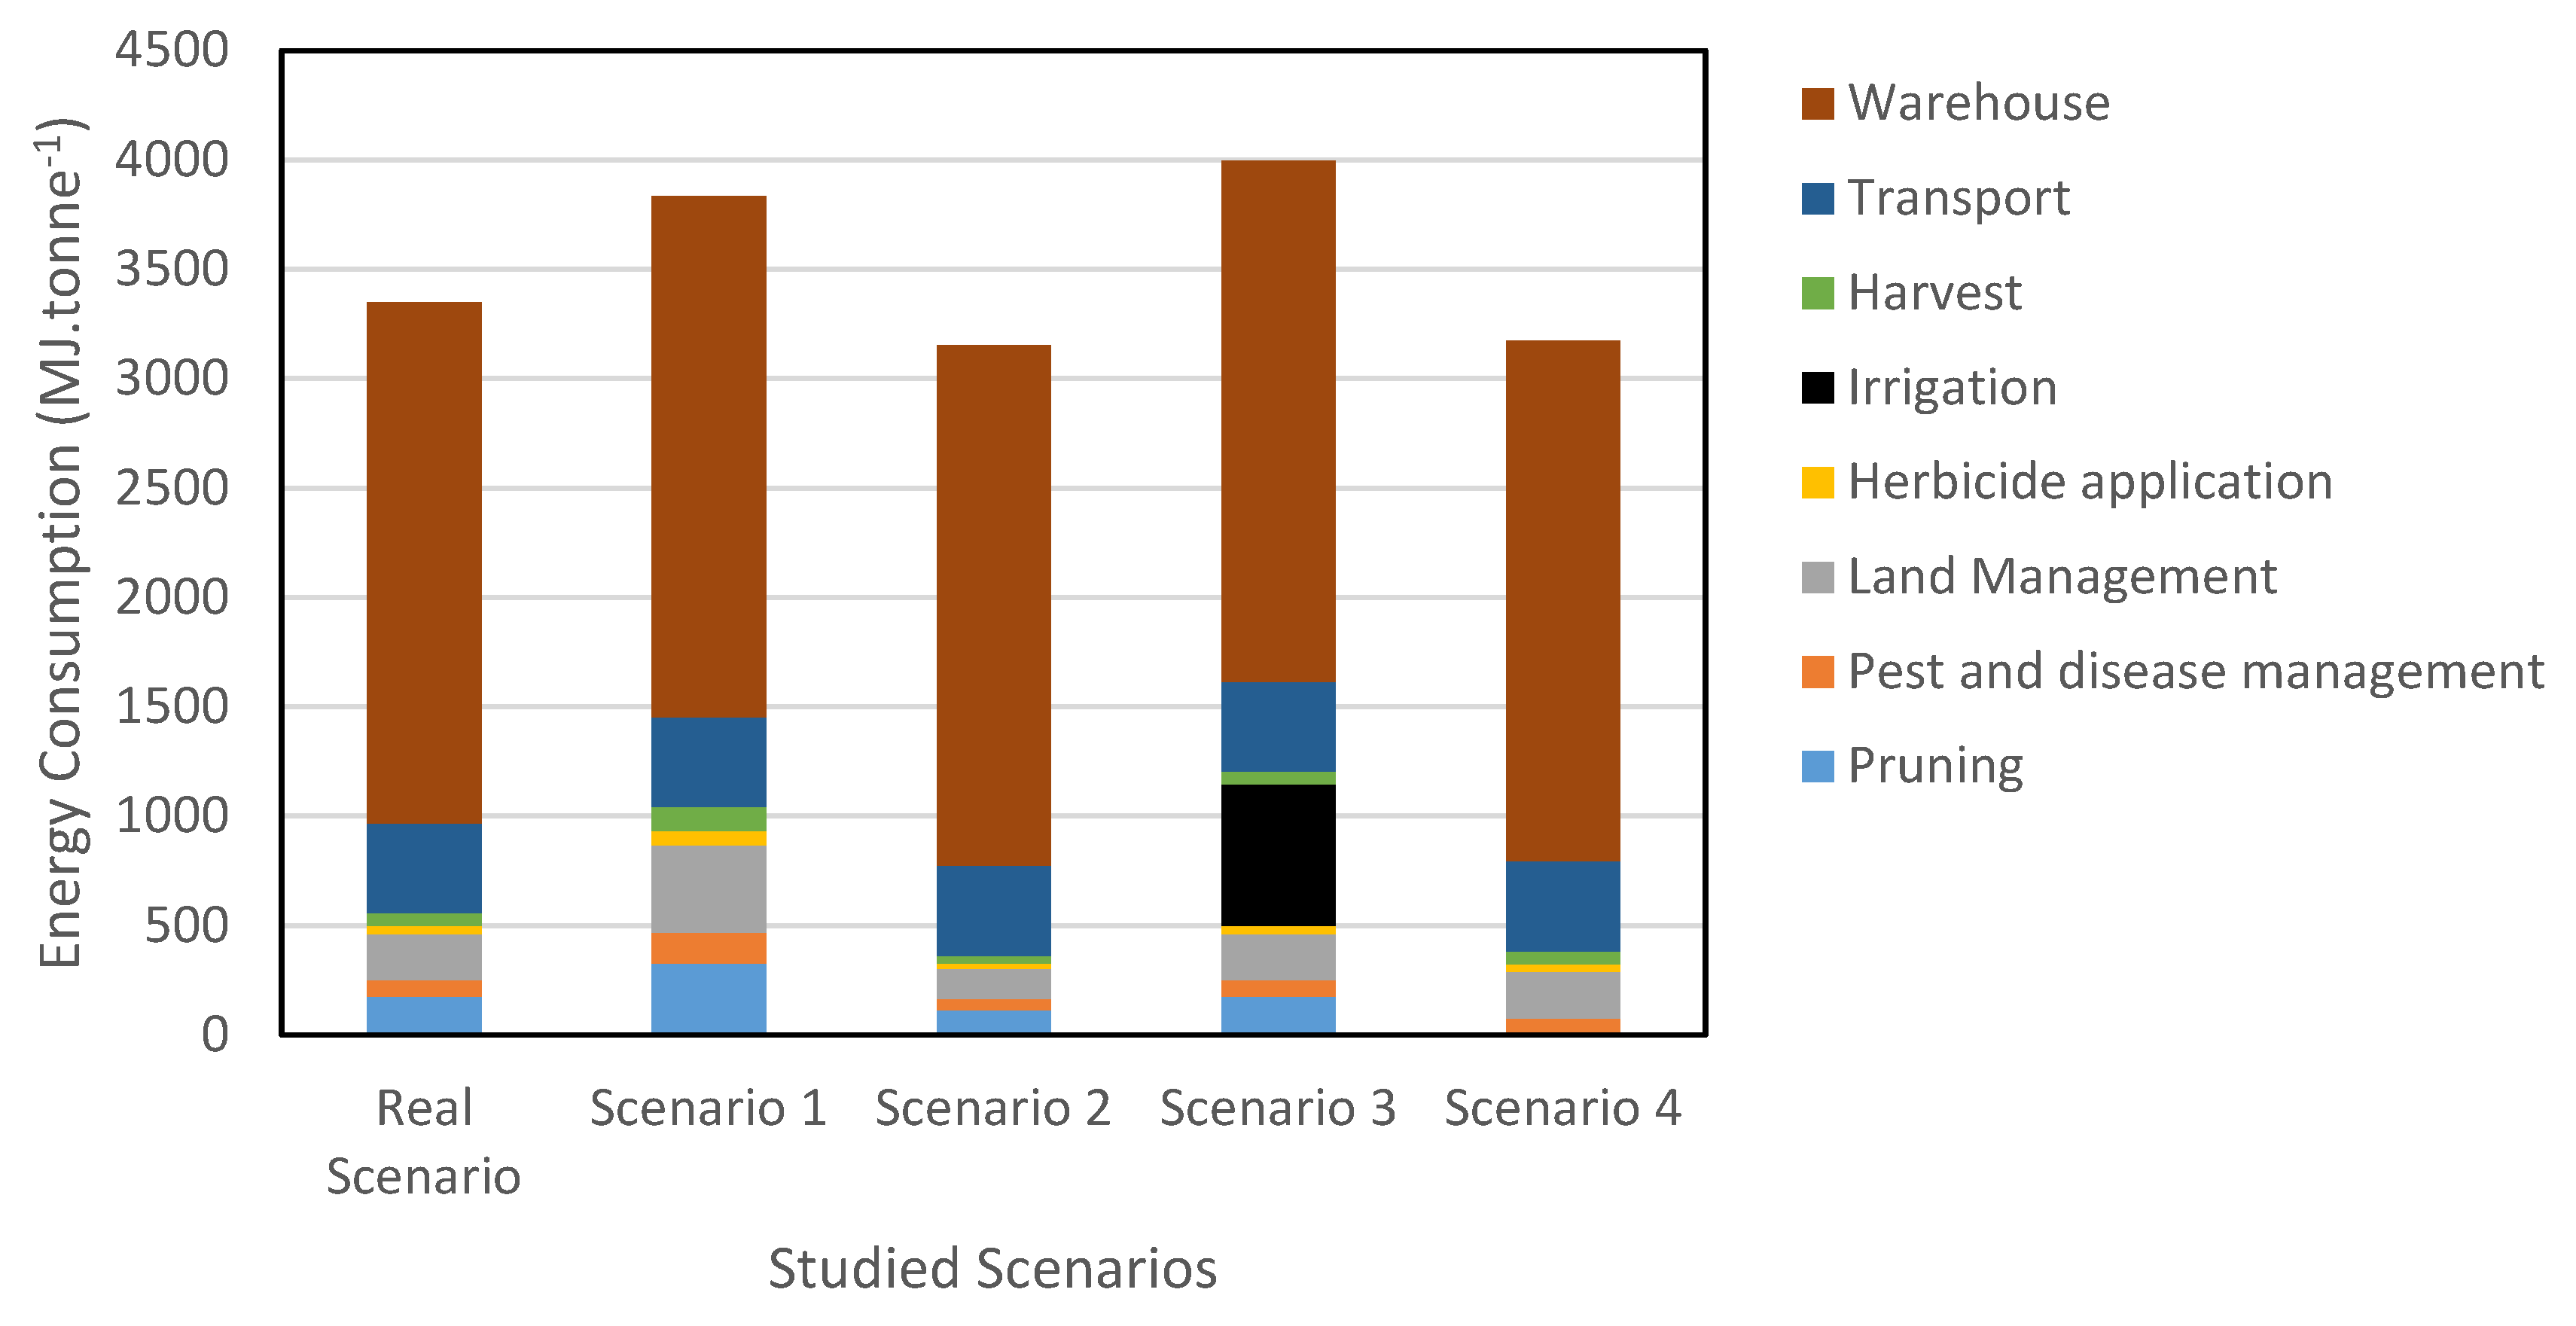
The energy requirements according to field technique are shown in
Figure 3, using a defined plantation area the values reflect the energy consumed to produce 1 peach ton (MJ·tonne
−1). In order to analyze the obtained production yield, a based-mass functional unit reveals representative values, highlighting the energy consumption variation between low and high production scenarios. Having a lower production, energy consumption is higher, while in high production scenario, power consumption is lower (
Figure 3). In accordance with Hemmati et al. [
13], energy ratio can vary, either because the harvest yield increases, or energy input consumption reduces.
To evaluate energy consumption inherent to
Beira Interior region, peach cultivation,
Quinta dos Lamaçais real production was considered, which averages 15 tonne·ha
−1 (for a real scenario), a low production scenario is 8 tonne·ha
−1 and a high production scenario is 23 tonne·ha
−1 (
Table 5).
Regarding energy consumption, for the real scenario is 50.21 GJ·ha−1, while for low production scenario the value is 30.67 GJ·ha−1. The high production scenario shows an energy consumption of 72.55 GJ·ha−1, which provides greater profitability, because the production per hectare is superior.
As diesel consumption is the main responsible for the machinery energy consumption [
18],
Figure 4 shows the fuel consumption comparison between several studies and data obtained from
Quinta dos Lamaçais during production. Royan et al. [
1] performed an energy analysis for peach production in Iran, in which was obtained a fuel consumption of 175 L·ha
−1, corresponding to 9.88 GJ·ha
−1. In turn, Ghatrehsamani et al. [
25] determined a fuel consumption of 74.7 L·ha
−1, equivalent to 4.21 GJ·ha
−1 in the province of Bakhitari, in Iran. Thus, the variations of energy consumption do not only depend on the age of the orchard, but also on other variables, in particular, fruit type, geographical location, climatic conditions, irrigation system, phytosanitary treatments application, as well as, pest and disease incidence and control optimization [
23]. As provided by Keyes et al. [
22], fuel consumption is higher in the apple cultivation, especially during pruning and harvest operations, because hydra-ladders are required. Fuel consumption for post-harvest period is not compared, as it depends on several factors with high variability, including speed and distance traveled.
Concerning peach cultivation, fuel consumption, 175.24 kg·ha−1, does not vary significantly across all studies observed, consequently values obtained at Quinta dos Lamaçais were expected regarding the fuel consumption per hectare.
5. Conclusions
Here, Beira Interior (Portugal) region peach cultivation, production and post-harvest processes, main impacts were identified. The ELCA results are presented as energy efficiency, in order to be used as a tool for improvement.
Based on energy evaluation, the energy consumption per hectare, during the production processes, is the same regardless the production level. Considering the operations carried out at the orchard, the grass groundcover maintenance is the highest energy consumption procedure, followed by pruning, pesticide treatment, and finally, herbicide application. For the post-harvest period, the warehouse had the highest energy consumption, mainly due to cooling fruits in refrigeration chambers for conservation. Transportation can also be quantified for its energy consumption, because of the high distance traveled between warehouse and retailer.
In order to carry out a sensitivity analysis of the main system, alternative scenarios were outlined. Considering the results obtained, it is also possible to verify that when comparing the real scenario with the low and high production scenarios, an energy difference of 19.54 GJ·ha−1 and 22.34 GJ·ha−1 was verified, respectively. In addition to the low and high production scenarios, a test case scenario was also included in which there was used a pumping irrigation system in the orchard to evaluate the increase of energy consumption. In view of this situation, it was noted that the energy consumption with the usage of irrigation pumps had an increase of 9.72 GJ·ha−1. Finally, another test case scenario was considered aiming the energy consumption reduction during pruning. This operation is performed with pneumatic shears, which entails the constant operation of the tractor. One way to reduce energy consumption is to replace the current method by electric shears connected with a portable battery. This replacement achieved a reduction of 2.61 GJ·ha−1.


 ,
, 


