Municipal Solid Waste Management from the Experience of São Leopoldo/Brazil and Zurich/Switzerland


Abstract
:1. Introduction
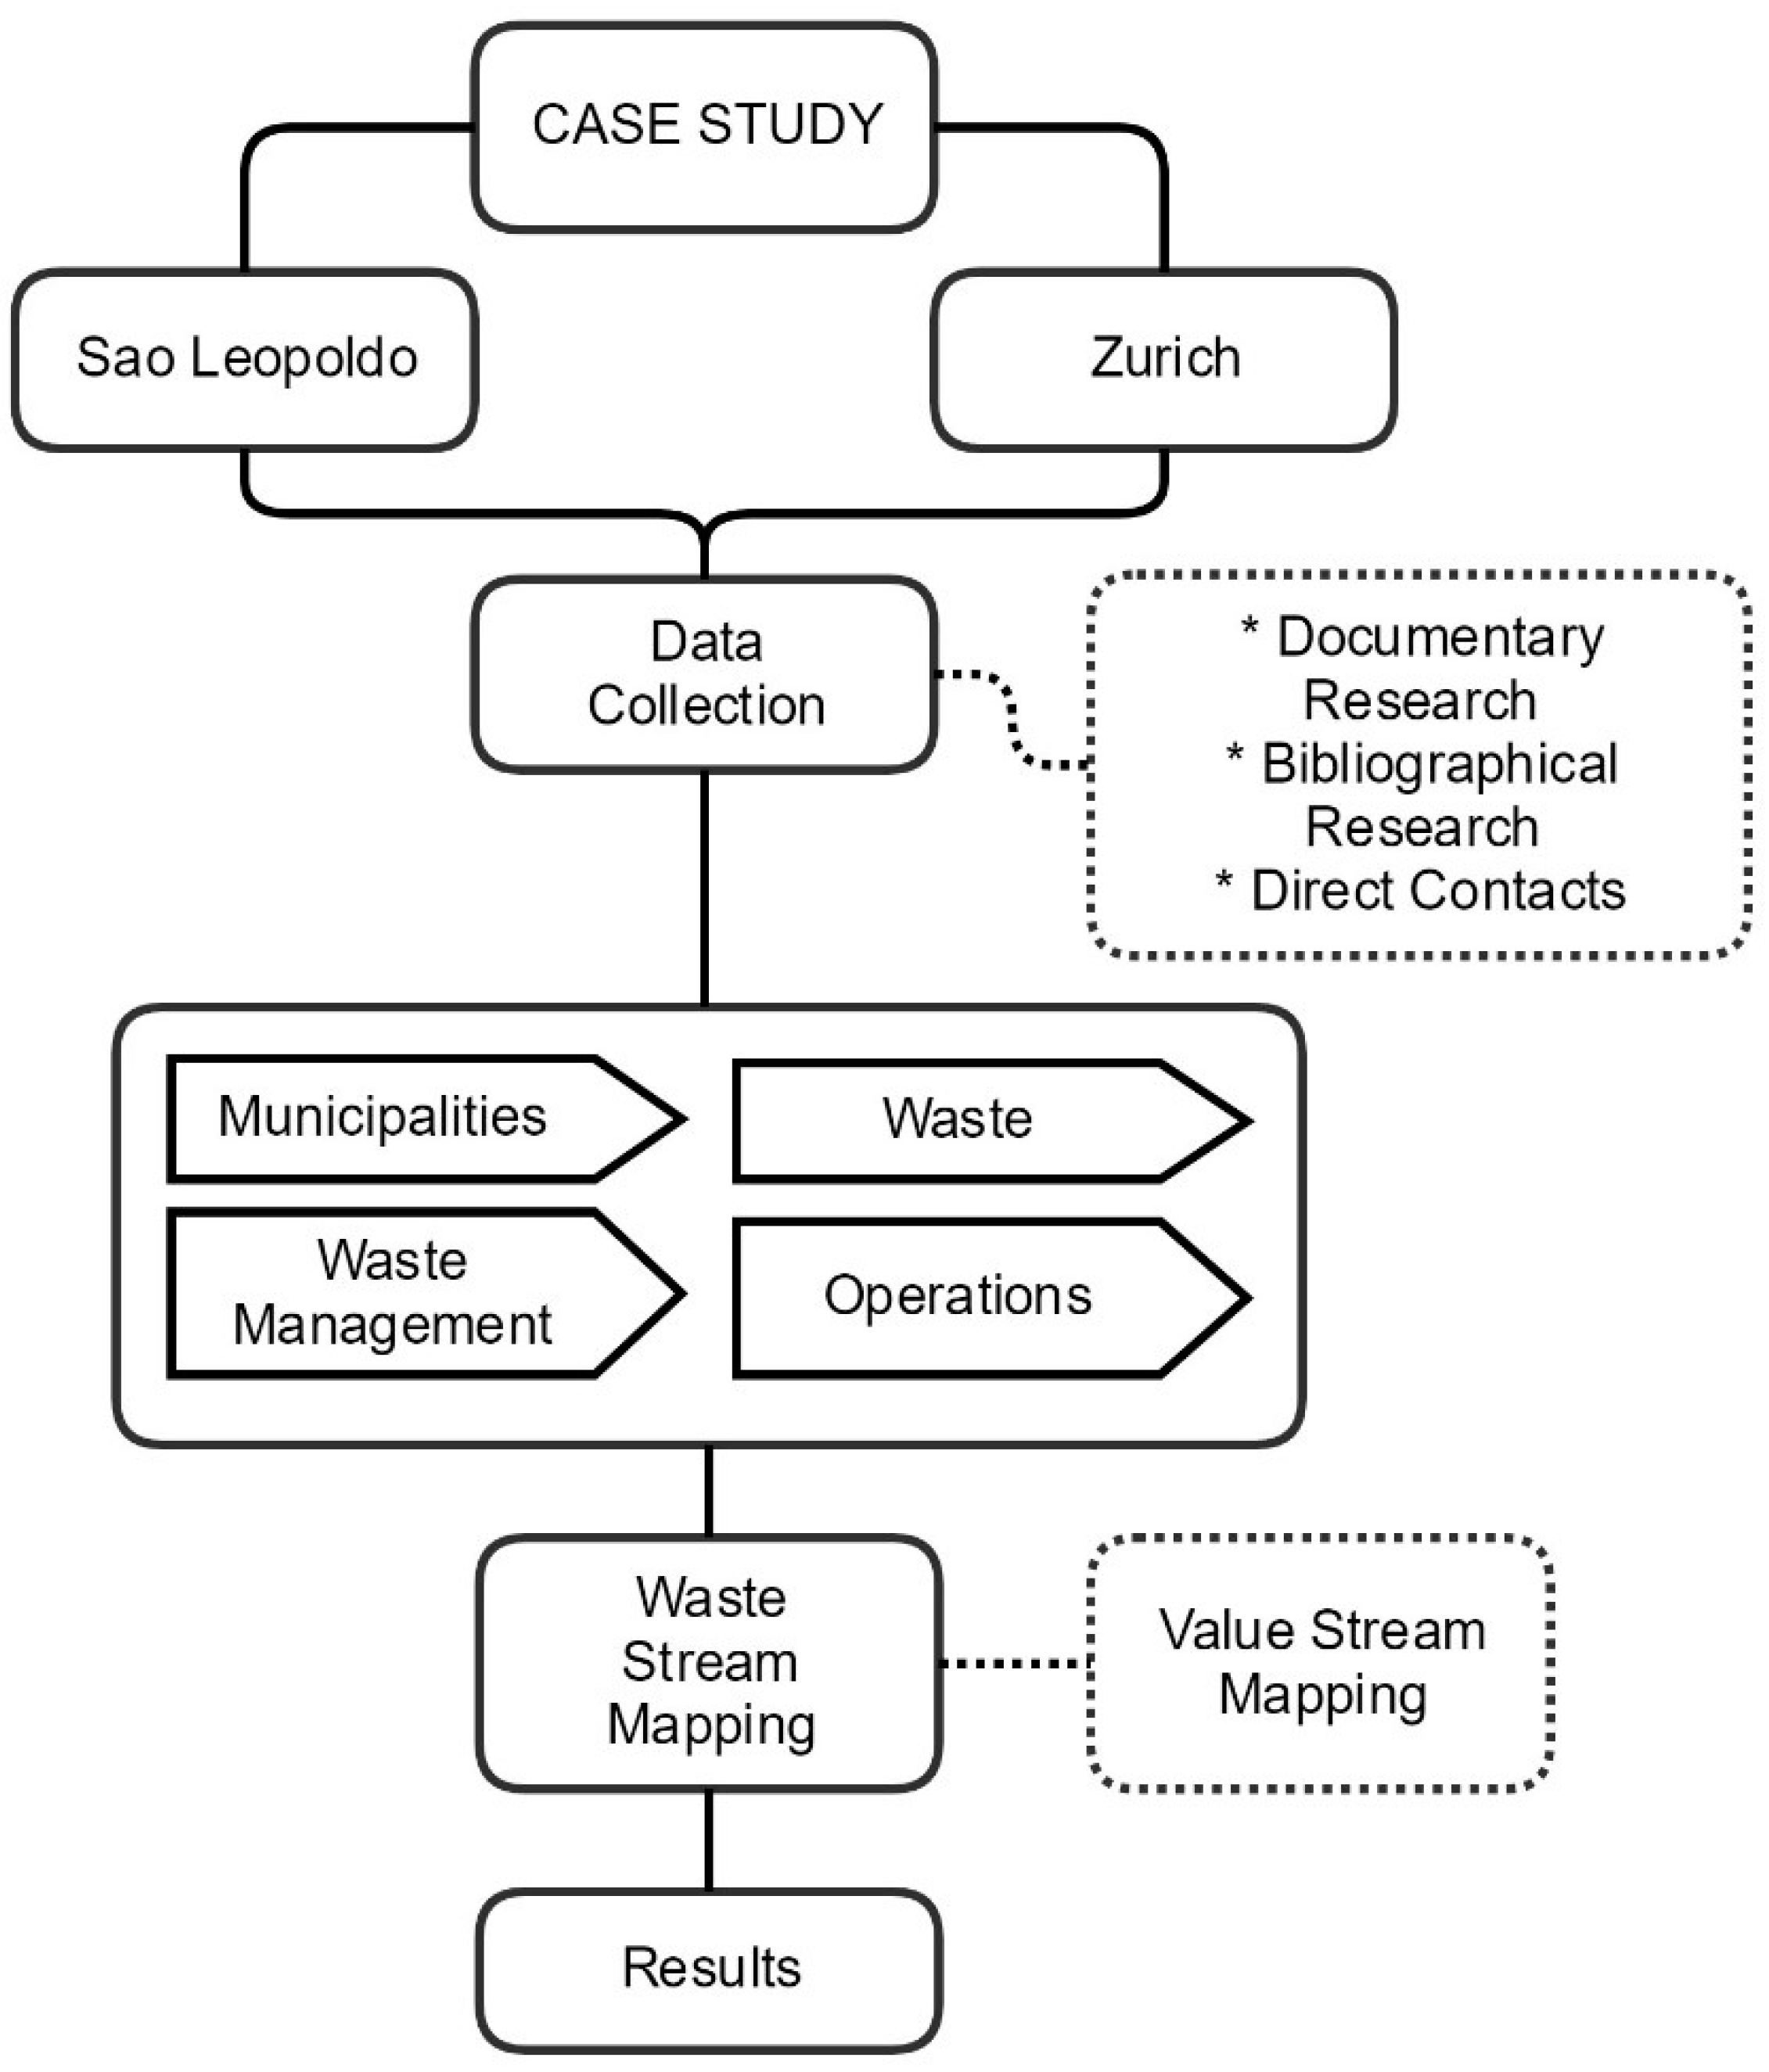
2. Materials and Methods
3. Results and Discussion
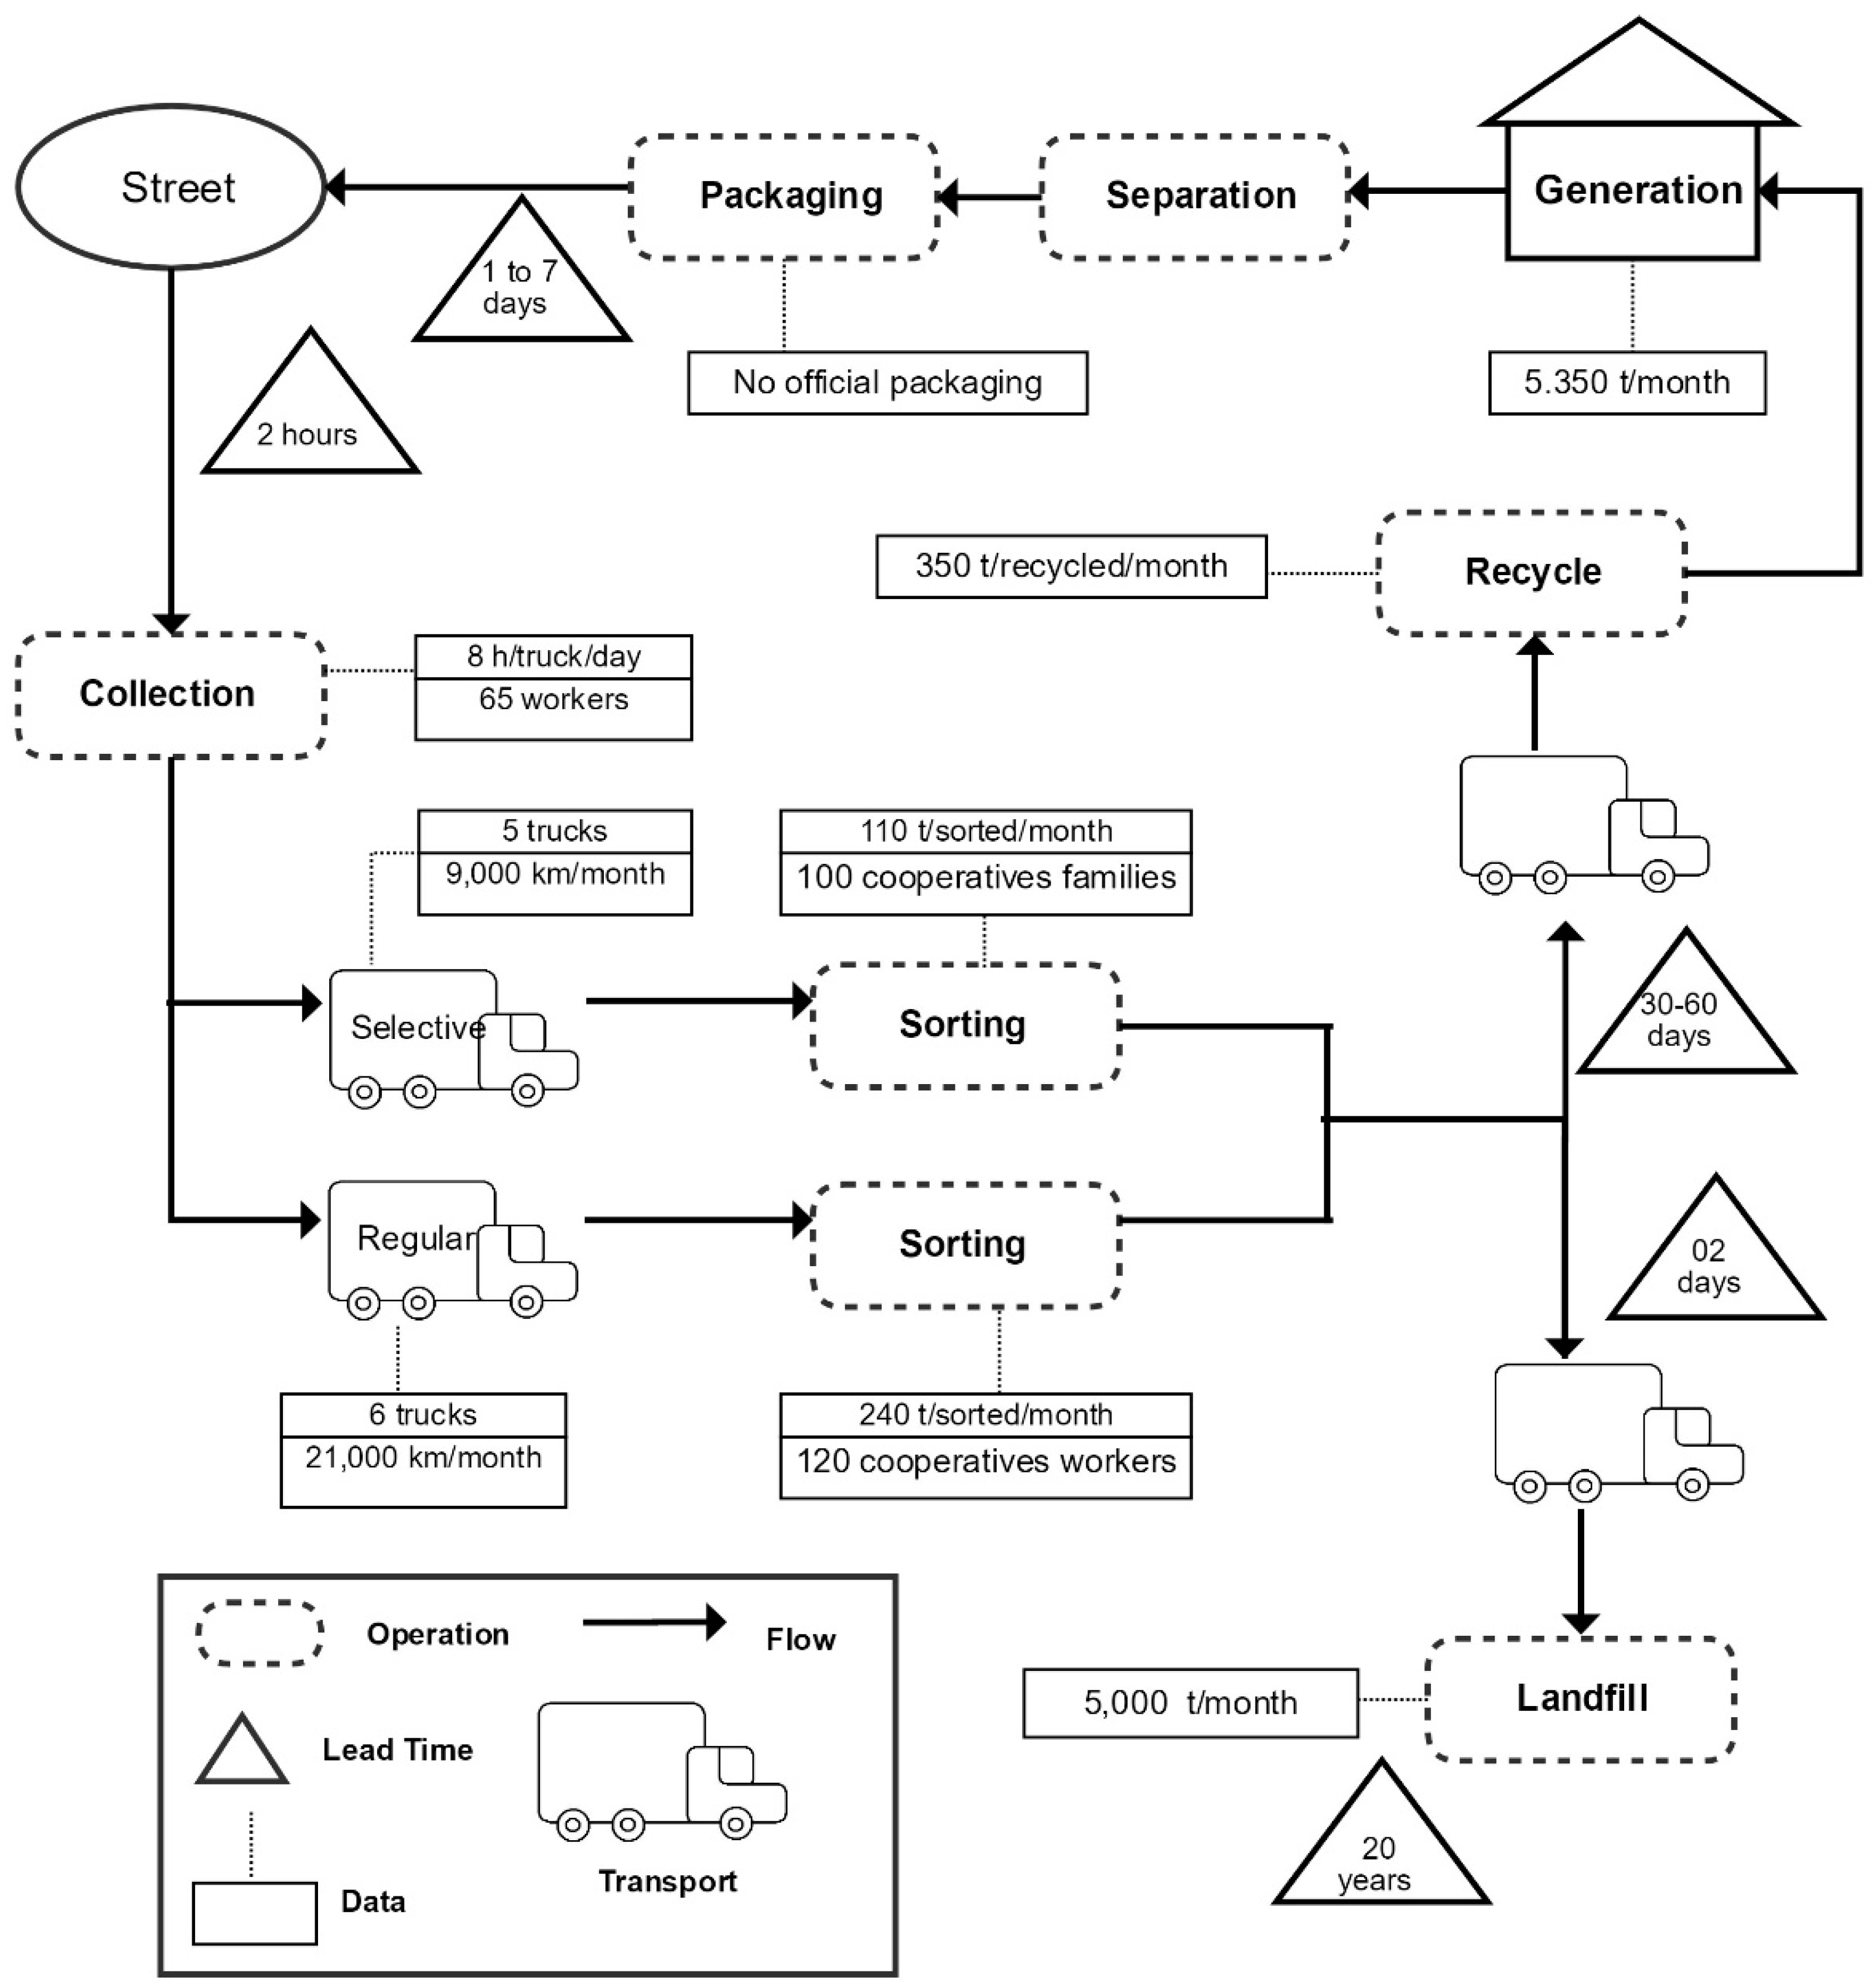
3.1. City of São Leopoldo
Waste Stream Mapping
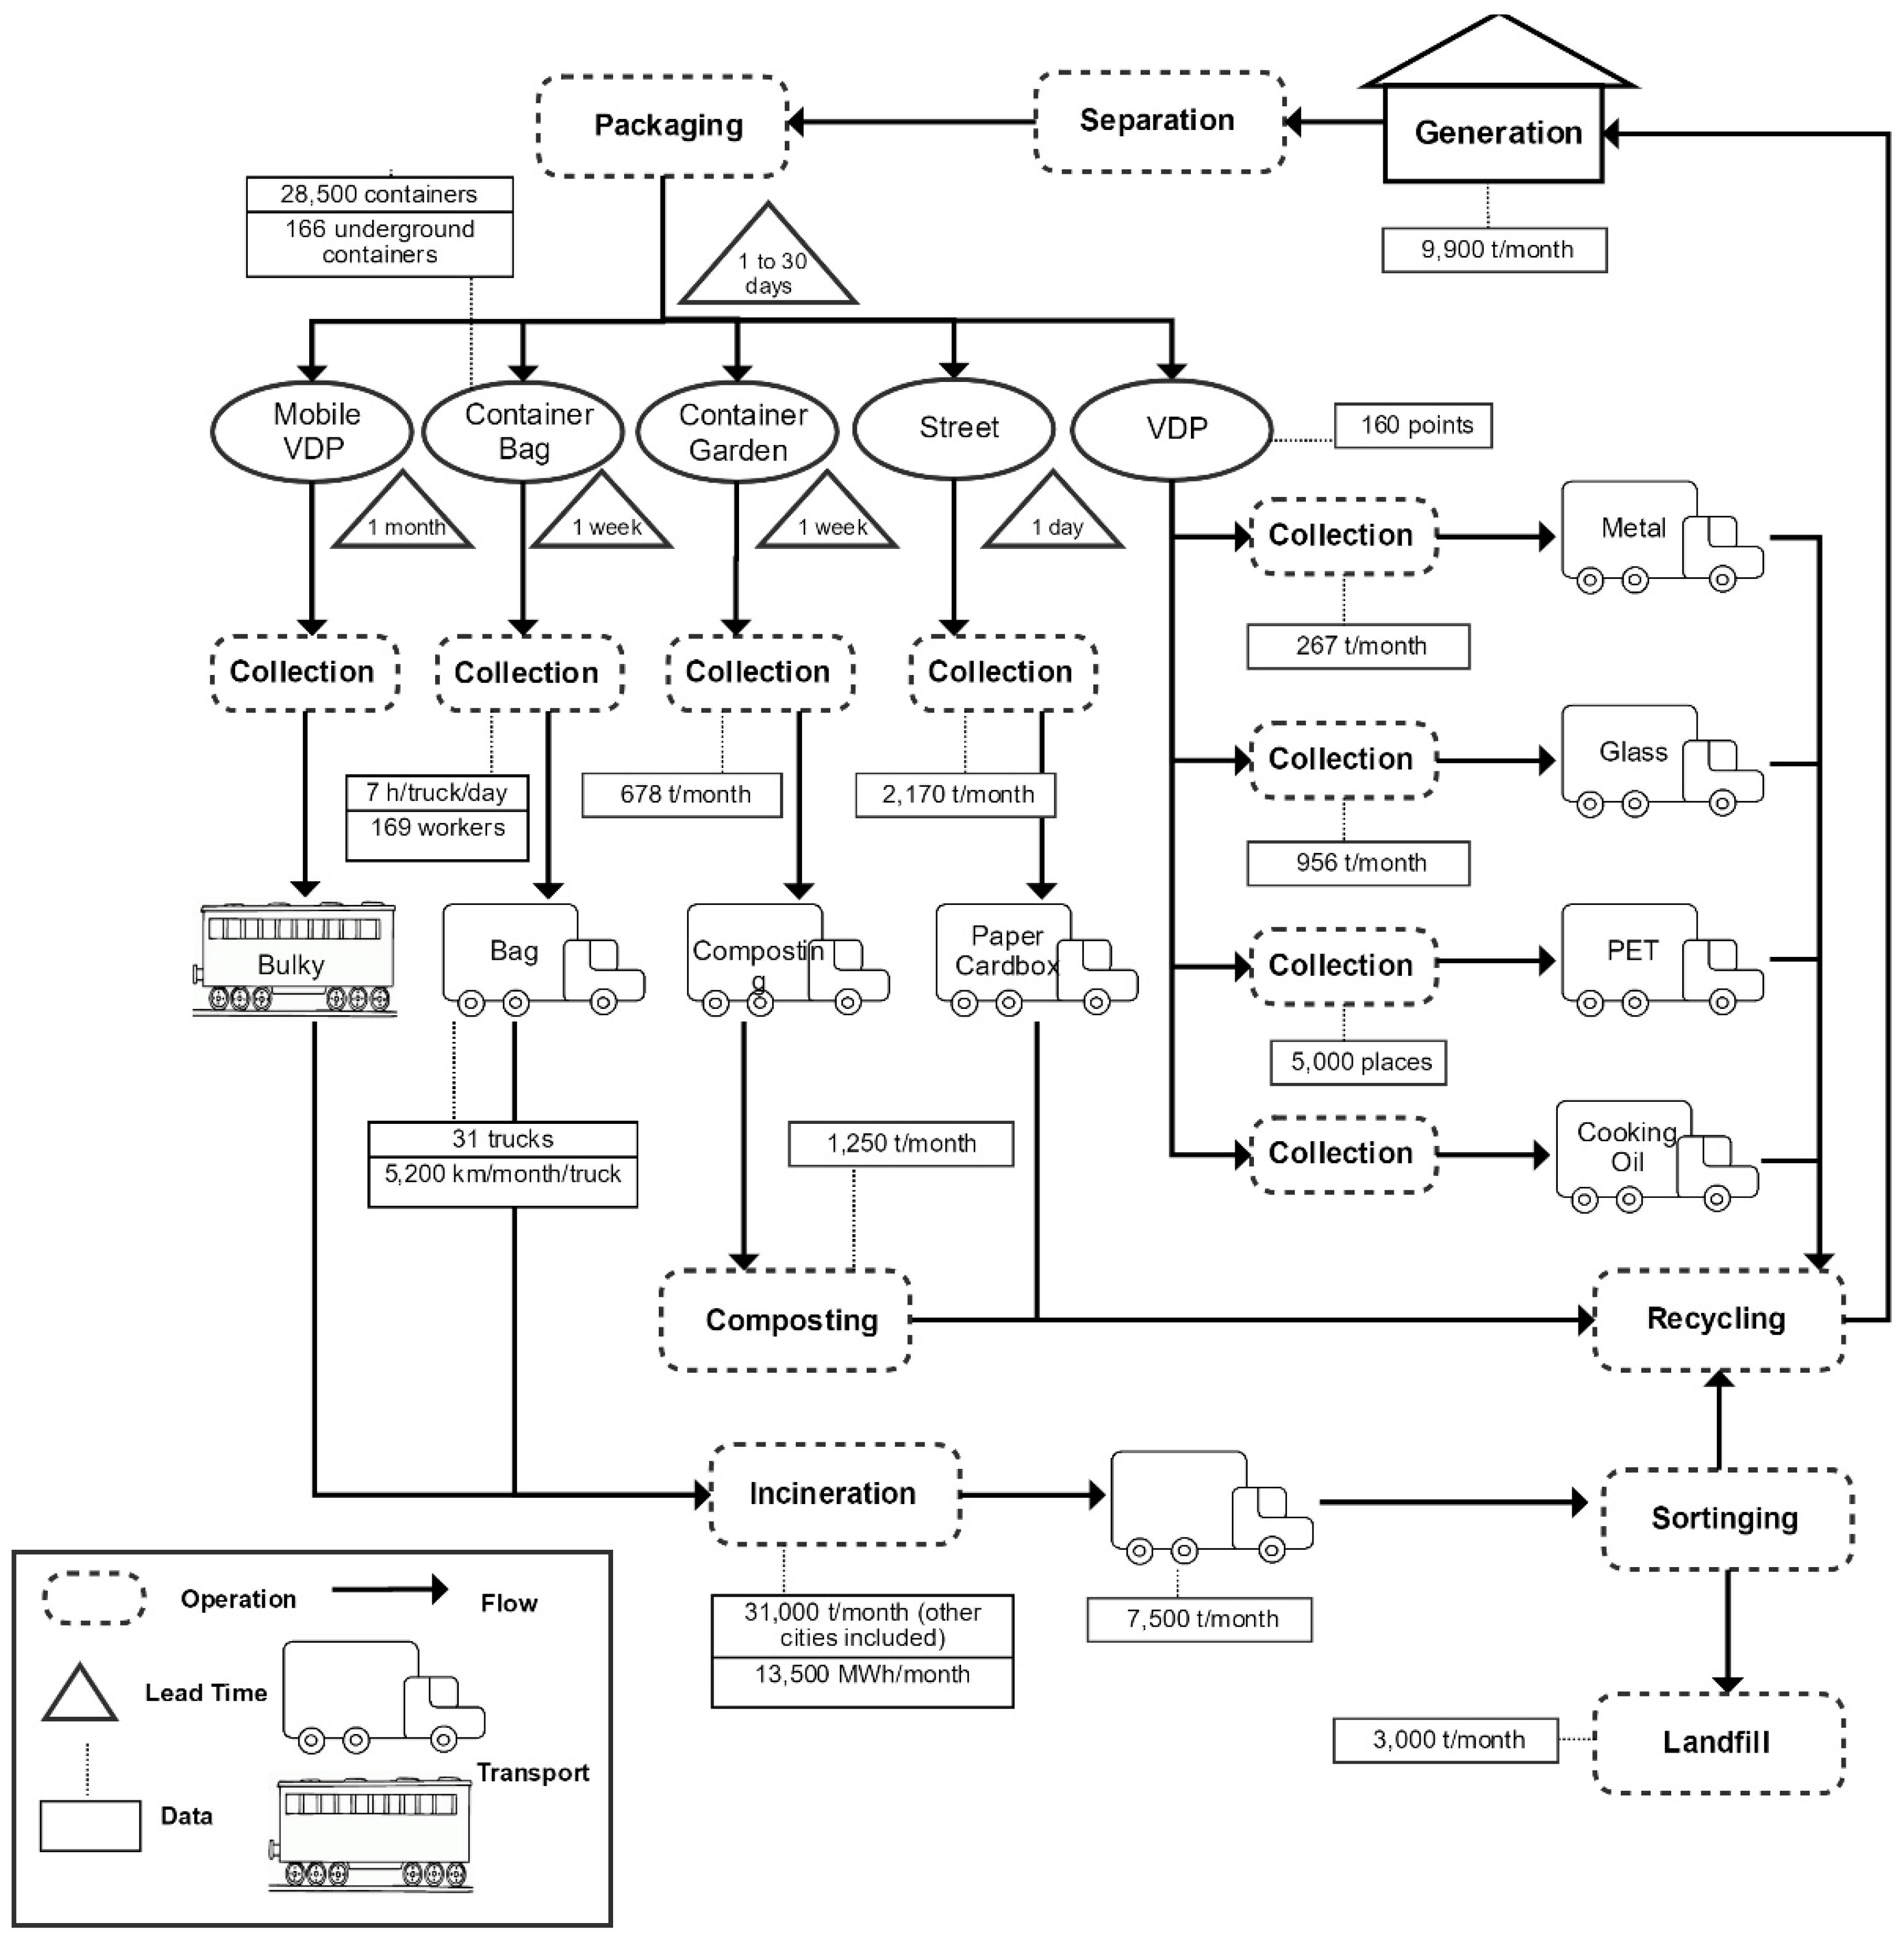
3.2. City of Zurich
Waste Stream Mapping of Zurich
3.3. Comparison between the Management of the Systems of São Leopoldo and Zurich
4. Conclusions
Author Contributions
Funding
Acknowledgments
Conflicts of Interest
References
- Guerrero, L.A.; Maas, G.; Hogland, W. Solid Waste Management Challenges for Cities in Developing Countries. Waste Manag. Res. 2013, 33, 220–232. Available online: https://0-www-ncbi-nlm-nih-gov.brum.beds.ac.uk/pubmed/23098815 (accessed on 7 September 2018). [CrossRef] [PubMed]
- Patel, M.L.; Jain, R.; Saxena, A. Assessment of Municipal Solid Waste and Status of Implementation of Municipal Solid Waste (Management and Handling), Rules, 2000 in the State of Madhya Pradash, 2008—A Case Study. Waste Manag. Res. 2010, 29, 558–562. Available online: https://www.researchgate.net/publication/44683217_Assessment_of_the_Municipal_Solid_Waste_Status_of_Implementation_of_Municipal_Solid_Waste_Management_Handling_Rules_2000_in_the_State_of_Madhya_Pradesh_2008_-_A_case_study (accessed on 1 February 2012). [CrossRef] [PubMed]
- Brazilian Federal Law No. 11445/2007: Establishes National Guidelines for Sanitation and Other Measures. Available online: www.legislacao.planalto.gov.br/legisla/legislacao.nsf/viw_identificacao/lei%2011.445-2007?opendocument (accessed on 3 August 2011).
- Brazilian Federal Law No. 12305/2010: Established the National Solid Waste Politic. 2010. Available online: www.planalto.gov.br/ccivil_03/_ato2007-2010/2010/lei/l12305.htm (accessed on 5 September 2010).
- Mannarino, C.F.; Ferreira, J.A.; Gandolla, M. Contribution to the Development of Municipal Solid Waste Management in Brazil Based on European Experience. Sanit. Environ. Eng. 2016, 21, 379–385. Available online: http://www.scielo.br/scielo.php?script=sci_arttext&pid=S1413-41522016000200379 (accessed on 12 September 2018). [CrossRef]
- Abrelpe. Overview of Solid Waste in Brazil. Available online: http://abrelpe.org.br/panorama/ (accessed on 18 September 2018).
- United Nations Human Settlement Program. Solid Waste in the World’s Cities: Water and Sanitation in the World’s Cities, 1st ed.; Earthscan: Washington, DC, USA, 2010; p. 15. ISBN 978-1-84971-170-8. [Google Scholar]
- Grimberg, E.; Blauth, P. Selective Collection: Recycling materials, recycling values. Polis 1998, 31, 131. [Google Scholar]
- Macedo, A.P. Municipal Solid Waste Management: A Performance Evaluation of Collection and Transportation in the Cities of Recife, Olinda and Jaboatão dos Guararapes. Master’s Thesis, University Federal de Pernambuco, Recife, Brazil, 2003. [Google Scholar]
- Phillipi, A., Jr.; Aguiar, A.O. Sanitation, Health and Environment: Foundations for Sustainable Development, 2nd ed.; Manoele: Sao Paulo, Brazil, 2005; p. 41. ISBN 85-204-2188-1. [Google Scholar]
- Rother, M.; Shook, J. Learning to See—Value Stream Mapping to Add Value and Eliminate Muda, 1st ed.; Lean Enterprise Institute: Cambridge, MA, USA, 1998; ISBN-13 9780966784305. [Google Scholar]
- Brazilian Statistic and Geography Institute. Sao Leopoldo National Household Survey. Available online: www.ibge.gov.br/estatisticas-novoportal/por-cidade-estado-estatisticas.html?t=destaques&c=4318705 (accessed on 12 June 2010).
- De Moura, F.C. Contribution to the Solid Waste Management from Sao Leopoldo-RS. Master’s Thesis, University do Vale dos Sinos University, Sao Leopoldo, Brazil, 2010. [Google Scholar]
- SELIMP; Municipal Public Cleaning Office, São Leopoldo, Rio Grande do Sul, Brazil. Personal communication. 2011.
- Sao Leopoldo Municipal Decree No. 6276/2010: Provides about Collecting Waste Operational Plan, Articles 273, 280, 290, 291, 292, 293, 294 and 295 of the Municipal Environment Code and Others Provisions. Available online: https://leismunicipais.com.br/a1/rs/s/sao-leopoldo/decreto/2009/627/6276/decreto-n-6276-2009-dispoe-sobre-o-plano-operacional-de-coleta-de-lixo-domiciliar-e-seletiva-que-tratam-os-artigos-273-280-290-291-292-293-294-e-295-do-codigo-municipal-de-meio-ambiente-e-da-outras-providencias (accessed on 3 August 2011).
- Banco Central Do Brasil. Brazil Center Bank Exchange Rates. Available online: www4.bcb.gov.br/pec/conversao/conversao.asp (accessed on 3 August 2017).
- Stadt Zürich. State of Zurich—Population. Available online: www.stadt-zuerich.ch/prd/de/index/statistik/themen/bevoelkerung.html (accessed on 11 November 2011).
- Stadt Zürich. State of Zurich—Annual Report. Available online: www.stadt-zuerich.ch/prd/de/index/statistik/publikationen-angebote/publikationen/Jahrbuch/statistisches-jahrbuch-der-stadt-zuerich_2017/JB_2017_kapitel-07.html (accessed on 11 November 2011).
- Department of Recycling and Disposal—ERZ. Personal Communication, Waste Department of Zurich: Zurich, Switzerland, 2011.
- SNIS. Diagnosis of Brazilian Urban Solid Waste Management. 2015. Available online: http://www.snis.gov.br/diagnostico-residuos-solidos/diagnostico-rs-2015 (accessed on 8 August 2017).
- Mengue, D.M.; Trentin, A.W.S.; Rodriguez, A.L.; Lopez, D.A.R.; Wermuth, T.B. Diagnosis and Life Cycle Assessment of Integrated Municipal Solid Waste Management of the Municipality of Tres Cachoeiras—RS. Technological 2015, 19, 69–77. Available online: https://online.unisc.br/seer/index.php/tecnologica/article/view/5815 (accessed on 15 September 2018). [CrossRef]
- Weng, Y.; Fujiwara, T.; Houng, H.J.; Sun, C.; Li, W. Management of Landfill Reclamation with Regard to Biodiversity Preservation, Global Warming Mitigation and Landfill Mining: Experiences from the Asia—Pacific Region. J. Clean. Prod. 2015, 104, 364–373. Available online: https://0-okayama-pure-elsevier-com.brum.beds.ac.uk/en/publications/management-of-landfill-reclamation-with-regard-to-biodiversity-pr (accessed on 15 September 2018). [CrossRef]
- Wang, J.; Maier, S.D.; Horn, R.; Holländer, R.; Aschmann, R. Development of an Ex-Ante Sustainability Assessment Methodology for Municipal Solid Waste Management Innovations. Sustainability 2018, 10, 3208. Available online: https://0-www-mdpi-com.brum.beds.ac.uk/2071-1050/10/9/3208 (accessed on 15 September 2018). [CrossRef]
- Herva, M.; Neto, B.; Roca, E. Environmental Assessment of the Integrated Municipal Solid Waste Management System in Porto (Portugal). J. Clean. Prod. 2014, 70, 183–193. Available online: https://0-www-sciencedirect-com.brum.beds.ac.uk/science/article/pii/S0959652614001486?via%3Dihub (accessed on 16 September 2018). [CrossRef]
- Yay, A.S.E. Application of Life Cycle Assessment (LCA) for Municipal Solid Waste Management: A Case Study of Sakarya. J. Clean. Prod. 2015, 94, 284–293. Available online: https://0-www-sciencedirect-com.brum.beds.ac.uk/science/article/pii/S095965261500102X (accessed on 16 September 2018). [CrossRef]
- Martinez-Sanchez, V.; Levis, J.W.; Damgaard, A.; DeCarolis, J.F.; Barlaz, M.A.; Astrup, T.F. Evaluation of Externality Costs in Life-Cycle Optimization of Municipal Solid Waste Management Systems. Environ. Sci. Technol. 2017, 51, 3119–3127. Available online: https://0-www-ncbi-nlm-nih-gov.brum.beds.ac.uk/pubmed/28263562 (accessed on 17 September 2018). [CrossRef] [PubMed] [Green Version]
- Peltola, T.; Aarikka-Stenroos, L.; Viana, E.; Mäkinen, S. Value Capture in Business Ecosystems for Municipal Solid Waste Management: Comparison between Two Local Environments. J. Clean. Prod. 2016, 137, 1270–1279. Available online: https://0-www-sciencedirect-com.brum.beds.ac.uk/science/article/pii/S0959652616310642 (accessed on 17 September 2018). [CrossRef]


| Collection A (Recyclable) | Collection B (Putrescible Organic and Non-Recyclable) | Collection C (Informal) |
|---|---|---|
| Sorting | Sorting | Sorting |
| Recycling | Recycling | Recycling |
| Landfill of residues | Landfill of residues | Inappropriate disposal |
| Collection A (Container) | Collection B (Voluntary Delivery Points) | Collection C (Door-to-Door) | |||
|---|---|---|---|---|---|
| Waste category | Pruning and garden waste | Official bags waste—“Züri-Sacke” | Recyclable waste | Residues | Paper, cardboard, textile |
| Processing | Recycling | Incineration | Recycling | Incineration | Recycling |
| Characteristics | São Leopoldo | Zurich |
|---|---|---|
| Establishment | 1824 | 5th Century |
| Inhabitants | 214.087 | 384.271 |
| Area | 102.74 km² | 91.88 km² |
| Inhab/area | 2.084 inhab/km² | 4.182 inhab/km² |
| GDP | US$1.7 bi/2008 | US$52 bi/2008 |
| Urban Waste | 5350 tonnes/month | 9900 tonnes/month |
| Waste/inhab | 0.84 kg/inhab | 0.86 kg/inhab |
| Responsible for the management | SELIMP | ERZ |
| Outsourcing of services | Yes (paid) | Yes (unpaid) |
| Contract’s validity | 20 years | 1 year |
| Collaborators | 220 (170 outsourced and 50 from the municipality) | 510 (municipality) |
| Directive plan for wastes | No | Yes |
| Packaging | Undefined packaging | Standard packing required |
| Collection | Door-to-door | Door-to-door voluntary delivery container system |
| Collection shift | Day and night | Day |
| Vehicles | Compactor trucks and dump trucks | Compactor trucks (mechanical collection) and Hoist |
| Recycled waste | 350 tonnes/month | 4643 tonnes/month (composting, paper, metal, glass) |
| Treatments | Sorting Recycling | Incineration Recycling Composting |
| Final disposal | Sanitary landfill | Inert landfill |
| Landfilled waste | 5000 tonnes/month | 3000 tonnes/month (included other cities) |
| Recovered energy | No | 13,500 MWh/month |
| Waste social program | Yes | No |
| Commercialization of services | No | Yes |
| Sweeping of streets | Manual | Mechanical |
| São Leopoldo | Zurich | |
|---|---|---|
| Revenues (US$) | 1,895,192.31 | 161,266,112.16 |
| Expenditures (US$) | 4,128,205.13 | 130,113,601.24 |
| Reserve for 2011/2012 (US$) | Not determined | 12,107,216.50 to 2011 |
| Negative balance (US$) | 2,233,012.82 | Zero |
© 2018 by the authors. Licensee MDPI, Basel, Switzerland. This article is an open access article distributed under the terms and conditions of the Creative Commons Attribution (CC BY) license (http://creativecommons.org/licenses/by/4.0/).
Share and Cite
Ghesla, P.L.; Gomes, L.P.; Caetano, M.O.; Miranda, L.A.S.; Dai-Prá, L.B. Municipal Solid Waste Management from the Experience of São Leopoldo/Brazil and Zurich/Switzerland. Sustainability 2018, 10, 3716. https://0-doi-org.brum.beds.ac.uk/10.3390/su10103716
Ghesla PL, Gomes LP, Caetano MO, Miranda LAS, Dai-Prá LB. Municipal Solid Waste Management from the Experience of São Leopoldo/Brazil and Zurich/Switzerland. Sustainability. 2018; 10(10):3716. https://0-doi-org.brum.beds.ac.uk/10.3390/su10103716
Chicago/Turabian StyleGhesla, Pamela L., Luciana P. Gomes, Marcelo O. Caetano, Luis A. S. Miranda, and Léa B. Dai-Prá. 2018. "Municipal Solid Waste Management from the Experience of São Leopoldo/Brazil and Zurich/Switzerland" Sustainability 10, no. 10: 3716. https://0-doi-org.brum.beds.ac.uk/10.3390/su10103716