Article

Environmental-Economic Analysis of Integrated Organic Waste and Wastewater Management Systems: A Case Study from Aarhus City (Denmark)

1
Department of Environmental Science, Aarhus University, Frederiksborgvej 399, DK-4000 Roskilde, Denmark
2
Centre for Environment and Agricultural Informatics, Cranfield University, College Rd, Wharley End, Bedford MK43 0AL, UK
*
Author to whom correspondence should be addressed.
Sustainability 2018, 10(10), 3742; https://0-doi-org.brum.beds.ac.uk/10.3390/su10103742
Submission received: 31 August 2018 / Revised: 1 October 2018 / Accepted: 11 October 2018 / Published: 17 October 2018
(This article belongs to the Special Issue The New Paradigm of Waste Management: Waste as Resources)

Abstract

:
This study presents a comparative analysis of the environmental and economic performances of four integrated waste and wastewater management scenarios in the city of Aarhus in Denmark. The purpose of this analysis is to deliver decision support regarding whether (i) the installation of food waste disposers in private homes (AS1) or (ii) separate collection and transport of organic waste to biogas plants is a more viable environmental and economic solution (AS2). Higher environmental benefits, e.g., mitigation of human health impacts and climate change, are obtained by transforming the existing waste combustion system into scenario (ii). Trade-offs in terms of increased marine eutrophication and terrestrial ecotoxicity result from moving up the waste hierarchy; i.e., from waste incineration to biogas production at wastewater treatment plants with anaerobic sludge digestion. Scenario (i) performs with lower energy efficiency compared to scenario (ii). Furthermore, when considering the uncertainty in the extra damage cost to the sewer system that may be associated to the installation of food waste disposers, scenario (ii) is the most flexible, robust, and less risky economic solution. From an economic, environmental, and resource efficiency point of view, separate collection and transport of biowaste to biogas plants is the most sustainable solution.

1. Introduction

The European Union has a long-term goal to reduce greenhouse gas (GHG) emissions by 80–95% in 2050 compared with 1990 [1] further underpinned by the Intergovernmental Panel on Climate Change (IPCC) stating a need for net –zero GHG emissions by 2050 [2]. Denmark also has a broad consensus of a transition of the energy system to be fully dependent on renewable energy (decoupled from fossil energy) in 2050. As the second largest city in Denmark, Aarhus Municipality has adopted a goal of becoming CO2 neutral by 2030 [3]. Wastewater treatment plants (WWTPs) may play a role in achieving this goal by implementing efficient wastewater treatment technologies applying innovative water, C, N, and P management strategies for combined biobased production and services, e.g., cleaning water and contributing to climate change mitigation [4]. In this way, WWTPs may contribute to a circular resource management system for biobased production re-entering the economic system.
Denmark has a long tradition for collecting mixed household waste by trucks and transporting it to waste incineration plants for energy production [5]. However, the Resource Action Plan for Waste Management suggests diverting organic waste away from incineration towards combined biogas and fertilizer production [3].
While Aarhus city has a very innovative separate collection system for the inorganic dry waste fractions, the city has no separate collection of organic household waste. Historical experience with the separate collection of organic waste has not been successful, which has led to low confidence in a separate waste collection system by the citizens of Aarhus city. For this reason, implementation of food waste disposers (FWDs) in private households could be a plausible management strategy and instrument for increasing the recovery and recycling of phosphorous while producing biogas for increased electricity production. An alternative to the FWD is presented in terms of separate collection and transportation of organic household waste by truck to the WWTPs where the organic household waste is pre-treated by biopulp production [6] prior to use as an ingestate for the biogas tank. Both scenarios result in increased recycling of P to the agricultural sector.
FWDs have a long history in the Germany, the United States, Australia, and New Zealand. During the last 20 years, Norway and Sweden have installed FWDs in urban areas as well [7]. Studies on the implementation of FWDs concludes that an increase in the influent chemical oxygen demand of 12 to 25% will not impact the operational performance of WWTPs significantly [7]. For drainage systems with long retention times, there is an increased hydrogen sulphide formation. However, existing technology may eliminate such risks [7,8,9,10].
A Swedish study found that 90 degrees bends in sewer systems represents hotspot locations in respect to the risk of clogging, beyond which no need for increased pumping power is needed [11]. In this regard, Aarhus city is an old city with old buildings and the design of the collective sewer system is not optimal for receiving increased organic matter loads in all places. Therefore, careful evaluations need to be performed to weigh the potential negative impact and benefits of implementation of FWDs compared with alternative solutions.
Lowered quality of the effluent wastewater, i.e., increased nutrient load and concentration of hazardous compounds, from integrated waste and wastewater treatment plants, is not accepted by the Aarhus Municipality. To mitigate such consequences, WWTPs have implemented specialized technologies for increased nitrogen and phosphorous removal [4], expected to counterbalance a minor increase in the influent, and therefore effluent, N and P. The organic matter content is expected to result in an increased biogas production. Lastly, regarding the presence of micro pollutants, food waste is not expected to increase such a challenge.
The energetic and environmental benefits relative to the best use of energy contained in organic waste depend on which energy sources are used to produce electricity and heating. Therefore, the energetic efficiency of organic waste treatment at WWTPs is compared to the existing solution of municipal waste incineration at the waste to energy (WtE) plant, “AffaldVarme Aarhus”. There are significant differences between electricity and heat production, which is crucial from the environmental point of view because the increased electricity production from biogas displaces a greater amount of emissions from fossil energy production compared to combined heat and electricity production from waste incineration. Furthermore, WWTPs may represent a relevant actor because they may contribute to circular resource management for biobased production and avoid loss of phosphorus resources resulting from waste incineration.
The aim of the study is to assess different solutions for diverting food waste away from incineration towards biogasification, with a special focus on the feasibility of implementing FWDs in Aarhus city compared with transport by truck. Diverting the organic waste away from waste combustion within energy production towards resource efficient technology solutions inside the wastewater sector are evaluated to provide decision support regarding economically feasible solutions delivering maximum services in terms of climate mitigation and environmental restoration. The study was performed to answer the following questions:
  • What is the best technology for the utilization of energy and other resources in organic waste—a wastewater treatment plant with biogas production or WtE plant?
  • What is the most environmentally sustainable and economically viable food waste collection and transportation method from households to biogas plants—via sewage system or a “dry” transport (by trucks)?
  • What is an optimal scale for biogas production from food waste?
  • Evaluation of economic viability in support of future business models considering the increased content of organic matter in the influent wastewater and increased renewable energy generation and utilization.
In the Methodology and Data section, a system description and framework for the combined life-cycle analysis (LCA) and cost-benefit analysis (CBA) is presented. Life cycle inventory (LCI) for the substance, material, and energy flows as well as financial and welfare economic data are provided in the Supplementary Material. The results section presents the outcome of attributional LCA and CBA. A summary and discussion of the main results and recommendations of the LCA and CBA is presented in the Discussion and Conclusions.

2. Materials and Methods

2.1. Systemic Framework

An attributional LCA approach with system expansion has been selected to evaluate the effects of two alternative organic waste management scenarios (AS1 and AS2) compared to the reference, i.e., existing waste management system in Aarhus (Figure 1).
The LCA provides information about climate, environmental health, and energetic consequences of changing the waste collection and technology system in non-monetary units, while the economic feasibility assessment provides an analysis of the financial and environmental CBA associated to the transformation of existing waste management system into the alternative integrated waste and wastewater management.
The dry matter content of the total amount of waste (sum of organic and inorganic waste) being incinerated in the reference scenario is 58.18%, while the dry matter content of the organic fraction of household waste being diverted away from incineration towards wastewater treatment plants with anaerobic sludge digestion in the alternative scenarios is 45.5%. Input-output tables for the organic fraction of household waste management and technology system level are provided in the Supplementary Material, Tables S1 and S2.

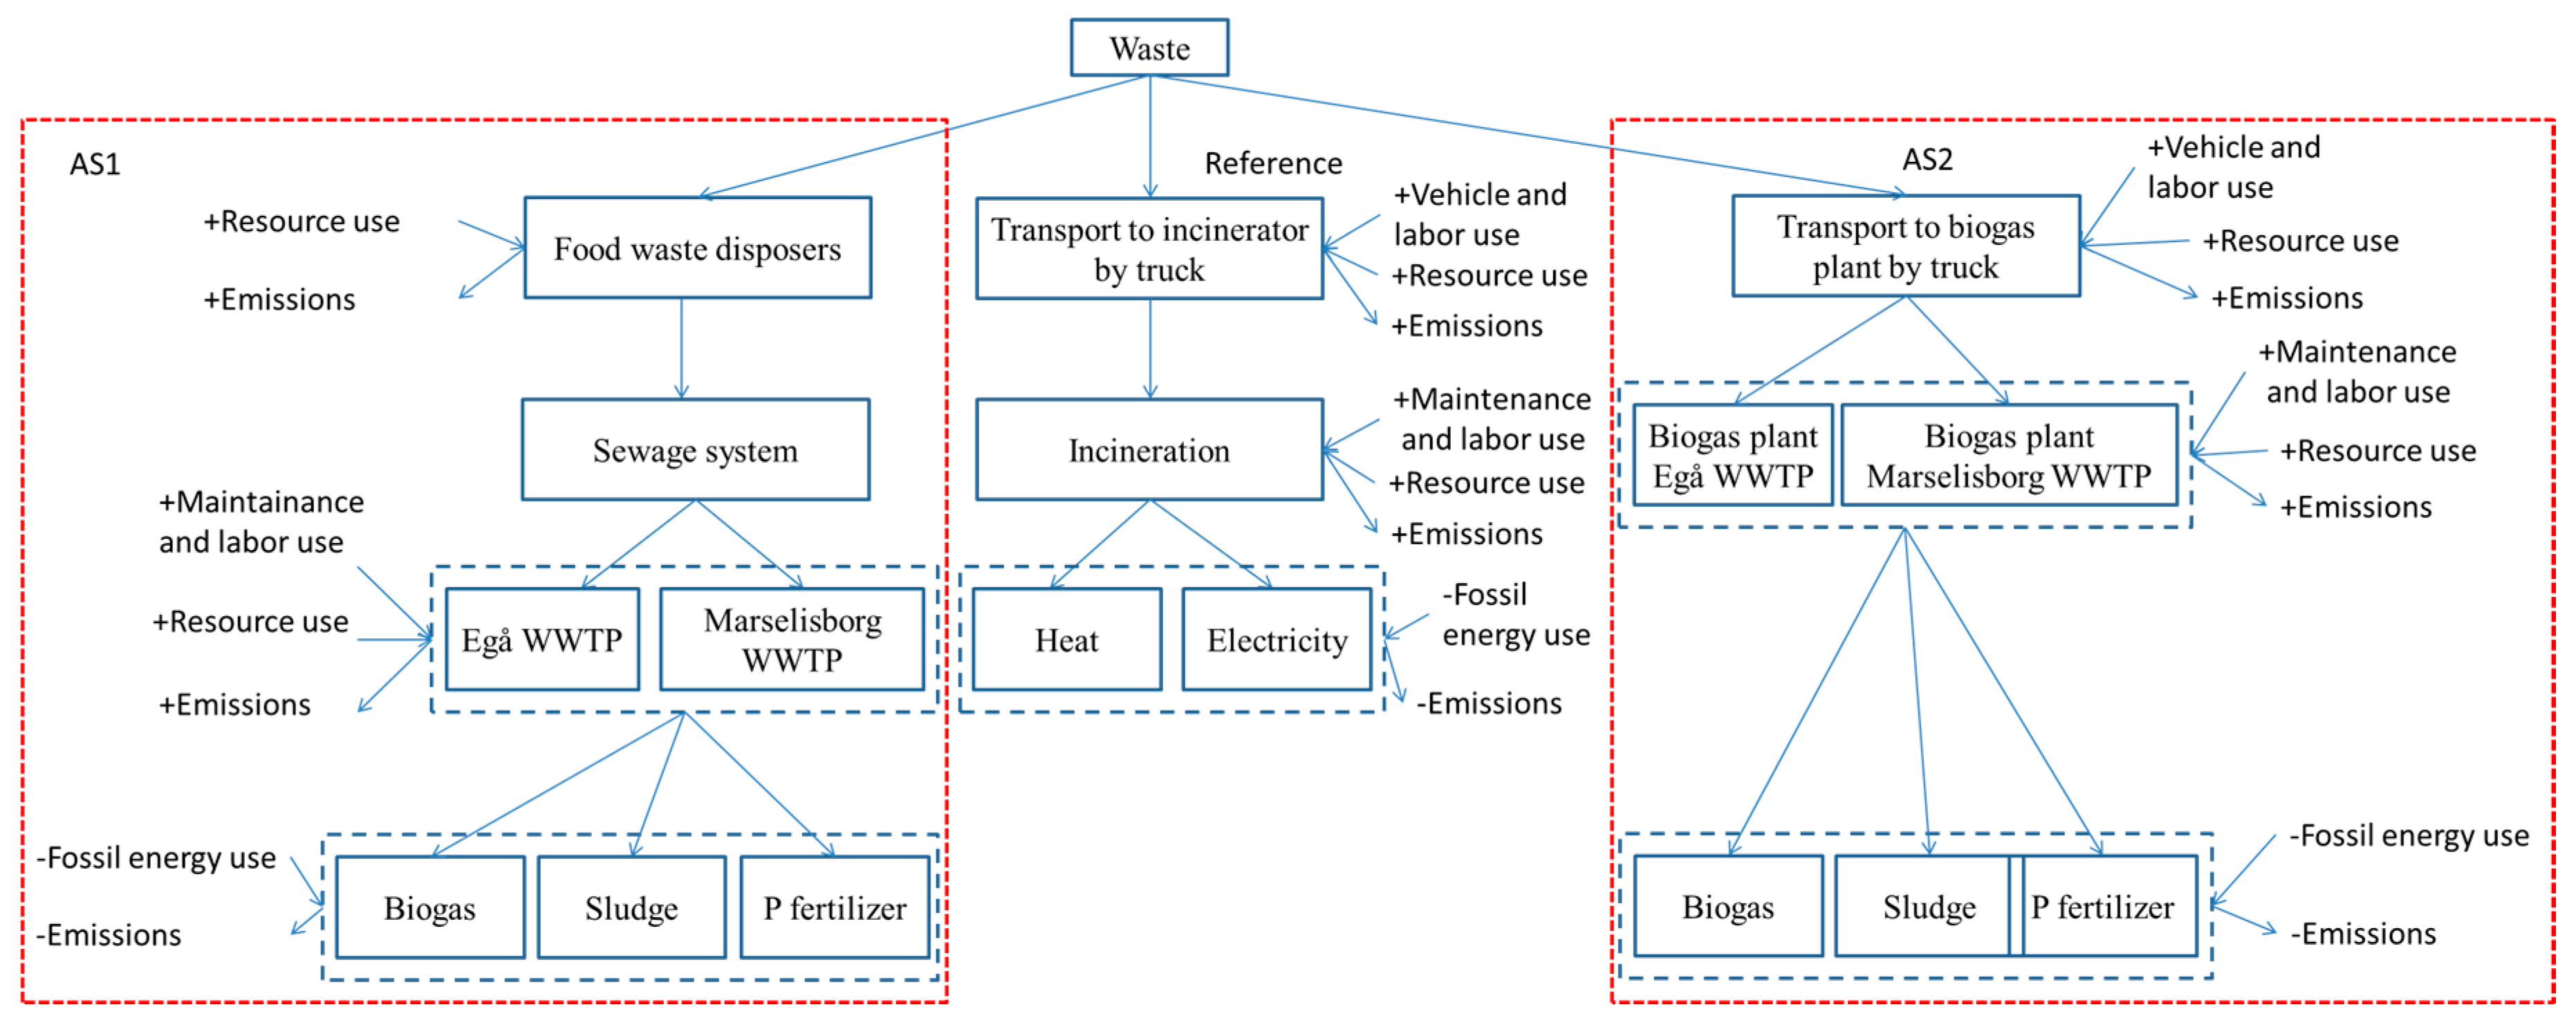
2.2. System Description

The reference waste management system and the two alternative integrated waste and wastewater management systems are briefly described below and visualized in Figure 1:
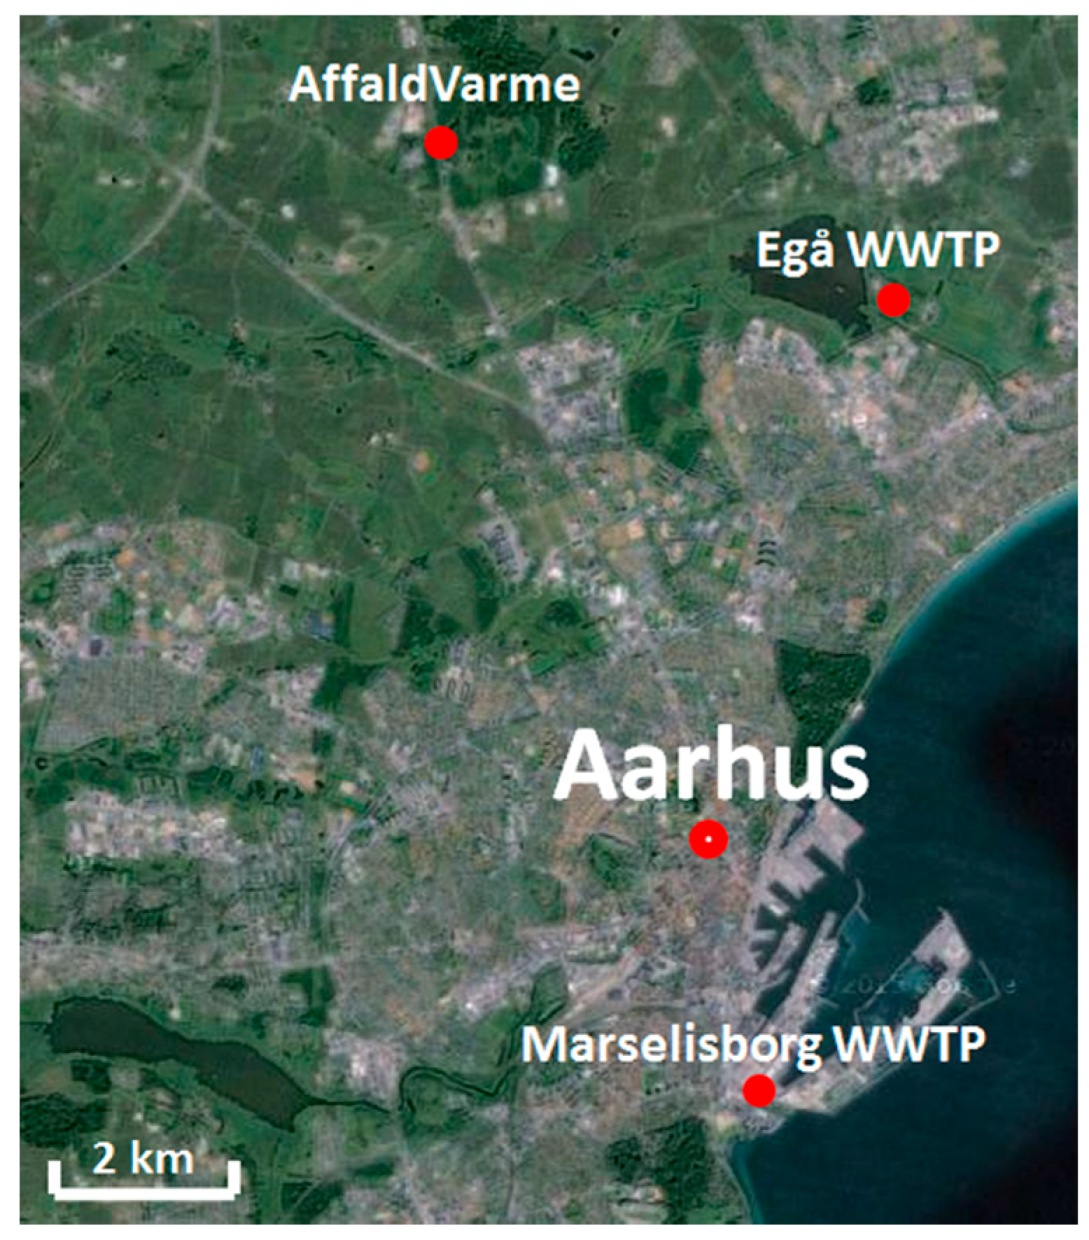
  • Reference scenario (REF): Mixed household waste is collected by trucks and transported to Aarhus incineration plant, “AffaldVarme”.
  • Alternative scenario 1 (AS1): 16% of the organic fraction of the domestic organic waste (D-OF) dry weight is ground in FWDs in private households and transported via the collective sewer system to Egaa and Marselisborg WWTP.
  • Alternative scenario 2 (AS2): Two versions of AS2 were modelled diverting, respectively, 16% (AS2a) and 100% (AS2b) of the D-OF away from incineration, by separate collection and transport by trucks to biogas plants at Egaa and Marselisborg WWTP.
In AS1, FWD is installed in 63% of the household in Aarhus, corresponding to an increase in the organic matter in the influent wastewater of 25% at the Egaa and Marselisborg WWTPs, respectively (Supplementary Material, Table S2). For the AS2a, the amount of D-OF transported by truck to the biogas plants was set to equal the amount transported via the collective sewer system in AS1. In AS2b, a full implementation of separate collection of organic household waste was modelled. In AS2a and b, a pre-treatment technology transforming the organic household waste into biopulp prior to anaerobic digestion is included [6]. A complete life cycle inventory is provided in the Supplementary Material, Table S1, which includes the extra water and energy consumption associated to the installation of FWDs in AS1 as well as details regarding the biopulp AD pre-processing technology in AS2. The inventory is composed of primary and secondary data:
  • WtE: Energy use, material consumption, and energy efficiency are based on the Vestforbrænding WtE plant in Copenhagen [5]. Emissions to air are estimated based on the typical composition of Danish waste [12];
  • Egaa and Marselisborg WWTPs: Wastewater loads and WWTP treatment capacity received from Aarhus Vand, and material and energy consumption based on an average Danish WWTP [5]; and
  • Biopulp production: Based on primary data obtained from ECOGI food processing technology [13].
The distribution of the waste categories in organic and fossil fractions is showed in Table S3. The study does not take into consideration the infrastructure of WtE and WWTP. According to experts from Aarhus Vand, treatment of D-OF in Aarhus municipality does not require significant change of WWTP infrastructure. Similarly, the reduction of D-OF combusted in WtE does not affect the overall structure significantly. The study does not include the material and energy necessary to install the FWD in a household. Given the durability of the blades of the FWD, the material use is expected to be negligible compared to the electricity and water consumption for the grinding process [14].
Collection and Transport
In the reference system, mixed household waste is collected and transported by trucks to the Aarhus WtE Plant “AffaldVarme Aarhus”, which is located about 8.5 km from the city centre of Aarhus (Figure 2). In AS1, food waste is ground in FWDs and transported via the collective sewer system to the WWTPs, i.e., 16% of the D-OF waste dry weight (Table S1). In AS2, separately collected D-OF (Table S1) is transported by truck from Aarhus City to the biogas plants, Egaa and Marselisborg WWTP.
The sludge-based biogas plants are located at Egaa and Marselisborg WWTPs, approximately 8 km and 3.5 km, respectively, from the city Centre of Aarhus. The energy consumption and emissions associated to waste collection trucks are based on the European average (“Market for Municipal waste collection service by lorry, Allocation Default”, from Ecoinvent [15]). The truck consumes diesel and has an 8.2 ton gross capacity of wet domestic waste (load factor 50%).
The locations of the three plants, i.e., the WtE plant AffaldVarme Aarhus, Egaa, and Marselisborg WWTP, are visualized in Figure 2.
For the described scenarios, we calculated the economic and environmental cost and benefit of diverting organic waste away from incineration towards combined biogas and fertilizer production, including changes in the system level for combined heat and power production. Methodological aspects of evaluating the monetary and non-monetary cost and benefits of integrating the existing waste and wastewater management systems for Aarhus municipality are described below.

2.3. Life Cycle Assessment

The LCA follows four phases: (1) Goal and scope presented above, (2) life cycle inventory, (3) life cycle impact assessment for selected impact categories presented below, and (4) an interpretation of the results as presented in the Results and Conclusion.
The LCI was developed according to the integrated LCA-CBA framework visualized in Figure 1 (Supplementary Material, Tables S1 and S2). The life cycle assessment was performed using SimaPro (version 8.0.4) software (Pré) and the database Ecoinvent v.3.3 [16].
Life cycle impact assessment of the integrated waste and wastewater management system was performed using the ReCiPe LCIA method [16] at midpoint level and Stepwise 2006 v.1.5 [17] at mid-point and end-point level (results expressed in Euro2003).
Besides the climate change-related impacts, waste management systems are associated with certain environmental quality issues, e.g., potential trade-offs in the impact category terrestrial eco-toxicity upon substitution of mineral fertilizers, and contribution to a reduction in the impact category fossil depletion. Likewise, the net air emission of the reference and the alternative scenarios influences the impact categories of human toxicity and finally the resource efficiency of the scenarios affects the impact categories of freshwater and marine eutrophication.
The selected impact categories included in the LCA for ReCiPe methodology are listed below:
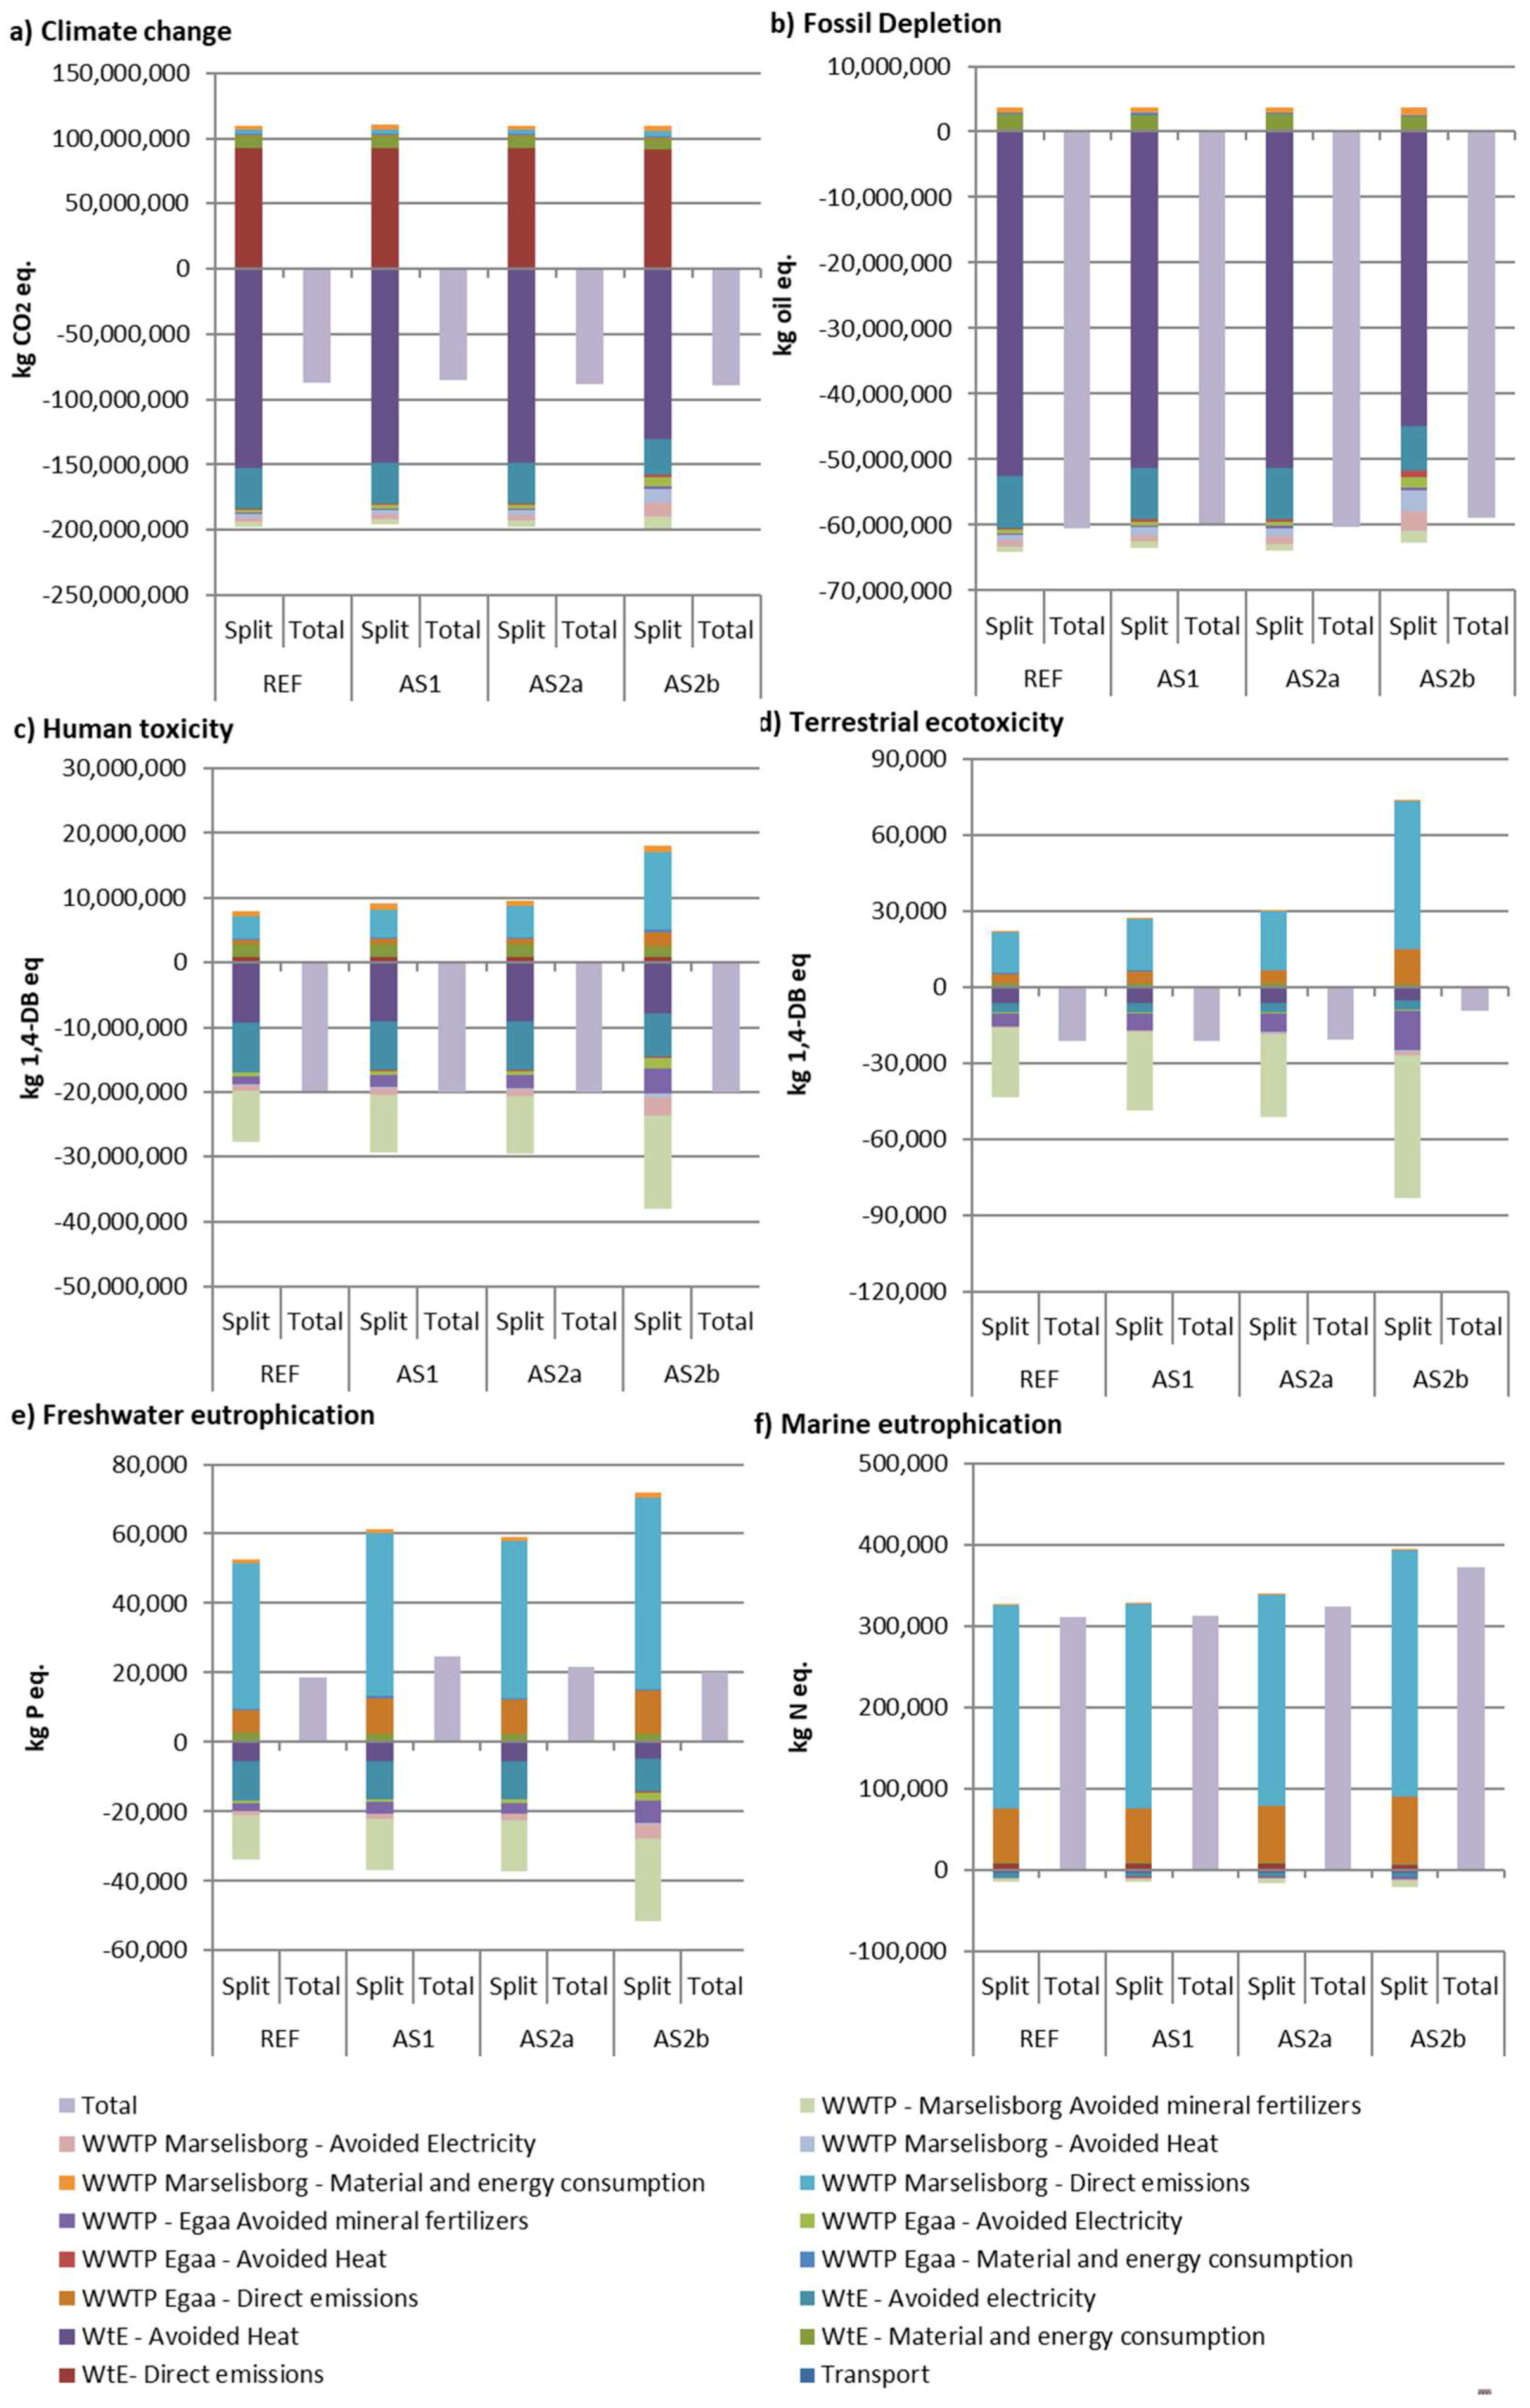
  • Climate Change, quantified in units of kg CO2 equivalents, [kg CO2e];
  • Fossil Depletion, quantified in units of kg oil equivalents, [kg oil eq.];
  • Human Toxicity, quantified in units of kg 1,4-dichlorobenzene equivalents, [kg 1,4-DB eq.];
  • Terrestrial Ecotoxicity, quantified in units of kg 1,4-dichlorobenzene equivalents, [kg 1,4-DB eq.];
  • Marine Eutrophication, quantified in units of kg nitrogen equivalents, [kg N eq.]; and
  • Freshwater Eutrophication, quantified in units of kg phosphorous equivalents, [kg P eq.].
Stepwise was included to evaluate the cost of externalities and as a supplement to the CBA. The selected impact categories are:
  • Climate Change, quantified in units of kg CO2 equivalents, [kg CO2e] and Euro2003;
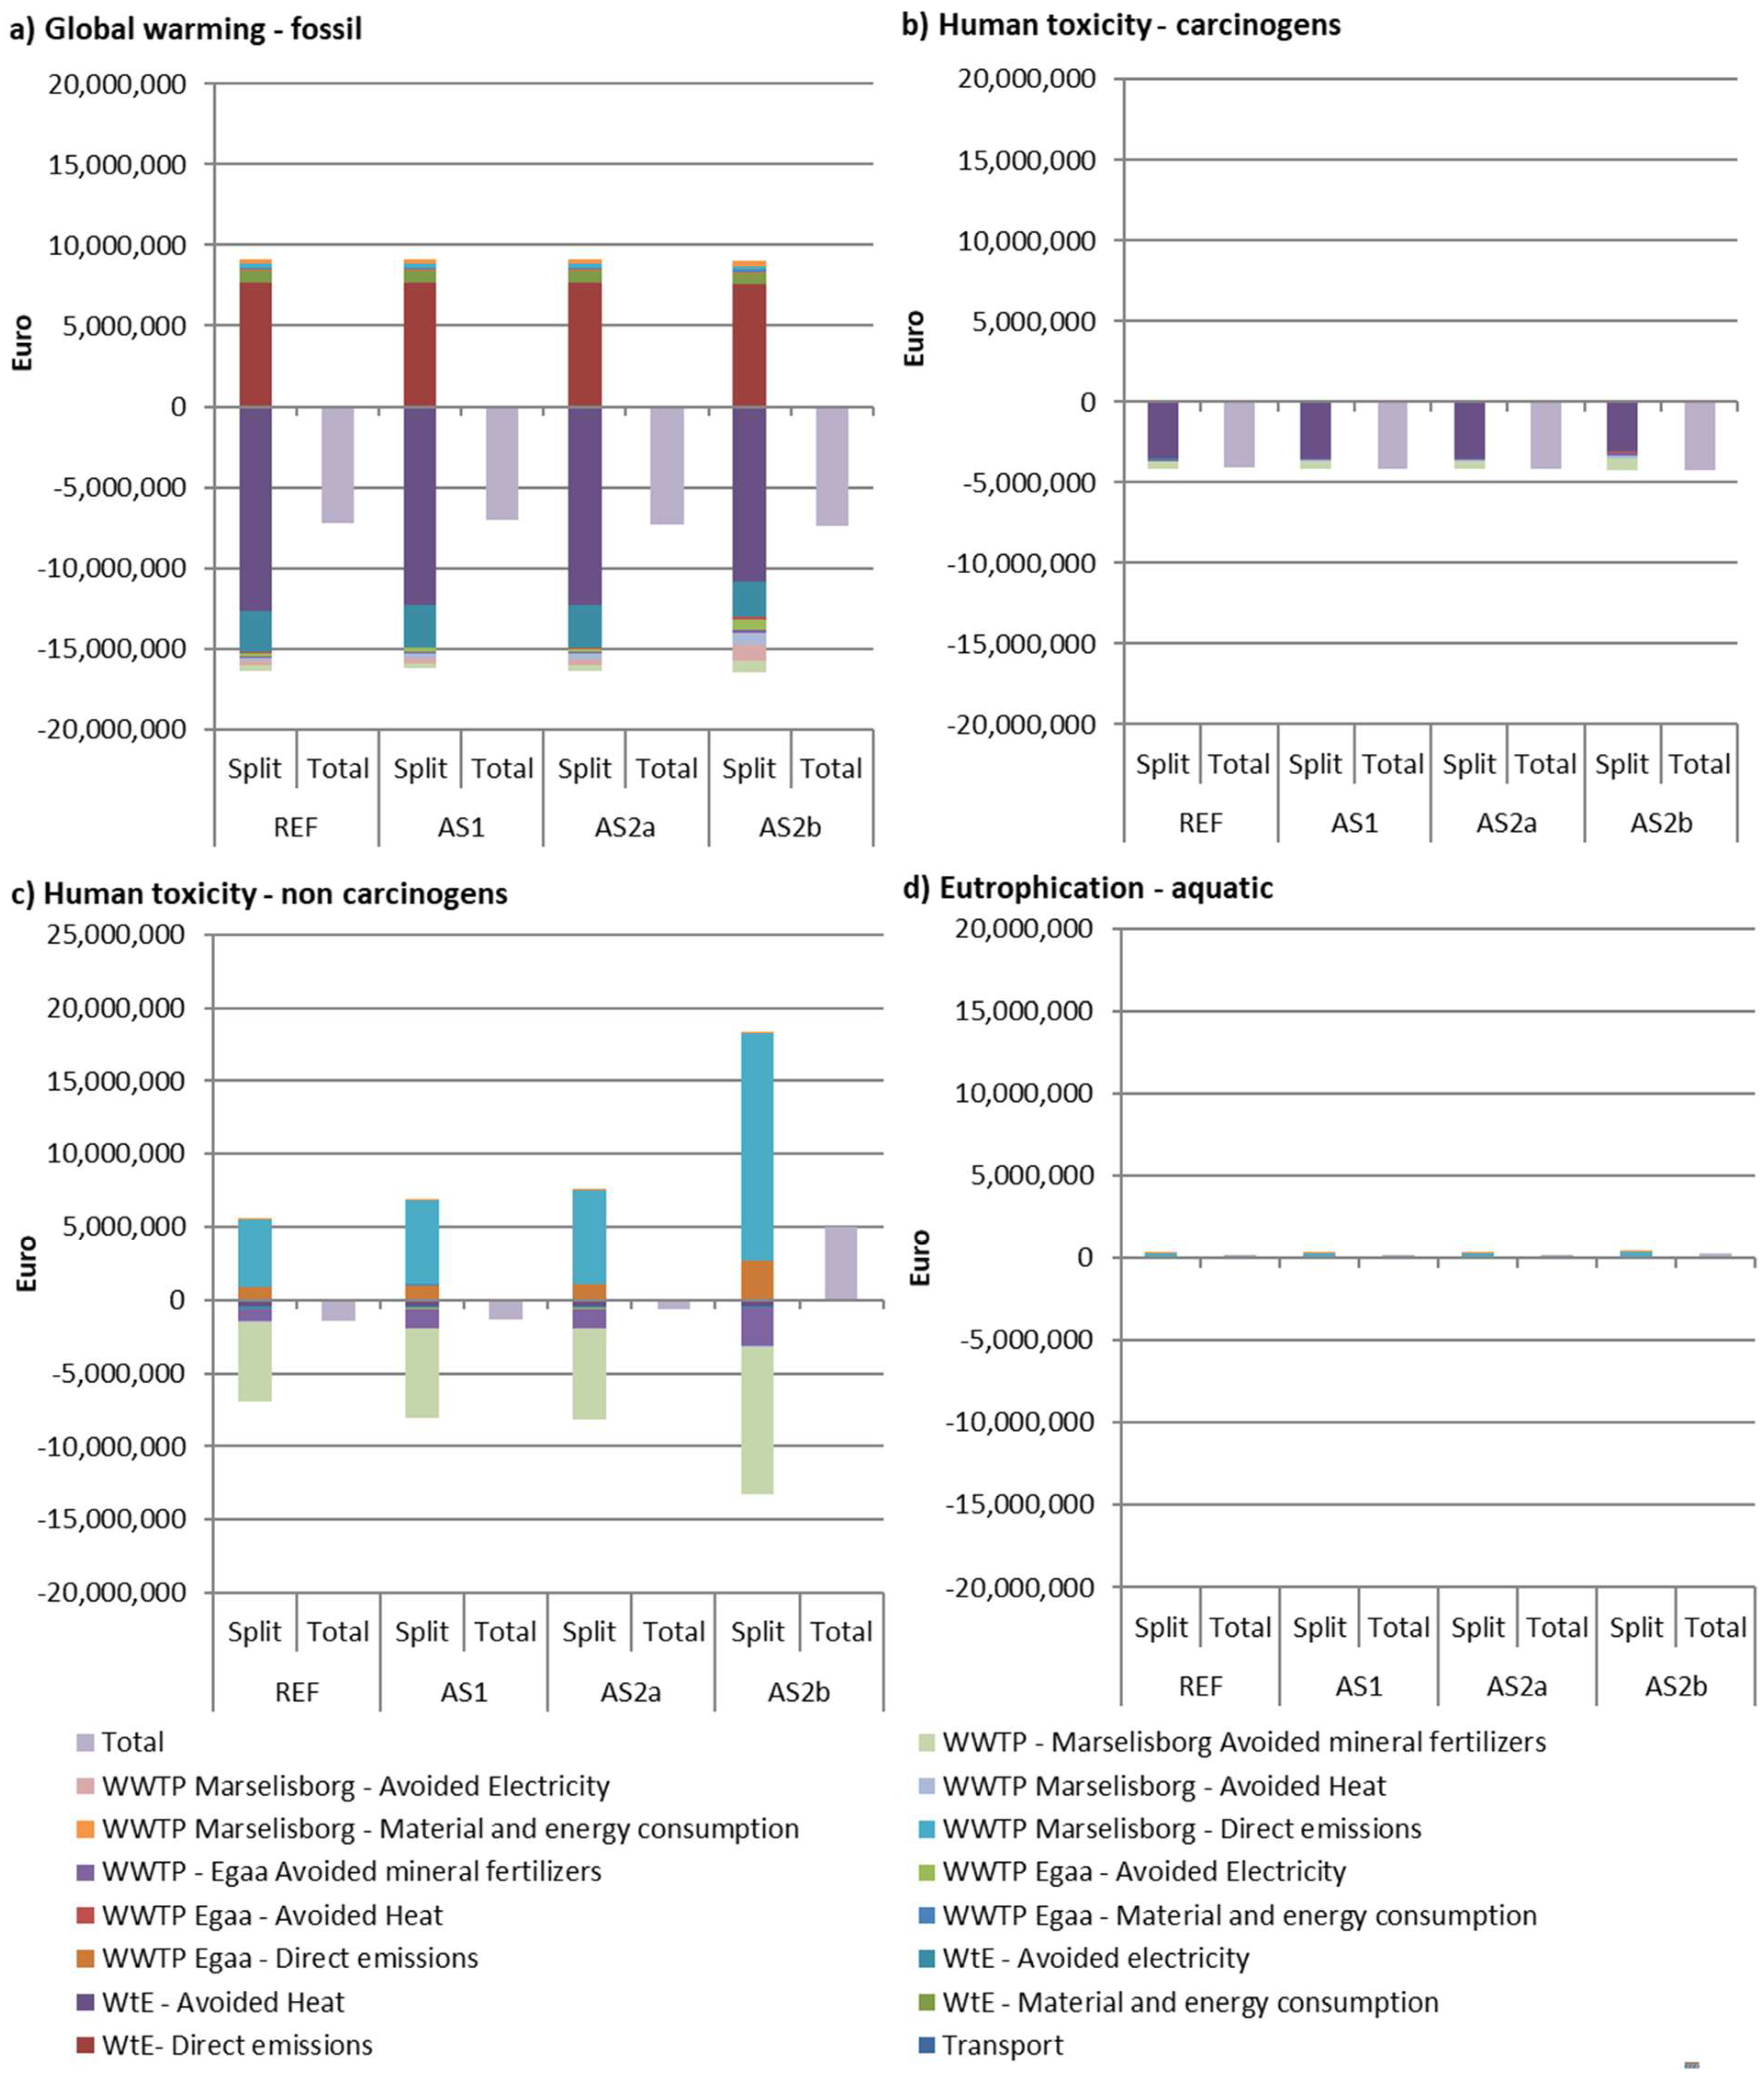
  • Human toxicity, carcinogens, quantified in units of kg chloroethylene equivalents, [kg C2H3Cl eq.] and Euro2003;
  • Human toxicity, non-carcinogens, quantified in units of kg chloroethylene equivalents, [kg C2H3Cl eq.] and Euro2003; and
  • Eutrophication, aquatic, quantified in units of kg nitrates equivalents, [kg NO3 eq.] and Euro2003.
The functional unit of the LCA is the total amount of waste managed inside the system boundaries, which consist of 138,004 ton of dry domestic and commercial solid waste and 25,511 ton COD in wastewater (Figure 1). In this way, results present the consequences of changing the management of the organic fraction of household waste at a system level, and the scales of the contribution analysis of the individual plants and processes are according to the actual size of the whole system.
The LCIA results for the four scenarios analyzed are presented in the results section. Net positive performance indicates that the production system has (adverse) environmental impacts, whereas net negative performance indicates that the system avoids adverse impacts.

2.4. Cost Benefit Analysis

CBA is a systematic method to evaluate the strengths and weaknesses of alternatives of a business strategy. In the current study, we want to compare the existing and alternative organic waste collection and conversion technology systems regarding their energy, climate, environmental, and economic performance according to an integrated LCA-CBA framework visualized in Figure 1. In the CBA, we consider four main stakeholders, whose boundaries and important performance indicators are described below.
Wastewater Treatment Plant Owners
For the WWTPs, we consider their business economic indicators, including costs, revenues, and taxed/subsidies from the government. The plants’ costs can be divided into fixed and variable parts. The “fixed costs” include the depreciation, interest (the interest rate is set to 5%), operation, and maintenance (Supplementary Materials, Table S7), while the “variable costs” cover the water for biopulp production and FWD, electricity, input materials (e.g., Fe), and final sludge disposal. The revenues include the sales of energy outputs (electricity, heat) and revenues for processing the wastewater. The fixed cost data of the individual waste treatment technologies included in the system boundaries can be found in the Supplementary Materials Table S8.
The return on investment (ROI) is defined as the annual profit (revenue deducted by cost) before tax divided by the whole investment. ROI is an important performance indicator, which reflects the efficiency of an investment.
We calculated two scenarios for WWTP owners’ ROI: One where the households pay for the installation and maintenance of the FWDs, and a second where the costs of installing the FWD is internalized, i.e., pay for by the WWTPs.
The Society
The environmental costs included in this analysis are: Greenhouse gas, i.e., methane and nitrous oxide, emissions from wastewater treatment, nitrogen emission to surface water with the effluent wastewater, and health cost associated to the cadmium content of the mineral and natural fertilizer products. The shadow prices for the environmental outputs are provided in the Supplementary Materials (Table S9).
For the society indicator, we applied the unit environmental cost, defined as the environmental cost divided by the total wastewater input. This indicator reflects, for a certain amount of waste, the cost that the whole society must bear.
Farmers
The farmers experience financial benefits through avoided costs of buying mineral fertilizer corresponding to the amount of sludge-based fertilizers received by the WWTPs.
To be able to compare the monetary measures across plants, we divided the financial benefits for the farmers by the total wastewater input.
Households
For reasons of comparability across indicators, the costs of the FWD installation were multiplied by the number of households included in AS1 and divided by the amount of extra influent wastewater.
The System Level
The cost-benefit at the system level quantifies the net benefit resulting from summing up the WWTPs’ return on investment, social cost, farmers’ benefits, and households’ costs, all in units of DKK per cubic meter treated wastewater. Two indicators are calculated; i.e., one for each of the WWTPS and a second indicator aggregating the net benefits of Marselisborg and Egaa according to their relative wastewater treatment inputs (Weights: Marselisborg = 0.7; Egaa = 0.3).

3. Results

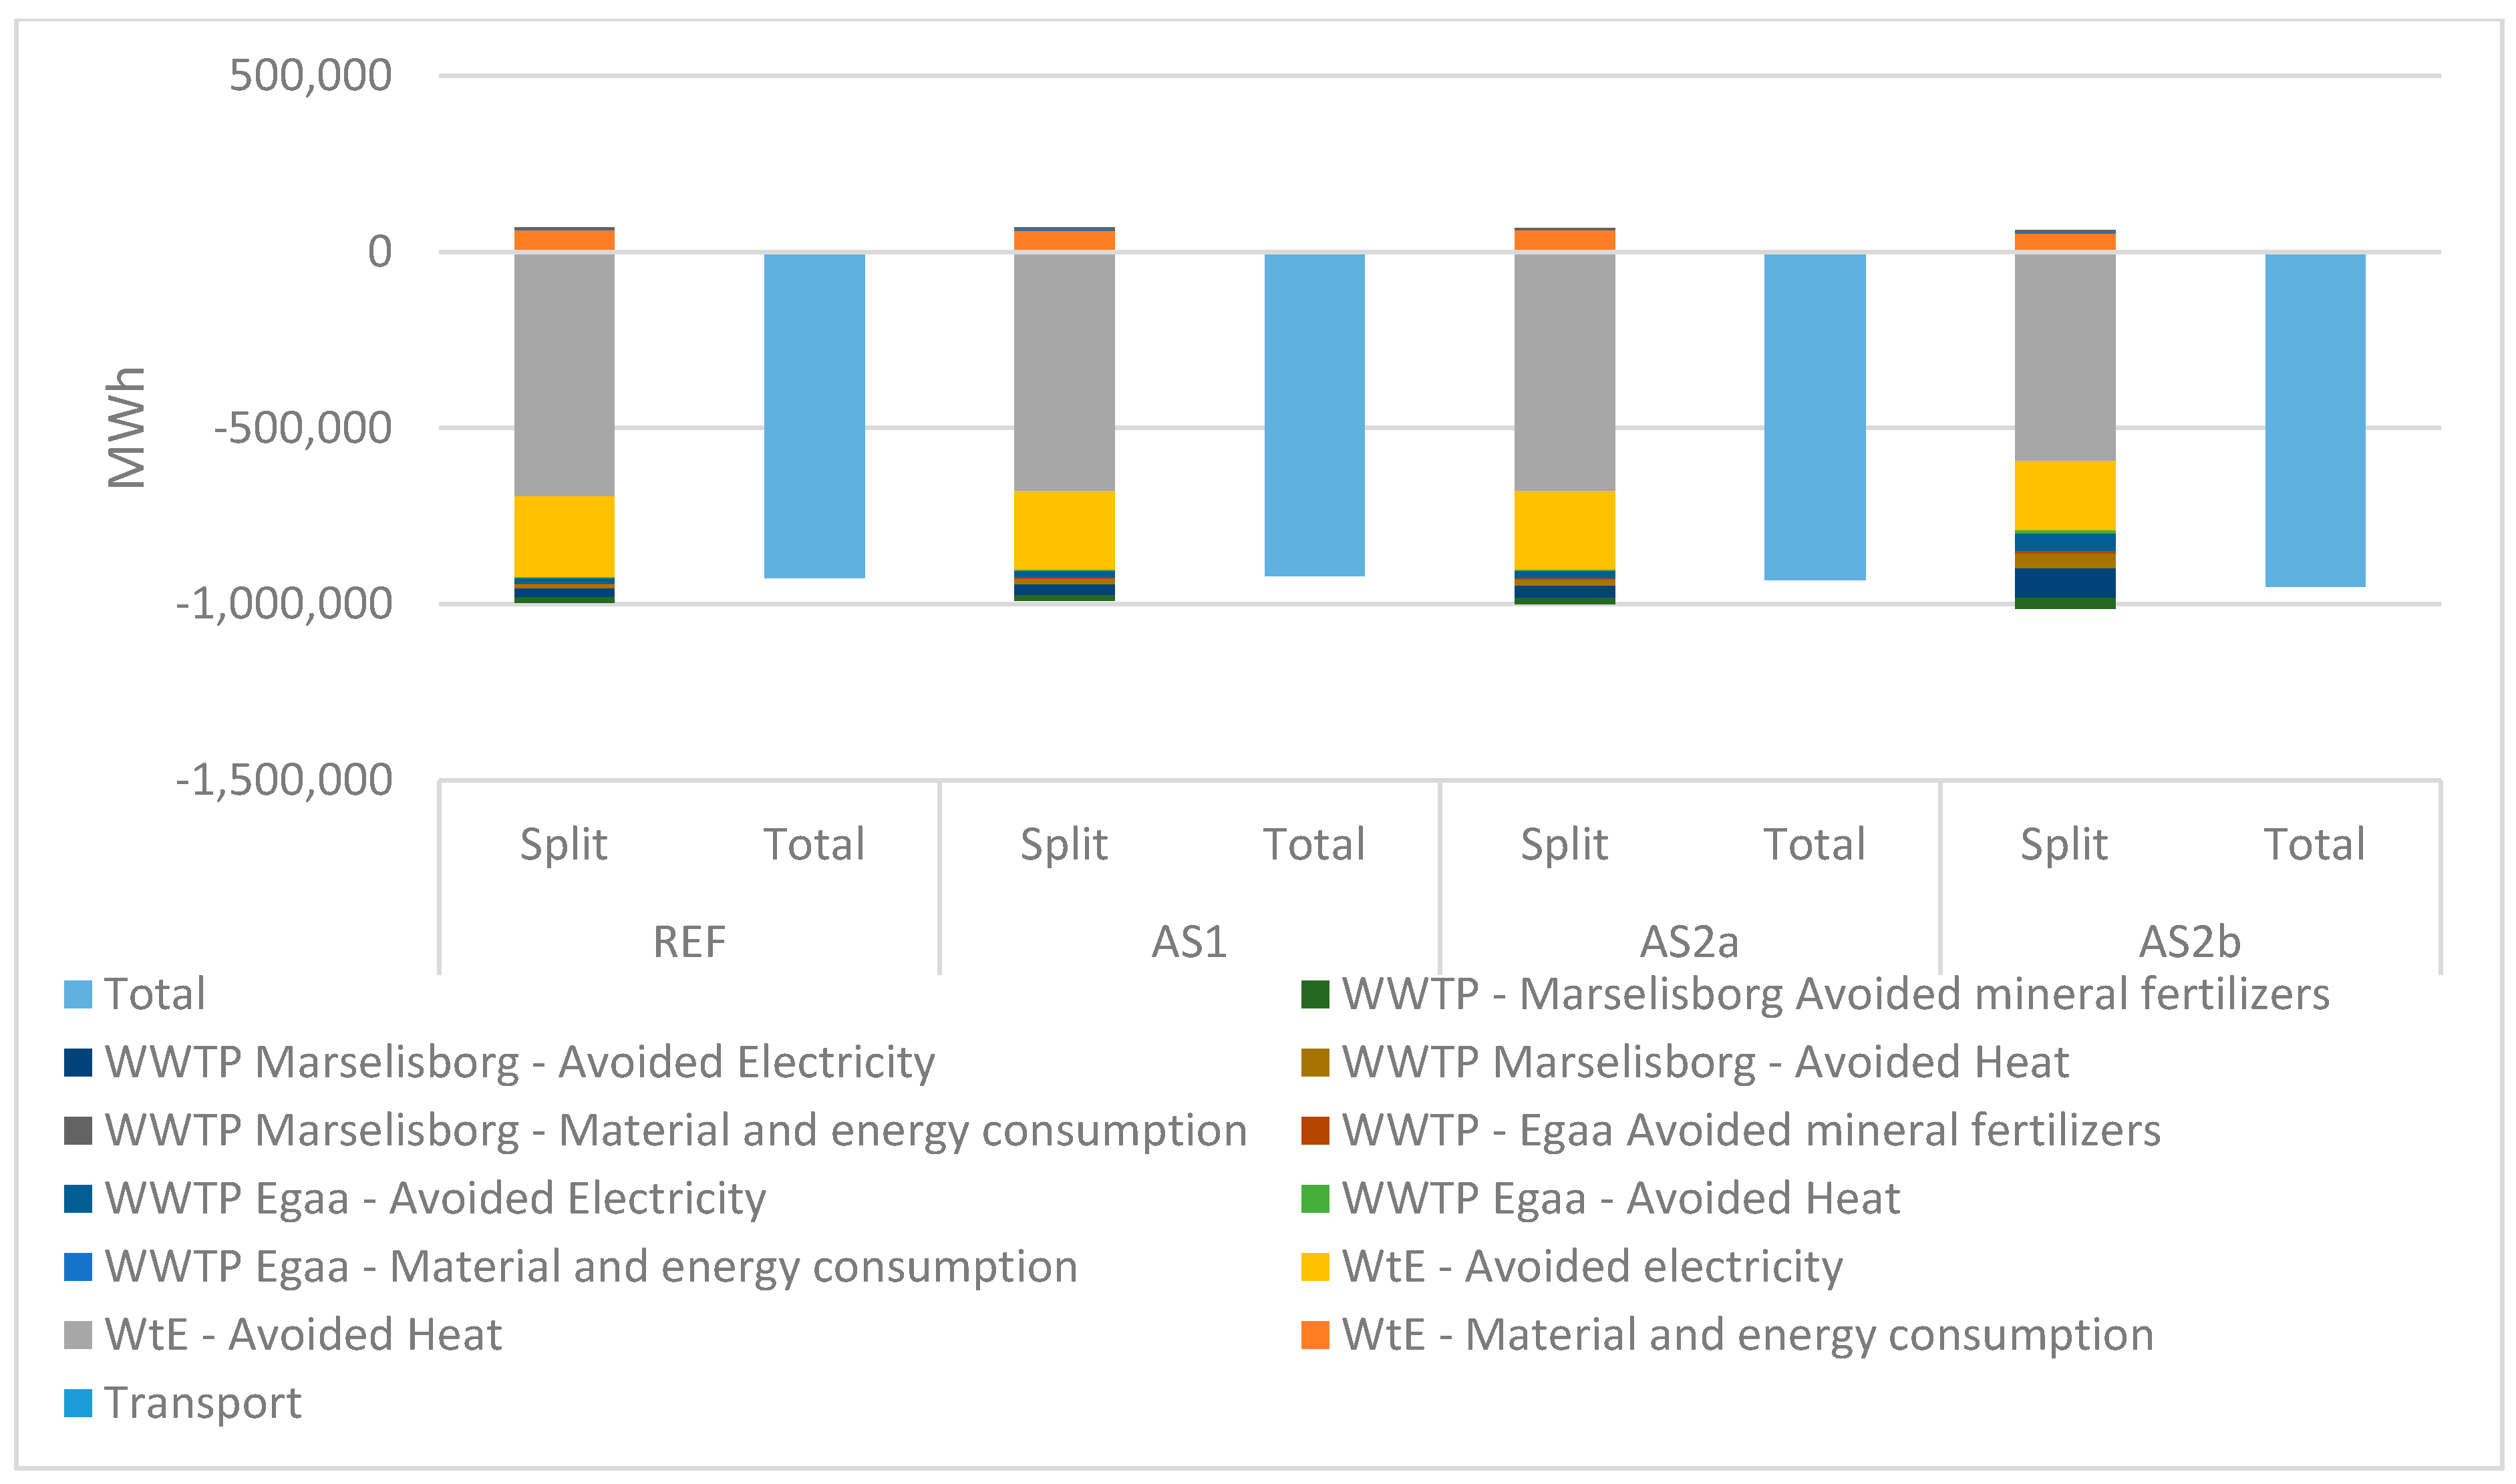
3.1. Energy Efficiency at the System Level

The diverting of 16% of the organic fraction of domestic waste from incineration to anaerobic digestion leads to a change in net energy production, i.e., gross production minus own consumption and loss. This results in a reduction in the net energy production from the WtE and an increase in net heat and electricity production from the WWTPs.
The energy yield is different among the three plants considered. The WWTPs show a higher electricity conversion efficiency compared to the WtE, but a lower yield of heat per ton of waste of dry weight treated.
The total heat production of the system (Figure 1) decreases, with 10,194 MWh in AS1, 7891 MWh in AS2a, and 50.307 MWh in AS2b, while the electricity production increases, with 258 MWh in AS1, 4275 MWh in AS2a, and 27.251 MWh in AS2b.
AS1 has a lower energy production than AS2a despite the same amount of D-OF diverted from WtE, which is explained as follows. The organic waste delivered by FWD enters the WWTP as suspended organic matter in the influent wastewater after which it is processed by aerobic biological treatment, causing a reduction in the degradable organic matter at the expense of N2O and CO2 emissions [4]. In this way, almost half of the organic matter potentially available for anaerobic digestion is lost. This results in a lower biogas production compared to AS2a, where the D-OF is transported by truck to the anaerobic digester tank.
The consequence of the changing energy conversion efficiencies is that the total net heat production of the integrated organic waste and wastewater management system is progressively decreasing, while the total net electricity production is increasing, from the reference scenario to AS2b.
At a system level, the diversion of 16% of D-OF dry weight from the reference scenario WtE plant causes a relatively small change in the total net energy production in AS1 and AS2a, i.e., −1.4% and −0.5%. Even when reallocating 100% of D-OF dry weight, the total net energy is reduced by −3% in AS2b. However, in the latter case, we observe a significant increase in the net electricity production of 25% and a reduction in the net heat production, i.e., −9%, compared to the reference scenario.
The total cumulative energy demand (CED) [18] complements the net energy analysis by highlighting the different quality of energy vectors (Figure 3). Electricity has a higher quality and, as expected, a higher CED than heat. Among the scenarios, AS2a and AS2b have the best performance since they provide the highest electricity output (Table 1). All scenarios show a high energy efficiency: 1 MWh of energy input generates 15 MWh of output (the analysis does not consider the CED necessary to produce the domestic waste). The different transport methods of D-OF, i.e., sewage system (AS1) vs waste collection truck (AS2), have a negligible contribution to the energy performance.

3.2. Life Cycle Impact Assessment

The contribution analysis for the six selected impact categories of the ReCiPe method, Climate Change, Fossil Depletion, Human Toxicity, Terrestrial Toxicity, Freshwater, and Marine Eutrophication, are visualized in Figure 4. Figure 5 presents the results using the Stepwise impact categories of Global Warming Fossil, Human Toxicity Carcinogens, Human Toxicity Non-Carcinogens, and Eutrophication Aquatic.

3.2.1. Climate Change

The Stepwise Global Warming—fossil impact category shows similar analysis results as ReCiPe, since both LCIA methods apply the Global Warming Potentials from [19] as characterization factors (CFs). For Global Warming, Stepwise proposes 0.083 Euro2003/kg CO2e as damage CF for all impacts aggregated, corresponding to 1.6 × 10⁻³ Euro2003/kg CO2e as impacts on human well-being, 8.2 × 10⁻² Euro2003/kg CO2e as impacts on ecosystems, and −3.7 × 10⁻⁴ Euro2003/kg CO2e as impacts on resource productivity [20].
All scenarios analyzed provide mitigation of climate change because of the avoided production of energy and mineral fertilizers. A2b performs best by delivering mitigation of climate change corresponding to −8.92 × 10⁷ kg CO2e. The AS2a is the second best (−8.80 × 10⁷ kg CO2e) followed by the reference scenario (−8.74 × 10⁷ kg CO2e) and AS1 (−8.51 × 10⁷ kg CO2e). Despite the decrease in the total net energy production from moving from the reference to AS2b, we observe an increase in the mitigation of Climate Change. This is explained by an increase in avoided mineral fertilizer production and the co-benefits from carbon sequestration in soil, resulting from domestic biowaste based fertilizer output products.
In absolute amounts, the WtE has the highest impact on climate change (red bar) in all scenarios due to the quantity of waste combusted (138,004 ton DW), which is six times the waste treated in Marselisborg and 23 times the waste treated in Egaa for the reference scenario.
When considering indirect emissions from the material and energy consumption of the plant operations (Table S5), we can see an increasing trend from the reference scenario to AS2a (+0.62%), AS2b (+3.93%), and AS1 (+5.61%), which means that scenario AS1 is the worst performer in terms of efficiency, while the reference scenario is the most effective. However, if we take into account also the direct emissions of the plants, scenarios AS2a and b have lower emissions compared to the reference scenario, thanks to a higher amount of carbon sequestered to the soil instead of emitted to the atmosphere. When combining the indirect operational energy and process-related emissions and the direct process emissions of the plants, both AS2a and b have a better performance than the reference scenario. Even if the plants are slightly less efficient in using their inputs for energy production, they reduce the amount of carbon emitted to the air by increasing the soil organic carbon stock, resulting in a higher net reduction of CO2e emissions. This is even more valuable considering that the operational energy consumption will increasingly come from renewable sources [5,15]. Consequently, the waste treatment processes’ emissions and the degree of carbon capture and reuse will determine the net result of the climate performance.
When comparing the two strategies for treatment of D-OF in WWTPs (AS1 and AS2a), a better performance for the “dry waste” transport with trucks compared to FWDs is observed. This is explained by a higher resource efficiency (less waste treatment processes emissions) of the truck scenario (AS2) compared to the FWDs scenario (AS1), which is associated with a loss of carbon during biological treatment at the WWTP prior the biogas production. The impact of GHG emissions from the transport of D-OF via trucks in AS2 is negligible.
From the contribution analysis of the WWTPs, it may be observed that the electricity consumption increases from the reference to alternative scenarios due to the higher amount of organic matter treated at the WWTPs (Figure 6). AS1 has a higher operational electricity consumption than AS2a, as a substantial amount of energy consumption is associated to the biological treatment of the increased organic matter in the influent wastewater [4]. Due to a significant emission of nitrogen and carbon during aerobic biological treatment, a lower N content and lower mineral fertilizer substitution results from AS1 (Figure 6).
The monetarization of the impacts in Stepwise (Table S6) is proportional to the impacts themselves, since for every impact category, the impacts are monetized in units of Euro2003/kg CO2e in a reference unit of measurement (e.g., kg CO2e). The contribution to climate change mitigation scenarios show the same trend as ReCiPe for the mid-point results, with scenario AS2b producing the highest reduction in climate change associated costs (−7.40 × 10⁶ Euro), followed by AS2a (−7.30 × 10⁶ Euro), the reference scenario (−7.25 × 10⁶ Euro), and AS1 (−7.06 × 10⁶ Euro).

3.2.2. Fossil Depletion

The impact category of fossil depletion is dominated by the energy production and consumption patterns of the system. The analysis shows that all scenarios deliver services in terms of avoided fossil depletion and net negative value results for all scenarios. The best performing scenarios are the REF, −6.04 × 10⁷ kg Oil eq., and AS2a, −6.02 × 10⁷ kg Oil eq., followed by AS1, −5.97 × 10⁷ kg Oil eq., and AS2b, −5.90 × 10⁷ kg Oil eq.
The increase in fossil energy consumption associated to the pre-treatment of the D-OF in AS2b is higher than the decreased fossil depletion obtained from increased heat, electricity, and natural fertilizer production, which makes the depletion of fossil resources slightly lower in AS2b compared AS2a.
The performance of AS1 is slightly better than AS2b, but the increased energy consumption and decreased energy and fertilizer production compared to the “dry waste” management makes AS1 worse than scenario AS2a.

3.2.3. Human Toxicity

For both the ReCiPe (Figure 4b) and Stepwise (Figure 5a,b) LCIA methodologies, results show that all scenarios provide a benefit in terms of net avoided impact on human toxicity.
According to ReCiPe (Figure 4c), the scenarios, AS1, AS2a, and AS2b, have a very similar performance (−2.011 × 10⁷ kg 1,4-DB eq., −2.008 × 10⁷ kg 1,4-DB eq., and −2.006 × 10⁷ kg 1,4-DB eq., respectively), whereas the reference scenario has a slightly lower performance (−1.978 × 10⁷ kg 1,4-DB eq.).
The diversion of D-OF from incineration to anaerobic digestion increases the influence of sludge application and water effluents emission. Benefits are obtained from the avoided production of mineral fertilizers (light green and dark purple negative contributions), which reduces the impact on human toxicity due to the avoided emission of cadmium to soil upon spreading of contaminated mineral fertilizer. The avoided health impact is associated to cadmium exposure via food crops cultivated on cadmium contaminated fertilized soils [21]. At the same time, the higher release of zinc and lead to the soil and manganese to the water is associated with an increase in human toxicity according to ReCiPe.
All the alternative scenarios reduce the release of arsenic to soil and water by substituting the production of arsenic contaminated mineral fertilizers, and avoid the emissions of aromatic hydrocarbons and dioxins from WtE generation. The higher reduction in AS2b is due to the increase in avoided mineral fertilizers, which exceeds the reduction in avoided health impacts due to the diversion of D-OF from WtE to WWTPs.
The modelled impact of air emissions from WtE is insignificant compared to the direct emissions from WWTPs, which may be due to air pollution control devices (APCD) [22]. This analysis presumes that the heavy metals contained in the incineration slags are sequestrated from the environment, while wastewater is treated at WWTPs.
Stepwise differentiates between carcinogens and non-carcinogens when modelling the impact category of human toxicity (Figure 5b,c).
Concerning carcinogens, AS2b shows the highest avoided health impacts, followed by AS2a, AS1, and REF. The avoided carcinogenic health costs amount to −4.09 × 10⁶ Euro2003 for REF, −4.11 × 10⁶ Euro2003 for AS1, −4.13 × 10⁶ Euro2003 for AS2a, and −4.24 × 10⁶ Euro2003 for AS2b.
Concerning non-carcinogens, REF shows the highest avoided health impacts, followed by AS1 and AS2b, while AS2b have a net positive performance, indicating (adverse) human health impacts. The costs of non-carcinogenic health impacts are −1.42 × 10⁶ Euro2003 for REF, −1.31 × 10⁶ Euro2003 for AS1, −5.82 × 10⁵ Euro2003 in AS2a, and +4.97 × 10⁶ Euro2003 in AS2b. The adverse health impacts modelled for AS2b is explained by the increased intensity of micropollutants in the D-OF being co-digested and recirculated waste-derived fertilizers to agricultural soils.

3.2.4. Terrestrial Toxicity

For the impact category of terrestrial ecotoxicity, even though all the scenarios show a negative result (i.e., reduced impact), the increased D-OF diversion results in an increase of impacts from REF to AS2, explained by the increased spreading of micropollutants contained in waste derived fertilizers, i.e., mixed digestate spread on agricultural soils. The copper and zinc emitted to soil with the sludge-based fertilizer products decrease the soil quality, therefore, increasing the impact on soil ecotoxicity. In case of extraction of N and P from the water line at the WWTP, i.e., through struvite production, the negative impact on terrestrial ecotoxicity can be eliminated [21], but that would also reduce the positive impacts on mitigating climate change by soil carbon sequestering.
According to ReCiPe, cadmium contributes less than five percent to the impact on the terrestrial ecotoxicity (light green lower part of negative bar). The avoided health impact obtained by substituting mineral fertilizers, which have higher cadmium content compared to the mixed digestate fertilizer products [21], is less than the impact from copper and zinc and therefore the terrestrial ecotoxicity increases with increasing waste-derived fertilizer application on agricultural soils. On the contrary, the avoided impact on human health increased slightly.

3.2.5. Eutrophication

The four scenarios analyzed have an impact on freshwater eutrophication. The lowest impact is obtained in the reference scenario (1.85 × 10⁴ kg P eq.), followed by scenario AS2b (2.02 × 10⁴ kg P eq.), AS2a (2.18 × 10⁴ kg P eq.) and AS1 (2.47 × 10⁴ kg P eq.). The highest impact in AS1 is due to an increase in the phosphorous in the effluent of the WWTPs due to the treatment of all the biowaste in the WWTPs before anaerobic digestion. Diversion of D-OF increases the impact on freshwater eutrophication in AS2a to a lesser extent than AS1, as only the reject water from dewatering of the digested sludge contributes. Loss of phosphorous contained in effluent wastewater is highest AS2b, while for the amount of avoided phosphorous, loss from raw phosphate mining is even higher. This results in AS2b having the best environmental performance.
Avoided fossil electricity production due to substitution with waste to energy production reduces the impact on freshwater eutrophication in all scenarios - more specifically, the avoided indirect impacts of the coal-based part of the Danish electricity mix according to the Ecoinvent database [15]. The impact of coalmines on freshwater eutrophication occurs during the requalification of coalmines at their end-of-life, when phosphorous fertilizers are applied to enable the growth of plants on the site; however, part of the fertilizer input is lost to the freshwaters, negatively affecting the water quality [23,24].
Concerning the marine eutrophication, the analysis shows that all scenarios have a net negative impact quantified through net positive values at the system level. AS2b presents the highest impact quantified as 3.72 × 10⁵ kg N eq., followed by AS2a (3.24 × 10⁵ kg N eq.), AS1 (3.13 × 10⁵ kg N eq.), and the reference scenario (3.11 × 10⁵ kg N eq.). The pattern in the results correlates to the direct, i.e., air and water, emissions of N from the two WWTPs analyzed. Marselisborg is the one that has a highest impact due to the volume of water and N load treated. Direct emissions from Egaa are the second highest contribution to the marine eutrophication.
Avoided electricity and mineral fertilizers are negligible compared to the direct emissions of the total N. The use of FWD shows slightly better performance compared to the transport of waste by trucks due to a reduction in the efficiency of nitrogen in the influent wastewater, which for Denmark, is above 90%. The resulting lower content of N in the reject water in AS1 compared to AS2, results in AS1 performing slightly better than AS2.
Stepwise aggregates the impacts on marine and freshwater eutrophication under the impact category of Aquatic Eutrophication. The impacts values are positive for all the scenarios. The magnitude of the impact is determined by the direct emissions of nutrients in the WWTPs and by the amount of substituted mineral fertilizers, so that AS2b has the highest impact, amounting to 2.49 × 10⁵ Euro, followed by AS1 with 2.36 × 10⁵ Euro, AS2a with 2.31 × 10⁵ Euro, and the reference scenario with 2.12 × 10⁵ Euro.

3.2.6. Total Environmental Costs

The net impact on the environment and human health is determined by whether (i) the waste-derived fertilizer produced contains less micro-pollutants compared to the mineral fertilizers they substitute, and (ii) if the negative health impacts resulting from WtE emissions are more or less than the emissions from fossil energy consumed by the integrated waste and wastewater management systems.
When summing the costs of the environmental impacts obtained using Stepwise, the scenarios, AS1 and AS2a, provide the highest economic benefits, respectively, amounting to −1.18 × 10⁷ and −1.07 × 10⁷ Euro. The reference scenario follows with −8.69 × 10⁶ Euro, while scenario AS2b ranks last with −5.07 × 10⁵ Euro.
It should be mentioned that an incompleteness in micro pollutant impact pathway models, and, therefore, CFs in LCIA in general, constitutes a significant contribution to uncertainties when quantifying impact categories, such as terrestrial and human toxicity [25,26,27].

3.3. Cost-Benefits Analysis

The CBA focus on the role of future WWTPs in extracting valuable resources’ organic waste and wastewater, allowing for biobased products and clean water to re-enter the environment and economic system.
The environmental and economic cost-benefit analysis was performed for each stakeholder; i.e., the WWTPs, the household, the farmers, and the society, based on the unit prices of market and non-market goods (Supplementary Materials, Table S7).
Two different types of business economic indicators quantifying WWTPs return of investments were quantified. Indicator I1 and I2 quantifies the return of investments in a scenario where the investment and operation cost of FWD installation and maintenance are externalized to the households. Indicator I3 and I4 internalize the cost of the FWDs to the WWTP owners. I1 and I3 provide annual profit before tax as the percent of the total investment, while I2 and I4 measure the efficiency of investment in units of DKK/m3 of waste water.
Economic business indicators quantifying the social cost (I5), farmers; benefit (I6), and the net benefit, including all stakeholders associated to the resource flows associated to each of the WWTPs (I8) and in total (I9), are included as well. Results are provided in Table 2, while details of the structures of costs and revenues for two WWTPs in different scenarios are presented in the Supplementary Materials (Figures S1 and S2, respectively).

3.3.1. WWTP Owners Return of Investments (RoI)

The economic business indicators, I1 and I2, show the investment efficiency when the cost of FWD is paid by the households.
For Egaa, the investment efficiency in AS1 increases significantly compared to REF for Egaa WWTP. A minor decrease is seen in the investment efficiency in AS2a compared to AS1. The highest investment efficiency is obtained in AS2b, which is explained by a (1) slight increase in the ROI thanks to the amount of external carbon received in AS2b, and (2) that the additional cost for biopulp pre-treatment and final sludge disposal does not exceed the increased revenue from the increased energy production (Supplementary Materials, Figure S5).
For Marselisborg, a minor improvement in the investment efficiency is obtained in AS1 compared to REF. For both AS2a and AS2b, the investment efficiency is lower than the reference scenario. The reason for the reduced RoI for Marselisborg in the AS2 scenarios is due to the increased cost of transportation of the high amount of organic waste, the cost of the biopulp process, and the cost of providing the final sludge to the farmers. The costs exceed the revenue from an increased amount of external carbon in terms of green energy production and climate change mitigation through carbon sequestration in the soil in AS2b. Therefore, the return of investment is highest for the less resource efficient AS1 provided that the household is paying for the cost of FWD installation (Table 2, I1).
In a hypothetical situation where the natural sludge-based fertilizer product is considered cost neutral, the ROI results obtained for AS2a and AS2b increase slightly compared to the numbers in Table 1: 10.72% for Marselisborg and 122.16% for Egaa in AS2a, and 10.56% for Marselisborg and 124.9% for Egaa in AS2b. In this case, the return of investment is slightly improved in the AS2 scenarios for Marselisborg compared to the reference scenario, but the AS1 is still the most profitable investment. For Egaa, the pattern does not change.
An aspect that has not been included is the impact on the state of the sewer system. According to experts’ estimations of depreciations of sewage systems, we can calculate the extra cost for Marselisborg in AS1 is in the range of 0.007–0.03 DKK/m3 of wastewater, while the extra cost for Egaa is around 0.005–0.078 DKK/m3 of wastewater. However, the proportion of cost related to sewage system depreciation is relatively small and does not affect our results. Another aspect is the realism of installing FWDs in 63% of the households [28] (Supplementary Materials, Table S4) may be questioned as the majority of the buildings in Aarhus are old and their sewer systems may not have the optimal construction design in relation to installation of FWDs. Therefore, considerable extra cost for maintenance may result, making the AS1 less economically feasible than presented in Table 2.
Upon internalizing the cost of the FWDs (I3 and I4), I3 reveals that the WWTPs in AS1 will show worse economic performance (Marselisborg, 10.4%; Egaa, 114.92%) than AS2a (Marselisborg, 10.63%; Egaa, 121.75%). In other words, when the WWTPs pay the costs associated to the installation of the household FWDs, the ROI of AS2a is the highest for Marselisborg, while the ROI of AS2b is the highest for Egaa. It implies that if the FWDs’ costs are covered by WWTPs, the AS1 is not optimal for maximizing their ROIs anymore.

3.3.2. Farmers’ Benefits

For the farmers (I6), benefits increase upon increased avoided expenses for buying mineral fertilizer, and as such, AS1 and AS2a are comparable even if the loss of nitrogen is highest for AS1. This is due to the low price of nitrogen mineral fertilizers. On the other hand, if we compare AS2a and AS2b, AS2b results in the highest financial benefit for the farmers (Figure S6, see Supplementary Materials). This is because the WWTPs receive 100% of the organic household waste in AS2b, resulting in maximum N and P biofertilizers to the farmers (Supplementary Materials, Figure S6).

3.3.3. Social Costs and Benefits

The societal cost (I5) may be explained by the increased GHG emissions, resulting from increased organic matter in the influent wastewater, and input to the anaerobic digester tank, in the direction from the reference scenario to AS1, AS2a, and AS2b.
The total benefits for society are explained by avoided health costs due to the substitution of mineral fertilizers with a higher content of cadmium compared to the waste derived fertilizers [21]. The latter is, however, insignificant compared to the societal benefits obtained from an increased soil carbon stock [29,30], i.e., carbon sequestration (Supplementary Materials, Figure S7).
The societal benefits from avoided process emissions due to avoided production of mineral fertilizers are not included in the presented CBA. Likewise, the avoided fossil emissions from the substitution of coal-based energy production with green energy production is not included. The latter is, however, reflected in the revenue structure (Supplementary Materials, Figure S2).
The results of the unit (net) social cost, shows that WWTPs in the reference scenario perform better than the alternative scenarios, mainly due to a reduction in the amount of greenhouse gas production and lower levels of nitrogen leakage (Supplementary Materials, Figure S8).
The societal benefits from avoided health costs obtained from substituting mineral fertilizers is insignificant compared to the shadow price of carbon sequestration as well as the subsidies for green heat and electricity production (Supplementary Materials, Figures S2 and S7).

3.3.4. System Level Performance

In absolute numbers, the total cost and benefits increases in the direction of the reference scenario < AS1 < AS2a < AS2b for both WWTPs. However, all scenarios results in net revenue. The unit system level net benefit (I8), i.e., the sum of benefits for society per m3 of wastewater influent, shows that AS2 scenarios deliver the highest benefits for society.
The dimension of the biopulp technology, the biogas plant, and the cost structure could jointly determine the optimal WWTP investment choice. As such, the ROI is optimum when the amount of external carbon in the ingestate corresponds to approximately 37% of the total amount of the D-OF collected and transported by truck to Marselisborg WWTP in AS2b (Supplementary Materials, Figure S3).
Combined economic and environmental performance at the system level reveals that scenario AS2b delivers the highest mitigation of climate change, resulting from the higher production of biowaste-based fertilizers substituting mineral fertilizers (Supplementary Materials, Figure S9).
The optimum amount of external carbon added as the ingestate at the Egaa WWTP biogas plant is estimated to be approximately 56% of the total amount of the organic fraction of household waste (D-OF) collected and transported by truck to Egaa WWTP in AS2b.
As such, the optimum amount of dry matter organic waste received at the two WWTPs corresponds to a total of around 90% of the organic household waste (D-OF) within Aarhus municipality.

4. Conclusions

In this study, we examined the environmental performance as well as the costs and benefits for the different stakeholders and the whole system considering two alternative ways to treat household waste in the city of Aarhus. Four waste management scenarios have been analyzed and in this section we discuss the main conclusions deduced from our analysis.
Overall, AS2b has the best environmental performance when looking at the mitigation of freshwater eutrophication (FE), climate change (CC), and carcinogenic human toxicity (HTc). When looking at fossil depletion (FD), marine eutrophication (ME), terrestrial ecotoxicity (TE), and non-carcinogenic human toxicity (HTnc), the reference scenario performs better than alternative scenarios. When looking at the human toxicity results from ReCiPe, a similar performance is obtained for all scenarios.
The answer to whether the use of resources in biowaste is improved upon diverting D-OF away from WtE towards WWTPs with anaerobic sludge treatment is that it is positive if we look at reducing the process emissions from mineral fertilizer production (CC and FE) while increasing the self-supply from waste-derived fertilizers. Furthermore, a reduction in carcinogenic emissions is obtained (HTc).
When looking at the decreased performance in FD, the answer, in the short term, would be no. However, in the long-term, when the electricity mix for Denmark will be based on wind, photovoltaic, and wood, AS2b will have the best performance in mitigation FD; thanks to the increased substitution of mineral fertilizers, the alternative scenarios will perform better than the reference scenario.
Regarding HTnc and TE, the decreased performance is of concern and solutions would need to be found in terms of eliminating increased externalities from waste-based fertilizer production. One solution could be struvite production [21,31], which was not included in the analyses.
From an environmental and energetic point of view, food waste collection and transportation by trucks is preferable compared to FWDs. When looking at the sum of all the costs and benefits to measure the whole welfare-economic effects, AS2 generates better results compared to AS1 and the reference scenario. Furthermore, AS2 scenarios show the best environmental performance and upon balancing the amount of external carbon so that the cost of biopulp production is lower than the increased revenue from the increased resource efficiency of receiving external carbon. Therefore, AS2 scenarios are the best choice both from the environmental and economic point of view.
Overall, when considering the uncertainty in the extra cost that may be associated to the installation of FWDs, it seems that separate collection of the organic waste for combined biogas and fertilizer production is the most flexible, robust, and less risky economic solution.
The optimal scale of the biogas plant depends on the cost structure at the whole system level as discussed in Section 3.3.4. For the present case study, economic viability is optimal in the AS2 scenarios. Furthermore, upon implementation of struvite production, or similar environmentally innovative technologies for the return of high quality fertilizers, the AS2 scenarios will increase their economic performance significantly. In such a case, the conclusions are even stronger towards the AS2 scenarios, i.e., separate collection of organic waste, transported by truck to the WWTPs, pre-processed by biopulp production prior to being used for biogas and fertilizer production. However, struvite production may result in a lower return of organic natural fertilizers and less societal benefits in terms of climate change mitigation through increased soil carbon sequestration.
This study supports a comparative assessment of societal benefits and business economic indicators and environmental performance of decentralized short-chained food waste valorization systems within the H2020 project DECISIVE (www.decisive2020.eu), expanding the biobased production beyond fertilizer and biogas according to the concept of economy of scope.

Supplementary Materials

The following are available online at https://0-www-mdpi-com.brum.beds.ac.uk/2071-1050/10/10/3742/s1, Table S1: System level Life Cycle Inventory. The values reported refer to all the waste (commercial and domestic) combusted in the WtE and all the wastewater treated in the two WWTPs according to the scenarios, Table S2: Input-output inventory for the two wastewater treatment plants included in the waste and wastewater management systems, Table S3: Distribution of the waste categories in organic and fossil fractions1. Table S4: FWD installation percent based on an increase in COD in the influent of 25%, Table S5: Detailed result from the LCIA of the three scenarios for the impact categories climate change (CC) in units of [kg CO2 eq.], Fossil depletion (FD) in units of [kg oil eq.], human toxicity (HT) in units of [kg 1,4-DB eq.], Terrestrial ecotoxicity (TE) in units of [kg 1,4-DB eq.] freshwater eutrophication (FE) in units of [kg P eq.], marine eutrophication (ME) in units of [kg N eq.], Table S6: Detailed result from the LCIA of the four scenarios for the Stepwise impact categories Global Warming (GW), Human Toxicity carcinogens (HTc), Human Toxicity non-carcinogens (HTnc) and Eutrophication Aquatic (EA) in Euro2003, Table S7: Unit prices of market and non-market goods in the economic analysis, Table S8: The fixed cost of eight plants [mill DKK], Table S9: Shadow prices of environmental outputs, [DKK/ton], Figure S1: Structure of costs for WWTPs in different scenarios, Figure S2: Structure of revenues for WWTPs in different scenarios, Figure S3: Return on Investment as function of the amount of external carbon in the ingestate at Marselisborg WWTP, Figure S4: Return on Investment as function of the amount of external carbon in the ingestate at Egaa WWTP, Figure S5: Energy outputs of different external carbon inputs, Figure S6: Farmers’ benefit structure in the different scenarios, Figure S7: Social benefit structure of WWTPs in the different scenarios, Figure S8: Social cost structure of WWTPs in the different scenarios, Figure S9: Radar graph of system level environmental performances for the reference and alternative scenarios (aggregated visualization of total results in Figure 4a–f) together with the whole benefit; i.e. net revenue. All value normalized in the range 0–1, Figure S10: Radar graph of economic performances of Marselisborg (a) and Egaa (b) in different scenarios.

Author Contributions

Conceptualization, M.T. and R.-G.C.; methodology and formal analysis, M.S., M.T., D.R., D.C. and R.-G.C.; Investigation, M.T. and R.-G.C.; data curation, M.S., M.T., D.C. and R.-G.C.; writing—original draft preparation, M.T. and R.-G.C.; writing—review and editing, M.T., D.R. and D.C.; visualization, M.S., D.C. and R.-G.C.; funding acquisition, M.T.

Funding

This project has received funding from project Resource Efficient cities implementing Advanced smart city solutions (READY, contract No. 609127) under the EU’s 7th Framework Program for research, technological development and demonstration and partly by the DECISIVE project funded by the European Union’s Horizon 2020 research and innovation program under Grant Agreement N° 689229.

Acknowledgments

The authors are grateful for discussions, knowledge exchange and support in deriving the Life cycle inventory data from the READY project partners from AffaldVarme, Peter Balslev from Aarhus Vand and GEMIDAN (ecogi.dk).

Conflicts of Interest

The authors declare no conflict of interest. The founding sponsors had no role in the design of the study; in the collection, analyses, or interpretation of data; in the writing of the manuscript, and in the decision to publish the results.

References

  1. COM/2011/012. A Roadmap for Moving to a Competitive Low Carbon Economy in 2050. Available online: https://eur-lex.europa.eu/LexUriServ/LexUriServ.do?uri=COM:2011:0112:FIN:EN:HTML (accessed on 15 October 2018).
  2. Intergovernmental Panel on Climate Change (IPCC). 2018. Special Report on Global Warming of 1.5 °C (SR15). Available online: http://www.ipcc.ch/ (accessed on 15 October 2018).
  3. Aarhus Kommunes Klimaindsats er Baseret på Kommunens Klimastrategi og Klimaplan 2016–2020. Available online: https://gogreenwithaarhus.dk/klimaplan/ (accessed on 15 October 2018).
  4. Thomsen, M.; Ottosen, T.W.; Drejer, L.N. Analyse af potentialer for ressourceudnyttelse i vand- og spildevandsforsyningen (English title: Analysis of Potentials for Resource Utilization in Water and Wastewater Supply). Danish Nature Agency, Ministry of Environment, 2015. ISBN 978-87-7091-954-8. Available online: https://ecoinnovation.dk/media/130961/analyse-af-potentialer-for-ressourceudnyttelse-i-vand-og-spildevandsforsyningen.pdf (accessed on 15 October 2018).
  5. Thomsen, M.; Seghetta, M.; Mikkelsen, M.H.; Gyldenkærne, S.; Becker, T.; Caro, D.; Frederiksen, P. Comparative life cycle assessment of biowaste to resource management systems—A Danish case study. J. Cleaner Prod. 2017, 142, 4050–4058. [Google Scholar] [CrossRef]
  6. Chavez, C.S.; Caro, D.; Thomsen, M. Potential transfer of biowaste management technology from developed to developing countries: A Danish-Mexican case study. Front. Energy Syst. Policy 2018. submitted. [Google Scholar]
  7. Danish Water and wastewater association (DANVA). Køkkenkværne: Energi-, Miljø- og Driftsmæssige Konsekvenser ved Brug i Boliger (English title: Food Waste Disposers: Energetic, Environmental and Operational Consequences upon Use in Private Households). 2011. ISBN 978-87-92651-05-1. Available online: https://www.danva.dk/media/2831/20110811-rapport-koekkenkvaernsrapport-lf.pdf (accessed on 15 October 2018).
  8. Bentzen, G.; Smit, A.B.; Bennett, D.; Webster, N.J.; Reinholt, F.; Sletholt, E.; Hobsont, J. Controlled dosing of nitrate for prevention of H2S in a sewer network and the effects on the subsequent Treatment Processes. Wat. Sci. Tech. 1995, 31, 293–302. [Google Scholar] [CrossRef]
  9. Nilsson, P.; Lilja, G.; Hallin, P.-O.; Petersson, B.A.; Johansson, J.; Pettersson, J.; Karlen, L. Waste Management at the Source Utilizing Food Waste Disposers in the Home; a Case Study in the Town of Staffanstorp; Dept. Environmental Engineering, University of Lund: Lund, Sweden, 1990. [Google Scholar]
  10. De Koning, J.; Van der Graaf, J.H.J.M. Kitchen Food Waste Disposers, Effects on Sewer System and Wastewater Treatment; Technical University Delft: Delft, The Netherlands, 1996. [Google Scholar]
  11. Cassirer, T.; Luthman, T.; Safi, I.; Svanmo, J.; Talebi, Z.S. Avfallskvarnar - Ett hållbart alternativ för ökad biogasproduktion vid Käppalaverket? (English title: Waste disposers—A viable option for increasing biogas production at Käppala WWTP?). Project Report Chemical Engineering KTH Chemical Engineering Högskoleingenjörsutbildningen 2008. Available online: http://www.lf-mola.se/pdf/2008/Avfallskvarnar-Ett_hallbart_alternativ_for_okad_biogasproduktion_vid_Kappalaverket_2008.pdf (accessed on 15 October 2018).
  12. Riber, C.; Petersen, C.; Christensen, T.H. Chemical composition of material fractions in Danish household waste. Waste Manag. 2009, 29, 1251–1257. [Google Scholar] [CrossRef] [PubMed]
  13. KomTek Miljø af 2012 A/S. Available online: http://www.komtek.dk (accessed on 12 October 2018).
  14. Iacovidou, E.; Ohandja, D.-G.; Gronow, J.; Voulvoulis, N. The Household Use of Food Waste Disposal Units as a Waste Management Option: A Review. Critical Reviews in Environmental Science and Technology 2012, 42, 1485–1508. [Google Scholar] [CrossRef]
  15. Weidema, B.P.; Bauer, C.; Hischier, R.; Mutel, C.; Nemecek, T.; Reinhard, J.; Vadenbo, C.O.; Wernet, G. The ecoinvent database: Overview and methodology, Data quality guideline for the ecoinvent database version 3. 2013. Available online: www.ecoinvent.org (accessed on 15 October 2018).
  16. Goedkoop, M.; Heijungs, R.; Huijbregts, M.; De Schryver, A.; Struijs, J.; van Zelm, R. ReCiPe 2008, a Life Cycle Impact Assessment Method Which Comprises Harmonised Category Indicators at the Midpoint and the Endpoint Level. Report 1, Characterization. Ministry of Housing, Special Planning and the Environment, 2013; p. 133. Available online: http://www.lcia-recipe.net (accessed on 12 October 2018).
  17. Weidema, B.P.; Hauschild, M.Z.; Jolliet, O. Preparing characterisation methods for endpoint impact assessment. Available online: https://lca-net.com/publications/show/preparing-characterisation-methods-endpoint-impact-assessment/ (accessed on 15 October 2018).
  18. Frischknecht, R.; Jungbluth, N.; Althaus, H.; Bauer, C.; Doka, G.; Dones, R.; Hischier, R.; Hellweg, S.; Humbert, S.; Kӧllner, T. Implementation of Life Cycle Impact Assessment Methods. Data v2.0. Ecoinvent Report No. 3. 2007. Available online: https://inis.iaea.org/search/search.aspx?orig_q=RN:41028089 (accessed on 15 October 2018).
  19. IPCC Intergovernmental Panel on Climate Change. The Physical Science Basis. Contribution of Working Group I to the 4th Assessment Report of the IPCC; Solomon, S., Qui, D., Manning, M., Chen, Z., Marquis, M., Averyt, K.B., Tignor, M., Miller, H.L., Eds.; Cambridge University Press: Cambridge, UK; New York, NY, USA, 2007. [Google Scholar]
  20. Weidema, B.P. Using the budget constraint to monetarise impact assessment results. Ecol. Econ. 2009, 68, 1591–1598. [Google Scholar] [CrossRef]
  21. Pizzol, M.; Smart, J.C.R.; Thomsen, M. External costs of cadmium emissions to soil: A drawback of phosphorus fertilizers. J. Cleaner Prod. 2014, 84, 475–483. [Google Scholar] [CrossRef]
  22. Pizzol, M.; Møller, F.; Thomsen, M. External costs of atmospheric lead emissions from a waste-to-energy plant: A follow-up assessment of indirect neurotoxic impacts via topsoil ingestion. J. Environ. Manag. 2013, 121, 170–178. [Google Scholar] [CrossRef] [PubMed]
  23. World Coal Institute. The Coal Resource. A Comprehensive Overview of Coal. 2009. Available online: http://www.worldcoal.org/file_validate.php?file=coal_resource_overview_of_coal_report (accessed on 15 October 2018).
  24. Chadwick, M.J.; Highton, N.H.; Lindman, N. Environmental Impacts of Coal Mining and Utilization; Pergamon Press: Oxford, UK, 1987; ISBN 0-08-031427-9. [Google Scholar]
  25. Niero, M.; Pizzol, M.; Bruun, H.G.; Thomsen, M. Comparative life cycle assessment of wastewater treatment in Denmark including sensitivity and uncertainty analysis. J. Cleaner Prod. 2014, 68, 25–35. [Google Scholar] [CrossRef]
  26. Pizzol, M.; Christensen, P.; Schmidt, J.A.; Thomsen, M. Eco-toxicological impact of “metals” on the aquatic and terrestrial ecosystem: A comparison between eight different methodologies for Life Cycle Impact Assessment (LCIA). J. Cleaner Prod. 2011, 19, 687–698. [Google Scholar] [CrossRef]
  27. Pizzol, M.; Christensen, P.; Schmidt, J.A.; Thomsen, M. Impacts of “metals” on human health: A comparison between nine different methodologies for Life Cycle Impact Assessment (LCIA). J. Cleaner Prod. 2011, 19, 646–656. [Google Scholar] [CrossRef]
  28. Evans, T.D.; Andersson, P.; Wievegg, A.; Carlsson, I. Surahammar—A case study of the impacts of installing food waste disposers in fifty percent of households. Water Environ. J. 2010, 24, 309–319. [Google Scholar] [CrossRef]
  29. Brady, M.V.; Hedlund, K.; Cong, R.-G.; Hemerik, L.; Hotes, S.; Machado, S.; MAttsson, L.; Schulz, E.; Thomsen, I.K. Valuing supporting soil ecosystem services in agriculture: A natural capital approach. Agronomy J. 2015, 107, 1809–1821. [Google Scholar] [CrossRef]
  30. Cong, R.-G.; Hedlund, K.; Andersson, H.; Brady, M. Managing soil natural capital: An effective strategy for mitigating future agricultural risks? Agric. Syst. 2014, 129, 30–39. [Google Scholar] [CrossRef]
  31. Jensen, M.D.; Tychsen, P.; Thomsen, M.; Martinsen, L.; Hasler, B. Bæredygtig Udnyttelse af Fosfor fra Spildevand. En Operativ Vejledning til de Danske Vandselskaber (Sustainable Use of Phosphorous in Wastewater. An Operational Guide for the Danish Water Sector). Ministry of Environment, Environmental Protection Agency, 2015. ISBN 978-87-93283-94-7. Available online: https://www2.mst.dk/Udgiv/publikationer/2015/03/978-87-93283-94-7.pdf (accessed on 15 October 2018).
Figure 1. Visualization of the common systemic framework of life cycle assessment (LCA) and Cost-Benefit Analysis (CBA).
Sustainability 10 03742 g001
Figure 2. Location of the three energy-producing plants included in the Aarhus city case study.
Sustainability 10 03742 g002
Figure 3. Visualization of total cumulative energy demand (CED) for the four scenarios analyzed.
Sustainability 10 03742 g003
Figure 4. Visualization of the environmental performance of four waste management scenarios according to the ReCiPe impact categories: Climate Change (CC), Fossil Depletion (FF), Human Toxicity (HT), Terrestrial Toxicity (TE), Marine Eutrophication (ME), and Freshwater Eutrophication (FE).
Sustainability 10 03742 g004
Figure 5. Visualization of the environmental performance of four waste management scenarios according to Stepwise 2006 impact categories: Global Warming Fossil, Human Toxicity Carcinogens, Human Toxicity Non-carcinogens, and Aquatic Eutrophication. All results expressed in Euro2003.
Sustainability 10 03742 g005
Figure 6. Plant level contribution analysis for the impact category of Climate Change (ReCiPe impact assessment method).
Sustainability 10 03742 g006
Table 1. System level total net energy balance [MWh].
PlantREFAS1AS2aAS2b
WtE—Heat603,699590,052590,052516,700
WtE—Electricity71,65270,03270,03261,326
WWTP Egaa—Heat30003733422210,791
WWTP Egaa—Electricity37004592594818,031
WWTP Marselisborg—Heat14,54717,26719,08043,447
WWTP Marselisborg—Electricity54696454911528,715
Total Heat621,246611,052613,355570,939
Total Electricity80,82181,07985,095108,072
Total energy702,067692,131698,450679,011
Total Heat—Change *-−10,194−7891−50,307
Total Electricity—Change *-258427527,251
Total Energy—Change *-−9936−3617−23,056
Change in heat production—% **-−2%−1%−9%
Change in Electricity production—% **-0.3%5%25%
Change total energy—% **-−1.4%−0.5%−3%
* The change in heat, electricity, and total energy production of the system level given in absolute amounts of energy production and in % change compared to the reference system (Figure 1). ** The % change in heat, electricity, and total energy production of the systems, AS1, AS2a, and AS2b, compared to the reference system (Figure 1).
Table 2. Monetary evaluation of plants within three scenarios for different stakeholders.
I1. Plants’ Return on Investment (%)I2. Plants’ Unit Return
(DKK/m3 Wastewater)
I3. Plants’ Return on Investment (%)
Internalizing the FWD Costs 1
I4. Plants’ Unit Return (DKK/m3 Waste water) Internalizing the FWD Costs 1I5. Unit Social Net Cost
(DKK/m3 Wastewater)
I6. Unit Farmers’ Benefit
(DKK/m3 Wastewater)
I7. Households’ Costs
(DKK/Household)
I8. Unit System Benefit
(DKK/m3 Wastewater)
I9. Unit System Benefit in Total
(Weights:Maselisborg = 0.7; Egaa = 0.3)
Plants within the three Scenarios
REF-Marselisborg (2026)’10.698.5510.698.550.350.09n.a.8.299.06
REF-Egaa49.3910.9149.3910.910.110.06n.a.10.86
AS1-Marselisborg10.908.6210.40 18.22 10.380.11167.097.958.94
AS1-Egaa122.7011.62116.92 111.07 10.140.07167.0911.24
AS2a-Marselisborg10.638.5010.638.500.380.12n.a.8.329.29
AS2a-Egaa121.7511.63121.7511.630.140.08n.a.11.57
AS2b-Marselisborg10.308.2310.308.230.60.31n.a.7.949.08
AS2b-Egaa123.7511.81123.7511.810.270.19n.a.11.73
1 Only the percent and absolute values for ROI due to internalisation of the FWDs, i.e., values in the AS1 scenarios are changed.

