Analyzing the Long-Term Service Life of MEP Using the Probabilistic Approach in Residential Buildings

1
Division of Architecture and Civil Engineering, Kangwon National University, 346 Jungang-ro, Samcheok-si, Gangwon-do 25913, Korea
2
Division of Architecture and Architectural Engineering, Hanyang University, 55 Hanyangdaehak-ro, Sangrok-gu, Ansan-si, Gyeonggi-do 15588, Korea
*
Author to whom correspondence should be addressed.
Sustainability 2018, 10(10), 3803; https://0-doi-org.brum.beds.ac.uk/10.3390/su10103803
Submission received: 9 September 2018
/
Revised: 12 October 2018
/
Accepted: 15 October 2018
/
Published: 21 October 2018
Abstract
:Establishing an effective long-term maintenance plan is essential to ensure the sustainability of a building. Among the various components of a building, the mechanical, electrical, and plumbing (MEP) components are complexly affected by various parameters, such as quality and user pattern, with respect to the service life. Besides, these components are replaced at different points in time, which becomes one of the main risks when establishing a maintenance plan for the building. Therefore, it is very important to consider the uncertainty in calculating the service lives of MEP components in a systematic and reasonable way. This study aims to systemize the MEP components of residential buildings and analyze their service life patterns using a probabilistic approach for long-term maintenance planning. The analysis was performed on 54,318 maintenance cases from 1998 to 2017 at 65 twenty-five-year-old rental apartment buildings in South Korea. Before performing the analysis, a service life matrix was established by classifying the MEP components into 12 types and setting the service life time at 6–25 years. Then, the service life distribution was derived for each MEP component. The probabilistic approach can provide information for rational maintenance decision-making regarding each MEP component as well as basic service life settings. Since the performance of the MEP components deteriorates due to various reasons, de facto uncertainty exists in the service life of each component; thus, the probabilistic approach can serve as an important decision-making method. If probabilistic methods are developed by acquiring the cost data in addition to the frequency of maintenance activity used in this study, a more effective long-term maintenance plan can be established.
1. Introduction
The importance of building maintenance is emphasized around the world [1,2] because of the growing complexity of buildings, the increasing proportion of systems in the buildings, higher levels of service, and the higher portion of maintenance costs in the life cycle costs of buildings [3].
In particular, about 30–40% of the total natural resources that are used in industrialized countries are exploited by the building industry. Almost 50% of this energy flow is used for climate conditioning (heating and cooling) in buildings. Almost 40% of the global consumption of materials is for the built environment, and about 30% of the energy use is due to housing [4,5]. Since the energy consumption, energy wastage, emissions, and environmental impacts due to buildings are expected to increase in the next few years, an effective strategy for monitoring and managing the building industry is urgently required [6]. Effective maintenance of the building performance can minimize the adverse effects of buildings on the environment in terms of energy consumption, carbon dioxide emissions, and waste generation [7,8,9]. From this perspective, establishment of a proper maintenance plan is important for maintenance managers [10].
In South Korea, the proportion of buildings that have deteriorated due to aging is considerably high. In 2016, the number of buildings older than 30 years was 2,543,217 out of a total of 7,043,733 buildings (36%). Recently, public concern regarding the increase of aged buildings has been rising in the country and it is a pressing matter to find a solution to respond to the rapid increase in maintenance costs.
“Service life” is the period in which the required performance is met or exceeded [11]. The International Standardization Organization (ISO) standard series on service life planning for buildings and constructed assets (ISO 15686) developed by ISO/TC59/SC14, as well as the European Union thematic network on performance-based building (PeBBu), respond at least partly to the European Union Construction Product Directive (CPD) [12]. The concept of service life planning aims to enable managers to have an effective maintenance strategy based on the performance requirements. The requirements may concern a variety of issues, ranging from lifecycle costs and technical performance to environmental considerations [11]. In other words, the service life planning of buildings and their components can lead to improved accuracy of the maintenance plans. In turn, this may add value (increased longevity) and lead to a more rational management of the resources invested during their service life [13]. However, the service life of deteriorating buildings is affected by the uncertainties associated with the load effect, material properties, mechanical and environmental stressors, damage occurrence, and propagation models, and their associated parameters [14]. For a rational prediction of the service life of buildings, uncertainty should be considered [14,15].
As the main target of the Operation and Maintenance (O&M) management, improving the efficiency of the MEP services is critical for the success of a construction project. In fact, costs associated with the MEP services can be up to 50% of the total investment in large-sized public projects [16]. In buildings, the MEP provides services to people’s daily needs, and hence plays a critical role in creating a comfortable and safe environment for building occupants. MEP engineering is a general term referring to the management of the non-structural functions of a building, such as plumbing, HVAC (heating, ventilation, and air-conditioning), electricity, energy conservation, and elevator maintenance [17]. Therefore, service life estimations for various MEP components are highly important for systematic building maintenance planning [18,19].
In reality, various parameters, such as the quality and user patterns, affect the service life of the MEP components. Hence, the replacement of the components occurs at various times, acting as a risk for the building maintenance plan [14]. In other words, the fixed service life used in conventional maintenance plans has a limitation to reflect the uncertainty when predicting the service life of the MEP components [20,21].
Many studies developed models to predict the life cycle of building components based on the probabilistic concepts [15,22]. The conventional literature on such probabilistic prediction models targets a single component or a material. However, a systematic maintenance plan must be established by comprehensively considering the service life patterns of various building components. This study aims to systematize various MEP components targeting the residential buildings and analyze the service life patterns of various components using a probabilistic methodology.
The primary contributions to the maintenance strategy of MEP components are as follows. First, the loss distribution approach (LDA) is used to create service life distributions by considering the de facto uncertainty in the performance of MEP components. Based on these distributions, a framework for analyzing the service life patterns is proposed. Second, the frequency distribution of each cell of a service life matrix is derived to provide information about the importance of maintenance of MEP components at each time. Such information contributes to the establishment of an efficient long-term maintenance plan. Third, the frequency distribution and service life distribution are combined to set the service life at a more realistic representative value, and various information for rational maintenance decision-making regarding each MEP component are provided by presenting the periodicity, concentration, and time of maintenance activity.
2. Literature Review
MEP engineering consists of more than 10 subsystems, including heating, ventilation, and air conditioning (HVAC), power distribution, telecommunication, automatic control, fire protection, and water supply and drainage. Each system is a complex combination of several components, such as equipment, pipes, and wires, as well as a number of logic relationships among these components [23]. To minimize the construction errors caused by the complexity of MEP works, many studies have attempted to develop efficient coordination strategies and technical methods from the early design phase itself. In particular, many studies have been conducted recently on MEP based building information modeling (BIM) technology to improve the efficiency of MEP coordination [24,25,26,27,28]. Basically, BIM is an effective technical environment in which the sustainability of a building can be ensured by managing various information generated over the entire life cycle of the building in a unified manner and continuously utilizing it in each phase [29]. In this regard, BIM technology is studied in terms of not only enhancing the efficiency of MEP coordination in the design and construction phases, but also maintaining the MEP components [17,23]. For example, Hu et al. (2018) proposed a set of solutions, including an approach for building the logic chain automatically, a mechanism of identifying and grouping equipment, and an algorithm for generating a Geographic Information System (GIS) map based on the building information during the delivery of MEP management in the operation and maintenance phase [17]. Hu et al. (2016) developed a facility management system for MEP engineering based on multi-scale BIM and examined its in-depth application to the MEP project of a large real-world airport terminal [23]. In other words, BIM technology can improve the efficiency of maintenance work by providing the maintenance manager with as-built information of MEP components, such as topologic information, logic relation, position information, and design performance. Moreover, maintenance strategies are also needed for effectively using the maintenance-related information of MEP components, which is obtained in such a technical environment. Especially, since real users’ pattern, deterioration, and other uncertainty factors exist in the maintenance phase, the studies on maintenance management considering these factors are very important.
From such a perspective, there have been studies discussing the maintenance planning and decision-making processes of buildings [2,30,31,32]. Compared with the construction process, the operation and maintenance periods take most of the time within the lifecycle and consequently incur the highest cost [33]. For this reason, some studies have developed maintenance planning [2] or decision-making models [30,31,32], which could effectively determine the repair time and cost by considering various uncertainty factors. All these studies show that the service life should be considered as one of the essential factors for maintenance management.
In fact, some studies have recognized the importance of service life for maintenance planning, and have proposed service life prediction models for various components of a building [18,34,35,36,37]. However, the majority of those studies dealing with service life prediction models focused on the exterior surface parts, such as the exterior surface of the painted wall [18], various exterior claddings [34], cement-rendered facades [35], ceramic tiling systems [36], and natural stone wall claddings [37]. Besides, a regression model was used as the prediction model in most cases. The exterior wall, which not only is a part of the building structure, but also can have various types of finishes, is significantly affected by environmental factors; therefore, service life planning is very important to ensure durability of the wall. On the other hand, MEP, which is dealt with in this study, shows various service life patterns based on both environmental factors and occupants’ use patterns. In this regard, MEP is as important as the exterior wall from the perspective of maintenance planning. In addition, regression models, which are used for service life prediction, have limitations in solving the uncertainty in service life pattern analysis.
Some studies have applied probabilistic models to reflect the uncertainties caused by various factors during maintenance. Most of these studies have focused on the durability of concrete structures [38,39,40,41]. In other words, apart from the above studies on service life prediction models, there have been studies on concrete components. Among the maintenance tasks, the operation management of MEP components has a critical role, and it could account for up to 60% of the total cost [33]. In addition, MEP systems are critical to the functions of a building, and therefore they must meet the performance expectations with regard to comfort and safety [24]. Although systematizing various MEP components and analyzing the service life pattern of each component are identified to be very important, only a few studies have dealt with this issue. Therefore, the service life pattern analysis proposed in this study will be beneficial for effective maintenance planning, since it considers the uncertainties while overcoming the limitations of fixed service life or inspection plans for the MEP components of residential buildings, which comprise the largest proportion of buildings in South Korea.
3. Research Methodology
This study aims to derive the implications of long-term maintenance planning that reflects uncertainties using the periodic maintenance frequency data for the MEP components of residential buildings. To achieve the objective, the study modified LDA, which is used for operational risk management in the financial sector, to analyze the service lives of MEP components. LDA is mainly used by insurance companies for managing risk and estimating losses caused by accidents. As this method is frequently dealt with by academic studies on operational risk management, insurance companies or banks use it for a statistical analysis based on data of real accidents. For this reason, LDA is more explanatory and logical than other methods of assessing operational risks [42].
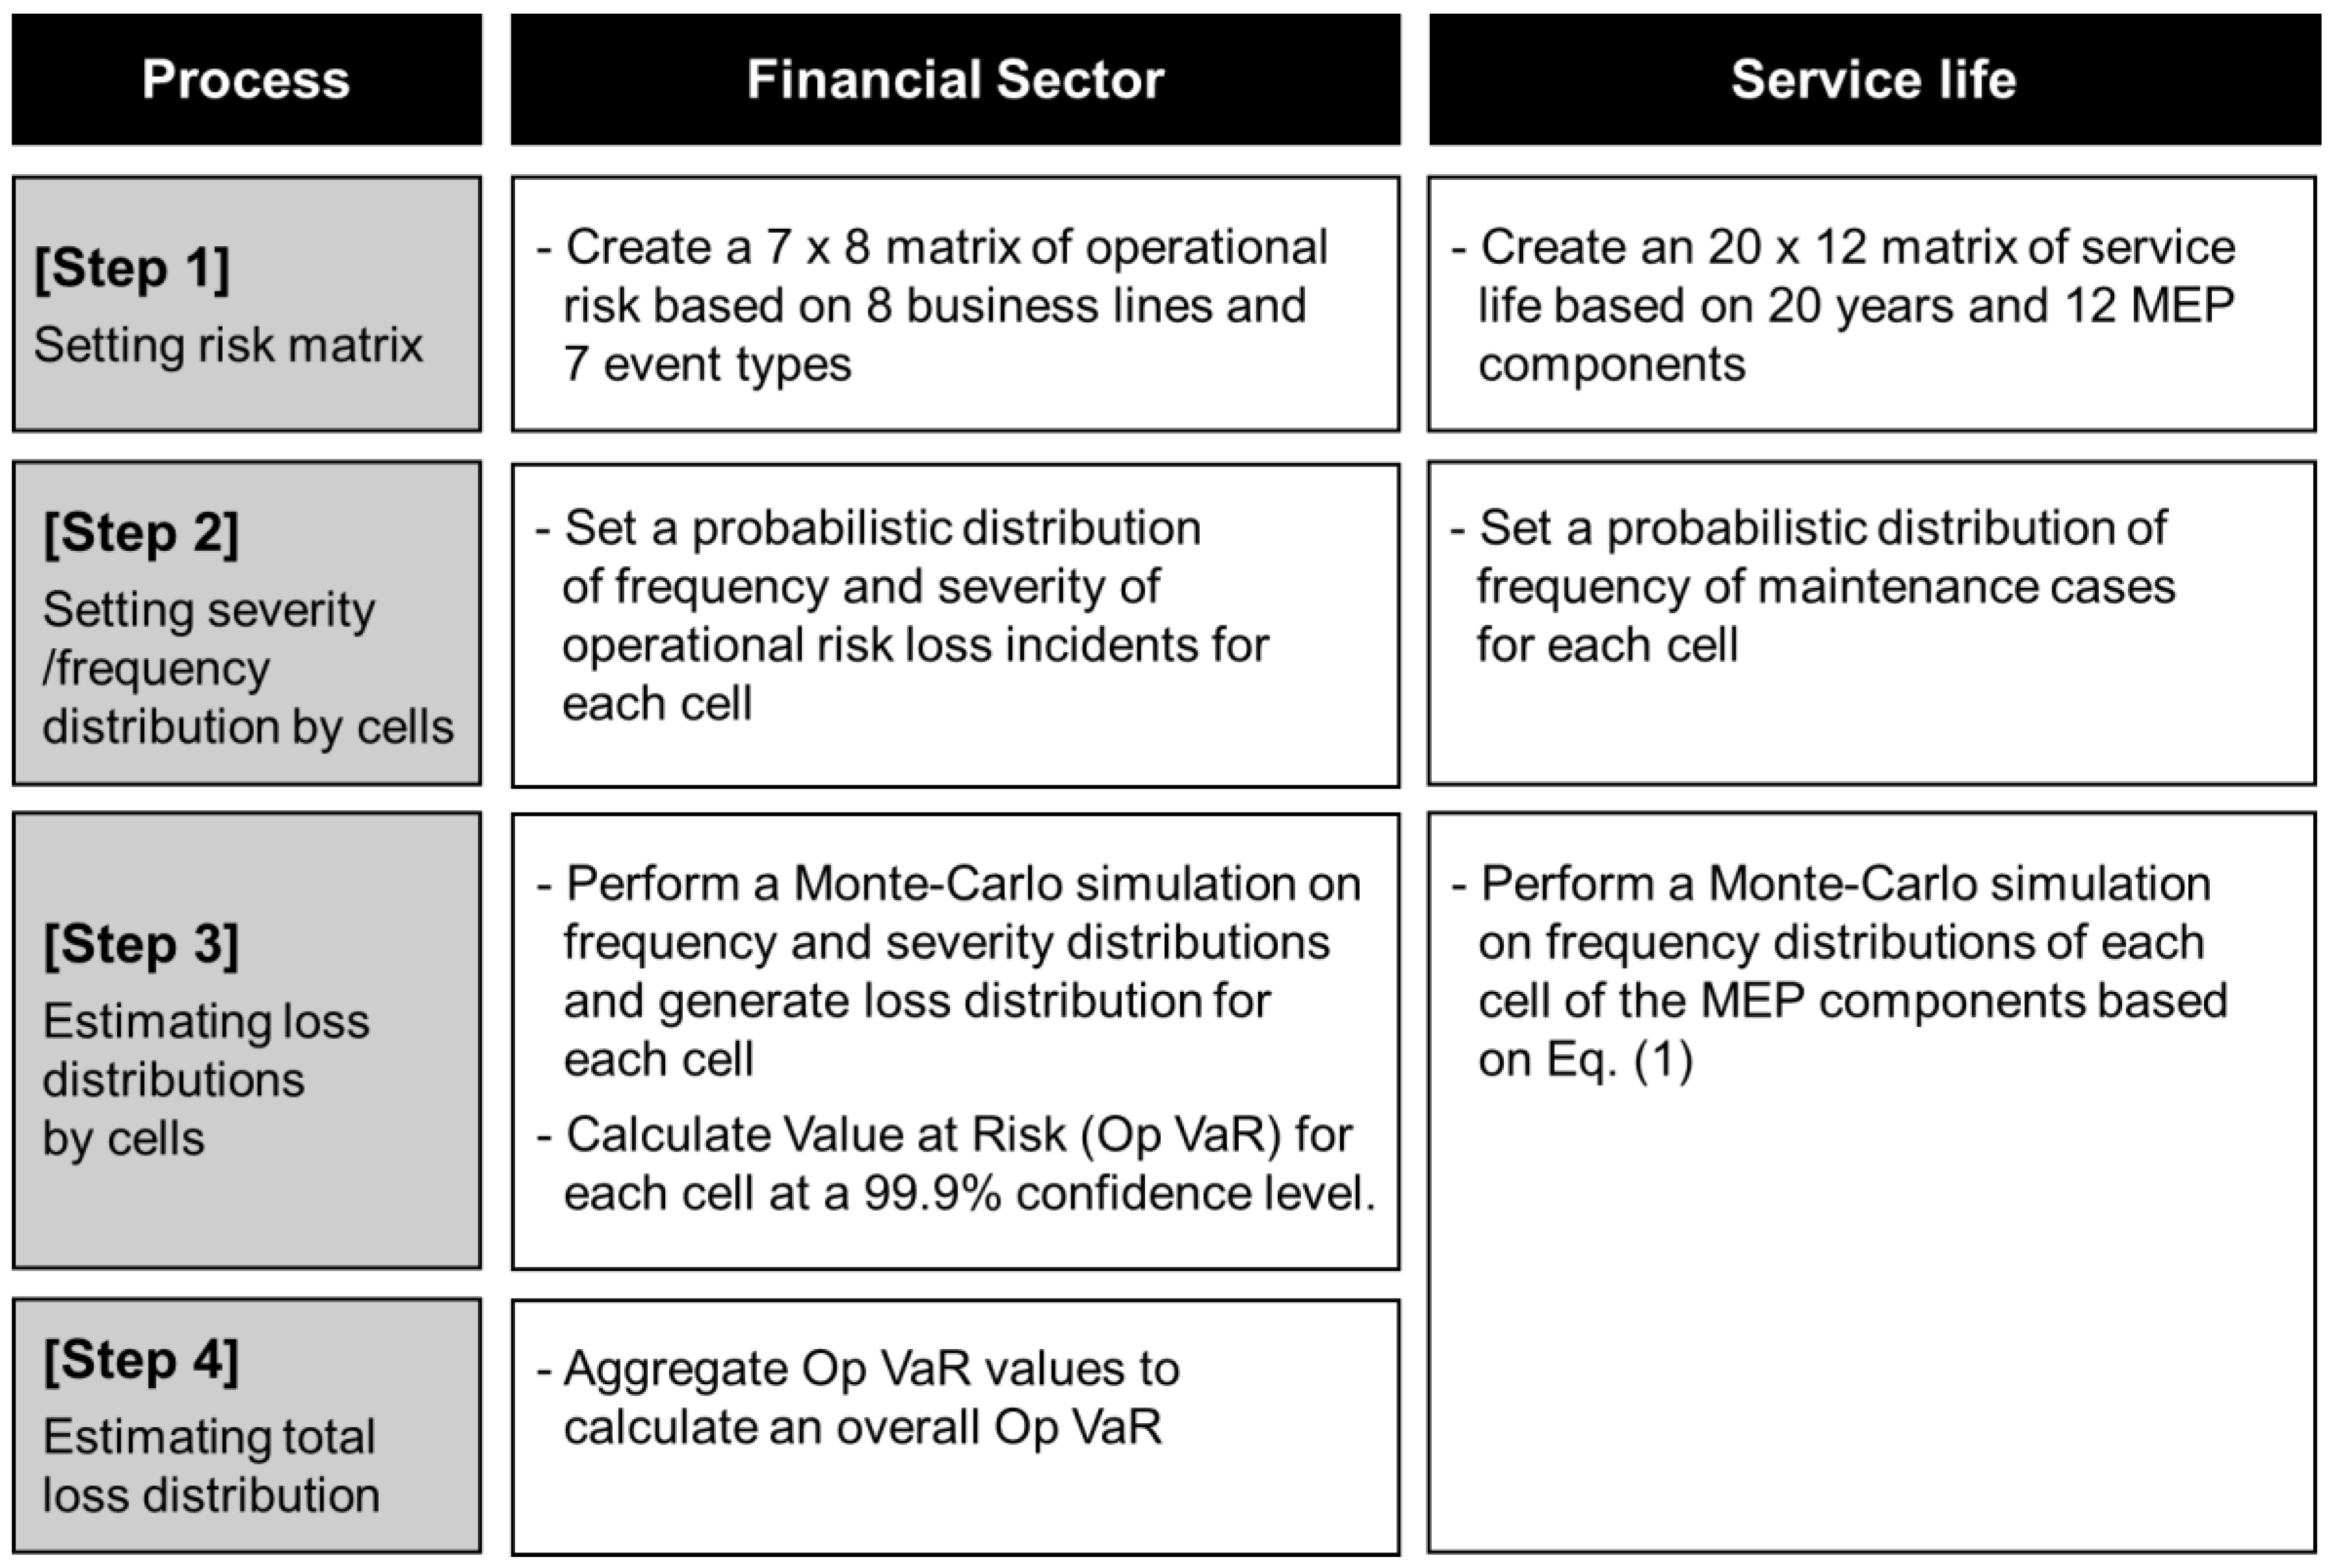
Figure 1 compares the process of applying LDA for measuring operational risks in the financial sector and the modified LDA process used in this study for analyzing service life.
To apply LDA, a risk matrix needs to be first defined. In the financial sector, operational risks are classified into eight business lines and seven event types. Thus, a 7 × 8 risk matrix is constructed. Such a matrix configuration is flexible and set according to detailed measurement levels and factors. This study set up and used a service life matrix based on a 20 year maintenance period and 12 MEP components, and surveyed frequencies of each cell using existing maintenance cases. As a next step, the existing LDA is used to set the frequency and severity distributions of each cell of the matrix. The frequency indicates how often a risk occurs. Severity is calculated based on the cost of the risk. This study has set only the frequency distribution because the service life of an MEP component can be represented over a period with high frequency. Subsequently, the existing LDA is used to perform a Monte Carlo simulation with the frequency and severity distributions of each cell. A total loss distribution is thus derived by integrating the loss distributions of each cell, which are obtained from the Monte Carlo simulation. This study derives the service life distributions of each MEP component using Equation (1), which is obtained from a weighted average of the annual frequencies. In other words, unlike the existing LDA, which derives a single distribution for all cells, the current method obtains a service life distribution by integrating cells that are linked to each MEP component.
- = component’s service life time;
- = component’s frequency distribution at time, t; and
- = period, t.
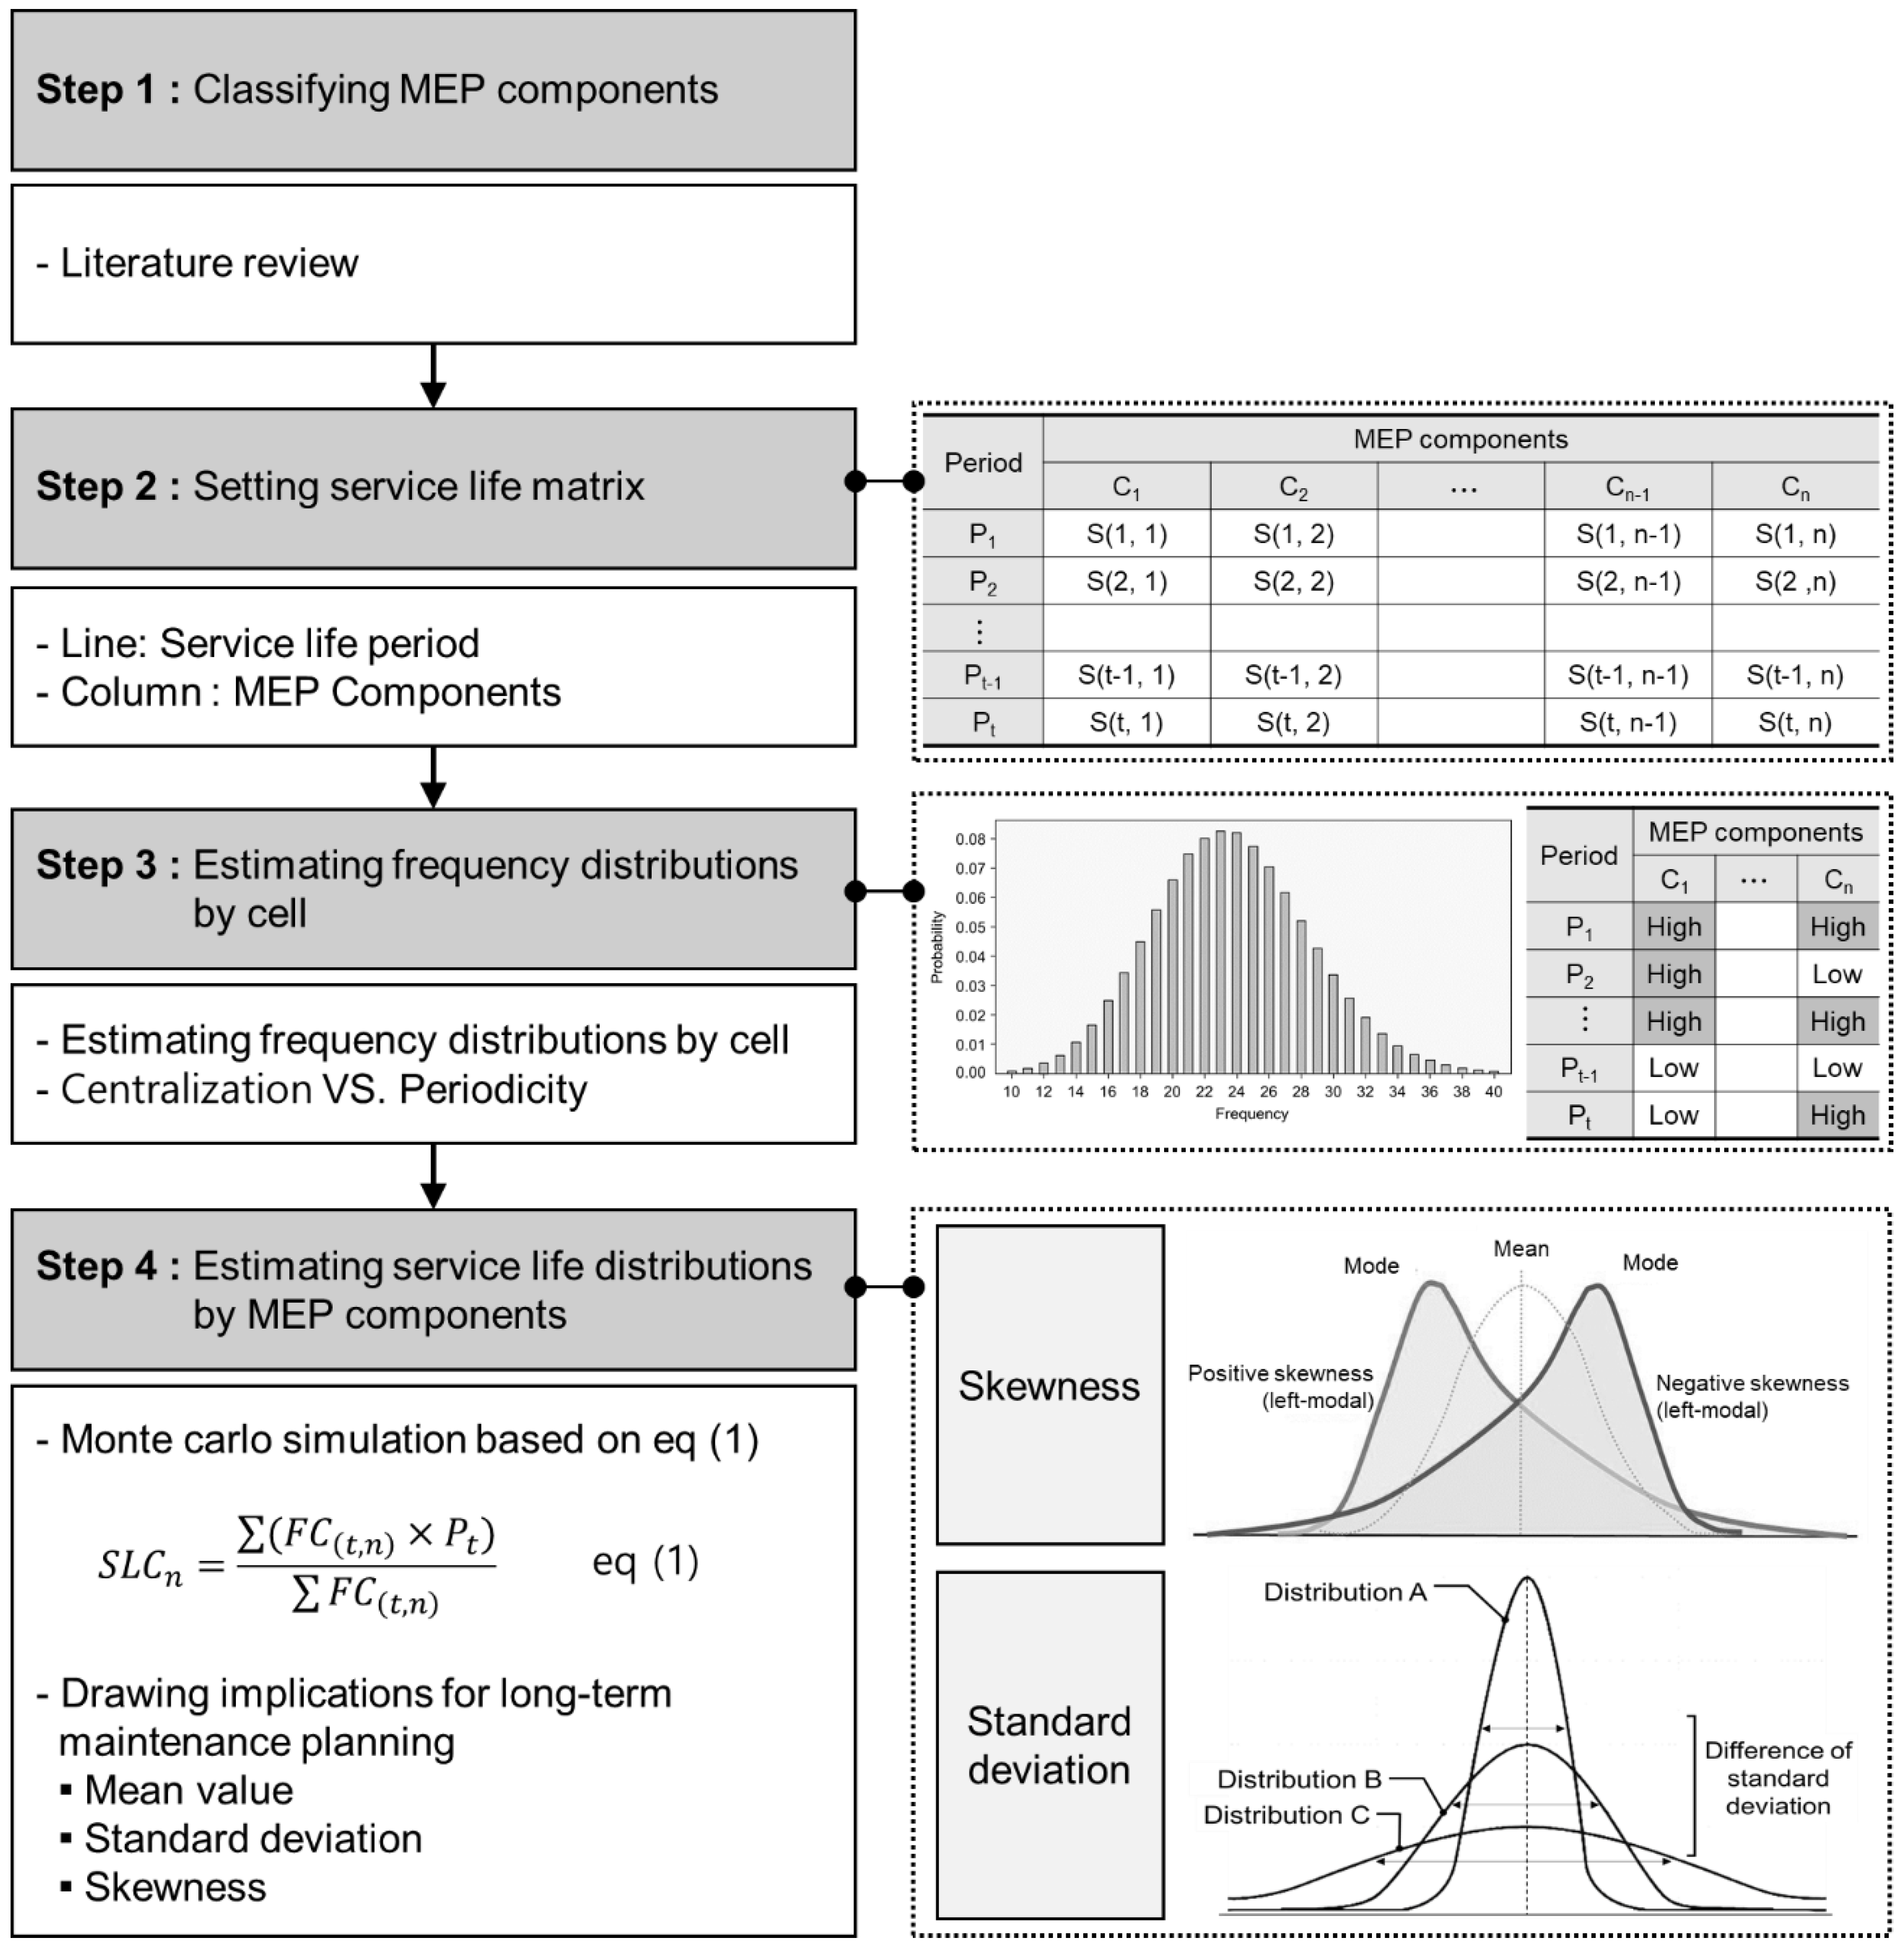
Details on the specific method of utilizing the LDA that has been adopted in the financial sector for analyzing service lives of MEP components are described in Figure 2 below.
(1) Previous studies related to the conventional MEP systems were investigated and the MEP components were selected.
(2) The selected MEP components and the repair times were used to establish a matrix-type classification system. This classification system was used to investigate the repair frequency after the construction of the MEP components. The frequency investigation was performed for each cell of the service life matrix.
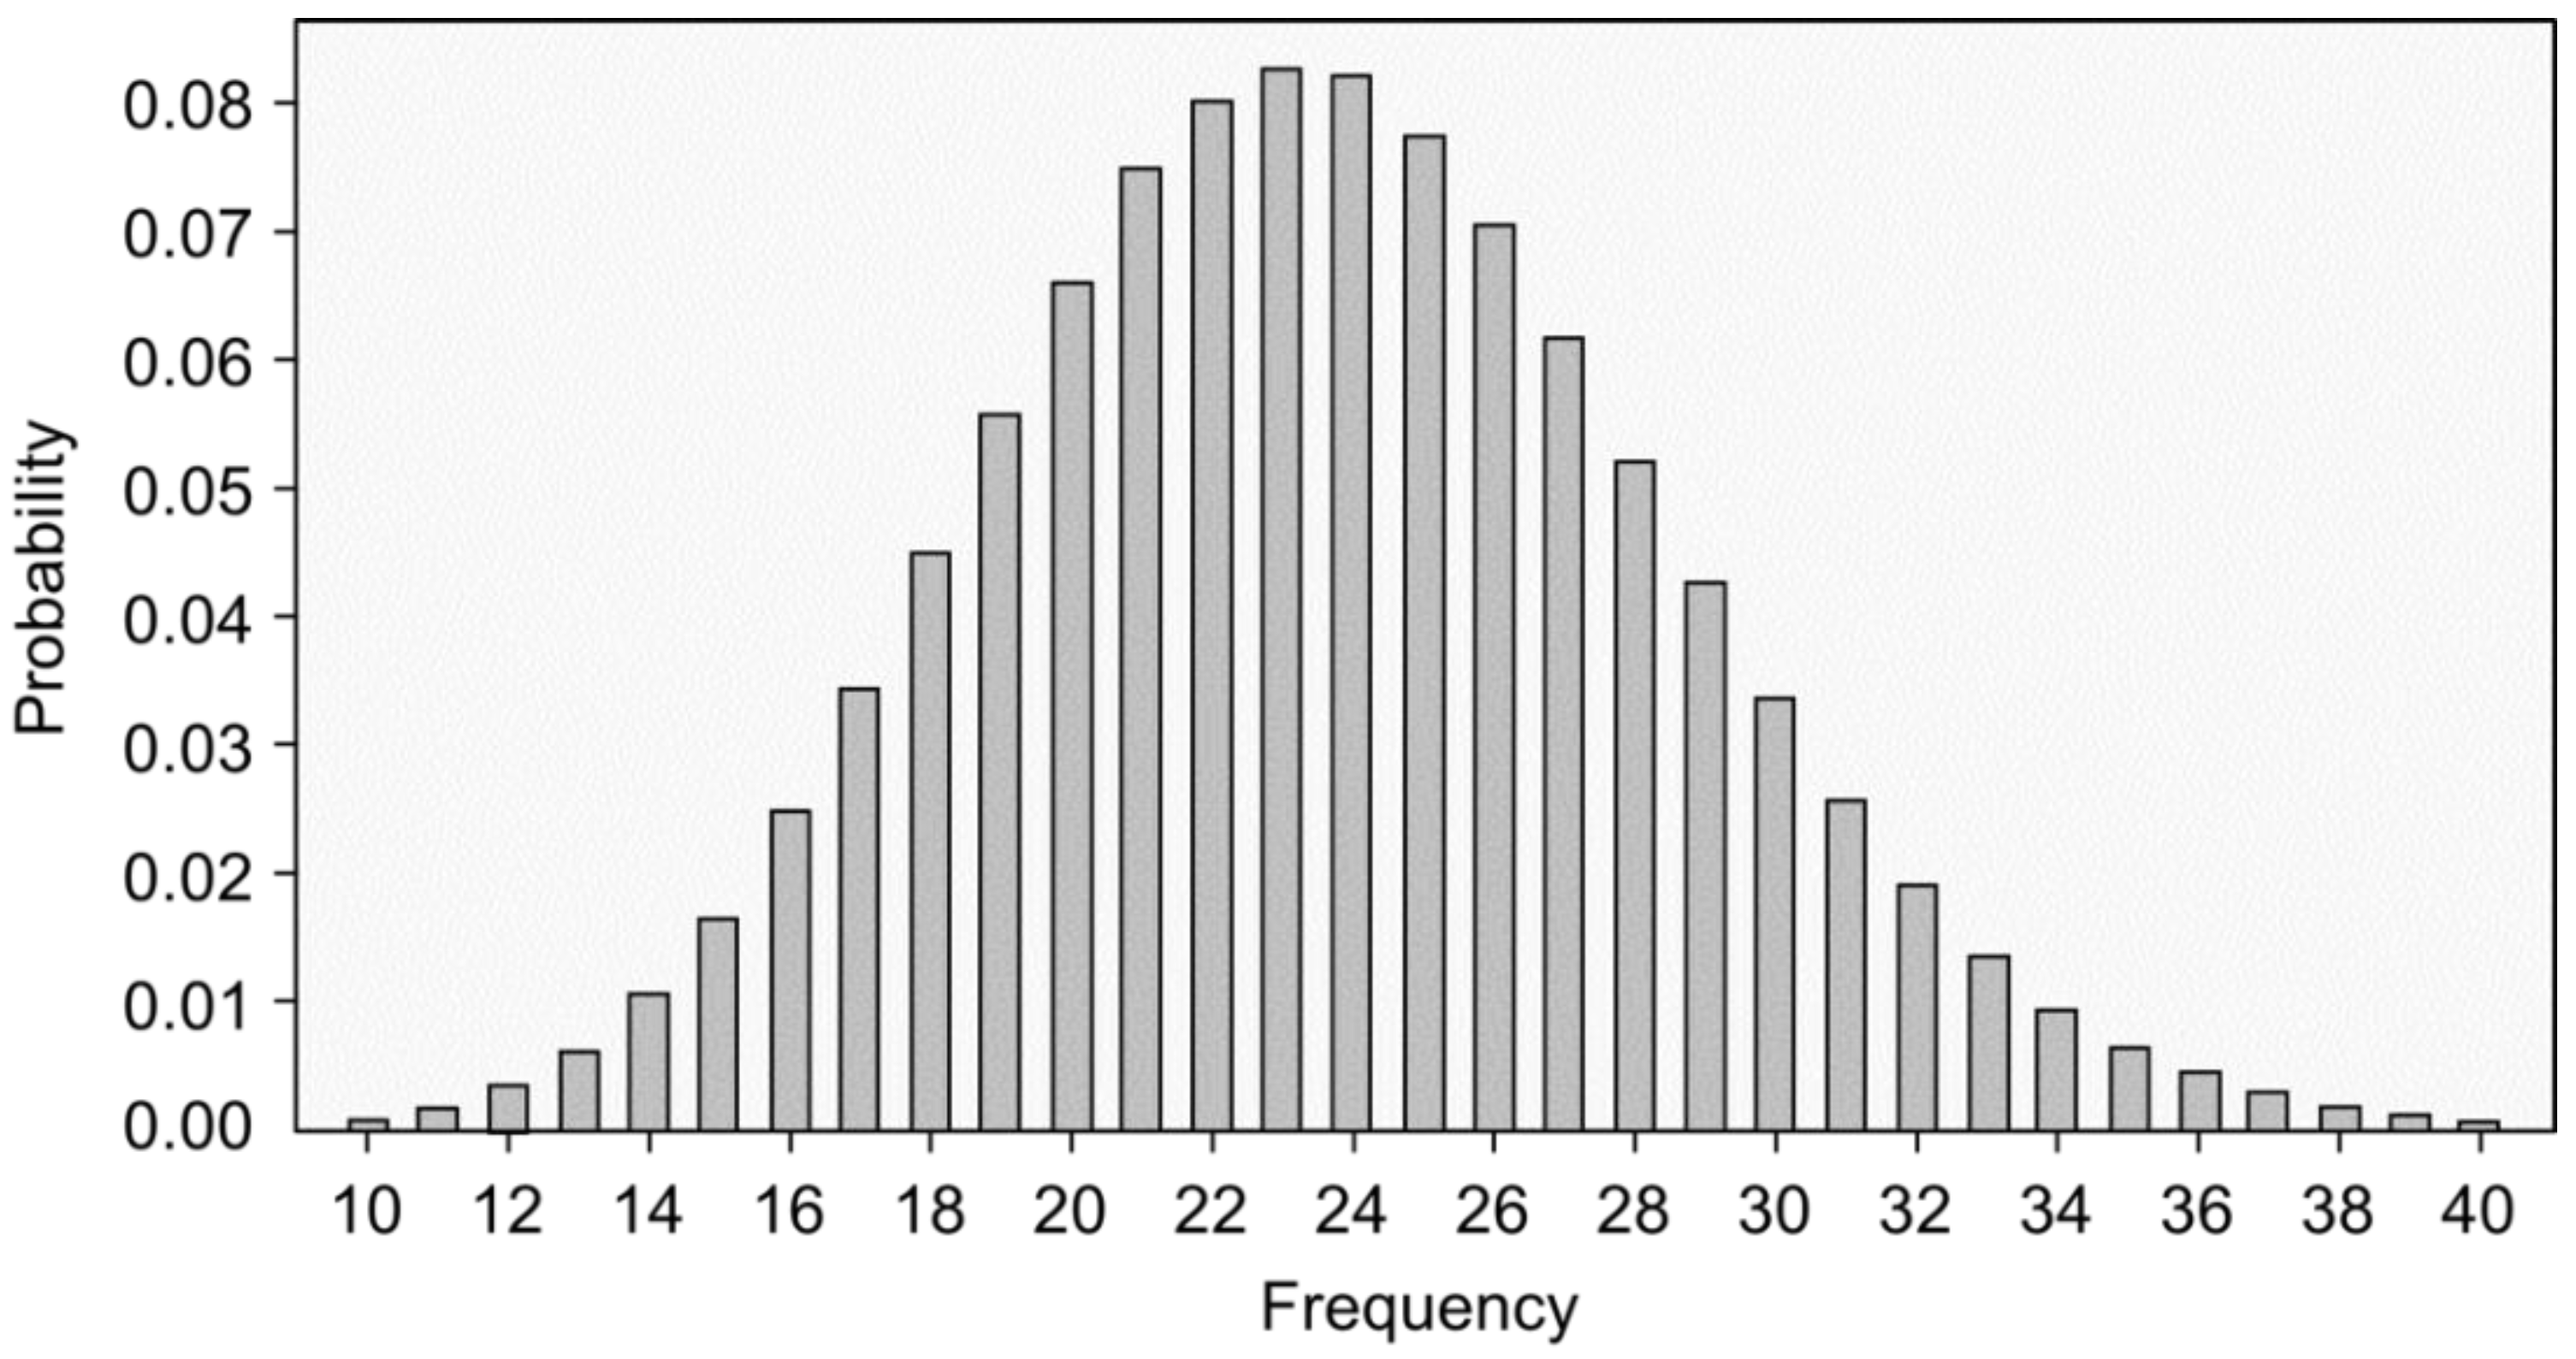
(3) Based on the results of frequency investigation, the frequency distribution was fitted and set up for each cell. The frequency distribution of each cell approximates a Poisson distribution, which is generally used for discrete distributions [43]. Using the frequency distribution, the time point where the frequency of each MEP component was high was identified (Figure 2) and whether the maintenance activity was performed periodically or centrally was determined.
(4) A Monte Carlo simulation was performed for the frequency distribution of each cell of the MEP components based on Equation (1), which is an equation that weight-averages the annual frequencies of MEP components and can be used to set the service life by deriving the conventional deterministic average value.
In the proposed method, after inputting the derived frequency distribution instead of inputting a single value for each variable, the Monte Carlo simulation is performed and the probability distributions that use various combinations of cases are derived. If the derived service life distribution of each MEP component is used, the level of uncertainty can be identified by deriving the standard deviation in addition to simply confirming the mean value, or the centralization of maintenance activity can be effectively identified through skewness. This will overcome the limitations of the conventional methods that simply set the service life time and contribute to the long-term maintenance planning.
4. Experimental Study
4.1. Data Collection
To analyze the service life patterns of MEP components probabilistically, based on the results of the previous studies listed in Table 1, the MEP components were classified into 12 types: Heating/air conditioning (M1), ventilation (M2), lighting (E1), power (E2), socket (E3), detector (E4), camera (C1), communication (C2), broadcast (C3), pipeline (P1), valve (P2), and water pump (P3). The maintenance cases for conventional residential buildings, i.e., the data source of this study, were for apartment buildings constructed 25 years ago. Since the maintenance data started to be collected six years after the completion of the construction, the service life time was set as 6–25 years.
Next, the service life matrix was established as shown in Table 2 and the frequency distribution for each cell on the matrix was calculated based on the conventional residential building cases.
In this study, 54,318 cases of maintenance, which were performed during the 20-year period from 1998 to 2107 in 65 twenty-five-year-old apartment buildings in South Korea, were investigated and allocated to the service life matrix (Table 3). The electrical components accounted for a large proportion (55.4%) of the total maintenance costs (Table 3). Particularly, frequent repairs were required for lighting (31.9%) and socket (22.5%) components because there are many lighting and socket items in residential buildings, and moreover, they are directly used by residents, causing frequent breakdowns. The problems of water leakage, corrosion, and noise occurred in heating/air conditioning (14.1%) or pipe (10.0%) components due to aging.
The maintenance frequency was relatively low for ventilation (1.9%), power (0.7%), detectors (0.3%), camera (0.1%), communication (1.8%), valves (2.3%), and water pumps (0.4%) because the number of units installed in the buildings was relatively small and the residents did not control these components directly. Maintenance was performed on these components because of the problems due to aging or equipment malfunction.
4.2. Estimating Frequency Distributions by Cell
The frequency distribution of each cell was derived as shown in Figure 3 and the mean values for frequency distribution of each cell are shown in Table 4. As confirmed in Table 4, most cells had a high frequency because the lifetime of MEP components varied greatly due to natural aging and users’ negligence, which was different from the simple design of the lifetime of each MEP component. This means that problems will occur if a simple deterministic service life is set up when establishing a long-term maintenance plan.
Table 4 shows that the largest number of repairs occurred 16 years after the installation of lighting (E1) and socket (E3) components. The number of repairs after eight and 12 years was also high despite being smaller than those after 16 years. Therefore, in the long-term, maintenance activities are required periodically, every three to four years, for lighting (E1) and socket (E3) components. Furthermore, for broadcast (C3), the largest frequency of repair was observed 17 years after installation, and similar to lighting and socket, repair activities were required periodically, every four to five years. Heating/air conditioning (M1) units and pipes (P1) required frequent repairs 19 and 22 years after installation, respectively. Rather than showing periodicity, the repair frequency was centralized at a certain time for heating/air conditioning and pipes.
Ventilation (M2) units and valves (P2) showed relatively low repair frequencies and most maintenance activities occurred seven and 19 years after installation, respectively, and were centralized at certain times. Power (E2), detectors (E4), cameras (C1), communication (C2), and water pumps (P3) showed very low repair frequencies, which were either centralized at certain times or had periodicity.
4.3. Estimating Service Life Distributions of MEP Components
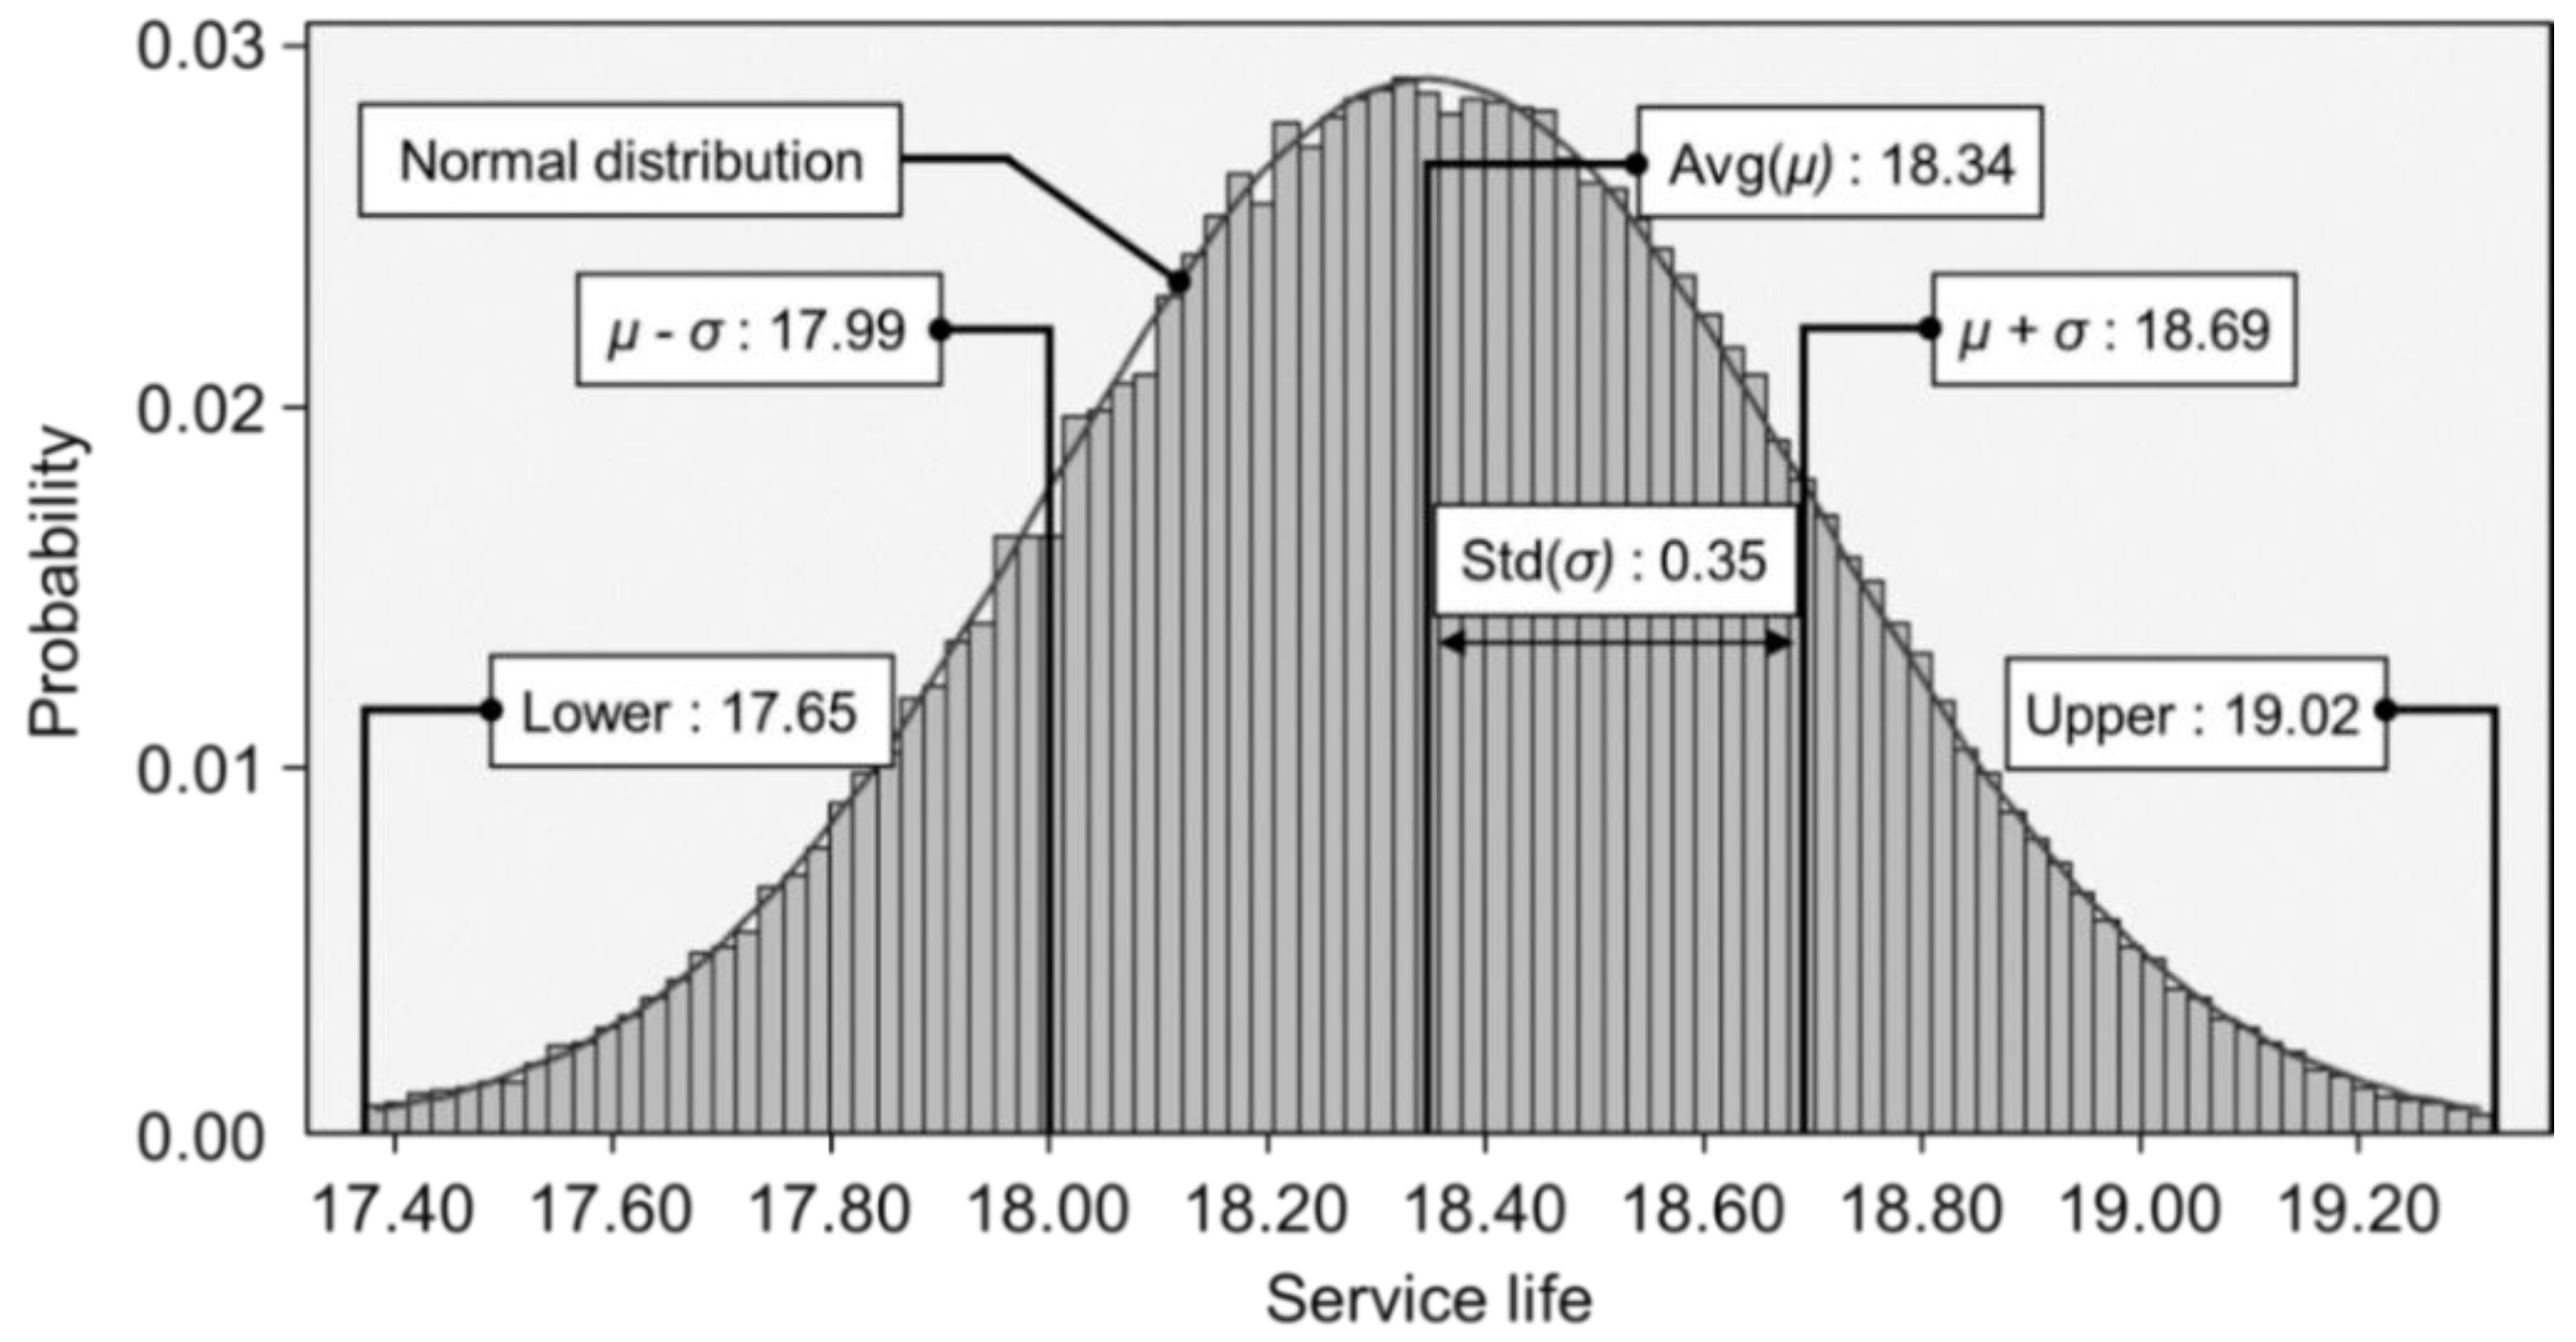
A Monte Carlo simulation was performed based on Equation (1) to produce a service life distribution for each component (Figure 4, Table 5). Examining the components with a relatively high frequency in descending order, the service life distributions of heating/air conditioning (M1), lighting (E1), socket (E3), broadcast (C3), and pipes (P1) were the most suitable components that follow a normal distribution. Moreover, these components had smaller standard deviations than the other components. Therefore, the mean value can be used to set the long-term service life.
Service life distributions of detector (E4), camera (C1), and water pump (P3) show that their standard deviations are very large, indicating that these components have a very uncertain service life compared to the designed performance. Therefore, even if a long-term service life is set for each component, it is necessary to seek various countermeasures in case of a faulty performance, e.g., securing parts and manufacturer’s warranty.
The comparison of the service life distributions derived in this study with those of the conventional MEP components reported officially in South Korea (Table 5) shows that no official service life exists for lighting (E1), socket (E3), and communication (C2) components. In general, those reported officially in South Korea are the service life of the MEP components corresponding to the public/community use. Therefore, unlike the other MEP components, lighting (E1), socket (E3), and communication (C2) components are installed for individual households and used solely by residents; they are repaired whenever they break down without setting an official service life. However, in the rental apartment buildings used as analysis targets in this study, the service life distribution results can be used by Operation and Maintenance (O&M) managers for long-term maintenance planning because the service life of most components must be considered. The officially reported service life and the results of this study were similar for some components, e.g., ventilation (M2), power (E2), broadcast (C3), and pipes (P1), while there were some other components that showed relatively large differences.
Table 6 summarizes the implications of the results in maintenance planning. First, since a low standard deviation means that the uncertainty is relatively low, the service life time is set at the mean value of the distribution during the planning of the maintenance schedule. In contrast, when the standard deviation is high, it is highly likely that an error can occur even if the service life time is set at the mean value of the distribution; thus, continuous maintenance activities are required. Since skewness is positive or negative depending on the occurrence of high frequency, the centralization of maintenance activities can be decided accordingly. Furthermore, to confirm the centralized maintenance activity time or the need for periodic maintenance, the average of the frequency distributions was tested for each cell in Table 4.
5. Discussion
This study systematized the various MEP components of residential buildings and analyzed the service lives of various components through a statistical approach. Some of the existing studies have analyzed patterns of decreasing durability in concrete structures in a statistical manner [38,39,40,41]. These studies assumed a time-dependent deterioration curve and developed a service life prediction model by utilizing the existing mathematical models of durability of concrete structures. This trend is based on the fact that the material properties of concrete are the most important deterioration factors. In other words, exterior concrete walls of bridges or buildings gradually deteriorate in performance owing to environmental factors, but are less affected by use patterns. In practice, the service life planning for various components of a building is affected by the requirements of users, investors, and regulators, or the work patterns of product manufacturers and designers. Accordingly, if the service life is analyzed using a theoretical model, the result does not represent the actual service life pattern [11].
Based on such a perspective, the LDA-based model of this study conducted an analysis using real data to solve this problem. Because there are many influencing factors on economic matters that a risk management approach based on a theoretical model cannot reflect satisfactorily with respect to real market trends, the LDA model is actively used in the financial sector. As is clear from the results of this study, MEP components have various service life patterns, and maintenance activities are dynamically carried out at each time (Table 4 and Table 6). This indicates the importance of a data-driven model for analyzing the service lives of MEP components.
In addition, the existing LDA model constructs a risk matrix by classifying risks into eight business lines and seven event types. Accordingly, the LDA model enables a detailed analysis by setting a loss distribution for each cell of the risk matrix or integrating cells according to business line or a combination of every type [43]. Because the service life matrix of this study was configured based on the 20 year maintenance period and 12 MEP components, it cannot accurately identify the causes of maintenance activities. This limitation is attributable to the limit of data acquisition. However, if data are classified on the basis of cause of a single MEP component with a service life matrix being set up based on the data classification, this limitation will be solved.
The service life distribution in this study has a limitation of analyzing the severity of actual maintenance work. In other words, this study has not sufficiently considered weights that are necessary to determine whether maintenance work is required, and if needed, to what extent. The existing studies have not set any detailed weights to determine the necessity of maintenance for deteriorating structures. However, there is one study that considers the necessity of maintenance [39]. The LDA model defines such a weight as the cost of each activity. This study has a limitation in collecting cost data for various maintenance cases. If the cost data of each maintenance case is acquired and weights or severity distributions for each maintenance activity can be determined, more data will be generated and available for maintenance planning. Moreover, maintenance cost will be probabilistically analyzed, which is the primary goal of maintenance managers or owners.
6. Conclusions
The goal of this study was to systematize various MEP components in residential buildings and understand the implications for the establishment of long-term building maintenance plans through analysis of the service life patterns of the components using a probabilistic approach.
To this end, 54,318 maintenance activity data were acquired for 65 twenty-five-year-old residential buildings in South Korea and the frequency distributions were derived based on a probabilistic approach to overcome the limitations of the conventional deterministic methods and reflect the uncertainties in the service life times of MEP components.
The results showed that there were some time points when the centralized maintenance activity was needed in accordance with the specific service life times for heating/air conditioning, ventilation, power, and pipe components, which had relatively small uncertainties. Lighting, socket, communication, broadcast, and valve components needed periodical maintenance even when the service life time was set at the mean of the service life distribution. Since it was difficult to set up a performance deterioration time for detectors, cameras, and water pumps, continuous maintenance activities were required during the entire lifecycle. However, detectors, cameras, and water pumps occupy a very small portion of the maintenance data used in this paper. Therefore, standard deviations of these components may appear relatively high owing to the insufficient number of units in the data. Thus, the repair frequency of these components will be low and relatively less maintenance activity will be needed. Therefore, maintenance managers should identify the importance of MEP components and establish effective long-term maintenance plans.
The conventional service life data reported officially in South Korea are derived using a deterministic approach, but in the probabilistic approach applied in this study, various information can be provided for rational maintenance decision-making with respect to each MEP component in addition to basic service life settings. In other words, since the performance of MEP components can deteriorate in time, de facto uncertainty exists in the service life of each component and the probabilistic approach can be an effective decision-making method.
For establishing a long-term maintenance plan, not only the frequency of maintenance activities, but also the cost is an important factor. Although this study focused on the service life time due to the limitations in data collection, if additional cost data are acquired and probabilistic methods are developed by considering the frequency and cost simultaneously, it will be possible to establish a long-term maintenance plan that has strategic flexibility.
Author Contributions
S.L. developed the concept and drafted the manuscript. Y.A. revised the manuscript and supervised the overall work. All authors read and approved the manuscript.
Funding
This research was supported by Basic Science Research Program through the National Research Foundation of Korea (NRF) funded by the Ministry of Education (NRF-2015R1D1A1A01059286).
Conflicts of Interest
The authors declare no conflict of interest.
References
- Van Winden, C.; Dekker, R. Rationalization of building maintenance by Markov decision models: A pilot case study. J. Oper. Res. Soc. 1998, 49, 928–935. [Google Scholar] [CrossRef]
- Ruparathna, R.; Hewage, K.; Sadiq, R. Multi-period maintenance planning for public buildings: A risk-based approach for climate conscious operation. J. Clean. Prod. 2018, 170, 1338–1353. [Google Scholar] [CrossRef]
- Shohet, I.M.; Puterman, M.; Gilboa, E. Deterioration patterns of building cladding components for maintenance management. Constr. Manag. Econ. 2002, 20, 305–314. [Google Scholar] [CrossRef]
- Roodman, D.M.; Lenssen, N. A Building revolution: How Ecology and Health Concerns Are Transforming Construction; Paper #124; Worldwatch Institute: Washington, DC, USA, 1995. [Google Scholar]
- Stein, R.G. Architecture and Energy; Anchor Press: New York, NY, USA, 1977. [Google Scholar]
- Pulselli, R.M.; Simoncini, E.; Pulselli, F.M.; Bastianoni, S. Emergy analysis of building manufacturing, maintenance and use: Em-building indices to evaluate housing sustainability. Energy Build. 2007, 39, 620–628. [Google Scholar] [CrossRef]
- Blom, I.; Itard, L.; Meijer, A. Environmental impact of dwellings in use: Maintenance of façade components. Build. Environ. 2010, 45, 2526–2538. [Google Scholar] [CrossRef]
- Kwon, S.; Chun, C.; Kwak, R. Relationship between quality of building maintenance management services for indoor environmental quality and occupant satisfaction. Build. Environ. 2011, 46, 2179–2185. [Google Scholar] [CrossRef]
- Park, J.; Hong, T. Maintenance management process for reducing CO2 emission in shopping mall complexes. Energy Build. 2011, 43, 894–904. [Google Scholar] [CrossRef]
- Horner, R.M.W.; El-Haram, M.A.; Munns, A.K. Building maintenance strategy: A new management approach. J. Qual. Maint. Eng. 1997, 3, 273–280. [Google Scholar] [CrossRef]
- Trinius, W.; Sjostrom, C. Service life planning and performance requirements. Build. Res. Inf. 2005, 33, 173–181. [Google Scholar] [CrossRef]
- Council of the European Communities (CEC). Council Directive of 21 December 1988 on the Approximation of Laws, Regulations and Administrative Provisions of the Member States Relating to Construction Products (89/106/EEC); CEC: Brussels, Belgium, 1988. [Google Scholar]
- Mejri, M.; Cazaguel, M.; Cognard, J.Y. A time-variant reliability approach for ageing marine structures with non-linear behavior. Comput. Struct. 2011, 89, 1743–1753. [Google Scholar] [CrossRef]
- Frangopol, D.M. Life-cycle performance, management, and optimization of structural systems under uncertainty: Accomplishments and challenges. Struct. Infrastruct. Eng. 2011, 7, 389–413. [Google Scholar] [CrossRef]
- Cheung, M.S.; Kyle, B.S. Service life prediction of concrete structures by reliability analysis. Constr. Build. Mater. 1996, 10, 45–55. [Google Scholar] [CrossRef]
- Khanzode, A.; Fischer, M.; Reed, D. Benefits and lessons learned of implementing building virtual design and construction (VDC) technologies for coordination of mechanical, electrical, and plumbing (MEP) system on a large healthcare project. J. Inf. Technol. Constr. 2008, 13, 324–342. [Google Scholar]
- Hu, Z.; Tian, P.; Li, S.; Zhang, J. BIM-based integrated delivery technologies for intelligent MEP management in the operation and maintenance phase. Adv. Eng. Softw. 2018, 115, 1–16. [Google Scholar] [CrossRef]
- Chai, C.; De Brito, J.; Gaspar, P.L.; Silva, A. Predicting the Service Life of Exterior Wall Painting: Techno-Economic Analysis of Alternative Maintenance Strategies. J. Constr. Eng. Manag. 2014, 140, 04013057. [Google Scholar] [CrossRef]
- Dias, J.L.; Silva, A.; Chai, C.; Gaspar, P.L.; De Brito, J. Neural networks applied to service life prediction of exterior painted surfaces. Build. Res. Inf. 2014, 42, 371–380. [Google Scholar] [CrossRef]
- Ahmad, S. Reinforcement corrosion in concrete structures, its monitoring and service life prediction—A review. Cem. Concr. Compos. 2003, 25, 459–471. [Google Scholar] [CrossRef]
- Fatami, A.; Yang, L. Cumulative fatigue damage and life prediction theories: A survey of the state of the art for homogeneous materials. Int. J. Fatigue 1998, 20, 9–34. [Google Scholar] [CrossRef]
- Lukic, M.; Cremona, C. Probabilistic optimization of welded joints maintenance versus fatigue and fracture. Reliab. Eng. Syst. Saf. 2001, 72, 253–264. [Google Scholar] [CrossRef]
- Hu, Z.; Zhang, J.; Yu, F.; Tian, P.; Xiang, X. Construction and facility management of large MEP projects using a multi-Scale building information model. Adv. Eng. Softw. 2016, 100, 215–230. [Google Scholar] [CrossRef]
- Korman, T.M.; Fischer, M.A.; Tatum, C.B. Knowledge and Reasoning for MEP Coordination. J. Constr. Eng. Manag. 2003, 129, 627–634. [Google Scholar] [CrossRef]
- Riley, D.R.; Varadan, P.; James, J.S.; Thomas, H.R. Benefit-Cost Metrics for Design Coordination of Mechanical, Electrical, and Plumbing Systems in Multistory Buildings. J. Constr. Eng. Manag. 2005, 131, 877–889. [Google Scholar] [CrossRef]
- Horman, M.J.; Orosz, M.P.; Riley, D.R. Sequence Planning for Electrical Construction. J. Constr. Eng. Manag. 2006, 132, 363–372. [Google Scholar] [CrossRef]
- Lee, G.; Kim, J. Parallel vs. Sequential Cascading MEP Coordination Strategies: A Pharmaceutical Building Case Study. Autom. Constr. 2014, 43, 170–179. [Google Scholar] [CrossRef]
- Wang, L.; Leite, F. Formalized knowledge representation for spatial conflict coordination of mechanical, electrical and plumbing (MEP) systems in new building projects. Autom. Constr. 2016, 64, 20–26. [Google Scholar] [CrossRef]
- Eastman, C.; Teicholz, P.; Sacks, R.; Liston, K. BIM Handbook: A Guide to Building Information Modeling for Owners, Managers, Designers, Engineers, and Contractors; Wiley: Hoboken, NJ, USA, 2007. [Google Scholar]
- Cavalcante, C.A.V.; Alencar, M.H.; Lopes, R.S. Multicriteria Model to Support Maintenance Planning in Residential Complexes under Warranty. J. Constr. Eng. Manag. 2016, 143, 04016110. [Google Scholar] [CrossRef]
- Arif, F.; Bayraktar, M.E.; Chowdhury, A.G. Decision Support Framework for Infrastructure Maintenance Investment Decision Making. J. Manag. Eng. 2016, 32, 04015030. [Google Scholar] [CrossRef] [Green Version]
- Ghodoosi, F.; Abu-Samra, S.; Zeynalian, M.; Zayed, T. Maintenance Cost Optimization for Bridge Structures Using System Reliability Analysis and Genetic Algorithms. J. Constr. Eng. Manag. 2018, 144, 04017116. [Google Scholar] [CrossRef]
- Teicholz, E. Bridging the AEC/FM Technology Gap; International Facility Management Association: Houston, TX, USA, 2004; pp. 1–8. [Google Scholar]
- Shohet, I.M.; Paciuk, M. Service life prediction of exterior cladding components under standard conditions. Constr. Manag. Econ. 2004, 22, 1081–1090. [Google Scholar] [CrossRef]
- Gaspar, P.L.; de Brito, J. Service life estimation of cement-rendered facades. Build. Res. Inf. 2008, 36, 44–55. [Google Scholar] [CrossRef]
- Bordalo, R.; de Brito, J.; Gaspar, P.L.; Silva, A. Service life prediction modelling of adhesive ceramic tiling systems. Build. Res. Inf. 2011, 39, 66–78. [Google Scholar] [CrossRef]
- Silva, A.; de Brito, J.; Gaspar, P.L. Service life prediction model applied to natural stone wall claddings (directly adhered to the substrate). Constr. Build. Mater. 2011, 25, 3674–3684. [Google Scholar] [CrossRef]
- Kliukas, R.; Kudzys, A. Probabilistic durability prediction of existing building elements. J. Civ. Eng. Manag. 2004, 10, 107–112. [Google Scholar] [CrossRef]
- Kim, S.; Frangopol, D.M.; Zhu, B. Probabilistic Optimum Inspection/Repair Planning to Extend Lifetime of Deteriorating Structures. J. Perform. Constr. Facil. 2011, 25, 534–544. [Google Scholar] [CrossRef]
- Kim, S.; Frangopol, D.M.; Soliman, M. Generalized Probabilistic Framework for Optimum Inspection and Maintenance Planning. J. Struct. Eng. 2013, 139, 435–447. [Google Scholar] [CrossRef]
- Silva, A.; Neves, L.C.; Gaspar, P.L.; de Brito, J. Probabilistic transition of condition: Render facades. Build. Res. Inf. 2016, 44, 301–318. [Google Scholar] [CrossRef]
- Ong, M. The Basel Handbook: A Guide for Financial Practitioners; Risk books: London, UK, 2007. [Google Scholar]
- Alenander, C. Operational Risk: Regulation, Analysis and Management; Prentice Hall: Upper Saddle River, NJ, USA, 2007. [Google Scholar]
- Tserng, H.P.; Yin, Y.L.; Jaselskis, E.J.; Hung, W.C.; Lin, Y.C. Modularization and assembly algorithm for efficient MEP construction. Autom. Constr. 2011, 20, 837–863. [Google Scholar] [CrossRef]
- Wang, J.; Wang, X.; Shou, W.; Chong, H.Y.; Guo, J. Building information modeling-based integration of MEP layout designs and constructability. Autom. Constr. 2016, 61, 134–146. [Google Scholar] [CrossRef]
Figure 1.
Loss distribution approach (LDA) processes in the field of economics and in this study.

Figure 2.
Research flow.

Figure 3.
Frequency distribution example—heating/air conditioning, 19 years (S(14.1)).

Figure 4.
Service life distribution example—heating/air conditioning (M1).


Table 1.
Mechanical, Electrical and Plumbing (MEP) system classification.
| Researcher | MEP Classification | |
|---|---|---|
| Tserng et al. (2011) [44] |
|
|
| Wang et al. (2016) [45] |
|
|
| Hu et al. (2018) [17] |
| |
Table 2.
Service life matrix.
| Period | MEP Components a | |||||||||||
|---|---|---|---|---|---|---|---|---|---|---|---|---|
| M1 | M2 | E1 | E2 | E3 | E4 | C1 | C2 | C3 | P1 | P2 | P3 | |
| 6 | S(1,1) | S(1,2) | S(1,3) | S(1,4) | S(1,5) | S(1,6) | S(1,7) | S(1,8) | S(1,9) | S(1,10) | S(1,11) | S(1,12) |
| 7 | S(2,1) | S(2,2) | S(2,3) | S(2,4) | S(2,5) | S(2,6) | S(2,7) | S(2,8) | S(2,9) | S(2,10) | S(2,11) | S(2,12) |
| 8 | S(3,1) | S(3,2) | S(3,3) | S(3,4) | S(3,5) | S(3,6) | S(3,7) | S(3,8) | S(3,9) | S(3,10) | S(3,11) | S(3,12) |
| 9 | S(4,1) | S(4,2) | S(4,3) | S(4,4) | S(4,5) | S(4,6) | S(4,7) | S(4,8) | S(4,9) | S(4,10) | S(4,11) | S(4,12) |
| 10 | S(5,1) | S(5,2) | S(5,3) | S(5,4) | S(5,5) | S(5,6) | S(5,7) | S(5,8) | S(5,9) | S(5,10) | S(5,11) | S(5,12) |
| 11 | S(6,1) | S(6,2) | S(6,3) | S(6,4) | S(6,5) | S(1,6) | S(6,7) | S(6,8) | S(6,9) | S(6,10) | S(6,11) | S(6,12) |
| 12 | S(7,1) | S(7,2) | S(7,3) | S(7,4) | S(7,5) | S(7,6) | S(7,7) | S(7,8) | S(7,9) | S(7,10) | S(7,11) | S(7,12) |
| 13 | S(8,1) | S(8,2) | S(8,3) | S(8,4) | S(8,5) | S(8,6) | S(8,7) | S(8,8) | S(8,9) | S(8,10) | S(8,11) | S(8,12) |
| 14 | S(9,1) | S(9,2) | S(9,3) | S(9,4) | S(9,5) | S(9,6) | S(9,7) | S(1,8) | S(9,9) | S(9,10) | S(9,11) | S(9,12) |
| 15 | S(10,1) | S(10,2) | S(10,3) | S(10,4) | S(10,5) | S(10,6) | S(10,7) | S(10,8) | S(10,9) | S(10,10) | S(10,11) | S(10,12) |
| 16 | S(11,1) | S(11,2) | S(11,3) | S(11,4) | S(11,5) | S(11,6) | S(11,7) | S(11,8) | S(11,9) | S(11,10) | S(11,11) | S(11,12) |
| 17 | S(12,1) | S(12,2) | S(12,3) | S(12,4) | S(12,5) | S(12,6) | S(12,7) | S(12,8) | S(12,9) | S(12,10) | S(12,11) | S(12,12) |
| 18 | S(13,1) | S(13,2) | S(13,3) | S(13,4) | S(13,5) | S(13,6) | S(13,7) | S(13,8) | S(13,9) | S(13,10) | S(13,11) | S(13,12) |
| 19 | S(14,1) | S(14,2) | S(14,3) | S(14,4) | S(14,5) | S(14,6) | S(14,7) | S(14,8) | S(14,9) | S(14,10) | S(14,11) | S(14,12) |
| 20 | S(15,1) | S(15,2) | S(15,3) | S(15,4) | S(15,5) | S(15,6) | S(15,7) | S(15,8) | S(15,9) | S(15,10) | S(15,11) | S(15,12) |
| 21 | S(16,1) | S(16,2) | S(16,3) | S(16,4) | S(16,5) | S(16,6) | S(16,7) | S(16,8) | S(16,9) | S(16,10) | S(16,11) | S(16,12) |
| 22 | S(17,1) | S(17,2) | S(17,3) | S(17,4) | S(17,5) | S(17,6) | S(17,7) | S(17,8) | S(17,9) | S(17,10) | S(17,11) | S(17,12) |
| 23 | S(18,1) | S(18,2) | S(18,3) | S(18,4) | S(18,5) | S(18,6) | S(18,7) | S(18,8) | S(18,9) | S(18,10) | S(18,11) | S(18,12) |
| 24 | S(19,1) | S(19,2) | S(19,3) | S(19,4) | S(19,5) | S(19,6) | S(19,7) | S(19,8) | S(19,9) | S(19,10) | S(19,11) | S(19,12) |
| 25 | S(20,1) | S(20,2) | S(20,3) | S(20,4) | S(20,5) | S(20,6) | S(20,7) | S(20,8) | S(20,9) | S(20,10) | S(20,11) | S(20,12) |
a M1 = Heating/air conditioning; M2 = Ventilation; E1 = Lighting; E2 = Power; E3 = Socket; E4 = Detector; C1 = Camera; C2 = Communication; C3 = Broadcast; P1 = Pipes; P2 = Valve; P3 = Water pump.
Table 3.
Maintenance cases in residential projects.
| Year | MEP Components a | |||||||||||
|---|---|---|---|---|---|---|---|---|---|---|---|---|
| Mechanic (M) | Electric (E) | Electronic (C) | Plumbing (P) | |||||||||
| M1 | M2 | E1 | E2 | E3 | E4 | C1 | C2 | C3 | P1 | P2 | P3 | |
| 6 | 7 | 33 | 4 | 1 | 3 | 0 | 0 | 17 | 1 | 21 | 0 | 0 |
| 7 | 117 | 141 | 117 | 4 | 20 | 10 | 0 | 39 | 568 | 51 | 6 | 2 |
| 8 | 175 | 129 | 1980 | 9 | 1196 | 1 | 2 | 67 | 22 | 77 | 16 | 15 |
| 9 | 57 | 85 | 89 | 11 | 23 | 0 | 6 | 17 | 13 | 55 | 16 | 11 |
| 10 | 54 | 76 | 94 | 7 | 13 | 0 | 0 | 40 | 30 | 52 | 10 | 11 |
| 11 | 47 | 74 | 65 | 4 | 96 | 5 | 0 | 121 | 104 | 63 | 6 | 0 |
| 12 | 310 | 74 | 3332 | 3 | 3189 | 13 | 9 | 47 | 593 | 103 | 97 | 22 |
| 13 | 298 | 72 | 130 | 7 | 47 | 5 | 0 | 37 | 31 | 172 | 76 | 9 |
| 14 | 426 | 30 | 121 | 10 | 34 | 6 | 2 | 61 | 34 | 154 | 39 | 11 |
| 15 | 339 | 16 | 212 | 5 | 69 | 3 | 2 | 56 | 39 | 189 | 48 | 11 |
| 16 | 214 | 24 | 6897 | 9 | 6853 | 7 | 6 | 52 | 52 | 207 | 53 | 2 |
| 17 | 785 | 20 | 462 | 26 | 117 | 32 | 4 | 60 | 4297 | 382 | 153 | 9 |
| 18 | 699 | 34 | 423 | 20 | 100 | 8 | 0 | 49 | 1339 | 547 | 155 | 11 |
| 19 | 1124 | 31 | 512 | 40 | 89 | 20 | 9 | 89 | 73 | 713 | 239 | 20 |
| 20 | 594 | 35 | 456 | 68 | 89 | 9 | 9 | 67 | 119 | 528 | 84 | 13 |
| 21 | 346 | 22 | 206 | 10 | 52 | 1 | 0 | 36 | 58 | 619 | 39 | 6 |
| 22 | 361 | 28 | 75 | 1 | 56 | 3 | 0 | 25 | 28 | 655 | 46 | 9 |
| 23 | 577 | 39 | 790 | 88 | 52 | 2 | 11 | 50 | 88 | 296 | 66 | 9 |
| 24 | 638 | 25 | 979 | 47 | 59 | 8 | 15 | 37 | 43 | 277 | 99 | 11 |
| 25 | 464 | 32 | 402 | 21 | 45 | 29 | 0 | 30 | 55 | 267 | 28 | 20 |
| Subtotal | 7632 (14.1%) | 1020 (1.9%) | 17,346 (31.9%) | 391 (0.7%) | 12,202 (22.5%) | 162 (0.3%) | 75 (0.1%) | 997 (1.8%) | 7587 (14.0%) | 5428 (10.0%) | 1276 (2.3%) | 202 (0.4%) |
| Total | 54,318 (100%) | |||||||||||
a M1 = Heating/air conditioning; M2 = Ventilation; E1 = Lighting; E2 = Power; E3 = Socket; E4 = Detector; C1 = Camera; C2 = Communication; C3 = Broadcast; P1 = Pipeline; P2 = Valve; P3 = Water pump.
Table 4.
Average of frequency distributions by cell.
| Year | MEP components a | |||||||||||
|---|---|---|---|---|---|---|---|---|---|---|---|---|
| M1 | M2 | E1 | E2 | E3 | E4 | C1 | C2 | C3 | P1 | P2 | P3 | |
| 6 | 0.35 | 1.60 | 0.20 | 0.05 | 0.15 | 0.00 | 0.00 | 0.80 | 0.05 | 1.00 | 0.00 | 0.00 |
| 7 | 5.65 | 6.75 | 5.70 | 0.20 | 1.00 | 0.45 | 0.00 | 1.85 | 27.10 | 2.45 | 0.25 | 0.05 |
| 8 | 8.50 | 6.15 | 96.65 | 0.40 | 58.80 | 0.05 | 0.05 | 3.20 | 1.05 | 3.70 | 0.70 | 0.35 |
| 9 | 2.75 | 4.05 | 4.35 | 0.50 | 1.15 | 0.00 | 0.15 | 0.80 | 0.60 | 2.65 | 0.70 | 0.25 |
| 10 | 1.49 | 2.09 | 2.63 | 0.17 | 0.37 | 0.00 | 0.00 | 1.09 | 0.83 | 1.43 | 0.26 | 0.14 |
| 11 | 1.31 | 2.03 | 1.80 | 0.11 | 2.69 | 0.11 | 0.00 | 3.31 | 2.83 | 1.71 | 0.14 | 0.00 |
| 12 | 8.57 | 2.03 | 92.56 | 0.09 | 89.60 | 0.31 | 0.11 | 1.29 | 16.17 | 2.83 | 2.40 | 0.29 |
| 13 | 8.26 | 1.97 | 3.63 | 0.17 | 1.31 | 0.11 | 0.00 | 1.00 | 0.86 | 4.71 | 1.89 | 0.11 |
| 14 | 11.80 | 0.83 | 3.37 | 0.26 | 0.94 | 0.14 | 0.03 | 1.66 | 0.91 | 4.20 | 0.97 | 0.14 |
| 15 | 5.05 | 0.23 | 3.18 | 0.08 | 1.05 | 0.05 | 0.02 | 0.82 | 0.57 | 2.78 | 0.65 | 0.08 |
| 16 | 4.60 | 0.51 | 149.6 | 0.18 | 149.7 | 0.13 | 0.07 | 1.11 | 1.11 | 4.40 | 1.02 | 0.02 |
| 17 | 16.89 | 0.42 | 10.02 | 0.53 | 2.56 | 0.62 | 0.04 | 1.27 | 91.16 | 8.13 | 2.96 | 0.09 |
| 18 | 15.04 | 0.71 | 9.18 | 0.40 | 2.18 | 0.16 | 0.00 | 1.04 | 28.40 | 11.64 | 3.00 | 0.11 |
| 19 | 24.20 | 0.67 | 11.11 | 0.82 | 1.96 | 0.38 | 0.09 | 1.89 | 1.56 | 15.18 | 4.62 | 0.20 |
| 20 | 12.78 | 0.73 | 9.89 | 1.38 | 1.96 | 0.18 | 0.09 | 1.42 | 2.53 | 11.24 | 1.62 | 0.13 |
| 21 | 11.17 | 0.70 | 6.70 | 0.30 | 1.70 | 0.03 | 0.00 | 1.13 | 1.83 | 19.77 | 1.13 | 0.10 |
| 22 | 11.67 | 0.90 | 2.43 | 0.03 | 1.83 | 0.10 | 0.00 | 0.80 | 0.90 | 20.90 | 1.33 | 0.13 |
| 23 | 18.63 | 1.23 | 25.70 | 2.70 | 1.70 | 0.07 | 0.17 | 1.60 | 2.80 | 9.47 | 1.90 | 0.13 |
| 24 | 20.60 | 0.80 | 31.87 | 1.43 | 1.93 | 0.23 | 0.23 | 1.17 | 1.37 | 8.83 | 2.87 | 0.17 |
| 25 | 14.97 | 1.03 | 13.10 | 0.63 | 1.47 | 0.83 | 0.00 | 0.97 | 1.77 | 8.53 | 0.80 | 0.30 |
Note: The bold values indicate high frequency values. a M1 = Heating/air conditioning; M2 = Ventilation; E1 = Lighting; E2 = Power; E3 = Socket; E4 = Detector; C1 = Camera; C2 = Communication; C3 = Broadcast; P1 = Pipeline; P2 = Valve; P3 = Water pump.
Table 5.
Statistics of service life distributions.
| MEP Components a | Existing Service Life (MOLIT b Standard) | Statistics of Service Life Distributions | |||||
|---|---|---|---|---|---|---|---|
| Mean | Median | Mode | Standard Deviation | 95% Confidence Interval of Difference | |||
| Lower | Upper | ||||||
| M1 | 15 years | 18.34 | 18.34 | 18.34 | 0.35 | 17.65 | 19.02 |
| M2 | 10 years | 11.70 | 11.67 | 11.61 | 0.95 | 9.93 | 13.64 |
| E1 | - | 14.80 | 14.80 | 14.80 | 0.24 | 14.34 | 15.27 |
| E2 | 20 years | 19.15 | 19.30 | 19.63 | 1.69 | 15.50 | 22.13 |
| E3 | - | 13.53 | 13.53 | 13.53 | 0.20 | 13.15 | 13.92 |
| E4 | 20 years | 17.05 | 17.05 | 17.05 | 3.72 | 6.36 | 22.73 |
| C1 | 5 years | 10.67 | 12.21 | 14.89 | 9.39 | 6.96 | 22.38 |
| C2 | - | 14.64 | 14.63 | 14.62 | 1.09 | 12.52 | 16.80 |
| C3 | 15 years | 15.33 | 15.33 | 15.33 | 0.31 | 14.71 | 15.93 |
| P1 | 15, 20 years | 18.88 | 18.88 | 18.88 | 0.38 | 18.13 | 19.60 |
| P2 | 20 years | 17.77 | 17.77 | 17.77 | 0.83 | 16.11 | 19.37 |
| P3 | 10 years | 14.37 | 15.25 | 16.77 | 5.33 | 6.31 | 22.73 |
a M1 = Heating/air conditioning; M2 = Ventilation; E1 = Lighting; E2 = Power; E3 = Socket; E4 = Detector; C1 = Camera; C2 = Communication; C3 = Broadcast; P1 = Pipeline; P2 = Valve; P3 = Water pump. b MOLIT = Ministry of Land, Infrastructure, and Transportation.
Table 6.
Implications for the maintenance planning.
| MEP Components a | Characteristics | Implication | |||
|---|---|---|---|---|---|
| Mean | Standard Deviation | Skewness | Frequency Change (Table 4) | ||
| Heating/Air conditioning | 18.34 | Low | Zero | Centralization |
|
| Ventilation | 11.70 | Medium | Positive | Centralization |
|
| Lighting | 14.81 | Low | Zero | Periodicity |
|
| Power | 19.15 | Medium | Negative | Centralization |
|
| Socket | 13.53 | Low | Zero | Periodicity |
|
| Detector | 17.05 | High | Zero | Periodicity |
|
| Camera | 10.67 | High | Negative | Not clear |
|
| Communication | 14.64 | Medium | Positive | Periodicity |
|
| Broadcast | 15.33 | Low | Zero | Periodicity |
|
| Pipeline | 18.88 | Low | Zero | Centralization |
|
| Valve | 17.77 | Medium | Zero | Periodicity |
|
| Water pump | 14.37 | High | Negative | Not clear |
|
© 2018 by the authors. Licensee MDPI, Basel, Switzerland. This article is an open access article distributed under the terms and conditions of the Creative Commons Attribution (CC BY) license (http://creativecommons.org/licenses/by/4.0/).
Share and Cite
MDPI and ACS Style
Lee, S.; Ahn, Y. Analyzing the Long-Term Service Life of MEP Using the Probabilistic Approach in Residential Buildings. Sustainability 2018, 10, 3803. https://0-doi-org.brum.beds.ac.uk/10.3390/su10103803
AMA Style
Lee S, Ahn Y. Analyzing the Long-Term Service Life of MEP Using the Probabilistic Approach in Residential Buildings. Sustainability. 2018; 10(10):3803. https://0-doi-org.brum.beds.ac.uk/10.3390/su10103803
Chicago/Turabian StyleLee, Sanghyo, and Yonghan Ahn. 2018. "Analyzing the Long-Term Service Life of MEP Using the Probabilistic Approach in Residential Buildings" Sustainability 10, no. 10: 3803. https://0-doi-org.brum.beds.ac.uk/10.3390/su10103803
Note that from the first issue of 2016, this journal uses article numbers instead of page numbers. See further details here.