Article

Carbonation-Induced Corrosion Initiation Probability of Rebars in Concrete With/Without Finishing Materials

1
Department of Architectural Engineering, Hanyang University, 1271 Sa 3-dong, Sangrok-gu, Ansan 15588, Korea
2
Civil, Architectural and Environmental Engineering, University of Miami, Coral Gables, FL 33146, USA
*
Author to whom correspondence should be addressed.
Sustainability 2018, 10(10), 3814; https://0-doi-org.brum.beds.ac.uk/10.3390/su10103814
Submission received: 16 August 2018 / Revised: 18 October 2018 / Accepted: 19 October 2018 / Published: 22 October 2018

Abstract

:
The carbonation of concrete is the prime deterioration factor in reinforced concrete (RC) structures. During carbonation, the atmospheric CO2 penetrates the concrete and lowers its alkalinity. The problem in predicting carbonation is difficult to address, and a reliable probabilistic carbonation assessment is required to consider different variables such as the concrete quality, the chemistry of the reinforcing steel, and the quality of finishing materials. In the present study, we have used different finishing materials on concrete to minimize the effects of carbonation with a field survey and accelerated conditions. In one experiment, the measurement of the thickness of the concrete cover and the application of the finishing materials were done on-site, whereas, in the other experiment, these were done under accelerated conditions. The carbonation depth and the coefficient of silk wallpaper (SWP) were reduced by half in an accelerated 5% CO2 experiment compared to the plain ordinary Portland cement (OPC), owing to the external physical barrier that reduces the penetration of CO2 through the pores of the concrete. We found that carbonation did not reach the embedded rebar even after 100 years when SWP finishing material was used. The probability model predicted that 51 years would be required for OPC and water paint (WP) to reach a 30% onset of corrosion initiation through accelerated carbonation, while SWP would require 200 years.

1. Introduction

The replacement of cement with low calcium fly ash, coal fly ash, and green concrete composites is a sustainable process that reduces CO2 emissions and imposes high compressive strength and fracture toughness owing to their high pozzolanic activity and microstructure [1,2,3]. However, high volume fly ash (HVFA) causes a harmful effect to the concrete structures which induces the corrosion of embedded steel reinforcement due to carbonation [4,5]. The evaluation of emitted CO2 in concrete is a very difficult task; However, Lee and Wang have determined the amount of emitted CO2 using the total volume of concrete and unit carbon dioxide emission of materials equation [6].
Owing to the change in climatic conditions and the presence of aggressive ions in the atmosphere, reinforced concrete (RC) deteriorates quickly [7,8]. The carbonation of concrete is a major detrimental factor for RC structures [9,10,11]. During carbonation, atmospheric CO2 penetrates into the concrete and lowers its alkalinity [12]. This causes the corrosion of the reinforcing bars by destroying the passive films surrounding them [13,14]. The carbonation can be expressed as:
Ca ( OH ) 2 + CO 2 CaCO 3 + H 2 O
Owing to the reaction of atmospheric CO2 with hydroxyl ion ( OH ), the pH of the pore solution decreases, resulting in the enhancement of steel corrosion, cracking, or spalling of concrete structures [15,16]. The overall carbonation reaction in concrete occurs through CaCO3 formation, and it can be written as [17]:
CO 2 + H 2 O H 2 CO 3
H 2 CO 3 + H 2 O HCO 3 + H 3 O +
HCO 3 + H 2 O CO 3 2 + H 3 O +
H 2 CO 3 + Ca ( OH ) 2 CaCO 3 + 2 H 2 O
The atmospheric CO2 reacts with water or OH ion and forms H2CO3 (carbonic acid), as presented in Equation (2). It reacts with water/ OH ions available in concrete (Equation (3)), and forms HCO 3 (bicarbonate ion) and H 3 O + (hydronium ion). Once a building is constructed, this is an autocatalytic and continuous reaction throughout the process. The primary cause for the reduction in pH is H 3 O + formation [17]. Owing to the formation of H 2 CO 3 and the reaction with the pore solution, CaCO 3 and H 2 O molecules are generated, see Equation (5). Thus, CaCO 3 reduces the porosity of concrete [18,19] and H 2 O facilitates the reaction to form H 3 O + , see Equations (3) and (4).
There are other hydrates present in the concrete such as silicates and aluminates which are also affected by the carbonation. Thus, the C-S-H can be carbonated by the following reaction [17]:
1.7H2CO3 + 1.7CaO.SiO2.2.5H2O → 1.7CaCO3 + 1.7SiO2.2.5H2O + 1.7H2O
Therefore, the carbonation is an important factor for RC structures because once the passive film is destroyed, the corrosion starts to occur. The corrosion of the reinforcing bars causes a lowering of their tensile strengths [20]. According to the Pourbaix diagram, passive films are formed on the reinforcing bars in concrete at a high alkaline pH, but they become destructive once the pH reaches 10.4; thus, causing corrosion [21]. Therefore, carbonation is an alarming factor that significantly affects the durability of concrete structures. The corrosion of reinforcing bars causes expansion owing to the increase in the volume of the corrosion products, thus leading to the cracking and spalling of concrete that lowers the strength and decreases the durability of RC structures [20,22].
Different studies pertaining to carbonation prediction methods have been carried out to predict the life expectancy of RC structures with HVFA when exposed to harsh environments [23]. Jiang et al. [24] predicted the carbonation depth of concrete bridges in China under changing climatic conditions and traffic loads by considering different parameters. Additionally, they established the numerical carbonation model (NCM) and the simplified carbonation model (SCM) for fatigue-damaged concrete through Monte Carlo simulations. The actual/real experiment would require a significant amount of time and manpower to study the effects of carbonation on the durability of RC structures with/without finishing materials. However, the probability model can perform the predictions while saving time and manpower.

1.1. Carbonation Prediction Equation

Equation (7) was proposed by Kisitani [25] for the carbonation prediction model of RC structures. Through Equation (7), the carbonation depth can be calculated by considering the water/cement (w/c) ratio. Meanwhile, the carbonation prediction equation, announced by the Architectural Institute of Japan (AIJ) [26], is one in which the carbonation coefficient (A), can be predicted by the carbonation depth (C), which is proportional to the square root of the elapsed time (t) (Equation (8)). The carbonation coefficient, A, can predict the carbonation depth according to the w/c ratio, the admixture type and use, the cement type, the curing degree, the carbon dioxide concentration in the atmosphere, the temperature, the humidity, and type of finishing material (R) varied from 0.04 to 5.8.
t = 7.2 R 2 ( 4.6   w / c 1.76 ) 2 C 2 ( w / c 0.6 )
C = A ( t + R 2 R )

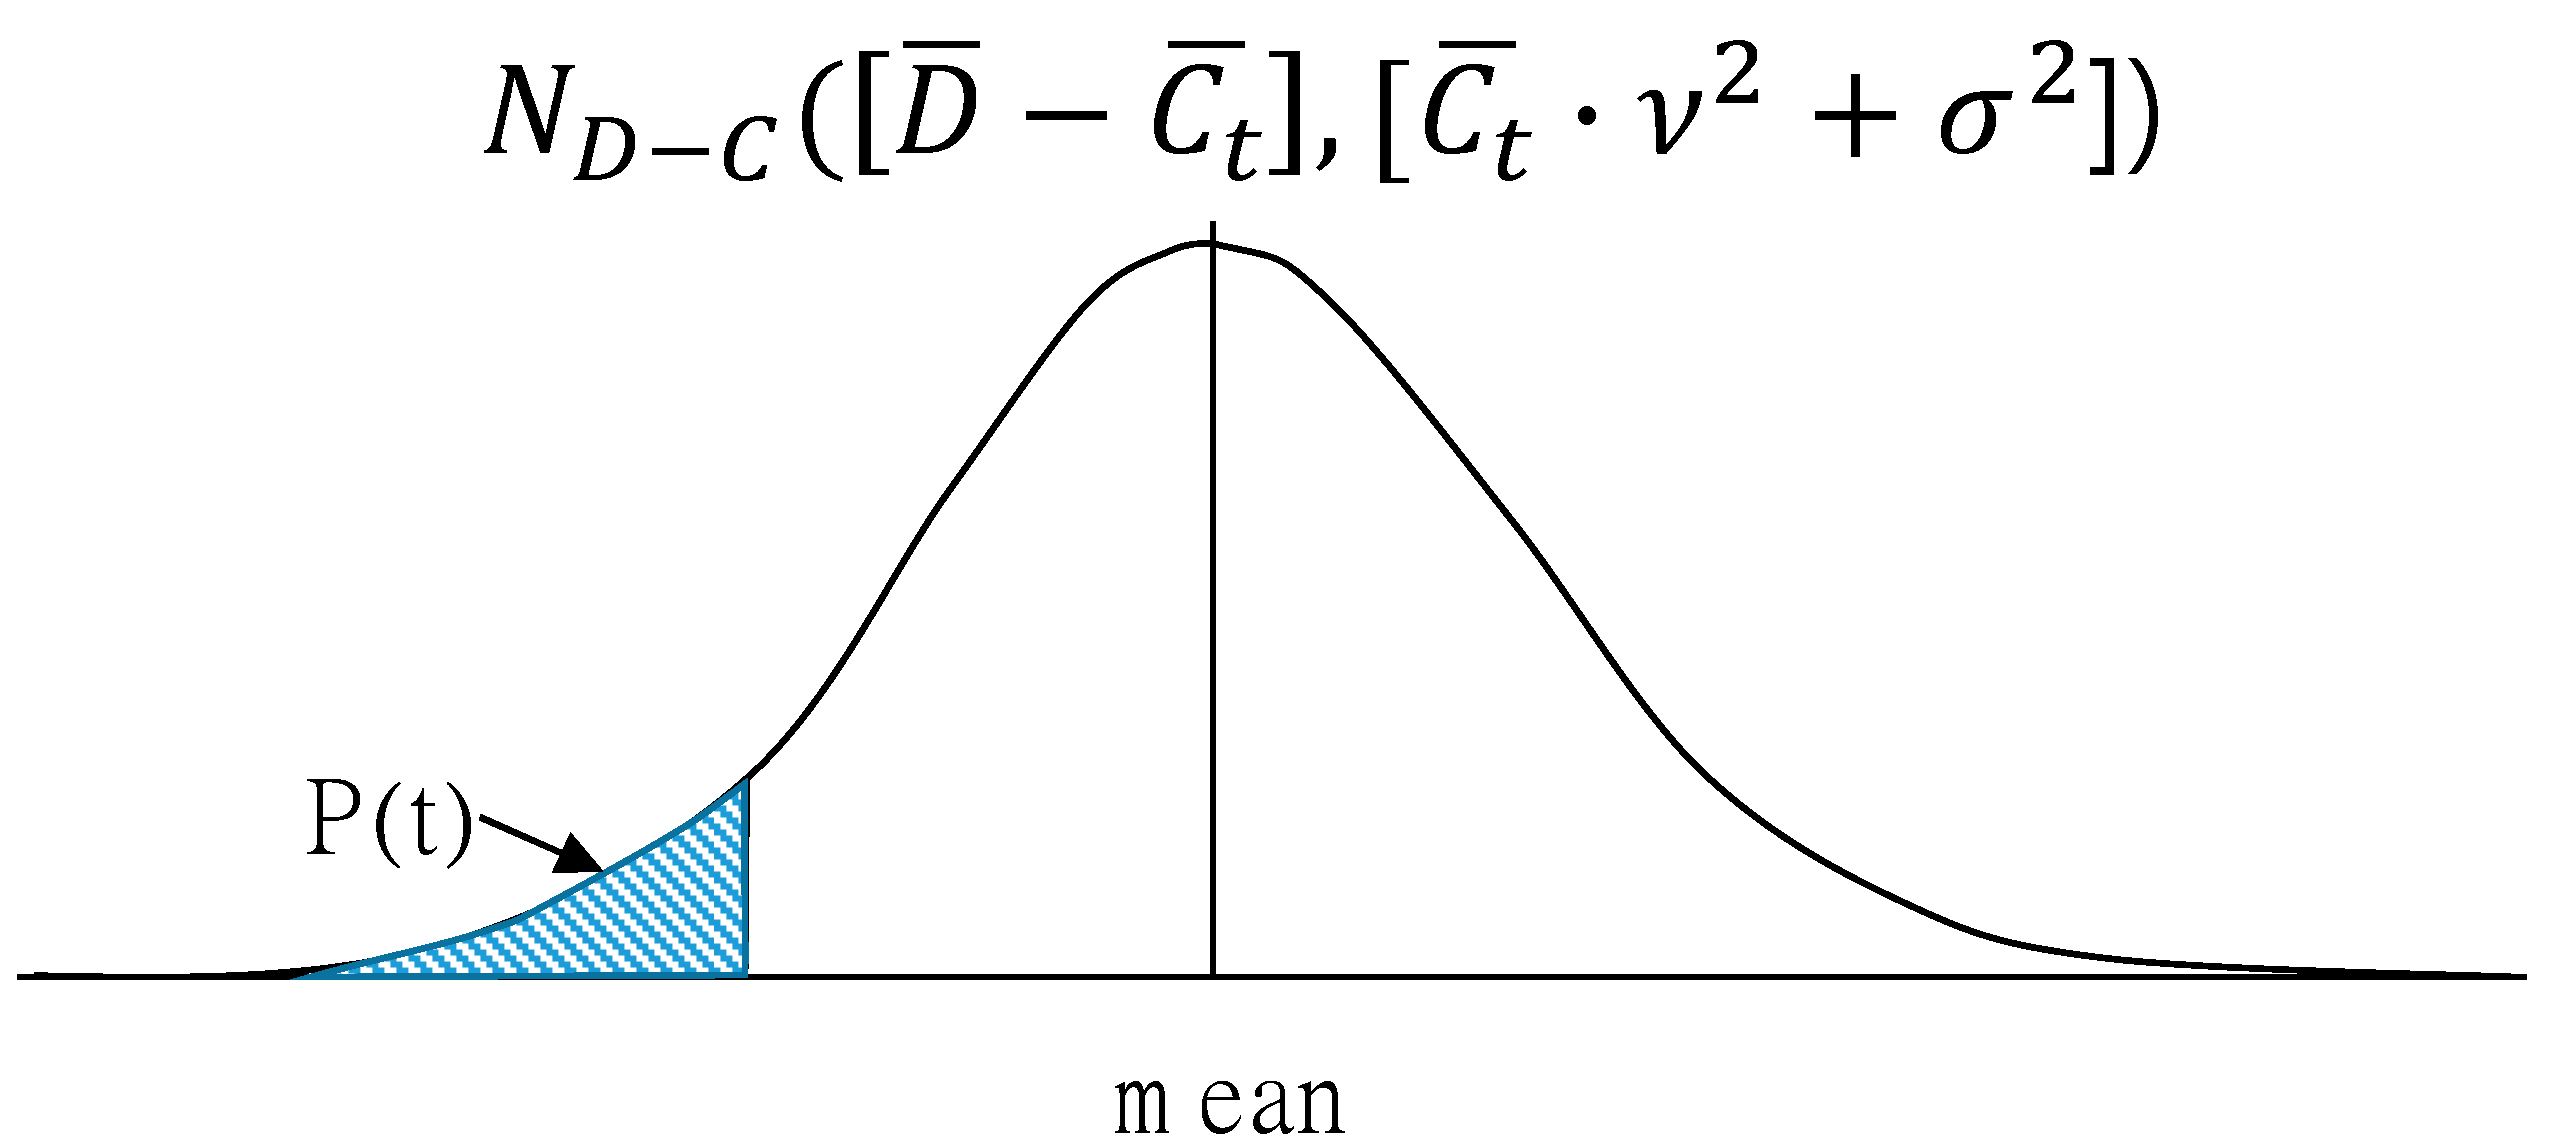
1.2. Probabilistic Carbonation Assessment

Different random variables such as the thickness of the protective covering, the carbonation depth, the materials, the environment, and the engineering design determine the probability model for the carbonation assessment of concrete [27]. Thiery et al. [27] have considered Papadakis [28] and Bakker’s [29] models for the assessment of the carbonation depth through reliability theory of a time-dependent approach. They input random variables into the Papadakis and Bakker’s models for three different types of concrete in laboratory conditions for the assessment of the carbonation depth. However, they did not consider the effects of the finishing materials. This is while the inhibiting action of carbonation is also affected by the properties of the finishing materials [30]. In this case, the variability of the carbonation depth, which increases over time, and the variability of the thickness of the protective covering, are considered as normal distributions based on the reliability analysis of Izumi and Fumio [31]. Figure 1 shows the probability distribution of the carbonation depth, which varies with time and the thickness of the protective covering [26]. In this case, the probability distribution of rebar corrosion initiation can be expressed by Equation (9) and the destruction probability by Equation (10).
f ( D C t ) = 1 2 π ( C t ¯ 2 υ 2 + σ 2 ) × e x p ( D C t ) ( D ¯ C t ¯ ) 2 2 ( C t ¯ 2 υ 2 + σ 2 )
P ( t ) f = 0 f ( D C t ) d ( D C t )
where C t is the carbonation depth, ν is the coefficient of variation of the carbonation depth, D ¯ is the mean protective covering thickness, σ is the standard deviation of the protective covering thickness, N c is the probability distribution of the carbonation depth, N D is the probability distribution of the protective covering thickness, and P ( t ) f is the endurance destruction probability over time. However, the above equation of random variables is the endurance destruction probability equation for the sound area, and the destruction probability equation of the sound and crack areas based on the survey.
Table 1 shows the estimated allowable values for the rebar corrosion initiation probability according to the variability of the carbonation depth [26].
RC structures face durability problems owing to carbonation and the ingress of aggressive species from the atmosphere. However, the problems have recently been minimized using various repair materials [30]. The Architectural Institute of Japan (AIJ) [26] and Köliö et al. [32] have studied the effects of carbonation when finishing materials are used on concrete surfaces. Roy et al. [33] and Huang et al. [22] found that a sufficient thickness of the cement mortar as the surface finishing material could significantly reduce the carbonation depth because it increases the resistance to the ingress of CO2. In addition, Park [34] used concrete specimens with surface coatings and found that the carbonation resistance was improved by forming a dense surface structure and preventing the penetration of CO2 into concrete. However, the carbonation assessment of RC structures in the real field compared to the accelerated condition, i.e., laboratory experiments, may produce different results owing to the involvement of different parameters such as different humidity, temperature, and the content of aggressive ions.
Furthermore, it is difficult to predict the accurate carbonation service life with such deterministic methods of analysis. Therefore, for the accurate assessment to the impact of carbonation on the durability of RC structures, the concrete quality, variability of rebar placement, and the variation in the quality of the different finishing materials must be considered [35]. Jiang et al. [24] have established NCM and SCM by considering different loads on bridges, temperatures, and concentrations of atmospheric CO2 in real conditions without using any finishing materials. We have, thus, attempted to study the effects of the thickness of the concrete cover and the application of finishing materials in an actual construction site in South Korea and accelerated experiments in the laboratory. Such studies have not been carried out by other researchers in South Korea. Therefore, for the first time, we are trying to determine the probabilistic carbonation and corrosion initiation of rebars in concrete with/without finishing materials in a 5% CO2 accelerated environment.

2. Methods and Materials

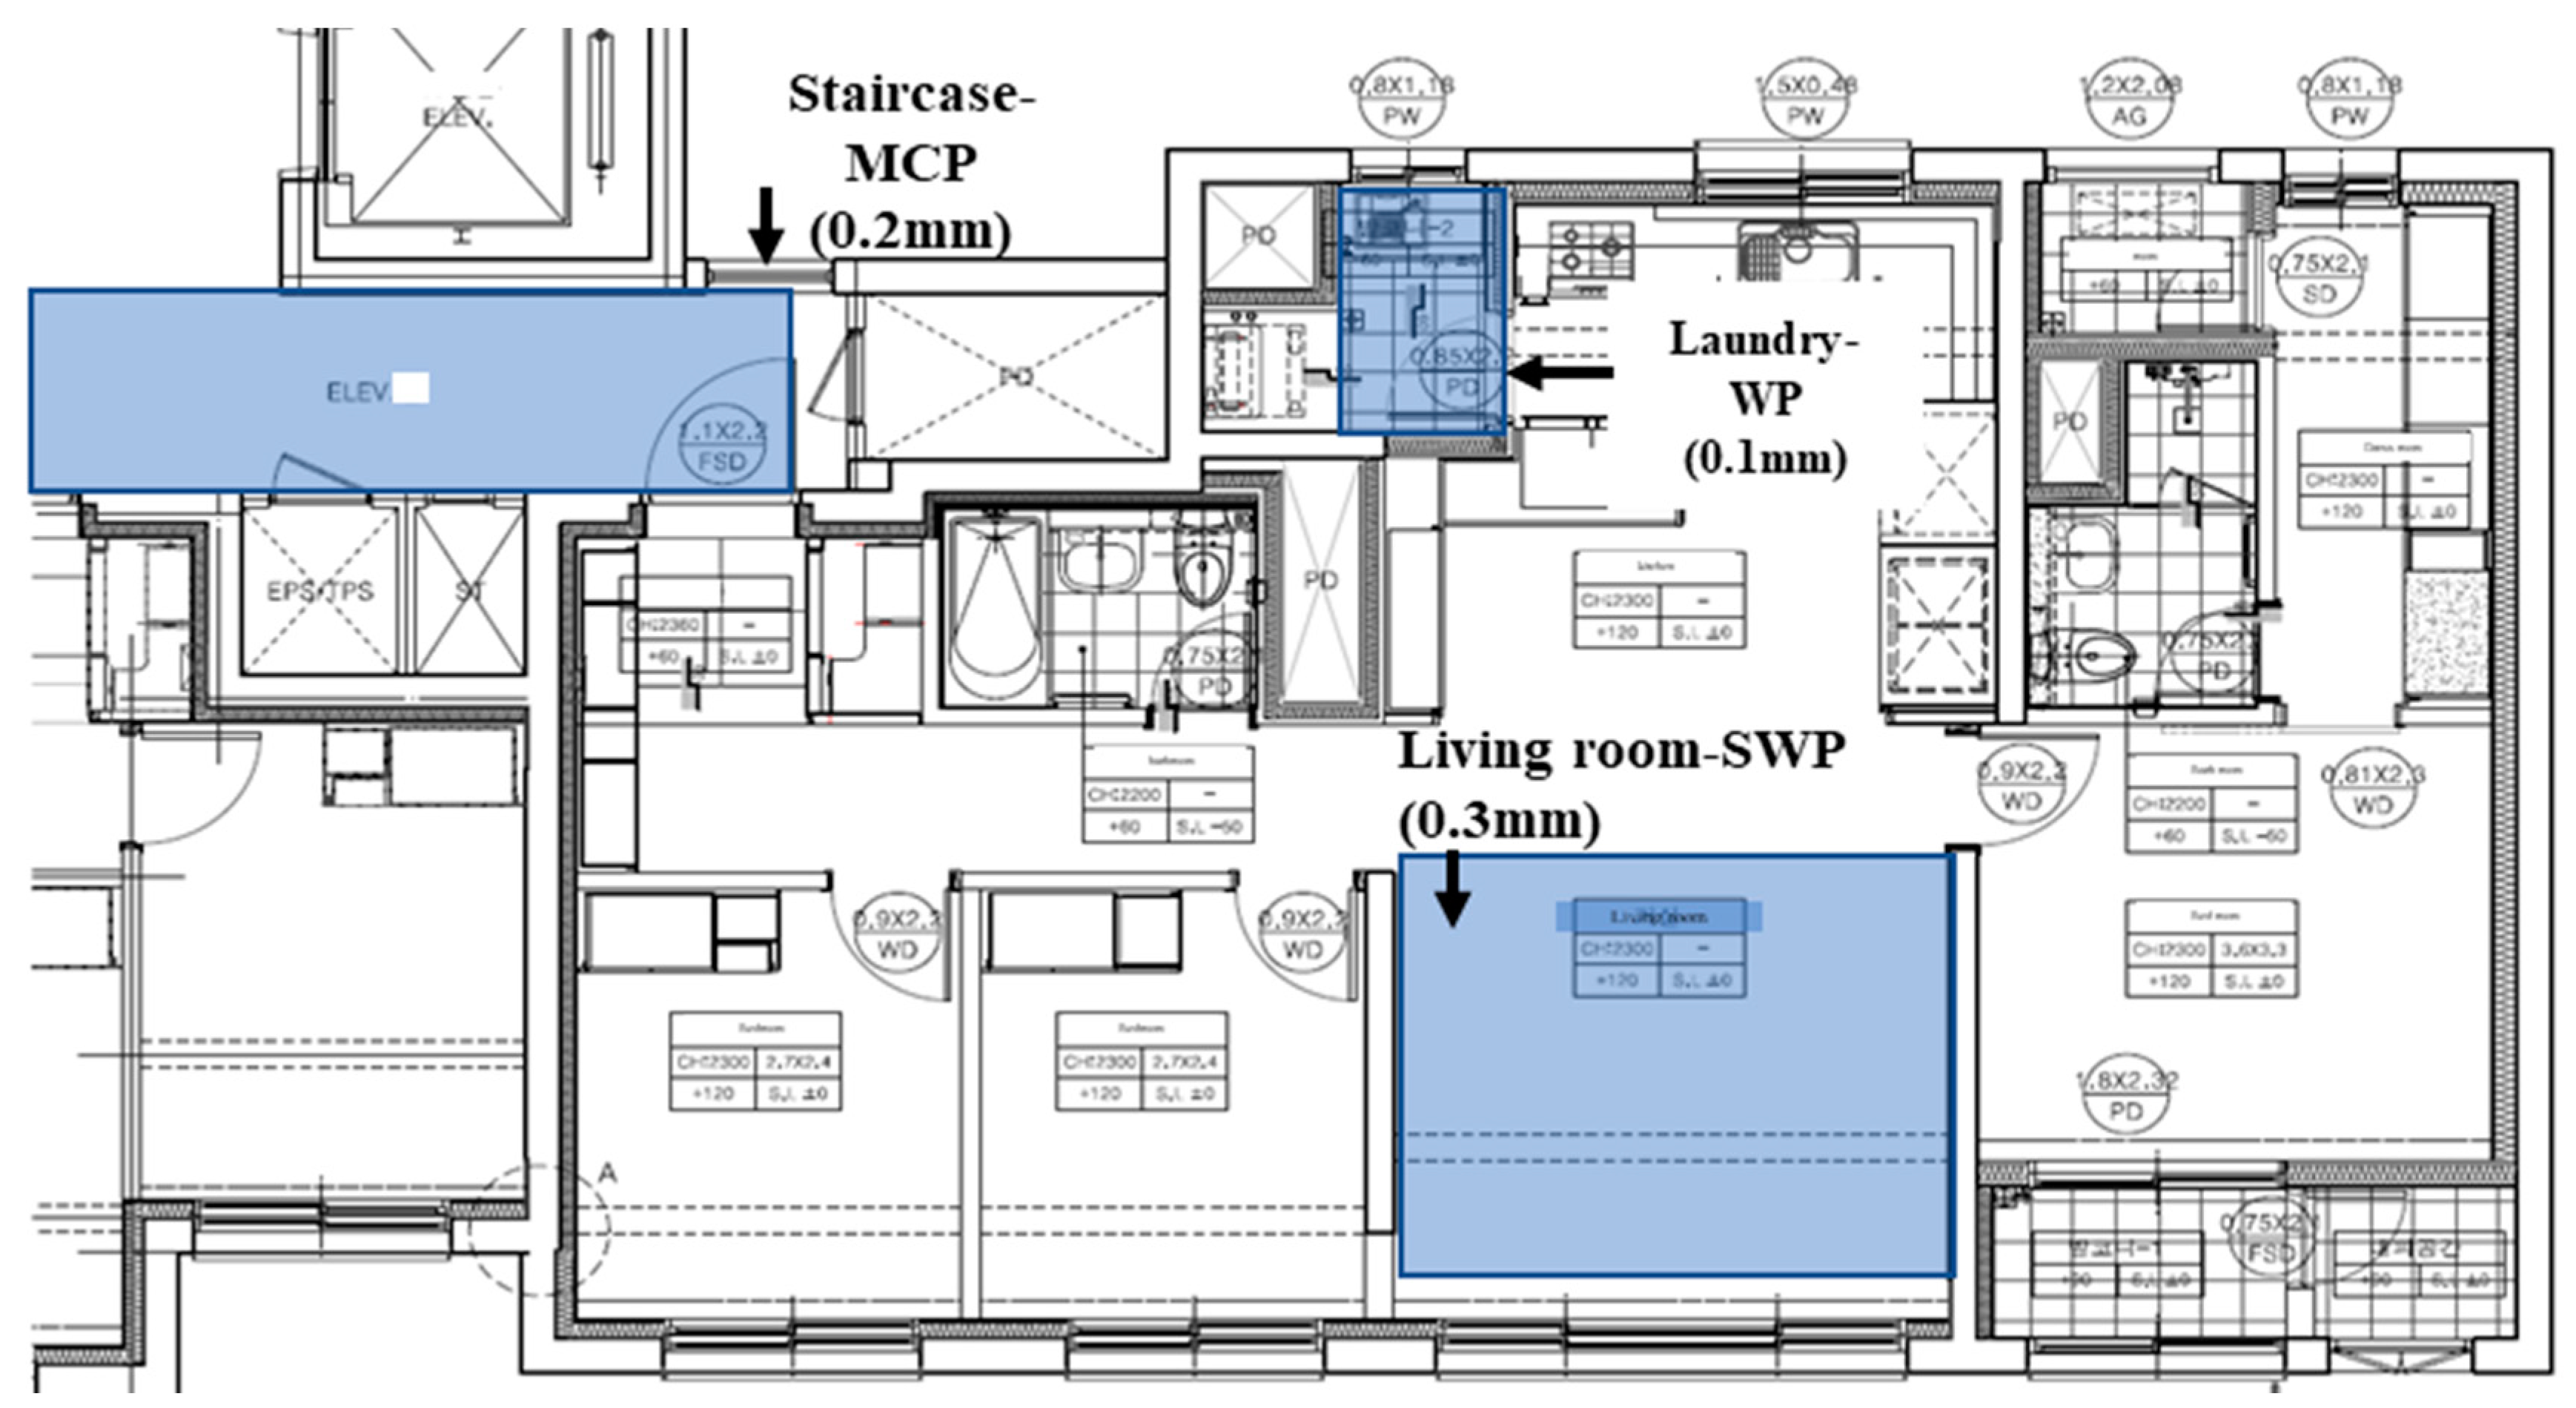
2.1. Overview of Construction Site and Accelerated Experiment

To study the probabilistic carbonation assessment of concrete structures with/without finishing materials, experiments were performed in accelerated conditions and at actual construction sites in South Korea, for different thicknesses of the concrete cover and different finishing materials. The details of the concrete mix used to construct the building are shown in Table 2. The w/c ratio was 55% for the concrete mix as well as for the accelerated carbonation experiment in the laboratory conditions. The dimensions of the concrete specimen for the accelerated experiment was 100 mm × 100 mm × 400 mm and it was cured in water for 28 days. The nominal compressive strength was found to be 24 MPa.
The target buildings were the apartment buildings of the POSCO company located in Hanam city, Gyeoggi-do, South Korea. The construction period was from July 2011 to October 2015. The apartment buildings were composed of RC structures. There were two buildings whose heights varied from 25 to 29 floors.
Figure 2 shows a schematic of the layout of the freshly erected building with the floor plan and information of the finishing material. The staircase was finished with multicolor paint (MCP), the indoor laundry room with water paint (WP), and the living room with silk wallpaper (SWP) according to customer requirements.
Three types of finishing materials, i.e., WP, MCP, and SWP were applied to the surface of the concrete at the construction site. After the application of the finishing materials, the accelerated carbonation tests were conducted in a laboratory according to KS F 2596 [36].
The carbonation depth of the concrete with each finishing material was measured, and the mean value, the standard deviation, the carbonation coefficient, and the carbonation ratio were subsequently derived. The carbonation ratio was measured by dividing the carbonation coefficient of the finishing materials by the carbonation coefficient of the concrete (without finishing materials). The details of the carbonation ratio will be discussed in the results section.
Furthermore, the cover thicknesses of the concrete were measured at the actual sites, and the mean values and the standard deviations were calculated.
The rebar corrosion initiation probability was predicted for the finishing materials by applying the derived values to the rebar corrosion initiation probability model.

2.2. Measurement of Concrete Cover Thickness at On-Site

The thickness of the concrete cover was measured using Profometer®5+ (Model: S, Proceq Asia Pte Ltd., Switzerland). The measurement was performed separately in 15 to 90 locations for the living room, the laundry room, the first-floor balcony, and the staircase. As for the external wall, the thickness was measured at the rooftop. The cover thickness of the concrete at each location was calculated by considering the mean value.

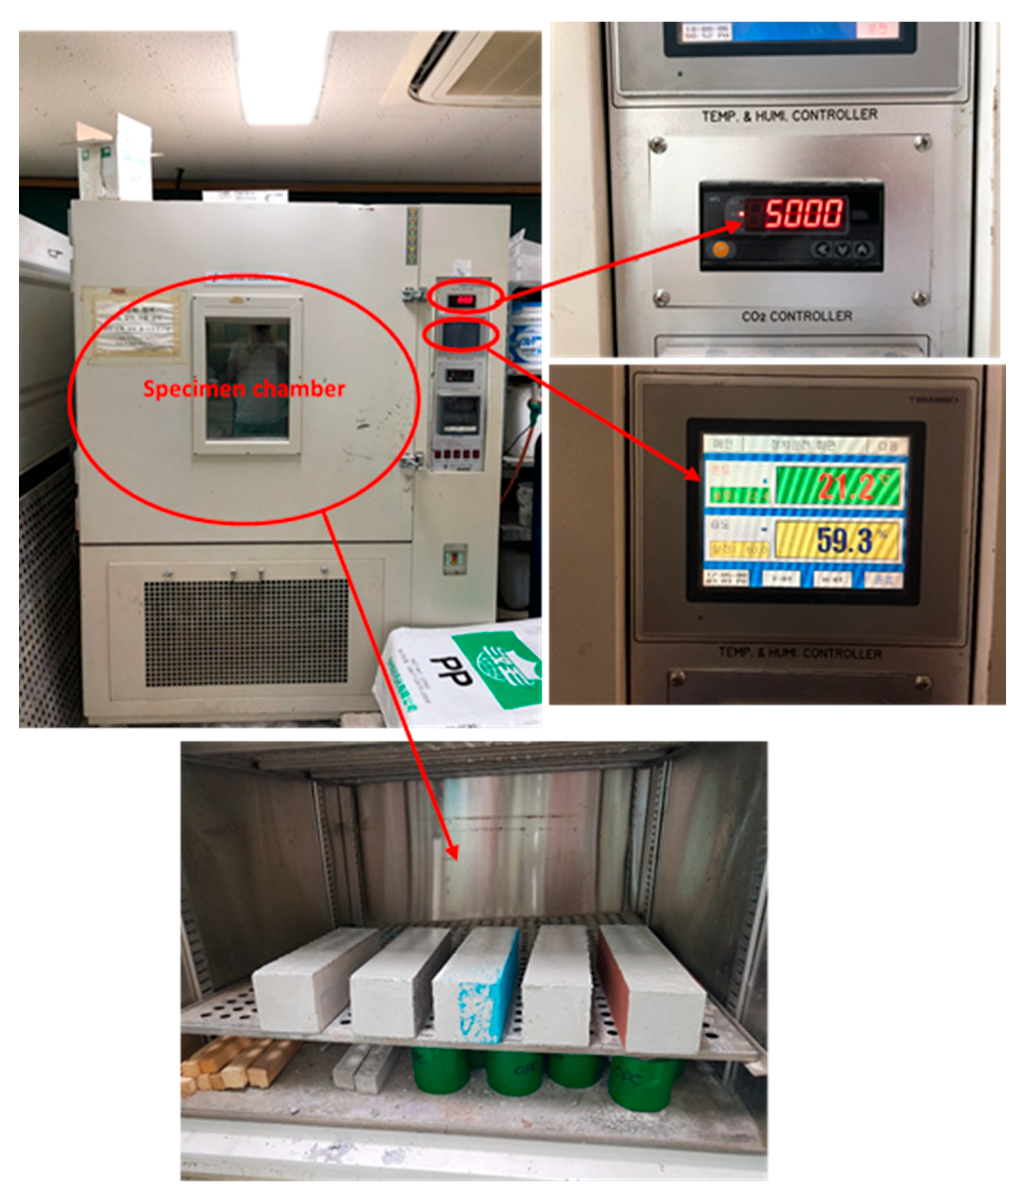
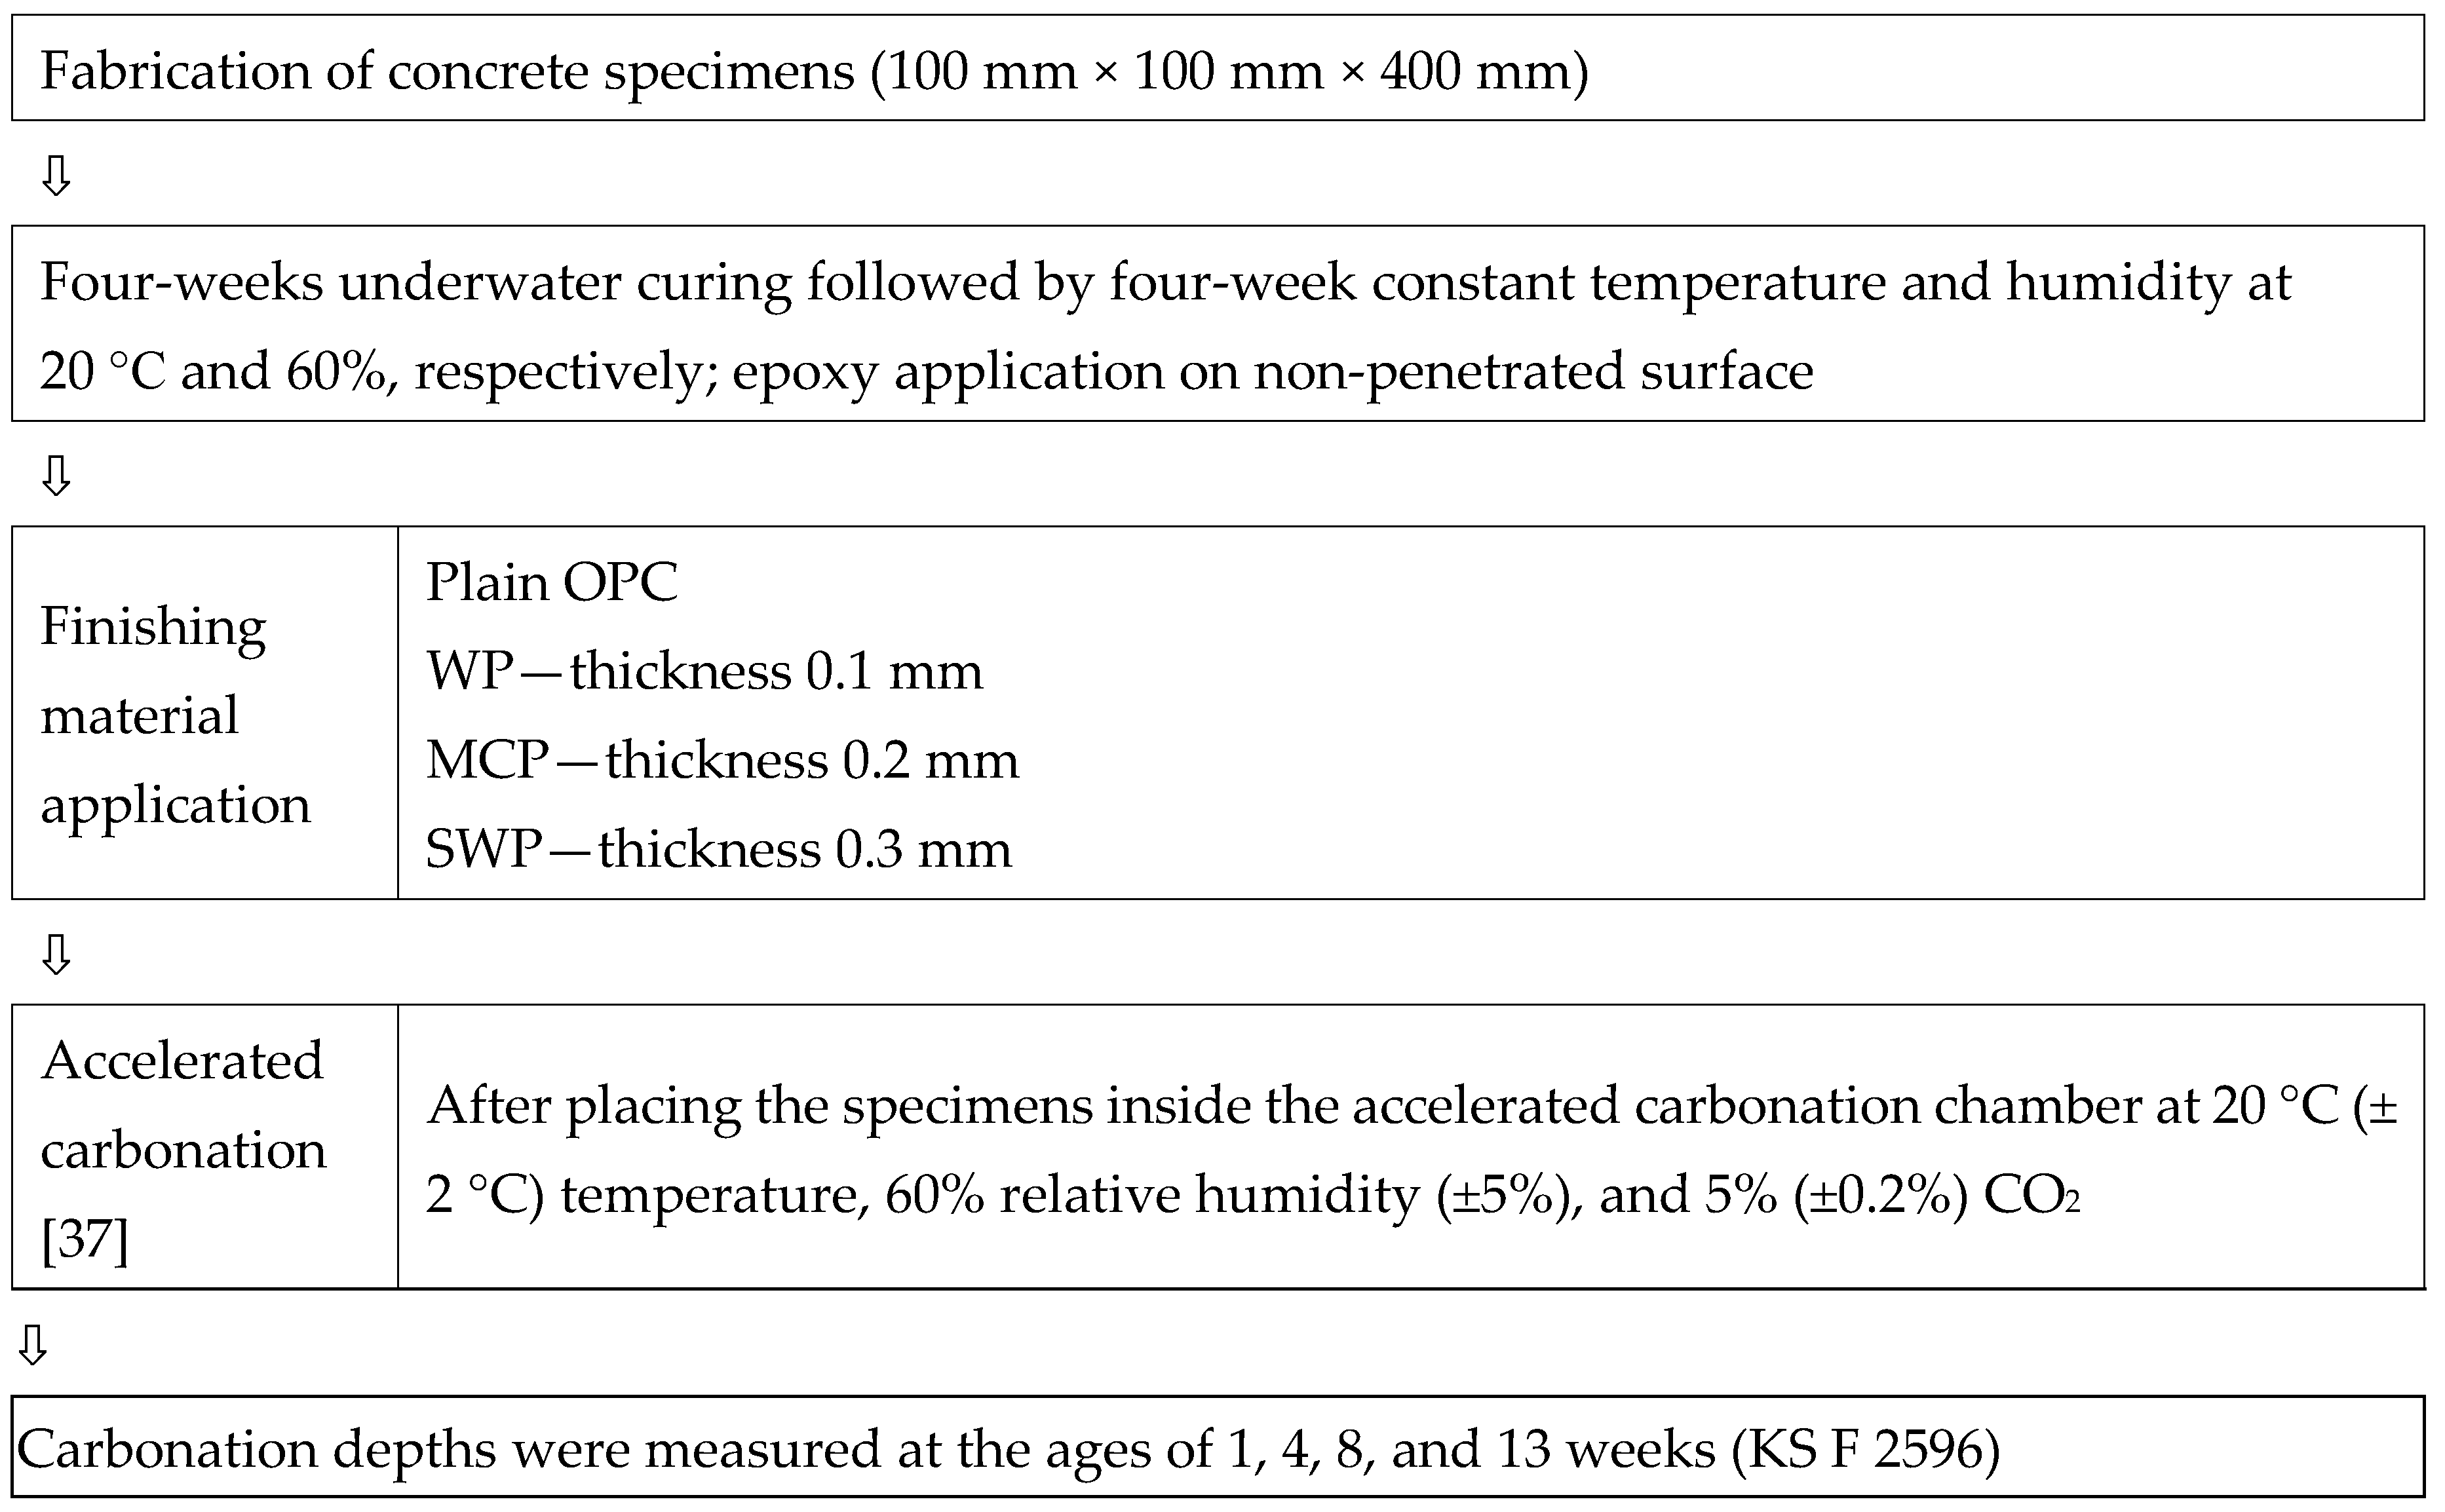
2.3. Accelerated Carbonation Experiment in Laboratory

The accelerated experiment was performed in a carbonation chamber (Chom Dan Scientific Ind. Co., Seoul, South Korea). The details of the setup are shown in Figure 3. This experiment was performed according to the KS F 2584 standard: 20 °C (±2 °C) temperature, 60% (±5%) relative humidity, and 5% (±0.2%) CO2 [37]. After fabrication of the concrete specimens, three different finishing materials, i.e., WP, MCP, and SWP were applied, and the thickness was measured to predict the carbonation progress and depth. The carbonation depth in the concrete was measured using a Vernier caliper (Mitutoyo, Japan) at three different locations after breaking the specimens, and their average values were recorded.
The details of the properties and the minimum thicknesses of the finishing materials are shown in Table 3. We used identical finishing materials to those at the construction site for fabricating the specimens in the laboratory. WP, MCP, and SWP were applied and their thicknesses were 0.1, 0.2, and 0.3 mm, respectively. We considered a plain OPC (without finishing materials) for comparison. As shown in Table 3, WP is a liquid with 1.35 specific gravity and can easily penetrate the pores of the concrete. Therefore, it is difficult to measure the exact thickness, and hence it shows the minimum cover thickness. Meanwhile, MCP is viscous, with a specific gravity of 1, and easily adheres to the concrete surface. Therefore, it shows a higher cover thickness compared to WP. The SWP is a thin paper with silica doping acting as an external barrier, with a minimum thickness of 0.3 mm; it was purchased from a market in Korea. The pH of WP and MCP was 9. Most of the finishing materials were white, but MCP was available in different colors. In the present study, we selected black and white MCP. It was difficult to maintain a uniform thickness for all the finishing materials owing to their different properties. Therefore, the finishing materials showed different thicknesses when applied on the concrete surface.
Figure 4 shows the experimental flow chart that describes the method adopted to perform the present study. After applying the finishing materials to the concrete surface, the carbonation depth was measured at the ages of 1, 4, 8, and 13 weeks according to KS F 2596 [36].
There are different steps involved in preparing the concrete specimens for the accelerated carbonation experiment, from the preparation of the concrete mold to the application of the finishing materials. The specimens were subjected to underwater curing for four weeks; thereafter, they were removed from the curing tank. Upon the completion of curing, the epoxy was applied to the five faces of the specimens, and one face was open for the application of the finishing materials. The thickness of the epoxy coating was 120 µm to resist the ingress or attack of aggressive species to the concrete specimens. The finishing materials were applied on the concrete specimens after one week of epoxy drying. The accelerated carbonation test was performed in a carbonation chamber at 20 °C (±2 °C) temperature, 60% (±5%) relative humidity, and 5% (±0.2%) CO2 in triplicate sets of specimens [37]. The carbonation depth was measured at the ages of 1, 4, 8, and 13 weeks using 1% phenolphthalein solution on each specimen at three different locations. The average was then calculated in accordance with KS F 2596 [36] by cutting the concrete specimens.

3. Results and Discussion

3.1. Site Survey of Concrete Cover Thickness

Table 4 shows the results of the site survey for measuring the thickness of the concrete cover, obtained from the target buildings at the construction site. The Korean concrete standard specification [38] recommends that the cover thickness for the internal wall of a standard building structure is 30 mm (±10 mm). We attempted to adhere to these recommendations. The internal wall cover thickness of Building A was measured at different locations, and the mean thicknesses were 35.8, 37.5, and 40.3 mm for the living room, the laundry room, and the staircase, respectively. The standard permissible difference value is ±10 mm. Meanwhile, for the external wall, the cover thickness must be 40 mm (±10 mm) according to the standard [38]. However, in the present study, the cover thickness of the external wall at different locations was measured and was found to be 50.0 mm at the rooftop, exceeding the standard by 10 mm, while the balcony was 48.3 mm. For Building B, the thickness of the internal wall’s concrete covers was 39.8, 38.1, and 35.8 mm for the living room, the laundry room, and the staircase, respectively; while 48.1 mm for the balcony, and 45.7 mm for the rooftop. The cover thickness for the different parts exceeded the standard value by 5.8–10.3 mm, which made them sub-standard. The values of the thicknesses of the concrete covers in Buildings A and B at different locations are due to the customers’ requirements, and the utility of different locations in the apartments.

3.2. Accelerated Carbonation Experiment in the Laboratory

3.2.1. Carbonation Depth Measurement

Figure 5 shows the physical appearance after the carbonation test of concrete at different time intervals for different finishing materials, using 1% phenolphthalein. The quantitative results of the carbonation depth (C) and standard deviation are shown in Table S1. The standard deviation of carbonation depth is between 0.41 to 1.56 mm. The results show that the concrete specimens after one week of accelerated experiment exhibit approximately 3.31 mm penetration for plain OPC, see Figure 5a. The penetration depth was approximately 3.22 mm for WP, see Figure 5b, 3.02 mm for MCP, see Figure 5c, and 1.80 mm for SWP, see Figure 5d. However, once the duration of exposure in the carbonation chamber was increased up to 13 weeks, the carbonation penetration depth increased compared to the 1-week exposure in the order of plain OPC > WP > MCP > SWP. The carbonation penetration can be observed from the color change of specimens at different times of exposure interval in 5% CO2. Pink represents the non-carbonated area whereas the colorless surface represents carbonation. Figure 5 shows that the plain OPC has a penetration depth after 13 weeks of exposure that is over four times greater compared to that of 1 week. The carbonation penetration depth of plain OPC (without finishing materials) is higher compared to that of MCP and SWP finishing materials at different exposure periods because it does not contain any finishing materials and the CO2 directly penetrates through the concrete pore. The WP’s penetration depth is almost identical to that of plain OPC owing to its higher dissolution in the pore solution or liquid, and that it can easily penetrate the concrete pores. As WP is a water-soluble paint, it diffuses and cannot create any stable barrier at the concrete surface, making its carbonation penetration depth identical to that of plain OPC. Meanwhile, among the finishing materials, SWP exhibits a smaller penetration depth of carbonation compared to the others because it works as a strong barrier to CO2 penetration. The SWP is a 0.3 mm sand wall film that can be observed at the outer surface of the specimen after 13 weeks, see the area indicated by the arrow in Figure 5d. Therefore, it shows excellent resistance to the penetration of CO2. It is noteworthy that the paper thickness, i.e., SWP, inhibits the penetration of aggressive ions. Other finishing materials are liquid and have higher diffusion rates compared to SWP. Therefore, WP and MCP show higher depths of penetration compared to SWP.

3.2.2. Carbonation Coefficient Calculation

The carbonation coefficient of concrete with/without finishing materials is calculated using Equation (11) [26]. Before calculation, it is necessary to normalize the carbonation coefficient in 5% CO2 under the accelerated conditions according to the AIJ [26]. Therefore, the carbonation coefficient was converted with 0.2% CO2 in an outdoor atmosphere [39,40] using Equation (11) [26].
C = A CO 2 / 5.0 × t
where C = carbonation depth (mm), A = carbonation coefficient (mm/√year), CO2 = concentration of CO2 (%) and t = elapsed time (year).
The carbonation coefficient of concrete with/without finishing materials was calibrated through a mathematical regression process with exposure periods and results as shown in Figure S1. It is considered that once the concrete and finishing materials are combined, the surface becomes non-uniform. The R2 values of concrete with/without finishing materials at different exposure times are 0.96 for SWP and 0.99 for concrete and other finishing materials which fall under the acceptable value.
Table 5 shows the carbonation coefficient of concrete with/without finishing materials for different exposure times under accelerated conditions. The carbonation coefficient of plain OPC was 0.52 mm / year after one week of exposure in accelerated conditions, which is applicable to the external wall of the building. After the application of the finishing materials, WP, which was used for the internal wall, was found to be 0.48 mm / year for one week while it decreased to 0.37 mm / year after 13 weeks of exposure. We found, compared to plain OPC and the other finishing materials, SWP showed the lowest carbonation coefficient for 1 to 13 weeks of exposure. This result correlates with the carbonation depth measurement observations, where, after one week of the experiment, the SWP penetration was at least two times slower than that of plain OPC. It can be seen from Table 5 that the carbonation coefficient decreased gradually once the exposure periods were extended from 1 week to 13 weeks attributed to the slow rate of diffusion of CO2 in concrete.

3.2.3. Carbonation Ratio Measurement

The carbonation ratio of each finishing material can be found using Equation (12). The carbonation ratio is obtained by dividing the average carbonation coefficient of the specimen with finishing material, by the average carbonation coefficient of the specimen without any finishing materials [30].
C a r b o n a t i o n   r a t i o = A v e r a g e   c a r b o n a t i o n   coefficient   w i t h   f i n i s h i n g   m a t e r i a l A v e r a g e   c a r b o n a t i o n   coefficient   w i t h o u t   f i n i s h i n g   m a t e r i a l
Through the carbonation ratio equation, it is possible to simultaneously assess the carbonation inhibition or reduction by multiplying the carbonation ratio by 100. Figure 6 shows a comparison of the carbonation inhibition or reduction of each specimen in accelerated conditions by considering the average values of the carbonation coefficients, see Table 5. Assuming that the carbonation of plain OPC is 100%, the carbonation inhibition of WP is 91.5%. Meanwhile, the carbonation inhibition for SWP is the lowest at 44.7%, indicating that it is the finishing material that has the highest carbonation inhibition effect and can be used to reduce the corrosion initiation of embedded steel rebar in concrete. The results of carbonation inhibition corroborate the results obtained for carbonation depths and coefficients, i.e., SWP is twice as inhibiting as plain OPC. This is due to the barrier-type inhibition provided by SWP.

3.2.4. Carbonation Progress Prediction Model

We have followed C = A t [26] to predict the carbonation model. The average A value obtained was 0.47, 0.43, 0.39, and 0.21 mm / year for plain OPC, WP, MCP, and SWP, respectively. The A value is the average for the different exposure periods mentioned in Table 5. Figure 7 predicts the carbonation depth of concrete with/without finishing material. Based on the 30-mm cover thickness of rebar in concrete, it is assumed that the carbonation depth reaches the stated limits and the rebar position. In plain OPC, carbonation would reach the rebar position after 40 years. In the case of finishing with WP, carbonation is expected to reach the rebar position after approximately 50 years, indicating the extension of the service life by approximately 10 years. In the case of SWP, it is expected that carbonation would not reach the rebar position even after 100 years. Based on the cover thickness of 40 mm, carbonation was expected to reach the rebar position after approximately 70, 85, and 100 years for plain OPC, WP, and MCP, respectively. In the case of SWP, it was expected that carbonation would not reach the rebar position even after 100 years.

3.3. Probabilistic Carbonation Assessment

The probabilistic carbonation assessment model is shown in Table 6. It shows the mean cover thickness, standard deviation, mean carbonation depth, and the coefficients of variation of the rebar cover in the accelerated carbonation conditions using the site survey results. The thickness of the finishing materials at the external wall was not considered. The mean cover thickness of plain OPC and the finishing materials exceeded the mean carbonation depths of 40 mm for the external wall, and 30 mm for the internal wall. The exceeded value was approximately 8 mm for both the internal and external walls.
The rebar corrosion initiation probability was calculated by applying the coefficients of variation for each finishing material according to Equation (10).
Figure 8 shows the probability of rebar corrosion of different finishing materials as well as that for plain OPC. The initiation time of rebar corrosion was set to be the time at which the allowable rebar corrosion initiation probability criterion of 30% was reached [26]. The onset of rebar corrosion at 30% was predicted for plain OPC and WP, which was approximately 51 years. The WP shows the fast onset of corrosion of embedded rebar compared to other finishing materials, owing to the physical and chemical properties. It is less viscous and liquid and can easily penetrate into the pores of concrete and does not form an external barrier at the top surface; therefore, it shows an early initiation of corrosion and is identical to plain OPC. Further, 51 years is too long to dissolve WP in the pore solution. Meanwhile, plain OPC does not contain any finishing materials; therefore, it has a greater likelihood of allowing the ingress of CO2 through the concrete pores. Therefore, plain OPC and WP started the initiation of corrosion early and reached 30%, whereas MCP required more time to reach the 30% onset of corrosion. A period of 60 years is required to reach 30% corrosion of the embedded rebar. The onset of corrosion initiation for SWP is 200 years owing to the compact, thick, and sand layers, which effectively inhibit the ingress of CO2 into the concrete pores.

4. Conclusions

In this study, the carbonation and corrosion initiation of rebars in concrete with/without finishing materials in a 5% CO2 accelerated environment was assessed to determine the probabilistic carbonation. The following conclusions can be drawn from this study:
(1)
The thickness of the concrete cover throughout the on-site buildings was maintained under the limit (±10 mm).
(2)
Silk wallpaper is the best among all finishing materials, and it reduced the carbonation depth and coefficient by half compared to plain OPC owing to its function as a strong external physical barrier for the penetration of CO2 in concrete.
(3)
Silk wallpaper finishing material exhibited the minimum carbonation depth in the accelerated conditions after 1 and 13 weeks of exposure while WP and plain OPC exhibited approximately identical values.
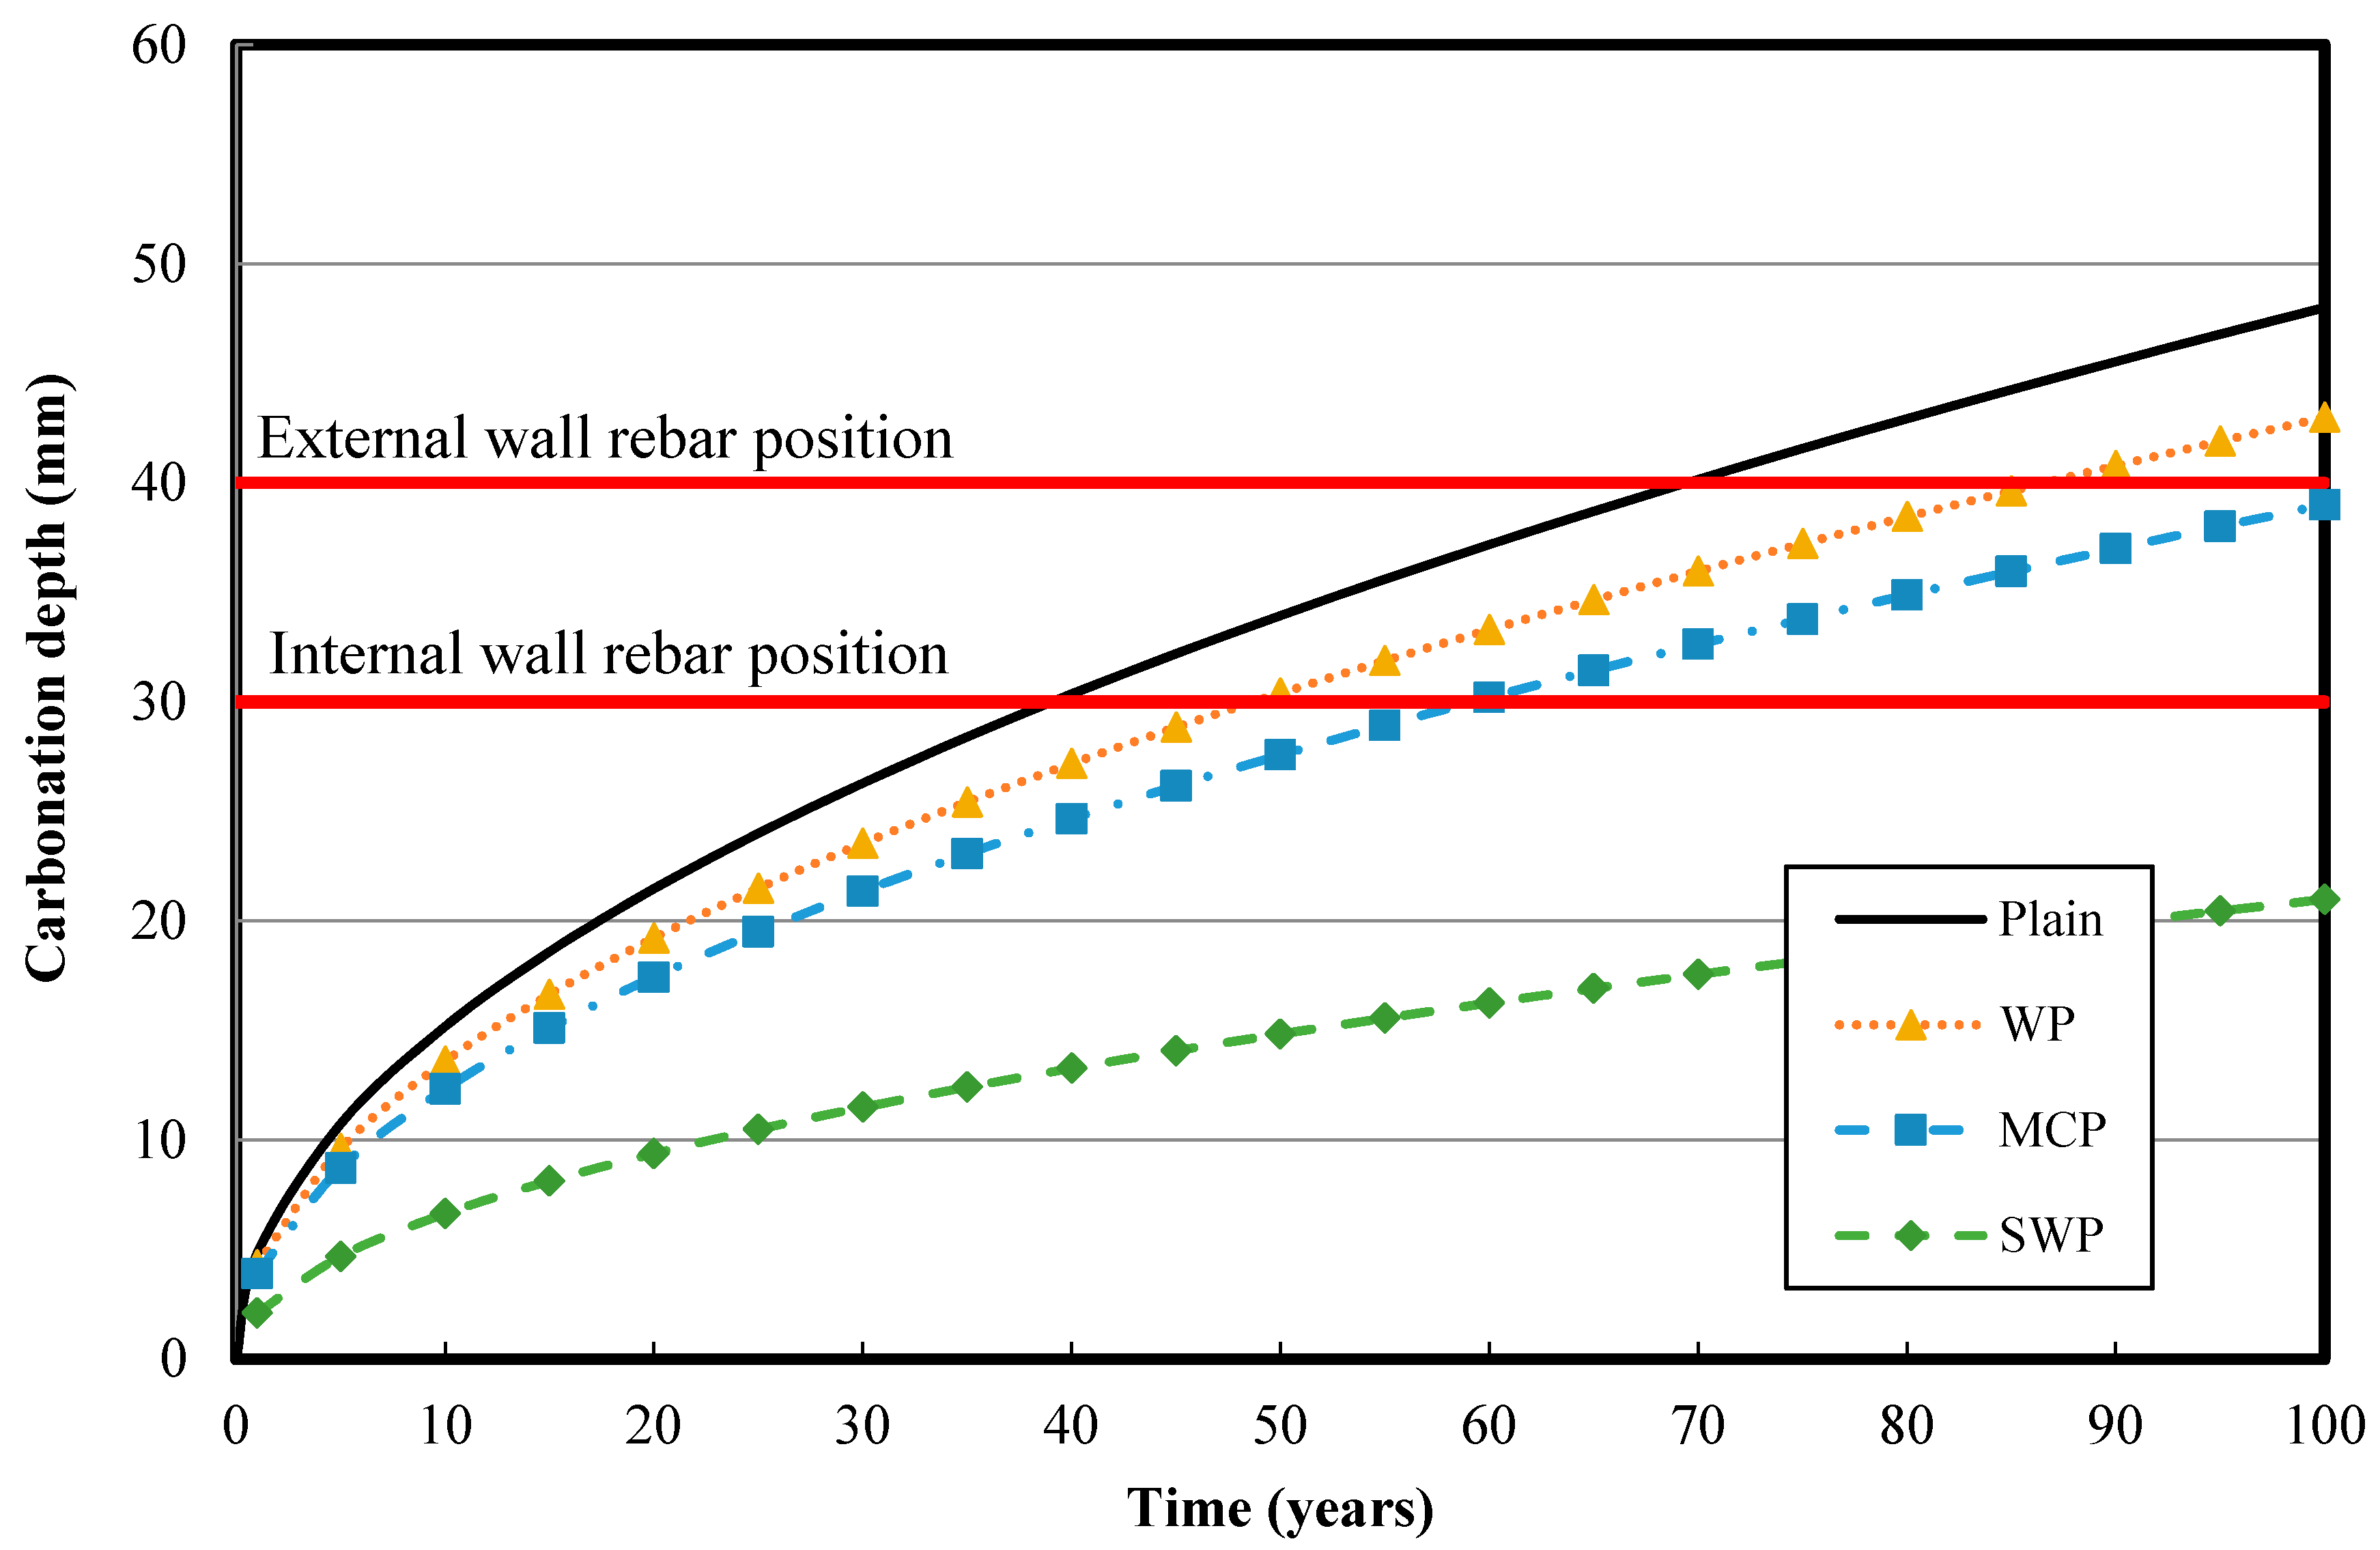
(4)
The carbonation depth prediction model showed that 40 years is required for plain OPC while for SWP, it was expected that carbonation would not reach the rebar position even after 100 years.
(5)
Finally, the accelerated carbonation experiment showed that 30% of the onset rebar corrosion would begin after 51 years for plain OPC, and 200 years for SWP.

Supplementary Materials

The following are available online at https://0-www-mdpi-com.brum.beds.ac.uk/2071-1050/10/10/3814/s1, Figure S1: Mathematical regression of carbonation coefficient for concrete with/without finishing materials with exposure duration, Table S1: Average and standard deviation of carbonation depth of concrete with/without finishing materials in accelerated conditions with different exposure periods.

Author Contributions

Data curation, H.-M.L., S.L. and J.K.S.; Formal analysis, S.L.; Investigation, H.-M.L. and J.K.S.; Methodology, H.-M.L. and S.-h.M.; Supervision, H.-S.L. and J.K.S.; Writing—original draft, H.-M.L. and J.K.S.; Writing—review & editing, H.-M.L. and H.-S.L.

Funding

This research was supported by the Basic Science Research Program through the National Research Foundation (NRF) of Korea, and was funded by the Ministry of Science, ICT, Future Planning (No. 2015R1A5A1037548) and Ministry of Education (NRF-2018R1A6A3A03013322).

Conflicts of Interest

The authors declare no conflict of interest.

References

  1. Golewski, G.L. Generalized Fracture Toughness and Compressive Strength of Sustainable Concrete Including Low Calcium Fly Ash. Materials 2017, 10, 1393. [Google Scholar] [CrossRef] [PubMed]
  2. Golewski, G.L. Improvement of fracture toughness of green concrete as a result of addition of coal fly ash. Characterization of fly ash microstructure. Mater. Charact. 2017, 134, 335–346. [Google Scholar] [CrossRef]
  3. Golewski, G.L. Green concrete composite incorporating fly ash with high strength and fracture toughness. J. Clean. Prod. 2018, 172, 218–226. [Google Scholar] [CrossRef]
  4. Pacheco-Torgal, F.; Miraldo, S.; Labrincha, J.A.L.; De Brito, J. An overview on concrete carbonation in the context of eco-efficient construction: Measurement, use of SCM´s and/or RCA. Constr. Build. Mater. 2012, 36, 141–150. [Google Scholar] [CrossRef] [Green Version]
  5. Saha, M.; Eckelman, M. Urban scale mapping of concrete degradation from projected climate change. Urban Clim. 2014, 9, 101–114. [Google Scholar] [CrossRef]
  6. Lee, H.-S.; Wang, X.-Y. Evaluation of the Carbon Dioxide Uptake of Slag-Blended Concrete Structures, Considering the Effect of Carbonation. Sustainability 2016, 8, 312. [Google Scholar] [CrossRef]
  7. Peng, L.; Stewart, M.G. Climate change and corrosion damage risks for reinforced concrete infrastructure in China. Struct. Infrastruct. Eng. 2016, 12, 499–516. [Google Scholar] [CrossRef]
  8. Yang, K.-H.; Singh, J.K.; Lee, B.-Y.; Kwon, S.-J. Simple Technique for Tracking Chloride Penetration in Concrete Based on the Crack Shape and Width under Steady-State Conditions. Sustainability 2017, 9, 282. [Google Scholar] [CrossRef]
  9. Basheer, L.; Kropp, J.; Cleland, D.J. Assessment of the Durability of Concrete from its Permeation Properties: A Review. Constr. Build. Mater. 2001, 15, 93–103. [Google Scholar] [CrossRef]
  10. Papadakis, V.G.; Vayenas, C.G.; Fardis, M.N. Physical and chemical characteristics affecting the durability of concrete. ACI Mater. J. 1991, 88, 186–196. [Google Scholar]
  11. Aguiar, J.B.; Júnior, C. Carbonation of surface protected concrete. Constr. Build. Mater. 2013, 49, 478–483. [Google Scholar] [CrossRef] [Green Version]
  12. Bentur, A.; Diamond, S.; Berke, N.S. Steel Corrosion in Concrete; CRC Press: London, UK, 1997; p. 158. ISBN 9781482271898. [Google Scholar]
  13. Alonso, C.; Andrade, C.; Gonz´alez, J.A. Relation between resistivity and corrosion rate of reinforcements in carbonated mortar made with several cement types. Cem. Concr. Res. 1988, 18, 687–698. [Google Scholar] [CrossRef]
  14. Anstice, D.J.; Page, C.L.; Page, M.M. The pore solution phase of carbonated cement pastes. Cem. Concr. Res. 2005, 35, 377–383. [Google Scholar] [CrossRef]
  15. Chi, J.M.; Huang, R.; Yang, C.C. Effects of carbonation on mechanical properties and durability of concrete using accelerated testing method. J. Mar. Sci. Technol. 2002, 10, 14–20. [Google Scholar]
  16. Bier, T.; Kropp, J.; Hilsdorf, H. Formation of silica gel during carbonation of cementitious systems containing slag cements. In Proceedings of the 3rd International Conference: Fly Ash, SilicaFume, Slag and Natural Pozzolans in Concrete, Trondheim, Norway; American Concrete Institute: Farmington Hills1, MI, USA, 1989. [Google Scholar]
  17. Bouchaala, F.; Payan, C.; Garnier, V.; Balayssac, J.P. Carbonation assessment in concrete by nonlinear ultrasound. Cem. Concr. Res. 2011, 41, 557–559. [Google Scholar] [CrossRef]
  18. Dias, W.P.S. Reduction of concrete sorptivity with age through carbonation. Cem. Concr. Res. 2000, 30, 1255–1261. [Google Scholar] [CrossRef]
  19. Verbeck, G. Carbonation of hydrated Portland cement. ASTM Spec. Tech. Publ. 1958, 205, 17–36. [Google Scholar]
  20. Hansson, C.M. Comments on electrochemical measurements of the rate of corrosion of steel in concrete. Cem. Concr. Res. 1984, 14, 574–584. [Google Scholar] [CrossRef]
  21. Pourbaix, M. Atlas of Electrochemical Equilibria in Aqueous Solution; Pergamon Press: Oxford, NY, USA, 1966; pp. 307–321. [Google Scholar]
  22. Huang, N.M.; Chang, J.J.; Liang, M.T. Effect of plastering on the carbonation of a 35-year-old reinforced concrete building. Constr. Build. Mater. 2012, 29, 206–214. [Google Scholar] [CrossRef]
  23. Park, K.-B.; Wang, X.-Y. Effect of Climate Change on Service Life of High Volume Fly Ash Concrete Subjected to Carbonation—A Korean Case Study. Sustainability 2017, 9, 157. [Google Scholar] [CrossRef]
  24. Jiang, C.; Gu, X.; Huang, Q.; Zhang, W. Carbonation depth predictions in concrete bridges under changing climate conditions and increasing traffic loads. Cem. Concr. Compos. 2018, 93, 140–154. [Google Scholar] [CrossRef]
  25. Kishitani, K.; Kobayashi, K.; Kashino, N.; Uno, Y. The Relationship between Rebar Corrosion and Neutralization in the Concrete Containing Chloride. Concr. Res. Technol. 1991, 2, 77–84. [Google Scholar] [CrossRef]
  26. Architectural Institute of Japan. Recommendations for Durability Design and Construction Practice of Reinforced Concrete Buildings, 2nd ed.; Architectural Institute of Japan: Tokyo, Japan, 2016; pp. 15–260. ISBN 9784818910751. [Google Scholar]
  27. Thiery, M.; Cremona, C.; Baroghel-Bouny, V. Application of the reliability theory to the assessment of carbonation-induced corrosion risk of rebars. Eur. J. Environ. Civ. Eng. 2012, 16, 273–287. [Google Scholar] [CrossRef]
  28. Papadakis, V.; Vayenas, C.; Fardis, M. A reaction engineering approach to the problem of concrete carbonation. AlChE J. 1989, 35, 1639–1650. [Google Scholar] [CrossRef]
  29. Bakker, R. Model to Calculate the Rate of Carbonation in Concrete under Different Climatic Conditions; CMIJ bv Laboratorium: Imuiden, The Netherlands, 1993. [Google Scholar]
  30. Lee, H.M.; Lee, H.S.; Singh, J.K. Prediction Model for the Carbonation of Post-Repair Materials in Carbonated RC Structures. Materials 2017, 10, 492. [Google Scholar] [CrossRef]
  31. Izumi, N.; Fumio, S. Neutralization of concrete and corrosion of reinforcing bars in aged buildings. J. Struct. Constr. Eng. 1989, 406, 1–12. [Google Scholar]
  32. Köliö, A.; Honkanen, M.; Lahdensivu, J.; Vippola, M.; Pentti, M. Corrosion Products of Carbonation Induced Corrosion in Existing Reinforced Concrete Facades. Cem. Concr. Res. 2015, 78, 200–207. [Google Scholar] [CrossRef]
  33. Roy, S.K.; Northwood, D.O.; Poh, K.B. Effect of plastering on the carbonation of a 19-year-old reinforced concrete building. Constr. Build. Mater. 1996, 10, 261–272. [Google Scholar] [CrossRef]
  34. Park, D.C. Carbonation of concrete in relation to CO2 permeability and degradation of coatings. Constr. Build. Mater. 2008, 22, 2260–2268. [Google Scholar] [CrossRef]
  35. Frédéric, D.; Ngoc, T.V.; Alain, S. Accelerated carbonation tests for the probabilistic prediction of the durability of concrete structures. Constr. Build. Mater. 2014, 66, 597–605. [Google Scholar] [CrossRef]
  36. KS F 2596: Korea Industrial Standards. In Method for Measuring Carbonation Depth of Concrete; Korean Standards & Certification Information Center: Seoul, Korea, 2004; pp. 1–7.
  37. KS F 2584-2010: Standard Test Method for Accelerated Carbonation of Concrete; Korean Standards & Certification Information Center: Seoul, Korea, 2010.
  38. Korea Concrete Institute. Korean Concrete Standard; Korea Concrete Institute: Seoul, Korea, 2009; Volume 81. [Google Scholar]
  39. Sci´slewski, Z. Protection of Reinforced Constructions; Arkady: Warszawa, Poland, 1999. [Google Scholar]
  40. Łakomy, T. Corrosion of Reinforcement in Bridges Depending on Concrete Condition in Structure. Ph.D. Thesis, Warsaw University of Technology, Warsaw, Poland, 2009. [Google Scholar]
Figure 1. Probability distribution according to the carbonation depth variability [26].
Sustainability 10 03814 g001
Figure 2. Schematic layout of the building.
Sustainability 10 03814 g002
Figure 3. Set up for automatic controller of the carbonation chamber.
Sustainability 10 03814 g003
Figure 4. Experimental flow chart for the accelerated carbonation test in laboratory.
Sustainability 10 03814 g004
Figure 5. Carbonation depth measurement for (a) Plain ordinary Portland cement (OPC), (b) WP, (c) MCP, and (d) SWP.
Sustainability 10 03814 g005
Figure 6. Carbonation inhibition of finishing materials in accelerated conditions.
Sustainability 10 03814 g006
Figure 7. Carbonation depth predictions of concrete with/without finishing material.
Sustainability 10 03814 g007
Figure 8. Rebar corrosion initiation probability according to the finishing materials.
Sustainability 10 03814 g008
Table 1. Allowable rebar corrosion initiation probability [26].
Importance of the BuildingColumn, Beam, Primary ReinforcementOther Rebars (Wall)
Subject to DamageNot Subject to Damage
Very important3% or less7% or less15% or less
Important5% or less15% or less30% or less
Normal10% or less30% or less50% or less
Table 2. Concrete mix of the target buildings.
w/c (%)Unit Weight (kg/m3)Additive (%)Compressive Strength
WaterCementFine AggregatesCoarse aggregate (MPa)
551683059509330.524
Table 3. Characteristics of finishing materials.
Finishing MaterialsPropertiesMinimum Thickness on Surface (mm)
ColorSpecific GravitypH
WPwhite1.3590.1
MCPblack and white190.2
SWPWhite--0.3
Table 4. Concrete cover thickness at different locations in Buildings A and B (on-site).
Measurement LocationMean Cover Thickness (mm)Concrete Cover Thickness (mm) According to Korean Concrete Standard Specification [38]
Building AInternal wallLiving room (SWP)35.830 (±10)
Laundry room (WP)37.5
Staircase (MCP)40.3
External wallRooftop50.040 (±10)
Balcony48.3
Building BInternal wallLiving room (SWP)39.830 (±10)
Laundry room (WP)38.1
Staircase (MCP)35.8
External wallRooftop45.740 (±10)
Balcony48.1
Table 5. Average carbonation coefficients of concrete with/without finishing materials in accelerated conditions for different exposure times.
Specimen Type Carbonation   Coefficient   ( mm / year )
1 Week4 Weeks8 Weeks13 WeeksAverage
Plain OPC0.520.490.460.420.47
WP0.48 0.450.410.370.43
MCP0.45 0.420.36 0.32 0.39
SWP0.27 0.25 0.19 0.14 0.21
Table 6. Probabilistic carbonation assessment variable input values.
Location Mean   Cover   Thickness   ( mm )   ( D ¯ ) Cover Thickness Standard Deviation (mm) (σ) Mean   Carbonation   Depth   ( mm )   ( C t ) ¯ Carbonation Depth Coefficient of Variation (ν)
External wallPlain OPC48.0313.8400.25
Internal wallWP37.8813.2300.18
MCP300.13
SWP300.08

