Article

Sustainability Assessment of Organic Vegetable Production Using a Qualitative Multi-Attribute Model

1
Consiglio per la Ricerca in Agricoltura e L’analisi Dell’economia Agraria, Centro di Ricerca Agricoltura Ambiente (CREA-AA), Via della Navicella 2-4, 00184 Roma (RM), Italy
2
Consiglio per la Ricerca in Agricoltura e L’analisi Dell’economia Agraria, Centro di Ricerca Orticoltura e Florovivaismo (CREA-OF), Via Salaria 1, 63030 Monsapolo del Tronto (AP), Italy
3
Consiglio per la Ricerca in Agricoltura e L’analisi Dell’economia Agraria, Centro di Ricerca Agricoltura Ambiente (CREA-AA), Via Celso Ulpiani 5, 70125 Bari (BA), Italy
*
Author to whom correspondence should be addressed.
Sustainability 2018, 10(10), 3820; https://0-doi-org.brum.beds.ac.uk/10.3390/su10103820
Submission received: 10 September 2018 / Revised: 12 October 2018 / Accepted: 16 October 2018 / Published: 22 October 2018
(This article belongs to the Section Sustainable Agriculture)

Abstract

:
Organic agriculture is perceived as environmentally sustainable, but, under its umbrella, different production systems exist ranging from simplified organic productions to well diversified systems with a full implementation of agro-ecological approaches. Among several developed tools for agriculture sustainability assessment, multi-criteria models are increasingly gaining importance. In this study, we evaluated the use of the multi-criteria DEXi-BIOrt tool, coupled with data from long-term experiments, for the sustainability assessment of different organic vegetable production scenarios. These scenarios were applied in two Italian areas: the Adriatic coast of Marche Region and the Metaponto plan of Basilicata Region. Despite the presence of some critical issues, DEXI-BIOrt proved to be a valid tool for the sustainability evaluation of organic vegetable productions. In both areas, the most sustainable scenarios resulted the well diversified organic systems characterized by proper rotations, inclusion of agro-ecological service crops, cultivation of local and different cultivars, and presence of short supply chain mechanisms. Conversely, the implementation of the simplified organic substitution scenarios does not guarantee a suitable level of sustainability. The findings of this study could support decision makers in the implementation of appropriate measures for enhancing organic production sustainability in the framework of post-2020 Common Agricultural Policy.

1. Introduction

In recent years, agriculture has faced an increasing number of challenges imposed by climate change, resource reduction, market volatility, and production of raw materials to guarantee food security and to reduce dependence on fossil provisions [1]. At the same time, agricultural systems are deeply changing to satisfy the developed society and consumer expectations which demand more sustainable products characterized by higher quality and reduced environmental impacts. Moreover, productive systems able to guarantee and preserve employment are required. More efficient agriculture models were proposed and implemented to address these challenges and respond to the increasing demand of sustainability [2]. Nevertheless, the sustainability assessment of agricultural systems is a very difficult issue because of complexity and multidimensionality of sustainability and the presence of conflicting and opposing objectives. In fact, Ikerd [3] defined sustainability in agriculture as the ability to satisfy simultaneously a series of objectives such as food production, environmental protection, economic viability, and social acceptance and to maintain this capacity in a long-term period.
Over the past decades, several methodologies and tools were developed to perform studies on sustainability assessment [4]. The dimensions or pillars covered by the analysis can vary. Some studies are focused on particular aspects commonly related to the environmental or agro-environment dimension, while others consider jointly the three classic environmental, economic, and social pillars and their interconnections [5,6].
The utilization of a sustainability assessment tool in agriculture can have various purposes including research, monitoring, certification, self-assessment, farm advice, and landscape planning [7]. Bockstaller et al. [8] have divided the tools for the sustainability assessment in three broad categories: (i) ex-post evaluation for acquiring knowledge on an implemented system; (ii) ex-ante evaluation for the evaluation of various scenarios in order to define the most sustainable option; and (iii) evaluation for communication or social learning purposes that require easily understandable procedures.
Among several developed tools for the sustainability assessment, the multi-criteria analysis (MCA) methods are increasingly gaining importance in agriculture as they can evaluate multiple and conflicting criteria [9,10] and they are able to analyze complex decisional problems breaking them down in smaller and easily understandable elements [11]. In a comparative review of various MCA models, Sadok et al. [12] assert that tools managing qualitative information are more relevant and effective in coping with the multi-dimensional constraints of the sustainability such as incomparability, non-compensation, and incommensurability of data coming from different dimensions. The development environments that use qualitative methods such as DEXi software [13] have demonstrated to be particularly suitable for creating these types of models [2]. In recent years, the scientific community has developed several qualitative MCA tools based on DEXi for the sustainability assessment of different agriculture systems such as arable [14,15,16], vegetable [17,18], and fruit crops [19,20]. Some of the available MCA tools are specifically focused on organic systems as DEXi-BIOrt [18] used to evaluate the agroecosystem sustainability of organic vegetable farms.
In this study, we hypothesized that the use of a MCA tool can support the ex-ante agroecosystem sustainability evaluation of different management scenarios in organic farming systems. Using this assessment tool, the general aim was to evaluate the extent to which the partial or the whole implementation of the agro-ecological approaches affect the overall agroecosystem sustainability of small-sized Italian organic vegetable farming systems. For achieving this aim, we used DEXi-BIOrt model because of its spatial resolution (farm scale), its specific analysis on organic vegetable systems, and its focus on the agro-environmental pillar of sustainability.
DEXi-BIOrt was recently developed and it was applied only in very few Italian case-studies but without implementing any analysis on the effects of the model tree structure and its parametrization on the output results. For these reasons, the specific objectives of this study were: (i) to test and evaluate DEXi-BIOrt model and its hierarchic structure in order to better understand its usefulness and the reliability of the model results and (ii) to assess the agroecosystem sustainability of different organic vegetable farming scenarios applied in two different Italian areas (Adriatic coast of the March Region—Central Italy—and the Metaponto plan of the Basilicata Region—Southern Italy) under Mediterranean conditions for supporting proper policies to enhance organic agriculture sustainable development.

2. Materials and Methods

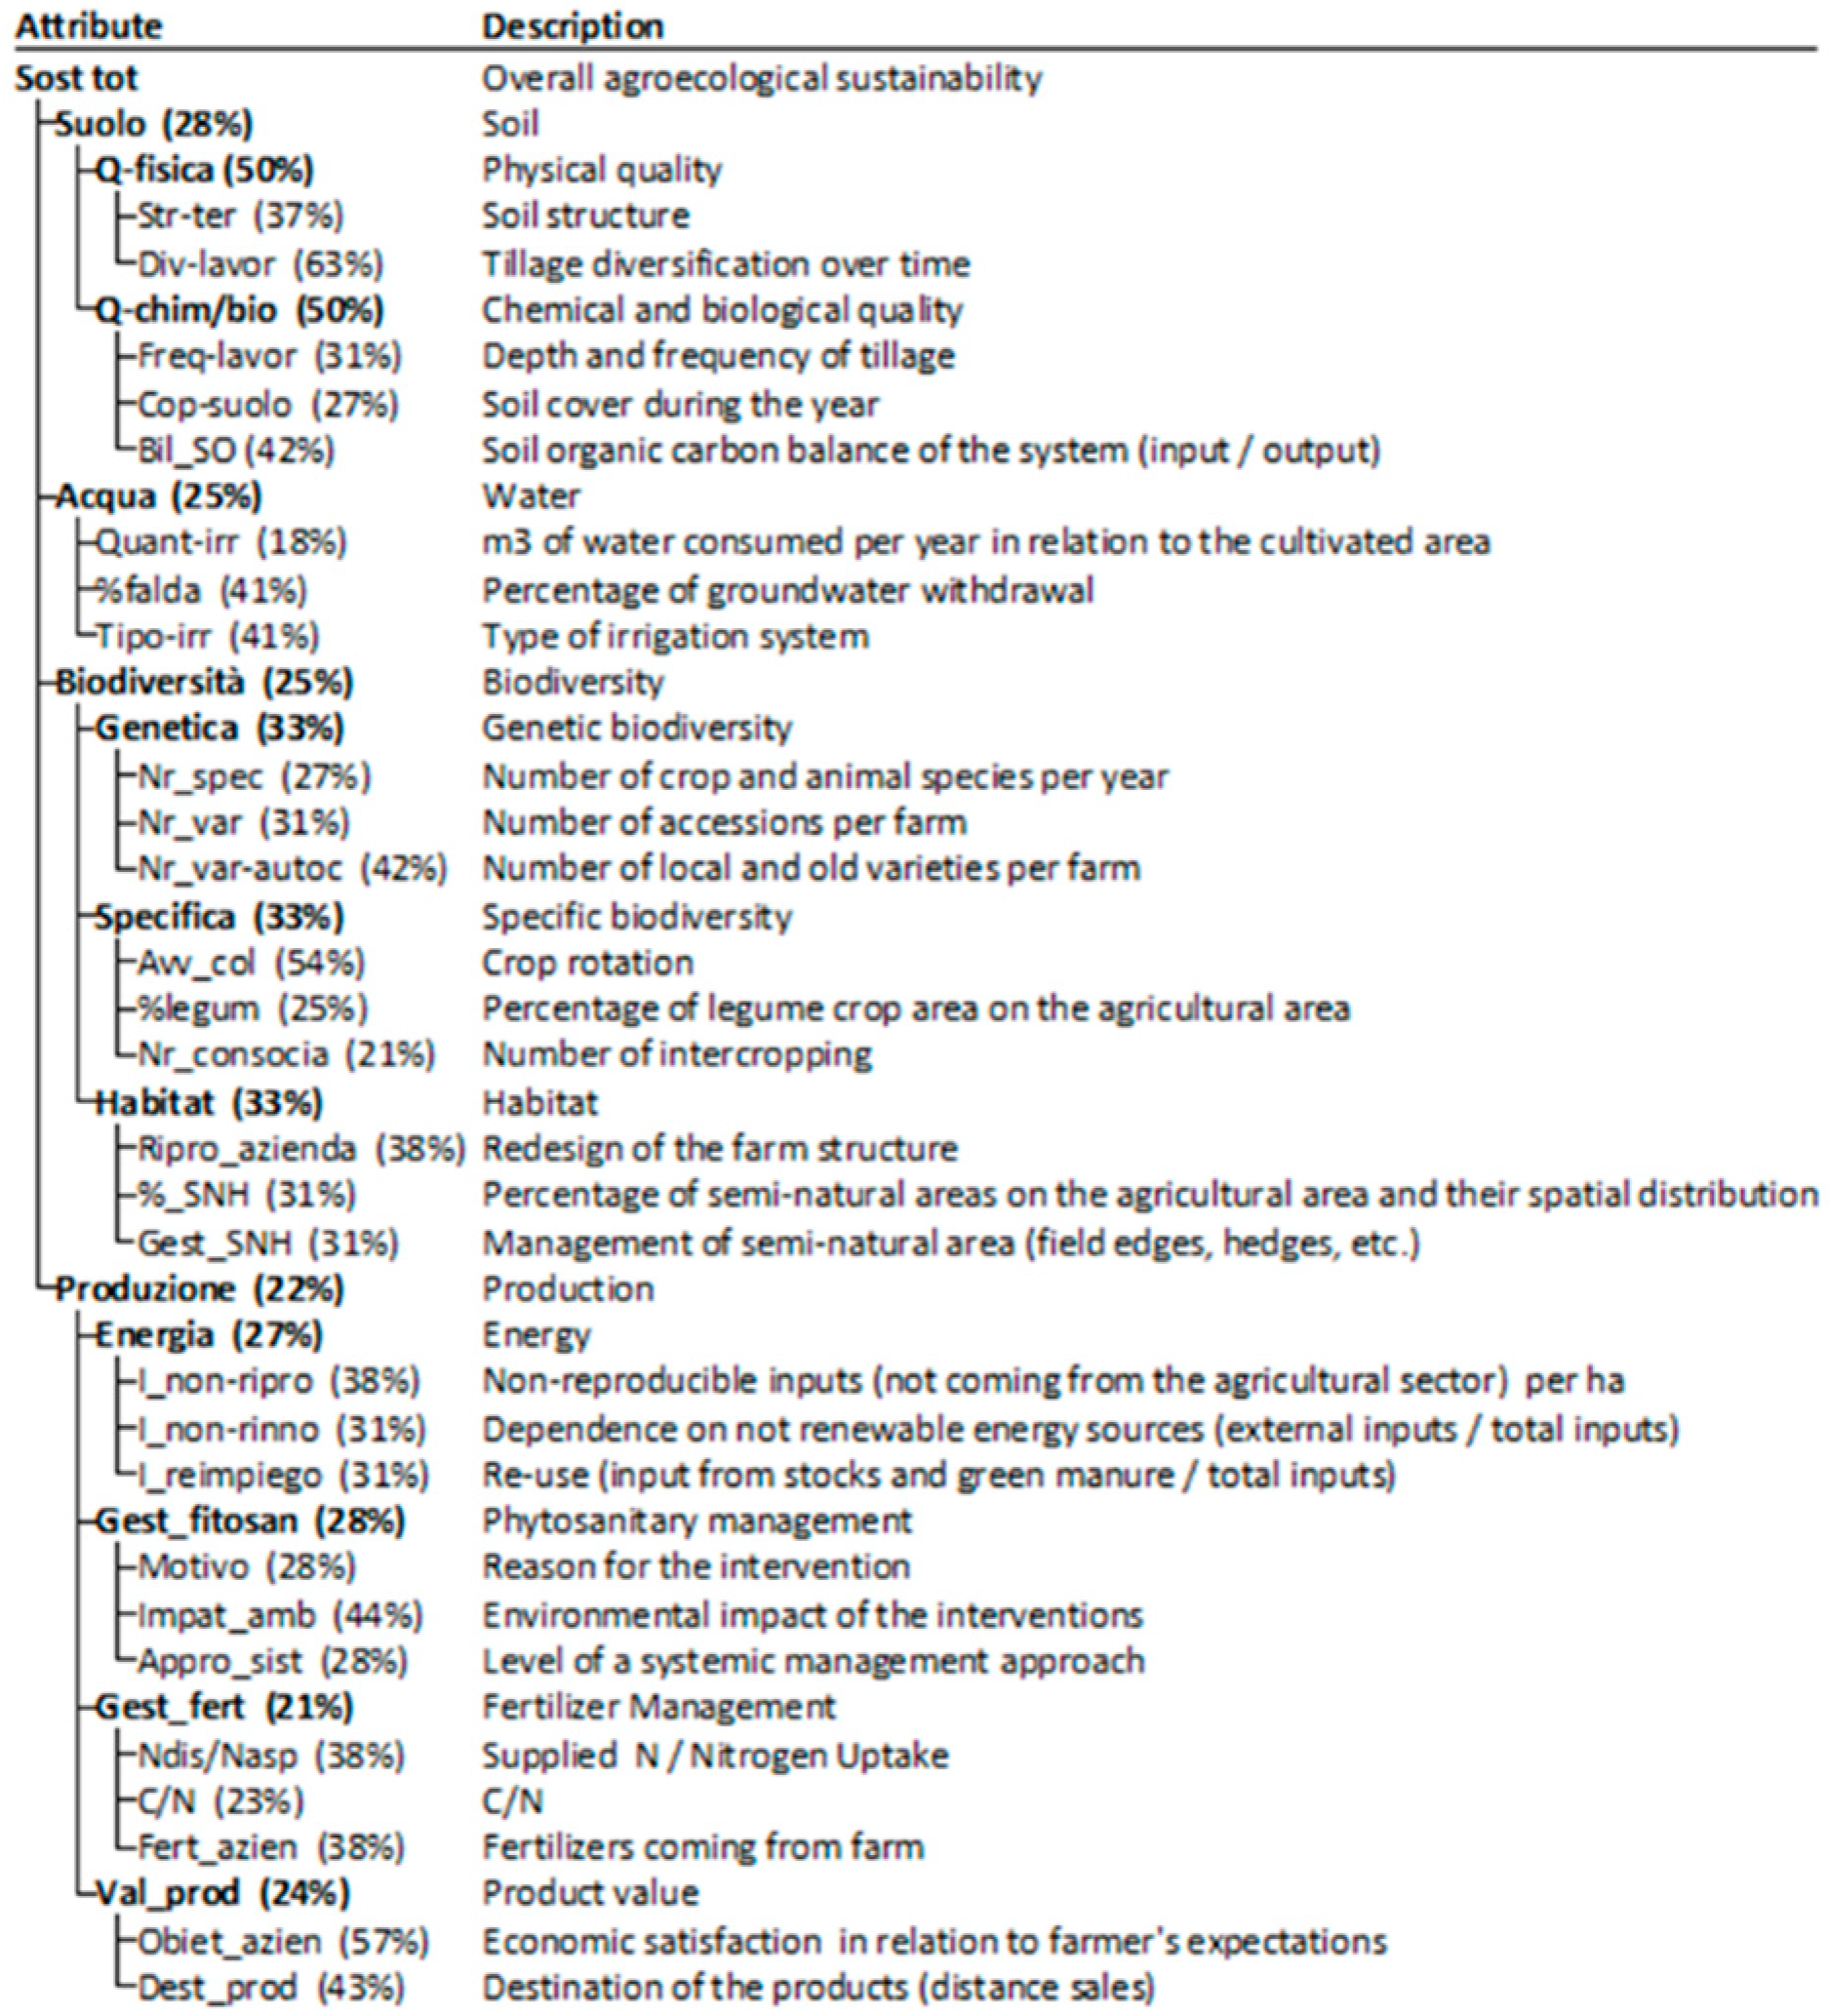
2.1. Assessment of Agro-Ecological Sustainability by DEXi-BIOrt

DEXi-BIOrt is a free open tool available at http://www.firab.it/site/progetti/sos-bio/. It is based on a hierarchical decision tree structure (Figure 1) composed of 43 variables: 28 basic variables (i.e., leaves or input variables), and 15 aggregated ones. Most of the variables are qualified by three qualitative values: “Low”—no sustainable, “Medium”—sustainability threshold, “High”—sustainable. Five basic variables (Div-lavor, Motivo, Appro_sist, Ndisp/Nasp, Obiet_azien) lack the medium class.
The basic variables are aggregated by “if-then” decision-rules or utility functions [13] according to their weights (Figure 1) in order to allow the qualitative assessment of: (1) the sub-components (Soil: Physical soil quality, Chemical and Biological soil quality; Water: Irrigation Management; Biodiversity: Genetic Biodiversity, Specific Biodiversity, and Habitat; Production: Energy, Phytosanitary Management, Fertilizer Management, and Product Value); (2) the four main agroecosystem components (Soil, Water, Biodiversity, and Production); (3) the most aggregated variable of the hierarchy (i.e., the root variable or the output of the model), which is the overall agro-environmental sustainability of the organic vegetable farming system.
To evaluate the sustainability of a farming system, a vector of 28 input variables must be provided to the software that aggregates them up to the root variable. The results are presented as scatter, bar, or radar plots. In order to facilitate the creation of the input variables for the hierarchical decision tree model, DEXi-BIOrt has accomplished by several tools such as: (i) a questionnaire to collect data on the farming system; (ii) an excel file for the elaboration of the collected data and the computation of 28 input variables; (iii) a template for importing the input variables into the hierarchical DEXi-based tree model; (iv) a user manual for all the available tools. DEXi-BIOrt was designed to be easily used by individual farmers interested in the sustainability assessment of their production systems, and technicians of public and private sectors to compare the sustainability of organic vegetable farming systems in an area.

2.2. DEXi-BIOrt Sensitivity Analysis

A sensitivity analysis (SA) was conducted in this study to better understand how the model tree structure affects the results and to identify the most significant variables that contributed more on output variability. The SA was carried out using the IZIEval interface (http://wiki.inra.fr/wiki/deximasc/Interface+IZI-EVAL/Accueil), a sensitivity analysis tool that was developed for the hierarchical qualitative DEXi-based models. IZIEval interface uses Algdesign and XML packages of the open-source R software [21] to perform the analysis.
In this study, we used the IZIEval interface to obtain:
(i) the Sensitivity Indexes (SI) of the root variable with respect to its descendants. For the SI computation, an equal weight or probability of occurrence was automatically attributed by the software to all possible values of each variable. In the variables that have 3 modalities (Low, Medium, High), the weight was set at 0.33 for each value. In variables that have two classes (Low and High), the weight of each value was equal at 0.50. These probabilities are used by IZIEval to calculate the conditional probabilities of each aggregated variables with respect to its leaves using the equations proposed by Carpani et al. [11]. Based on the conditional probability calculation, the first-order SI is performed by the software by applying the equation:
SI(L:Y) = Var (E(Y|L))/Var(Y)
where
  • SI(L:Y) is the sensitivity index of the variable Y with respect to the descendant variable L
  • (E(Y|L)) is the expectation of Y conditional on L
  • Var(Y) is the variance of the variable Y
The SI values of each basic attribute and the main components of DEXi-BIOrt referring to the root variable (the overall sustainability) were calculated. The higher the SI, the more important is the effect of the variable on the overall sustainability. By using the hierarchical model tree structure, SI results are influenced by aggregation weights and number of the basic variables at the same level, the aggregation weights of the aggregated variables, and by the depth levels.
(ii) the Monte Carlo (MC) analysis that provides the relative frequency distribution of the output values of an aggregated variable by randomly sampling and simulating a large number of values of each leaf variable. In this study, 5000 samples were generated and simulated using IZIEval to obtain the frequency distribution of the values of the root variable and its main components.

2.3. Organic Vegetable Production Scenarios

The ex-ante sustainability assessment of potential organic vegetable farming systems located in two areas, namely the Adriatic coast area of the March Region (Central Italy) and the Metaponto plan of the Basilicata Region (Southern Italy), was performed in order to compare the different productive systems highlighting their relative strengths and weaknesses.
Within the context of agriculture sustainability assessment, the long-term experiments (LTEs) are powerful research facilities which can provide data for monitoring trends and evaluating different management strategies overtime [22]. The utilization of their data for the analysis guarantees the reliability of the results. This aspect is particularly relevant in organic agriculture where most of the involved processes reaches stability only after a long period from the organic conversion [23,24,25]. Therefore, in this study the main input required by DEXi-BIOrt were provided by two long-term organic vegetable experimental trials carried out on two research farms of the Council for Agricultural Research and Agricultural Economics Analysis (CREA): MOVE-LTE (MOnsampolo VEgetable organic Long-Term field Experiment), and MITIORG-LTE (Long-term climatic change adaptation in organic farming: synergistic combination of hydraulic arrangement, crop rotations, agro-ecological service crops and agronomic techniques).
According to the crop rotations of the two research farms, different organic vegetable production scenarios ranging from organic substitution to a full implementation of agroecological approaches were settled for each area. Data related to yield, above-ground biomass, and cultivars of both cash and agroecological service crops, soil texture and soil organic content, tillage, fertilization, phytosanitary and water management, electric energy, and fuel consumptions were defined using LTE information. Both LTEs were divided into different rotational areas, so that all crops being annually present in the fields. In order to consider well-established systems representative of long-term organic managements, data from the last available crop season (taking into account the different rotational areas) were used in this work.
Conversely, data related to the destination of products were defined hypothesizing a preference for short supply channels in the agroecological scenarios and a selling of products to the large organized distribution system in the substitution options.

2.3.1. MOVE LTE and the Adriatic Coast Scenarios (Central Italy)

The MOVE LTE [26] started in 2001 at Monsampolo del Tronto (AP, 42°53′ N, 13°48′ E). The Monsampolo site is characterized by a thermomediterranean climate [27] and the soil is Typic Calcixerepts fine-loamy, mixed thermic [28]. The organic LTE experiment covers an area of 2112 m2 and it is based on the following 4-year crop rotation: tomato (Lycopersicon esculentum Mill.), melon (Cucumis melo L.), fennel (Foeniculum vulgare M. var. azoricum), lettuce (Lactuca sativa L.), cauliflower (Brassica oleracea L. var. botrytis), and bean (Phaseolus vulgaris L.). Three different agroecological service crops (ASC) [29], commonly defined as cover crops or green manure, are included in the rotation of the organic system: hairy vetch (Vicia villosa R.), grown before tomato transplanting, barley (Hordeum vulgare L.) grown before melon, and radish (Raphanus sativus L.) grown before lettuce. The implemented agronomic management follows an agro-ecological approach for both conservation tillage and crop diversification strategies. The MOVE LTE device can be considered as an organic vegetable farm of the Marche region as it reproduces on a small scale a cropping system including all the common crops present in the central Adriatic coastal area. Furthermore, as the research farm adhered to the organic certification in 2001, it is subjected to the same inspection processes and regulations as the other organic farms in the area.
Three organic farming scenarios (Table 1) having a surface of 2 ha, were defined for the Marche region on the basis of data provided by MOVE-LTE. In all the scenarios, the four-year crop rotation implemented in the device was established with different management approaches:
1. CO2007 represents an organic vegetable farm immediately after its organic conversion phase. This scenario is characterized by the utilization of ASCs in the rotation, in-farm seedling production, and 100% of product sales through short chain mechanisms. The experimental data of the crop season 2006–2007 were used for this scenario. The experience gained in the MOVE-LTE device has shown that, immediately after the conversion phase, a farm still has to cope with problems related to soil fertility, weeds, and phytopathogens. For this reason, a greater amount of off-farm inputs (Table 1) has been used under CO2007;
2. AE2016 represents an organic vegetable farm in which a suitable agro-ecological management has been applied for a very long term period. This management has improved soil fertility and the system resilience thus creating the right conditions to allow an off-farm input reduction, especially fertilizers. The experimental data related to the crop season 2015–2016 were used for this scenario that is characterized by a whole implementation of the agroecological approaches such as the use of ASCs, in-farm seedling production, the implementation of the In Line Tillage Roller Crimper (ILRC) technology for work hour reduction and energy saving purposes [30], and the sale of 100% of the products through short chain mechanisms;
3. SU2016 is a substitution scenario where a simplified organic production system is adopted. This scenario imitates the conventional agriculture, but it applies only the allowed agrochemical organic products. For the simulation of this scenario we considered the same yields of AE2016, no ASCs, double doses of plant protection products than those applied in AE2016, and the same amounts of fertilizer inputs used in CO2007. Furthermore, the seedlings are all purchased and the whole production is sold to large-scale distribution system. This substitution scenario represents one of the most common management system implemented in the organic farms of the Marche region.

2.3.2. MITIORG LTE and the Metaponto Plan Scenarios (Southern Italy)

The MITIORG LTE [31] is located at Metaponto (MT), in Southern Italy (40°24’ N; 16°48’ E). The Metaponto site is characterized by an accentuated thermomediterranean climate [27]. The soil is Typic Epiaquert [28], with poor drainage and a superficial water table. Extreme rainfall events and temporary soil flooding frequently occur in the area, causing a loss of winter crop production. MITIORG device was established in 2014 and it relies on a combination of integrated techniques to ensure the adaptation of vegetable systems to high intensity rainfall and flooding events, namely: (i) strip cropping based on hydraulic soil arrangement characterized by a ridge-furrow system in which vegetable crops are cultivated both above the three ridges and between them in the four furrowed soil strips; (ii) eco-functional rotation of vegetable crops; (iii) introduction of ASCs in the crop rotation defined as living mulch on the ridge and break crops on the furrow soil strips; (iv) organic fertilization to increase soil organic carbon content using organic fertilizers and amendments, allowed in organic farming; and (v) conservation tillage practices to maintain soil fertility. In the crop rotation on the ridge soil strips, the experimental device considers the living mulch (generally burr medic, Medicago polymorpha L. var. anglona, or crimson clover, Trifolium incarnatum L.) intercropped with a winter cash crop (such as fennel or cauliflower) and maintained as a living ground cover throughout its growth cycle. The ASC is terminated prior to the subsequent cash crop planting (such as tomato). In the furrow soil strips the break crops are cultivated during the winter period. The following mixtures were tested: vetch (Vicia sativa L. cv Marianna)—barley (Hordeum vulgare L. cv Lutece); rice (Oryza sativa L.)—field pea (Pisum sativum L.)—rapeseed (Brassica napus L.); rice—faba bean (Vicia faba minor L.)—rapeseed; vetch-oats (Avena sativa L.); oats-rice. After the ASC termination, the subsequent cash crop (such as tomato, zucchini, or lettuce) is planted.
Six scenarios were defined for the Basilicata region on the basis of MITIORG information coming from the crop season 2015–2016. They were divided in 2 groups depending on the presence or absence of living mulch on the ridge soil strips. In all the scenarios that are characterized by an increasing application of the agro-ecological approaches, an organic vegetable farm of 2 ha was considered.
Group without living mulch
1. Scenario A represents the substitution organic scenario characterized by no strip cropping and no ASCs. Number of cultivars and biotic stress management are as in the device. In this scenario, 100% of products are sold to large-scale distribution system;
2. Scenario B is characterized by the presence of strip cropping but without any ASCs in the furrowed soil strips. In this option, 50% of the products are distributed through short chain mechanisms and 50% to large-scale distribution system;
3. Scenario C is similar to the previous scenario with the only difference to have ASCs as break crops in the furrowed strips;
Group with living mulch
4. Scenario D has the strip cropping arrangement but without any ASCs in the furrowed strips. Number of cultivars and biotic stress management are as in the device and products are sold 50% through short chain mechanisms and 50% to large-scale distribution system;
5. Scenario E is similar to the previous scenario with the only difference to have ASCs as break crops in the furrowed strips;
6. Scenario F presents a more advanced implementation of the agro-ecological approaches. It is characterized by the presence of the strip cropping arrangement with the ASCs in both ridge and furrowed strips, an optimum management of semi-natural areas, the use of two cultivars for each cash crop, and by the sale of the whole production through short chain mechanisms.

3. Results

3.1. DEXi-BIOrt Sensitivity Analysis

The results of the SI calculation for the basic attributes are reported in Figure 2.
The basic variables showing the longest bars have the main influence on the overall sustainability. “Tillage diversification over time—Div-lav (Till_div)” (SI = 0.15), “Soil organic carbon balance—Bil_SO (SOC-bal)” (SI = 0.046), and “Soil structure—St-ter (soil_str)” (SI = 0.037) were the most influential variables of the Soil component. Considering the Water component, “Type of irrigation system—Tipo-irr (Irr_sys)” and “Percentage of groundwater withdrawal—%falda (%_withdr)” attributes affected the overall sustainability with the same SI value (SI = 0.052). The sensitivity analysis highlighted the “Crop rotation—Avv_col (Rot)” (SI = 0.018) as the most influential basic attribute for Biovidersity and “Destination of products—Dest_prod” (SI = 0.019) and “Environmental impact of the interventions—Impat_amb (Envir_imp)” (SI = 0.017) for the Production component.
The contribution of the main components to the overall sustainability was quantified as a sensitivity index value of 0.330, 0.166, 0.150, and 0.210 for Soil, Water, Biodiversity, and Production, respectively.
The frequency distributions of the 5000 simulated outputs of the MC analysis for the overall sustainability and for the main model components are reported in Table 2.
The root variable and the Soil component had the qualitative values “Low” (MC = 0.675 and MC = 0.400, respectively) that occurred more frequently than the other modalities, while the “Medium” value was the most frequent modality for the other components (MC = 0.553 for Water, MC = 0.739 for Biodiversity, and MC = 0.540 for Production).

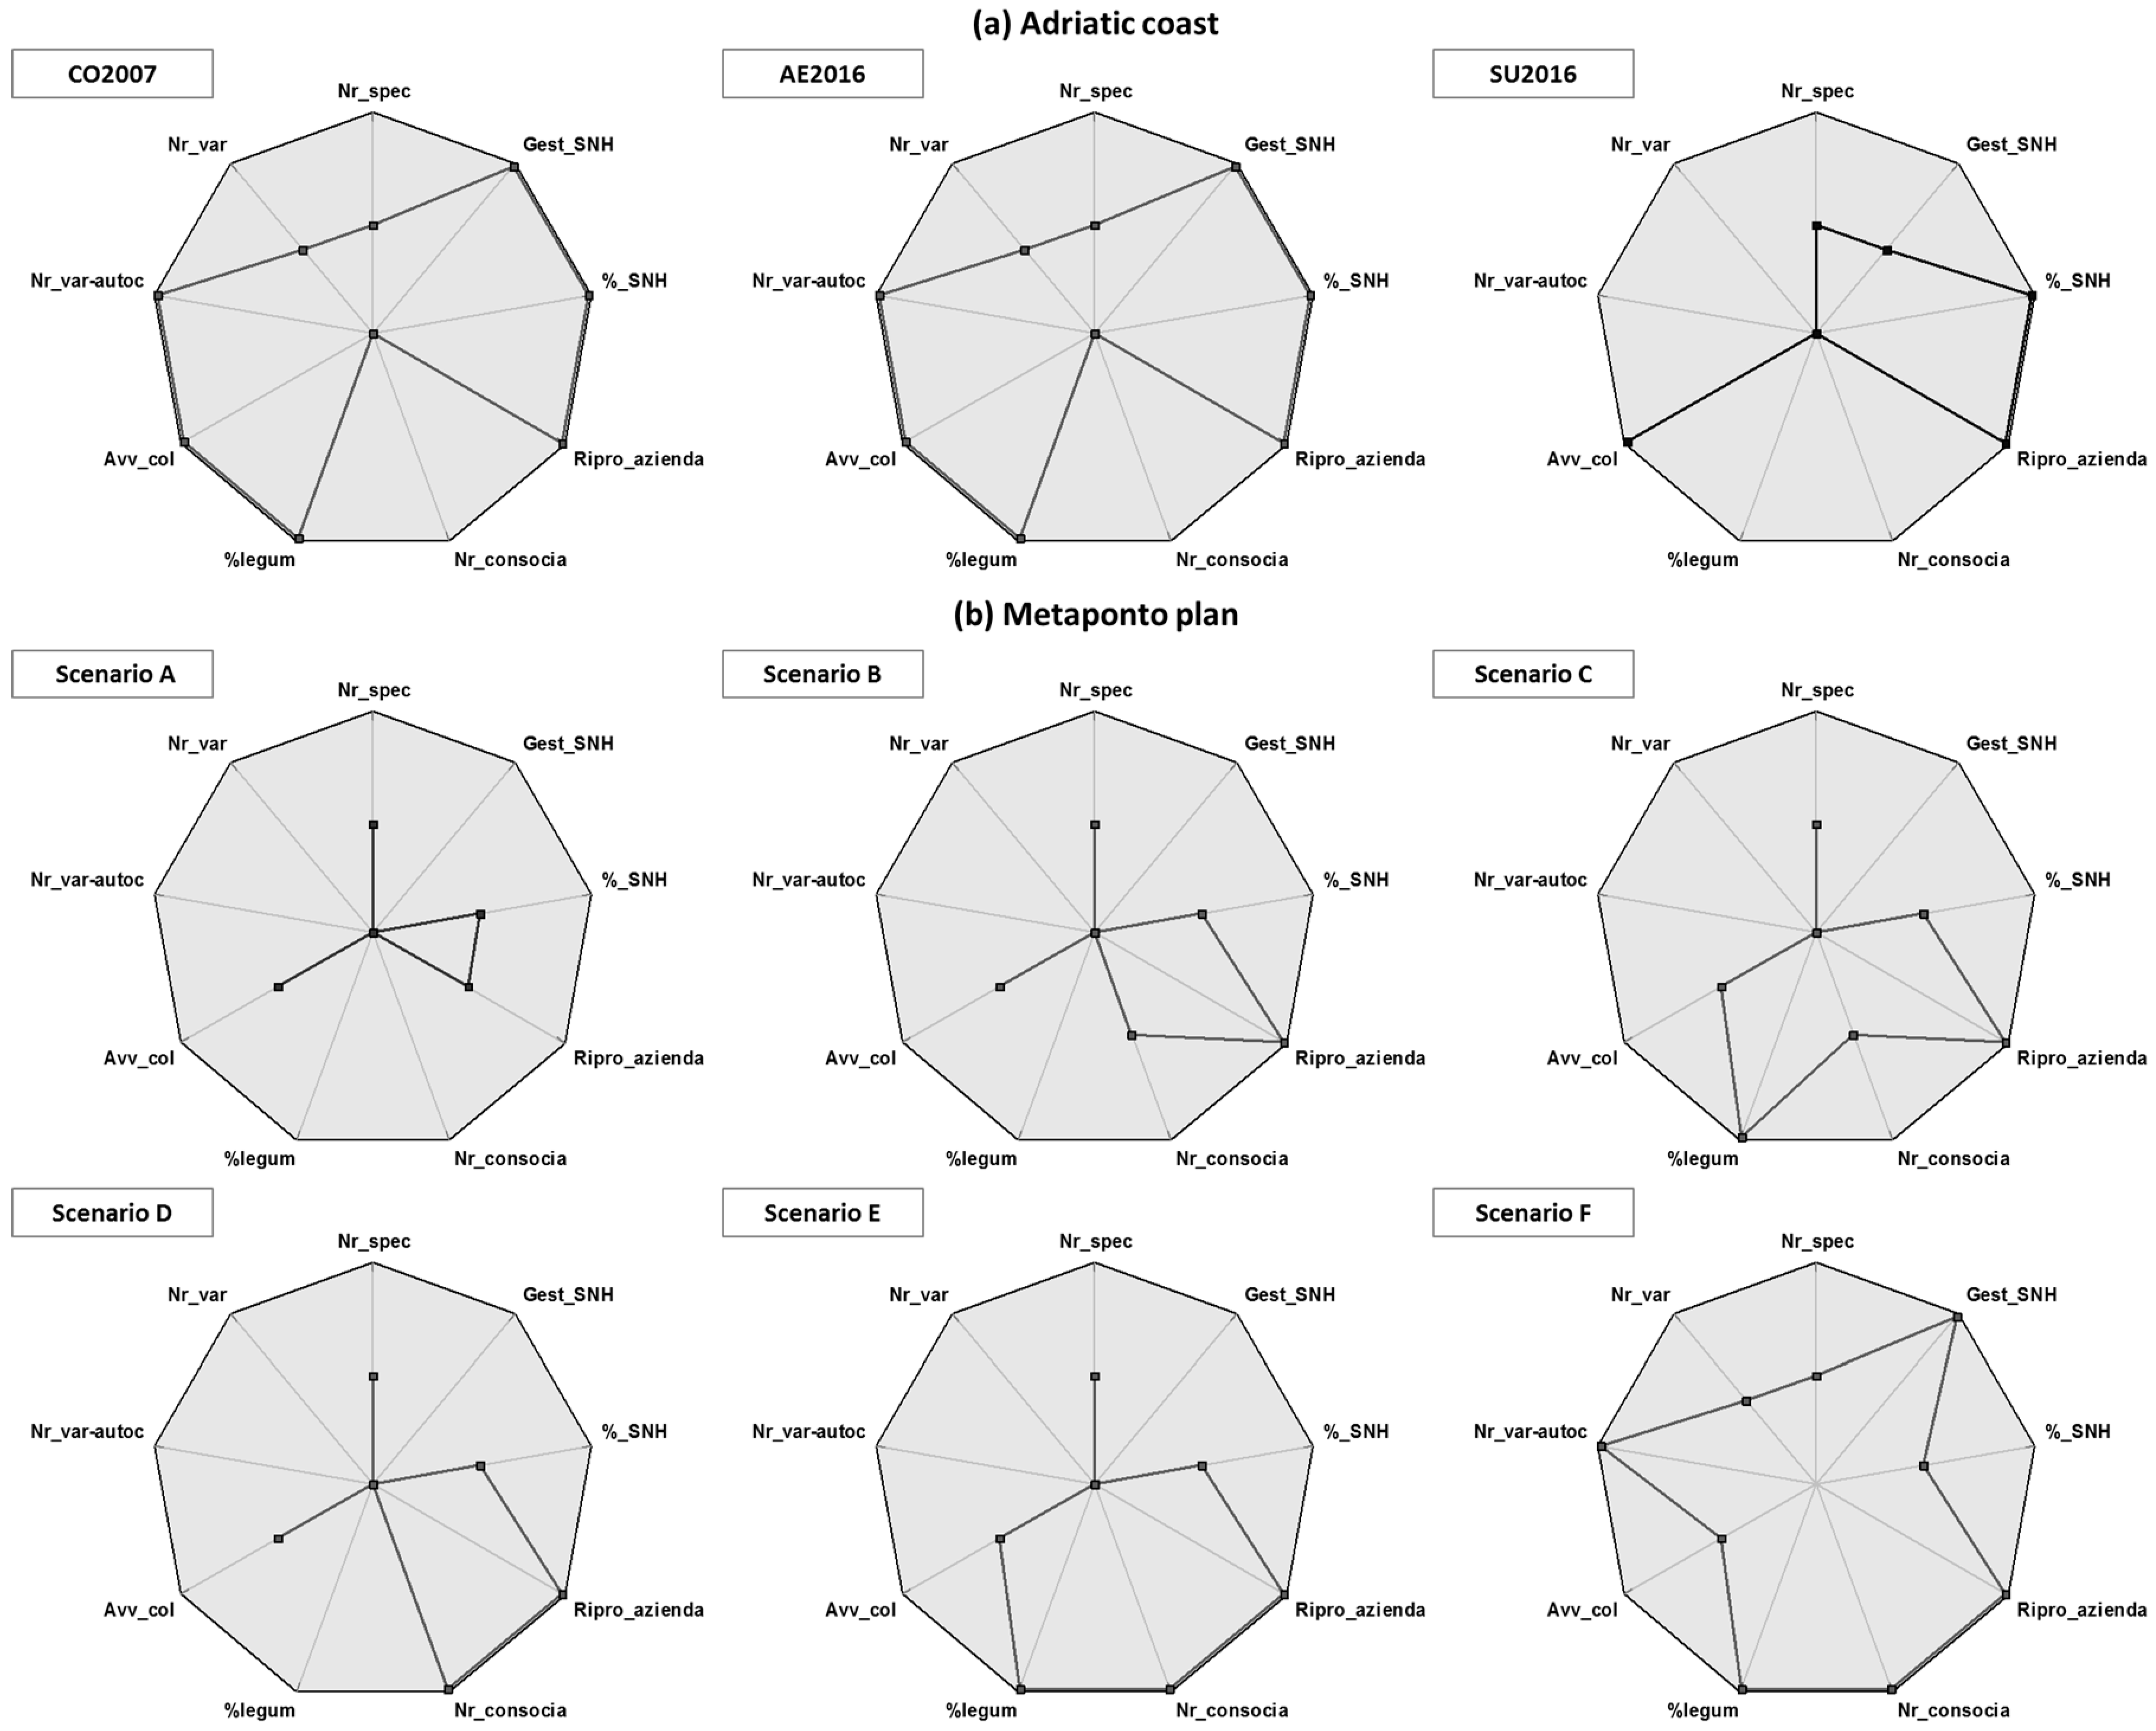
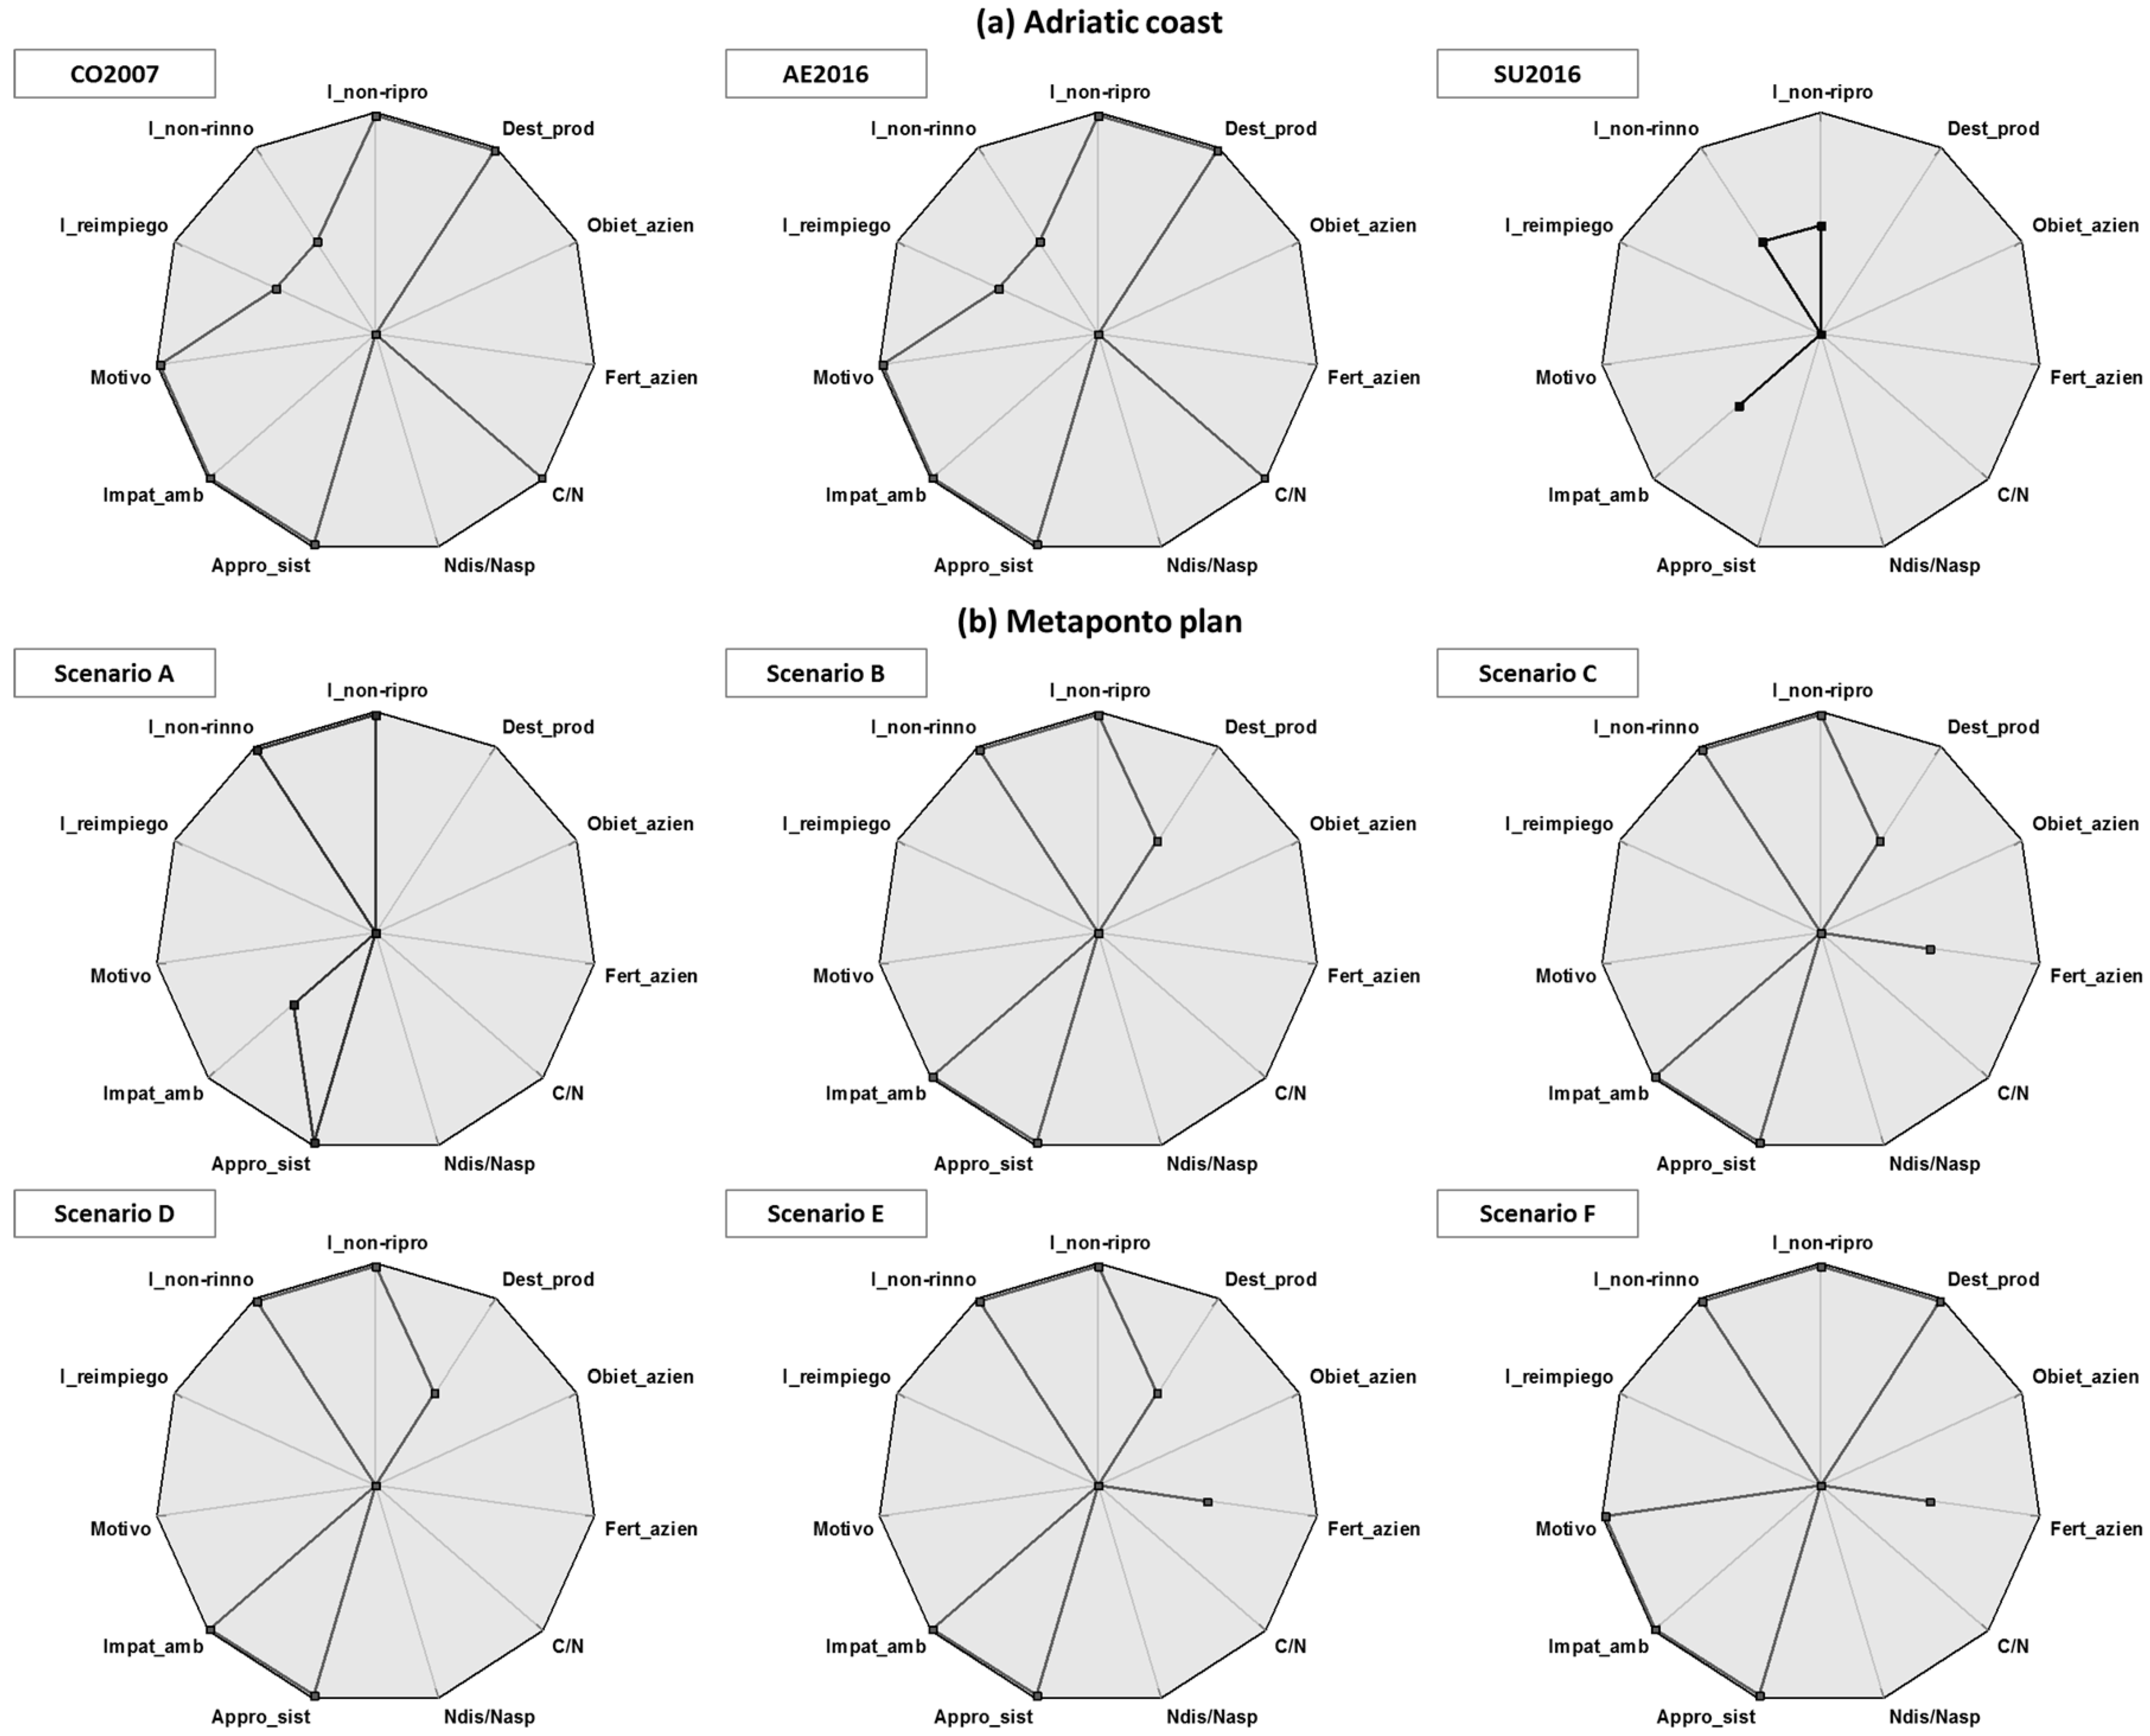
3.2. The Sustainability Evaluation of the Adriatic Coast Scenarios (Central Italy)

The sustainability evaluation of the main components and sub-components for the Adriatic coast scenarios are reported in Table 3.
For the Soil component, AE2016 and SU2016 obtained the best scores (high), while CO2007 was assessed as medium. The difference was due to the “Soil structure—St-ter (Soil_str)” attribute that reached a medium value in AE2016 and SU2016 and a low score in CO2007. All the scores of the other basic soil variables were instead the same in all the scenarios that obtained the High score for all the attributes, except for “Soil organic carbon balance—Bil_SO (SOC_bal)” which was evaluated as low.
Considering the Water component, all scenarios reached the same score (high value) because the water management was the same in all the three options. This high value was determined by a medium score for both “m3 of water consumed—Quant-irr (Wat_m3)” and “Type of irrigation system—Tipo-irr (Irr_sys)” attributes and by a high value for “Percentage of groundwater withdrawal—%falda (%_withdr)”.
The AE2016 and CO2007 performed equally and better than SU2016 for the Biodiversity obtaining the best score for all the sub-components (Genetic, Specific, and Habitat). In detail (Figure 3), the main differences between the first two scenarios and SU2016 in Biodiversity were due to the low scores reached by the substitution scenario for “Number of cultivars—Nr_var (N_cult)” and “Number of local cultivars—Nr_var-autoc (N_loc_cult)” attributes in the Genetic Biodiversity, and “Percentage of legume area—%legum (%_leg)” for the Specific Biodiversity. Conversely, SU2016 was able to obtain the same high score as the other scenarios for the Habitat sub-component.
The AE2016 and CO2007 obtained the same evaluations for the basic variables (Figure 4) and the sub-components of Production, reaching a high value for Energy and Phytosanitary management, a medium score for Product value, and a low score for Fertilizer Management.
The latter worse score was determined by the low values of the “Supplied N/Nitrogen Uptake—Ndisp/Nasp (Ninp/Nout)” and “Fertilizers coming from farm—Fert_azien(N_farm)” attributes. SU2016 showed worse performance than the other scenarios, especially for the low values assessed for “Re-use (input from stocks and green manure/total inputs)—I_reimpiego (Re-use)” attribute in Energy, “Reason for intervention—Motivo (Int_reas)” and “Level of a systematic management approach—Appro_sist (System_manag)” variables in Phytosanitary management, and for all the basic attributes of both Fertilizer Management and Product Value sub-components.
Considering the overall sustainability given by the final aggregation of all the variables, AE2016 and CO207 were qualified as sustainable systems (high score) while SU2016 was considered as a no sustainable scenario.

3.3. The Sustainability Evaluation of the Metaponto Plan Scenarios (Southern Italy)

The sustainability assessment of the components and sub-components obtained with DEXi-BIOrt for the Metaponto plan scenarios are shown in Table 3.
All the scenarios obtained a medium score for the Soil component principally due to the bad performances (low values) reported by the basic attributes “Soil structure—St-ter (Soil_str)” and “Soil organic carbon balance—Bil_SO (SOC_bal)” in all the options.
As all the scenarios were characterized by the same irrigation management, the Water component was qualified with the same score (high value) in all the options. All the basic attributes related to Water reached the best value except the “m3 of water consumed—Quant-irr (Wat_m3)” variable that obtained a medium score.
Considering the Biodiversity component, the substitution scenario obtained the worse score, the more advanced agroecological option reached the best evaluation, and all the other scenarios showed a medium score. More detailed results on Biodiversity are reported in Figure 3. For the Genetic sub-component, Scenario F reached a higher value than the other scenarios thanks to the greater number of cultivars (medium score for “Number of cultivars—Nr_var (N_cult)”) and the use of local cultivars (high score for “Number of local cultivars—Nr_var-autoc (N_loc_cult)”). Considering the Specific biodiversity sub-component, scenarios with the ASCs (Scenarios C, E, and F) reached a high value for the “Percentage of legume area—%legum (%_leg)” attribute, while those with living mulch (Scenarios D, E, and F) obtained the best score for “Number of intercropping—Nr_consocia (N_cons)”. Lastly, a high score for the Habitat sub-component was only reached by the Scenario F mainly for the high value reported by the “Management of semi-natural areas—Gest_SNH (SNH_manag)” attribute.
Production component was classified as High in all the scenarios except in Scenario A which reported a low score. Scenario A was also the only option which showed different scores compared to the other scenarios considering the sub-components of the Production (Table 3). Energy was the only sub-component where all the analyzed scenarios showed the same behavior, achieving a good evaluation even if all the options reported a low value for “Re-use (input from stocks and green manure/total inputs)—I_reimpiego (Re-use)” attribute (Figure 3). Considering the Phytosanitary management, the best score for all the basic attributes was only reached by Scenario F. Scenarios from B to E reported two high scores and a low value only for “Reason for intervention—Motivo (Int_reas)” variable. The substitution scenario obtained a high, medium and low score for “Level of a systematic management approach—Appro_sist (System_manag)”, “Environmental impact of the interventions—Impat_amb (Envir_imp)” and “Reason for intervention—Motivo (Int_reas)”, respectively. For Fertilizer Management sub-component, scenarios with ASCs (Scenario C, E, and F) were characterized by a medium value for “Fertilizers coming from farm—Fert_azien (N_farm)” attribute while the others reported a low score. The Product Value sub-component was principally affected by the “Destination of products—Dest_prod” attribute that reached the best value in Scenario F, a medium score in Scenario from B to E, and a low value in Scenario A.
Considering the overall sustainability, scenarios from B to F were qualified as sustainable systems (high value), while Scenario A obtained a low score.

4. Discussion

4.1. Strengths and Weaknesses of DEXi-BIOrt

Assessment models are usually evaluated in terms of their usefulness considering the following aspects: availability of data required for the computation, easy to use, and comprehensibility of the final results [32,33]. DEXi-BIOrt proved to be a very flexible tool able to combine together easily measurable quantitative data (converting them in qualitative values by using thresholds), empirical knowledge, and qualitative information for the definition of an assessment system based on simple synthetic indicators. This approach allows one to make the best use of the information commonly present in a farm, thus reducing risk of non-availability of data. Furthermore, thanks to its qualitative hierarchical structure, DEXi-BIOrt is able to capture and integrate into the evaluation system also some aspects that are not usually taken into account in formal and quantitative models such as the point of view of the farmer, in particular, for the evaluation of the Production component (“Are you satisfied with the obtained productions in relation to your expectations?”).
DEXi-BIOrt is accompanied by a user manual and an excel file for the computation of the basic attributes to import into the DEXi-based structure. These accessory tools make the model easy to use even if they often lack transparency. In fact, the manual lacks a section dedicated to the description and the calculation of the synthetic indicators and many of the cells in the Excel file are blocked. This does not allow the reading of the relative formulas. Regarding the comprehensibility of the outputs, DEXi-BIOrt, like all the qualitative models, returns evaluation outputs (“low”, “medium”, “high”) that are easily understood by end users and other interested parties since qualitative values are considered natural representations of human judgments [34]. The visualization and the comparison of the obtained outputs are also facilitated by the creation of different graphs that further enable the comprehensibility of the results.
Although DEXi-BIOrt presents numerous strengths given by its flexibility and ease of use, analyzing in detail the general structure, the components and the single variables, the software presents some aspects that should be improved.
The distribution of the frequencies obtained with the Monte Carlo analysis was quite expected especially for the overall sustainability that showed a very high value for the “Low” modality. This behavior is due to the choice made by the model developers that explicitly decided to evaluate a farm characterized by at least one of the main components qualified as “Low” as an unsustainable system [18]. Since the use of only three qualitative classes at the root level does not allow to distinguish the extreme (very low and very high) scenarios, the integration of additional modalities could improve the model’s discriminatory power, increase the ability to distinguish systems, and reduce the very high frequency observed for the “Low” score.
The results of the SIs are affected by the level of complexity of each component (Soil, Water, Biodiversity, and Production) and by the number of variables of which each component is composed. Generally, a simpler component structure has a greater influence on the overall sustainability but a higher number of variables, that individually have no significant impact, becomes more sensitive if they are considered together [11]. In DEXi-BIOrt, Soil (5 basic and 2 aggregated variables) and Water (3 basic attributes) are the simpler components but the former has a greater influence due to its larger number of variables and its higher weight. Despite its complexity and its minor weight, Production (11 basic and 4 aggregated attributes) is the second component affecting the overall results thanks to the greatest numbers of variables. However, Soil shows an influence that is about twice as high as all the other components. This implies that more care must to be used for this component and in particular for its more sensitive variables.
All the scenarios in both areas reported a high value for “Tillage diversification over time—Div-lav (Till_div)”, the most sensitive soil basic attribute. Div-lav (Till_div) presents only two modalities: High (Diversification of tillage in relation to soil conditions, crops, and seasons) and Low (No diversification). These two modalities were not able to distinguish the different tillage system implemented in AE2016 in relation to the other Marche scenarios. In fact, the positive effects of the ILRC technology were taken into account by the model only in terms of energy saving. The introduction of a medium modality in the Div-lav (Till_div) attribute would enhance its discriminatory power and decrease its high sensitivity, thus also reducing the higher influence of the Soil component on the overall results.
The second, more sensitive soil attribute is the “Soil organic carbon balance—Bil_SO (SOC_bal)” that was qualified as low in all the scenarios of the two areas. The balance is performed in DEXi-BIOrt by using some conversion factors taken from literature as the humification coefficients of organic inputs [35,36] and the mineralization rates [37]. As these coefficients are empirical, they could be inaccurate and unsuitable for some systems, thus affecting the reliability of the output results [38]. Furthermore, the balance seems to be insensitive to soil texture changes. A possible and reliable alternative could be the use of a simplified indicator based on soil texture, organic input amount, and quality as proxy of the soil organic carbon balance.
Another soil sensitive attribute is the “Soil structure—St-ter (Soil_str)”. This variable was able to identify a better performance in AE2016 and SU2016 scenarios compared to CO2007 thanks to an increase of soil organic carbon and an improvement of soil physical structure obtained in the formers after about ten years from the organic conversion, as evidenced in MOVE-LTE (data not showed).
A variable related to the Soil component that should be improved is represented by “Soil cover during the year—Cop-suolo (Soil_cov)”. Thresholds defined for its three modalities (high: ≥50%, medium: 30% ≤ Cop-suolo (Soil_cov) < 50%, low: <30) should be reviewed. In particular, the value for the high level of sustainability could be increased to at least 80%. This value is also confirmed by a study on sustainability of stockless organic farming in Italy that reports a soil cover average value of 89.45% [39] and by other developed soil cover indexes [40].
The Water component is composed by a simple structure but with relevant and well-defined variables for assessing the sustainable management of water resources at farm level, principally related to the water amount and irrigation systems. There is no sustainability difference among the scenarios in the same region as an identical water management was applied. However, the Metaponto plan scenarios reached a better sustainability for the type of the irrigation system compared to the Adriatic coast scenarios thanks to 100% micro-irrigation implementation.
The Biodiversity component is well structured and able to cover all biodiversity levels. The more weighting attribute “Crop rotation—Avv_col (Rot)” is very simple but effective. An improvement could be made to the “Number of intercropping—Nr-consocia (N_cons)” attribute replacing the intercropping number with the percentage of the area covered by intercropping. The obtained results in both study areas highlight that it is necessary to enhance diversification promoting long suitable rotations, cultivation of locally adapted cultivars, introduction of intercropping, agro-ecological service crops, and ecological infrastructures to increase the sustainability of organic vegetable systems. As biodiversity often works as a buffer against environmental and economic risks [41], minimizing biodiversity loss in order to increase resilience and sustainability of a production system has currently been identified as one of the major challenges for agriculture [42].
Regarding the Production component, the “Destination of products—Dest_prod” is the attribute that principally affects the overall sustainability results. A higher score of this variable is obtained in scenarios where farms sell their products through short chain mechanisms. In fact, even if selling the productions to large scale distribution or big retailers is considered the easiest solution, because of a transactional cost reduction and lower economic risks, alternative short chains and local markets could guarantee a premium price and create new farm job opportunities and incomes [40], thus increasing the social-economic sustainability of a production system.
Another sensitive attribute is the “Environmental impact of the interventions—Impat_amb (Envir_imp)” for the Phytosanitary Management of the Production component. This variable is based on a ratio between the positive and negative treatment impacts. Although the computation of the impact assessment related to the use of curative and preventive treatments is not easy to understand, the results show a clear distinction between the substitution (lower sustainability) and the other scenarios (higher sustainability) in both areas. The lower score for this attribute in SU2016 and Scenario A is principally caused by the non-use of intercropping and ASCs. In fact, Impat_amb (Envir_imp) is sensitive only to the implementation or not of specified managements and treatments but not to the applied plant protection doses which only affect the variable computation of the Energy subcomponent. This relevant aspect, considered in many developed environmental risk indicators for pesticides [43,44], should be integrated in the model.
Regarding the Energy sector of the Production component, the variables included in DEXi-BIOrt are all relevant although additional attributes related to the energy productivity (production output per energy input) could be added to give a weight also to the market outputs. Considering the obtained results, the substitution scenario showed a worse energy performance compared to the other options only in Adriatic coast area. This was mainly due to the non-use of ASCs as green manure and off-farm seedling purchase. In the Metaponto plan, even if ASCs were implemented in most of the scenarios, these were not able to increase sustainability in particular for the “Re-use (input from stocks and green manure/total inputs)—I_reimpiego (Re-use)” attribute because of the low amounts obtained for their aboveground biomass.
Lastly, the “Supplied N/Nitrogen Uptake—Ndisp/Nasp (Ninp/Nout)” variable for the Fertilizer management sub-component of the Production seems to give back too low values which determine low sustainability in all the evaluated scenarios. This consideration mainly originates from the fact that the N fertilizer inputs were defined in many of the scenarios according to the nitrogen balance with N crop removal.
Furthermore, this attribute consists only of two modalities: High for 1.2 ≤ Ndisp/Nasp (Ninp/Nout) ≤ 1, Low for Ndisp/Nasp (Ninp/Nout) < 1 and Ndisp/Nasp(Ninp/Nout) > 1.2. On one hand, if variable values greater than 1 indicate potential nitrate leaching risk and values lower than 1 could affect the long-term nitrogen soil fertility, on the other, values precisely equal to 1 are difficult to achieve. An intermediate modality with a medium sustainability level that slightly affects the reduction of long-term soil fertility and consequently the production system could be added to this attribute.

4.2. Sustainability Performances of the Assessed Scenarios

Considering the overall sustainability given by the final aggregation of all the attributes, even if the model has a low discriminatory power at the root level as mentioned above, the substitution scenarios (SU2016, Scenario A), characterized by less diversification and no adoption of agro-ecological and holistic approaches, were qualified as not sustainable in both case studies. Conversely, the adoption of more diversified systems, including ASCs (Scenario C, D, E) and local cultivars (CO2007, AE2016, Scenario F) or based on strip cropping systems (Scenario B) and the promotion of short supply chain mechanisms are essential to attain a high level of overall sustainability. Our results confirm the hypothesis that MCA tools represent a valid support for evaluating organic farm sustainability and to identify proper strategies to be implemented to reduce environmental impacts and to respond to societal expectations regarding environmental standards. However, further improvements need to be made to the model since the use of only three qualitative classes in most of the attributes and at the root level did not allow in both areas to discriminate the performances of the “extreme” scenarios (AE2016, Scenario F), which are characterized by a whole implementation of the agroecological approaches. Despite these limitations, the results obtained with DEXi-BIOrt have proven that despite organic agriculture being generally considered per se environmentally sustainable as it is related to an increase of soil organic carbon, biodiversity, and ecosystem services [45,46], its potential benefits cannot be fully achieved under all the different production systems. Consequently, not all the organic vegetable production systems should be considered equal and environmentally sustainable but only those characterized by agroecosystem diversity and complexity must be promoted and supported. These results are in line with evidence coming from several studies [41,47,48,49] that demonstrated that diversification in agroecosystems, rather than maximizing short-term yields of a specific crop, contributes to build resilience, thus enabling a system to remain productive over time and to cope successfully with threats.
The effectiveness of diversified strategies in agroecosystems and, in particular, the introduction of agro-ecological service crops in contributing to increase biodiversity, to enhance soil nitrogen fertility, to reduce N leaching, to improve soil water retention, and to better manage weed and diseases, is well known. Nevertheless, their diffusion in the organic vegetable systems is still limited due to some crucial management factors such as the selection of the suitable ASC genotypes and the proper time and method of termination to adopt [29]. Moreover, according to other studies [50,51], our results have confirmed that the introduction of intercropping and ASCs within organic vegetable productions can help to maintain the sustainability of farming systems not only providing ecological services but also reducing energy consumption coming from fertilizer inputs (i.e., AE2016).
A closer cooperation and reinforced interactions among researchers, advisers, and farmers are necessary to remove the obstacles existing at farm level to the introduction of diversity and complexity in organic vegetable systems in order to enhance farm sustainability. These constraints are mainly related to the lack of technical and agronomic knowledge and the difficulty for farmers to manage spatial and temporal strategies and approaches. Institutions and policy makers should encourage the socio-technical system to change and evolve in order to successfully integrate agriculture diversification and agro-environmentally sustainable production. The measures and strategies to implement in the framework of the post-2020 Common Agricultural Policy (CAP) are an opportunity for the European Union to address these challenges.

5. Conclusions

DEXi-BIOrt has proved to be a valid and helpful tool to better understand how different managements and farm designs affect the agro-environmental sustainability of organic vegetable systems, since the model consider and combine the impacts of a set of relevant variables of the agro-environmental dimension. Nevertheless, the discriminatory power of this tool needs to be improved and additional pillars (i.e., economic dimension) should to be integrated to address a broad and comprehensive sustainability assessment of the system.
The results obtained using DEXi-BIOrt pointed out that not all the organic vegetable systems are agro-environmentally sustainable. In both the analyzed Italian case studies, the most sustainable scenarios were the well diversified organic systems. The implementation of the simplified organic substitution scenarios instead does not guarantee a proper level of agro-ecosystem sustainability for vegetable production.
Our achievements could support policy makers in their own decisions and in the preparation of appropriate measures and incentive strategies for the promotion of diversification in the organic sector. However, further studies are required to support the transition towards organic diversified, agroecologically sound sustainable systems and to better understand the economic implications that farmers have to cope with during the transitional period.

Author Contributions

Conceptualization, G.C., F.M. and S.C.; Data curation, M.D., F.L. and A.P.; Formal analysis, I.I., M.D., F.L., A.P. and S.C.; Methodology, I.I., G.C., F.M. and S.C.; Writing—original draft, I.I. and S.C.; Writing—review & editing, I.I., G.C., F.M. and S.C.

Funding

This study was supported by the Italian Rural Network Program (Rete Rurale Nazionale – RRN), in the frame of the ‘Actions for Organic Farming’ (Project 5.2).

Conflicts of Interest

The authors declare no conflict of interest.

References

  1. Spiertz, J.H.J.; Ewert, F. Crop production and resource use to meet the growing demand for food, feed and fuel: Opportunities and constraints. NJAS Wagen. J. Life Sci. 2009, 56, 281–300. [Google Scholar] [CrossRef]
  2. Craheix, D.; Bergez, J.E.; Angevin, F.; Bockstaller, C.; Craheix, D.; Bohanec, M.; Colomb, B.; Doré, T.; Fortino, G.; Guichard, L.; et al. Guidelines to design models assessing agricultural sustainability, based upon feedbacks from the DEXi decision support system. Agron. Sustain. Dev. 2015, 35, 1431–1447. [Google Scholar] [CrossRef] [Green Version]
  3. Ikerd, J.E. The need for a systems approach to sustainable agriculture. Agric. Ecosyst. Environ. 1993, 46, 147–160. [Google Scholar] [CrossRef]
  4. Cinelli, M.; Coles, S.R.; Kirwan, K. Analysis of the potentials of multi criteria decision analysis methods to conduct sustainability assessment. Ecol. Indic. 2014, 46, 138–148. [Google Scholar] [CrossRef]
  5. Sala, S.; Farioli, F.; Zamagni, A. Life cycle sustainability assessment in the context of sustainability science progress (part 2). Int. J. Life Cycle Assess. 2013, 18, 1686–1697. [Google Scholar] [CrossRef]
  6. Singh, R.K.; Murty, H.R.; Gupta, S.K.; Dikshit, A.K. An overview of sustainability assessment methodologies. Ecol. Indic. 2009, 9, 189–212. [Google Scholar] [CrossRef]
  7. Schader, C.; Grenz, J.; Meier, M.S.; Stolze, M. Scope and precision of sustainability assessment approaches to food systems. Ecol. Soc. 2014, 19, 42. [Google Scholar] [CrossRef]
  8. Bockstaller, C.; Feschet, P.; Angevin, F. Issues in evaluating sustainability of farming systems with indicators. Ol. Corp. Gras Lipides 2015, 22, 12. [Google Scholar] [CrossRef]
  9. Bouyssou, D.; Marchant, T.; Pirlot, M.; Tsoukiàs, A.; Vincke, P. Evaluation and Decision Models with Multiple Criteria: Stepping Stones for the Analyst, 1st ed.; International Series in Operations Research & Management Science; Springer: Berlin, Germany, 2006; Volume 86. [Google Scholar]
  10. Zopounidis, C.; Pardalos, P.M. Handbook of Multicriteria Analysis; Springer: Berlin, Germany, 2010. [Google Scholar]
  11. Carpani, M.; Bergez, J.E.; Monod, H. Sensitivity analysis of a hierarchical qualitative model for sustainability assessment of cropping systems. Environ. Model. Softw. 2012, 27, 15–22. [Google Scholar] [CrossRef]
  12. Sadok, W.; Angevin, F.; Bergez, J.É.; Bockstaller, C.; Colomb, B.; Guichard, L.; Reau, R.; Dorè, T. Ex ante assessment of the sustainability of alternative cropping systems: Implications for using multi-criteria decision-aid methods. A review. Agron. Sustain. Dev. 2008, 28, 163. [Google Scholar] [CrossRef]
  13. Bohanec, M. DEXi: Program for Multi-Criteria Decision Making, User’s Manual, Version 4.0; IJS Report DP-113401134011340; Jožef Stefan Institute: Ljubljana, Slovenia, 2013. [Google Scholar]
  14. Craheix, D.; Angevin, F.; Bergez, J.E.; Bockstaller, C.; Colomb, B.; Guichard, L.; Reau, R.; Doré, T. MASC 2.0, un outil d’évaluation multicritère pour estimer la contribution des systèmes de culture au développement durable. Innovat. Agron. 2012, 20, 35–48. [Google Scholar]
  15. Pelzer, E.; Fortino, G.; Bockstaller, C.; Angevin, F.; Lamine, C.; Moonen, C.; Vasileiadis, V.; Guérin, D.; Guichard, L.; Reau, R.; et al. Assessing innovative cropping systems with DEXiPM, a qualitative multi-criteria assessment tool derived from DEXi. Ecol. Indic. 2012, 18, 171–182. [Google Scholar] [CrossRef]
  16. Sadok, W.; Angevin, F.; Bergez, J.É.; Bockstaller, C.; Colomb, B.; Guichard, L.; Reau, R.; Messéan, A.; Doré, T. MASC, a qualitative multiattribute decision model for ex ante assessment of the sustainability of cropping systems. Agron. Sustain. Dev. 2009, 29, 447–461. [Google Scholar] [CrossRef]
  17. Salles, P. Conception d’un Outil D’évaluation Multicritère de la Durabilité des Successions en Systèmes Légumiers de Plein Champ: DEXI-Légumes. Ph.D. Thesis, Agrocampus Ouest, Rennes, France, 2007. [Google Scholar]
  18. Vazzana, C.; Moonen, A.C.; Bigongiali, F.; Bàrberi, P.; Lazzerini, G.; Moschini, V.; Colombo, L. Manuale di DEXI-BIOrt uno Strumento per la Valutazione Agro-Ambientale delle Aziende Orticole Biologiche Italiane; Progetto SOS-BIO, Finanziato dal Ministero delle Politiche Agricole, Alimentari e Forestali: Rome, Italy, 2012. (In Italian) [Google Scholar]
  19. Alaphilippe, A.; Angevin, F.; Guérin, A.; Guillermin, P.; Velu, A.; Zavagli, F. DEXIFruits, un outil d’évaluation multicritère des systèmes de production de fruits: D’un modèle de recherche à un outil terrain co-construit. Innovat. Agrono. 2017, 59, 205–212. [Google Scholar]
  20. Mouron, P.; Heijne, B.; Naef, A.; Strassemeyer, J.; Hayer, F.; Avilla, J.; Alaphilippe, A.; Höhn, H.; Hernandez, J.; Mack, G.; et al. Sustainability assessment of crop protection systems: SustainOS methodology and its application for apple orchards. Agric. Syst. 2012, 113, 1–15. [Google Scholar] [CrossRef]
  21. R Core Team. R: A Language and Environment for Statistical Computing; R Foundation for Statistical Computing: Vienna, Austria, 2013; Available online: http://www.R-project.org/ (accessed on 1 December 2017).
  22. Baldock, J.O.; Hedtcke, J.L.; Posner, J.L.; Hall, J.A. Organic and Conventional Production Systems in the Wisconsin Integrated Cropping Systems Trial: III. Yield Trends. Agron. J. 2014, 106, 1509–1522. [Google Scholar] [CrossRef]
  23. Delate, K.; Cambardella, C.; Chase, C.; Turnbull, R. A review of long-term organic comparison trials in the US. In Sustainable Development of Organic Agriculture: Historical Perspectives, 1st ed.; Etingoff, K., Ed.; Apple Academic Press: New York, NY, USA, 2017; p. 79. [Google Scholar]
  24. Peronti, M.; Bàrberi, P.; Campanelli, G.; Ceccarelli, D.; Ceglie, F.G.; Ferlito, F.S.; Mazzoncini, M.; Montemurro, F.; Roccuzzo, G.; Tittarelli, F.; et al. The Italian organic long term field experiments network. In Proceedings of the IFOAM Agribiomediterraneo International Conference Agroecology for Organic Agriculture in the Mediterranean, Vignola Castle (Modena) and SANA, Bologna, Italy, 10–13 September 2015. [Google Scholar]
  25. Raupp, J.; Pekrun, C.; Oltmanns, M.; Köpke, U. Long-Term Field Experiments in Organic Farming; ISOFAR Scientific Series No 1; Verlag Dr. Köster: Berlin, Germany, 2006. [Google Scholar]
  26. Campanelli, G.; Canali, S. Crop production and environmental effects in conventional and organic vegetable farming systems: The case of a long-term experiment in mediterranean conditions (Central Italy). J. Sustain. Agric. 2012, 36, 599–619. [Google Scholar] [CrossRef]
  27. UNESCO-FAO. Ecological Study of the Mediterranean Zone. Bioclimatic Map of the Mediterranean Zone Explanatory Notes; NS.162/III. 22/A; UNESCO-FAO: Paris, France, 1963. [Google Scholar]
  28. Soil Survey Staff. Soil Taxonomy: A Basic System of Soil Classification for Making and Interpreting Soil Surveys, 2nd ed.; Natural Resources Conservation Service, U.S. Department of Agriculture Handbook: Washington, DC, USA, 1999; p. 436.
  29. Canali, S.; Diacono, M.; Campanelli, G.; Montemurro, F. Organic no-till with roller crimpers: Agro-ecosystem services and applications in organic Mediterranean vegetable productions. Sustain. Agric. Res. 2015, 4, 70. [Google Scholar] [CrossRef]
  30. Canali, S.; Campanelli, G.; Ciaccia, C.; Leteo, F.; Testani, E.; Montemurro, F. Conservation tillage strategy based on the roller crimper technology for weed control in Mediterranean vegetable organic cropping systems. Eur. J. Agron. 2013, 50, 11–18. [Google Scholar] [CrossRef]
  31. Diacono, M.; Fiore, A.; Farina, R.; Canali, S.; Di Bene, C.; Testani, E.; Montemurro, F. Combined agro-ecological strategies for adaptation of organic horticultural systems to climate change in Mediterranean environment. Ital. J. Agron. 2016, 11, 85–91. [Google Scholar] [CrossRef]
  32. Bockstaller, C.; Girardin, P. How to validate environmental indicators. Agric. Syst. 2003, 76, 639–653. [Google Scholar] [CrossRef]
  33. Craheix, D.; Angevin, F.; Doré, T.; de Tourdonnet, S. Using a multicriteria assessment model to evaluate the sustainability of conservation agriculture at the cropping system level in France. Eur. J. Agron. 2016, 76, 75–86. [Google Scholar] [CrossRef]
  34. Munda, G. Multiple criteria decision analysis and sustainable development. In Multiple Criteria Decision Analysis: State of the Art Surveys; Greco, S., Ed.; Springer: New York, NY, USA, 2005; pp. 953–986. [Google Scholar]
  35. Costantini, E. Sostanza organica: Conti e bilanci. Agricoltura Biologica Suppl. Notiziario Ersa Friuli Venezia Giulia 1995, 5, 3–27. (In Italian) [Google Scholar]
  36. Costantini, E. Facciamo i conti con l’humus. Bioagricultura 2004, 4, 32–35. (In Italian) [Google Scholar]
  37. Migliorini, P. Il Programma FARM. In Un Modello di Calcolo per la Gestione Sostenibile delle Aziende Agricole e sua Applicazione su un Azienda Zootecnica di Produzione di Latte da Agricoltura Biologica; Università degli Studi di Firenze: Firenze, Italy, 2005. (In Italian) [Google Scholar]
  38. Brock, C.; Franko, U.; Oberholzer, H.R.; Kuka, K.; Leithold, G.; Kolbe, J. Humus balancing in Central Europe-concepts, state of the art, and further challenges. J. Plant Nutr. Soil Sci. 2013, 176, 3–11. [Google Scholar] [CrossRef]
  39. Migliorini, P.; Galioto, F.; Chiorri, M.; Vazzana, M. An integrated sustainability score based on agro-ecological and socioeconomic indicators. A case study of stockless organic farming in Italy. Agroecol. Sustain. Food 2018, 42, 1–26. [Google Scholar] [CrossRef]
  40. Migliorini, P.; Scaltriti, B. Evaluation of sustainability of the farms in the Agricultural Park of South Milan and their production chain. New Medit 2012, 11, 53–56. [Google Scholar]
  41. Mijatović, D.; Van Oudenhoven, F.; Eyzaguirre, P.; Hodgkin, T. The role of agricultural biodiversity in strengthening resilience to climate change: Towards an analytical framework. J. Agric. Sustain. 2013, 11, 95–107. [Google Scholar] [CrossRef]
  42. Pretty, J.; Sutherland, W.J.; Ashby, J.; Auburn, J.; Baulcombe, D.; Bell, M.; Bentley, J.; Bickersteth, S.; Brown, K.; Burke, J.; et al. The top 100 questions of importance to the future of global agriculture. Int. J. Agric. Sustain. 2011, 8, 219–236. [Google Scholar] [CrossRef]
  43. Gravesen, L. The treatment frequency index—An indicator for pesticide use and dependency as well as overall load on the environment. In Reducing Pesticide Dependency in Europe to Protect Health, Environment and Biodiversity, Pesticides Action Network Europe (PAN); Pure Conference: Copenhagen, Denmark, 2003. [Google Scholar]
  44. Reus, J.; Leendertse, P.; Bockstaller, C.; Fomsgaard, I.; Gutsche, V.; Lewis, K.; Nilsson, C.; Pussemier, L.; Trevisan, M.; van der Werf, H.; et al. Comparing Environmental Risk Indicators for Pesticides—Results of the European CAPER Project; European CAPER, Centre For Agriculture and Environment: Utrecht, The Netherlands, 1999. [Google Scholar]
  45. Mäder, P.; Fließbach, A.; Dubois, D.; Gunst, L.; Fried, P.; Niggli, U. Soil fertility and biodiversity in organic farming. Science 2002, 296, 1694–1697. [Google Scholar] [CrossRef] [PubMed]
  46. Norton, L.; Johnson, P.; Joys, A.; Stuart, R.; Chamberlain, D.; Feber, R.; Firbank, L.; Manley, W.; Wolfe, M.; Hart, B.; et al. Consequences of organic and non-organic farming practices for field, farm and landscape complexity. Agric. Ecosyst. Environ. 2009, 129, 221–227. [Google Scholar] [CrossRef] [Green Version]
  47. IPES-Food. From Uniformity to Diversity: A Paradigm Shift from Industrial Agriculture to Diversified Agroecological Systems; International Panel of Experts on Sustainable Food Systems Report; IPES-Food: Brussels, Belgium, 2016. [Google Scholar]
  48. Médiène, S.; Valantin-Morison, M.; Sarthou, J.P.; Tourdonnet, S.; Gosme, M.; Bertrand, M.; Roger-Estrade, J.; Aubertot, J.N.; Rusch, A.; Motisi, N.; et al. Agroecosystem management and biotic interactions: A review. Agron. Sustain. Dev. 2011, 31, 491–514. [Google Scholar] [CrossRef]
  49. Scherr, S.J.; McNeely, J.A. Biodiversity conservation and agricultural sustainability: Towards a new paradigm of “ecoagriculture” landscapes. Philos. Trans. R. Soc. Lond. B Biol. Sci. 2008, 363, 477–494. [Google Scholar] [CrossRef] [PubMed]
  50. Diacono, M.; Persiani, A.; Fiore, A.; Montemurro, F.; Canali, S. Agro-ecology for potential adaptation of horticultural systems to climate change: Agronomic and energetic performance evaluation. Agronomy 2017, 7, 35. [Google Scholar] [CrossRef]
  51. Jadidi, M.R.; Sabuni, M.S.; Homayounifar, M.; Mohammadi, A. Assessment of energy use pattern for tomato production in Iran: A case study from the Marand region. Res. Agric. Eng. 2012, 58, 50–56. [Google Scholar] [CrossRef] [Green Version]
Figure 1. DEXi-BIOrt decision tree model and weighting pattern (% in brackets) for the calculation of aggregated variables. The root (Overall sustainability), the main components (Soil, Water, Biodiversity, Production), and the sub-components (Physical, Chemical and Biological soil quality, Irrigation Management, Genetic and Specific Biodiversity, Habitat, Energy, Phytosanitary Management, Fertilizer Management, Product Value) are shown in bold, the basic attributes in clear. On the right side a short description for all model variables and the related English acronyms are reported.
Sustainability 10 03820 g001
Figure 2. Sensitivity index obtained with IZIEval tool for each basic variable of DEXi-BIOrt referred to the overall sustainability (root variable). The vertical line, automatically printed out by the IZIEval, distinguishes the more sensitive variables (right side of the line) from the others. English acronyms of the variables are reported in brackets.
Sustainability 10 03820 g002
Figure 3. Radar charts of the sustainability assessment obtained with DEXi-BIOrt for the basic attributes of the Biodiversity component. Only the English acronyms are shown to better facilitate the reading of the charts. The axes of radar charts have the following common scale: High—point at the center of the graph; Medium—point at the middle of the axis; High—point at the end of the axis; (a) Adriatic coast scenarios; (b) Metaponto plan scenarios.
Sustainability 10 03820 g003
Figure 4. Radar charts of the sustainability assessment obtained with DEXi-BIOrt for the basic attributes of the Production component. Only the English acronyms are shown to better facilitate the reading of the charts. The axes of radar charts have the following common scale: High—point at the center of the graph; Medium—point at the middle of the axis; High—point at the end of the axis; (a) Adriatic coast scenarios; (b) Metaponto plan scenarios.
Sustainability 10 03820 g004
Table 1. Summary of the main agricultural system management strategies implemented in the ex-ante scenarios in Adriatic coast (CO2007, AE2016, SU2016) and Metaponto plan (Scenario A, Scenario B, Scenario C, Scenario D, Scenario E, Scenario F) areas.
Adriatic CoastMetaponto Plan
CO2007AE2016SU2016Scenario AScenario BScenario CScenario DScenario EScenario F
Cash cropsTomato, melon, fennel, lettuce, cauliflower, beanTomato, melon, fennel, lettuce, cauliflower, beanTomato, melon, fennel, lettuce, cauliflower, beanCauliflower, fennel, tomato, zucchiniCauliflower, fennel, tomato, zucchiniCauliflower, fennel, tomato, zucchiniCauliflower, fennel, tomato, zucchiniCauliflower, fennel, tomato, zucchiniCauliflower, fennel, tomato, zucchini
ASC as break cropsHairy vetch, barley, radishHairy vetch, barley, radishNoNoNoRice, field pea, rapeseedNoRice, field pea, rapeseedRice, field pea, rapeseed
ASC as living mulchNoNoNoNoNoNoBurr medicBurr medicBurr medic
Strip croppingNoNoNoNoOn ridge-furrow systemOn ridge-furrow systemOn ridge-furrow systemOn ridge-furrow systemOn ridge-furrow system
Crop genetic diversificationN. crops996447588
N. cultivars141484475812
N. local cultivars660000004
Tillage systemMTILRCMTMTMTMTMTMTMT
Percentage of on-farm seedling production100%100%0%0%0%0%0%0%0%
Amount of off-farm N inputs (kg ha−1)200100200350286286286286286
Rate of plant protection products (kg ha−1, active ingredient)Pyrethrum0.180.0160.0320.0420.0420.0420.0420.0420.042
Cu3.50.751.51.141.141.141.141.141.14
S1.50.751.5333333
Total used water (m3 ha−1 per year)10,00010,00010,000655065506550655065506550
Percentage of area irrigated by micro-irrigation system to total irrigated area60%60%60%100%100%100%100%100%100%
Destination of the productsShort chain/local market100%100%0%0%50%50%50%50%100%
Large scale distribution/export0%0%100%100%50%50%50%50%0%
ASC = Agroecological Service Crop; MT = Minimum Tillage; ILRC = In Line Tillage Roller Crimper; N = nitrogen; Cu = copper; S = Sulfur.
Table 2. Relative frequency distributions of the results of 5000 Monte Carlo simulations among the three modalities (Low, Medium, High) obtained with DEXi-BIOrt for the Overall sustainability and the four main components (Soil, Water, Biodiversity, Production).
LowMediumHigh
Overall Sustainability0.6750.1980.127
Soil0.4000.3180.282
Water0.1950.5530.252
Biodiversity0.1340.7390.127
Production0.2400.5400.220
Table 3. Main component (in bold) and sub-component (in clear) sustainability assessment obtained with DEXi-BIOrt for Adriatic coast (CO2007, AE2016, SU2016) and Metaponto plan scenarios (Scenario A, Scenario B, Scenario C, Scenario D, Scenario E, Scenario F).
Adriatic CoastMetaponto Plan
CO2007AE2016SU2016Scenario AScenario BScenario CScenario DScenario EScenario F
SoilMHHMMMMMM
 Physical qualityMHHMMMMMM
 Chemical-biological qualityMMMMMMMMM
WaterHHHHHHHHH
BiodiversityHHMLMMMMH
 GeneticHHLLLLLLH
 SpecificHHMLMMMHH
 HabitatHHHMMMMMH
ProductionHHLLHHHHH
 EnergyHHMHHHHHH
 Phytosanitary managementHHLMHHHHH
 Fertilizer managementLLLLLLLLL
 Product valueMMLLMMMMM
L = Low; M = Medium; H = High.

