Article

Factors Associated with the Regularity of Physical Exercises as a Means of Improving the Public Health System in Vietnam

1
Centre for Interdisciplinary Social Research, Thanh Tay University, Yen Nghia, Ha Dong, Hanoi 100803, Vietnam
2
Academic Affairs, Gateway International School, Hanoi 100000, Vietnam
3
Sciences Po, 75337 Paris, France
4
Vuong & Associates Co., Hanoi 100000, Vietnam
5
Ritsumeikan Asia Pacific University, Beppu, Oita 874-8577, Japan
*
Author to whom correspondence should be addressed.
Sustainability 2018, 10(11), 3828; https://0-doi-org.brum.beds.ac.uk/10.3390/su10113828
Submission received: 3 October 2018 / Revised: 16 October 2018 / Accepted: 22 October 2018 / Published: 23 October 2018
(This article belongs to the Special Issue Social Public Health System and Sustainability)

Abstract

:
Being ranked among the most sedentary countries, Vietnam’s social public health is challenged by the rising number of overweight people. This study aims to evaluate factors associated with the regularity of exercise and sports (EAS) among Vietnamese people living in the capital city of Hanoi, using data collected from a randomized survey involving 2068 individuals conducted in 2016. Physical exercises and daily sports are considered a major means for improving the Vietnamese social public health system by the government, families, and individuals. Applying the baseline-category logit model, the study analyzed two groups of factors associated with EAS regularity: (i) physiological factors (sex, body mass index (BMI)) and (ii) external factors (education, health communication, medical practice at home). Females with a university education or higher usually exercise less than those with lower education, while the opposite is true for males. The study also shows that those with a higher BMI tend to report higher activity levels. Additionally, improved health communication systems and regular health check-ups at home are also associated with more frequent EAS activities. These results, albeit limited to only one location in Vietnam, provide a basis for making targeted policies that promote a more active lifestyle. This, in turn, could help the country realize the goal of improving the average height of the population and reducing the incidents of non-communicable diseases.

1. Background

Physical exercises and daily sports are considered a major means for improving the social public health system all over the world, including that in a developing country such as Vietnam. According to the first national estimates of physical activity for Vietnam, which used data (14,706 subjects) from a national population-based survey of risk factors for non-communicable diseases in SVietnam between 2009 and 2010, around 70% of adults aged 18–64 years meet the World Health Organization (WHO) recommendations for physical activity, but mainly from work activities [1]. The study also found the highest proportion of participation in leisure activity among Hanoi residents, who at the same time, spend the most time sitting [1]. In 2017, a team at Stanford University published a global study that analyzed daily step recordings on smartphones from over 717,000 anonymous users from 111 countries. The results showed that Vietnamese people are among the most sedentary worldwide, with their daily steps averaging 3643—significantly below the global mean of 4961 steps [2,3]. Meanwhile, the amount of overweight individuals (body mass index (BMI) ≥ 25) has grown in Vietnam, especially in urban areas, over the past decade as the overall income levels rise [4,5,6].
Against this fact, Vietnamese society, as Craig pointed out in “Familiar Medicine”, one of the first medical ethnographies to be written on contemporary Vietnam, has been very concerned with healthcare. The tropical climate in Vietnam, which brings about six months of hot and humid weather and another three of drizzle, and cold and dry spells, has contributed to the development of “a rich popular discourse and practice of everyday health and medicine” [7]. The local medical practice is strongly influenced by traditional Chinese medicine, but is also rooted in local ingredients, self-management, household care, and the inheritance of oral traditions and home-remedy recipes [7].
Given this background and previous studies that have described the lack of physical exercise among Vietnamese people, this study seeks, for the first time, to examine factors associated with the self-reported regularity of a specific form of physical activity, that is, exercise and sports (EAS), among people living in Hanoi, using a 2016 cross-section dataset. EAS is defined as leisure time physical activities ranging from moderate to vigorous intensity such as aerobics, walking, running, cycling, dancing, martial arts, and football, among others. The study chooses leisure time activities instead of work-related activities because most studies on the correlations of physical activity are focused on high-income countries or look only at activities associated with transport and occupation in developing countries [8]. With a population of 92 million and a low per capita gross domestic product (GDP) of approximately $2000, Vietnam is a developing country at the middle-income level. Thus, the study hopes to fill the gap in the literature.
Factors associated with the frequency and magnitude of an individual’s physical training are often complex and diverse. Several studies have looked at the association between physical activity and a host of socio-demographic and lifestyle factors such as aging; sedentary behavior; nutrition; or the use of drugs such as cigarettes, alcohol, and others [8,9,10,11]; environmental components such as noises or availability of facilities are shown to affect physical activities [12,13,14]. This study takes another approach by applying a baseline category logit model to assess two groups of factors specifically associated with the self-reported regularity of physical exercise in Hanoi, namely (i) physiological factors (sex, body mass index or BMI) and (ii) external factors (education, health communication, medical practice at home). Understanding why the Vietnamese, particularly those in its urban center, are more prone to EAS participation could inform public health workers in places with a similar background.

2. Literature Review

The benefits of EAS have been examined by a large range of studies. Not only do EAS help maintain the body’s fitness as well as physical health, but they also improve mood, self-esteem, and social skills [15,16]. The activities are proven to have preventive effects among healthy individuals and treatment effects among patients of various illnesses [17,18,19]. EAS are beneficial to those with hypertension; they reduce the risk of obesity, heart disease, diabetes, and colon cancer; they lower premature mortality rates; and they enhance osteoarthritis function in older people [18,20,21,22]. Moreover, regular engagement in EAS is also related to improved respiratory function, is helpful in cases of chronic kidney disease or osteoporotic fractures, and leads to a possible reduction in inflammatory biomarkers [19,23].
This section provides an overview of the scholarship on the two groups of factors, namely physiological (sex, BMI) and external (education, health communication, and home medicine), and their association with regularity in physical exercise.
Sex differences in EAS participation happen as a result of the changing body size and composition between male and female from late childhood, through puberty, and into adolescence [16]. Particularly, as the endocrine changes with development, girls would accumulate more fat than boys, while boys would see their fat-free mass climb at a much higher rate than girls [16]. Studies have confirmed that not only do boys and girls not vary much regarding body size and composition until puberty, but with training, both sexes experience similar changes in body composition, “as determined by total energy expenditure during training” [16]. Yet, it is clear that while both sexes enjoy taking part in calisthenics, cycling, swimming, and bowling, males tend to prefer weightlifting, golf, volleyball, soccer, and handball, and females are more attracted to walking, aerobics, and dancing [16,24,25]. The choices are attributable to other factors, such as parental behaviors, muscle structure, lung size, respiratory mechanisms, and fat rates specific to the body of each gender [23,24]. Indeed, even when researchers found no comparable differences in sedentary behaviors between male and female adults, there remained differences in terms of changes in the physical activity behavior over time. For instance, a study on the elderly Swedish population noted that men decreased their total physical activity, but women increased their time in moderate- or higher-intensity physical activity [26]. For the purpose of quantitative analysis, the sex differences in EAS are often examined through the BMI figure, which is linked to the fat rate and thus indicates the body’s level of obesity [25]. BMI is calculated using the formula BMI = weight / ( height × height ) .
BMI, apart from varying by sex and ethnicity, also changes according to physical training and educational background [27,28,29]. Studies on the association between BMI and educational attainment, though they appear to be outdated, did point out the general influence of educational level on the BMI of males; for females, the only lower educational level is shown to be related to higher BMI [30]. The higher educated women seem to exercise more regularly, so they have stronger muscles compared with the less educated [30,31,32].
Health communication is another factor that could influence EAS regularity, because not only does health information changes people’s behaviors, it also changes in line with sex and educational background [33]. In practice, it is difficult to separate the influence of sex and gender on human behaviors in healthcare. For instance, sex can modify testosterone, to the case of aggressive behavior being associated with risk-seeking and neglecting personal health, while gender-behavior such as lifestyle choices, exposure to stress, and environmental toxins, can have a certain impact on biological factors [34]. Concerning gender, studies over the years have often shown men to be unwilling and uninterested in seeking out health-related information both in times of stressful life events and generally in everyday life [35,36,37,38]. A Finnish study in 2013 on how gender affects health information behavior in people aged 18–65 years found that, compared with men, women paid more attention to health-related information and potential worldwide pandemics, as well as to how the purchase of daily goods affects their health [38]. The study noted that Finnish women also reported receiving far more informal health-related information from close family members, other kin, and friends/workmates than men did. Other studies did confirm that family members and friends are factors positively associated with people’s healthcare [39,40].
As for the association between medical practice at home and EAS regularity, there has been no study explicitly linking the two. By medical practice at home, this study means simple health checkup such as measuring eyesight, weight, height, blood pressure, and using the common first aid kit.
Based on the above findings, we evaluate the reality of engagement in EAS in the Vietnamese population. The levels of EAS regularity are analyzed in relation to sex, educational background, BMI, health communication quality, and regular health check-ups at home.

3. Materials and Methods

3.1. Materials

The data of this study was collected as part of an interview-based survey of behavior and attitudes toward general health examinations (GHEs) in Hanoi and Hung Yen, Vietnam. The area has about 10 million people and is about 4300 km2; the data were collected from the more urban places in this area. The data resulting from this study were deposited in the Open Science Framework [41] and Harvard Dataverse [42], according to the principle of open data and FAIRsharing [43,44]. The details of how the survey was carried out and how the variables are coded can be viewed in the work of [45].
The survey was executed adhering to ethical standards under the license of V&A/07/2016 (15 September 2016). It was conducted in places such as schools, hospitals (Hospital 125 Thai Thinh in Dong Da District, Hanoi, and Vietnam–Germany Hospital in Hoan Kiem District, Hanoi), companies, government organizations, and randomly selected households in Hanoi. All residents in survey locations were invited to answer the questionnaire; the participants were randomly approached. The interviewers were required to wear an identification badge and had to give the participants information about the organizations responsible for the research, as well as the aims and methods of the research, and obtain a written agreement from the participants before starting the interview.
Overall, the study approached 2479 people; an average of one out of every six people invited to the interview refused to answer. Participants took roughly 10–15 min to complete the questionnaire. In the end, the final sample size was 2068 observations.

3.2. Methods

Specifically, this study examines and computes the probabilities of different levels of physical exercise in relation to gender, BMI, educational background, medical practice in the family, and perception of health communication quality. These variables are explained below:
“EvalExer” is the dependent variable, and stands for the level of EAS regularity. The participants were asked, “How much time do you spend on sports and physical exercise?” To which there were four options: “Comsuff” (completely sufficient), “Relsuff” (relatively sufficient), “Little” (do exercise but little), and “Trivial” (rarely do exercise). Thus, this variable is essentially about the self-reports of people on whether they feel their level of EAS is regular or not.
The predictors are:
“Sex” includes two categories, “Male” and “Female.”
“Edu” is short for educational background, which includes two groups: “Highschool” (the people with high-school education or less) and “Graduate” (the people with a university education or higher).
“BMI”, or body mass index, has five categories: <18.5 (Underweight), 18.5–22.99 (Normal), 23–24.99 (Pre-obese), 25–29.99 (Obese level I), and >=30 (Obese level II). During the survey, the subjects were asked to provide their most recent measurements of height (in cm) and weight (in kg), based on which their BMI was calculated using the following formula: BMI = weight/(height × height).
“ExamTools” is short for habitually checking health status in the family with common medical tools. The question was, “Does your family regularly take simple medical measurements (blood pressure, eyesight, weight, etc.)?” There were two options, “Yes” and “No.”
“HealthCom” is short for the perception of the participants towards the quality of mass communication on periodic GHEs; it is rated in a scale from 1 to 5, with 1 being the lowest and 5 being the highest.
The data are then structured in a CSV file and processed in R (3.1.1). The estimations are computed using the baseline category logit model (BCL), according to the work of [46]. The general equation of the BCL model is as follows:
ln π j ( x ) π J ( x ) = α j + β j T x ,   j = 1 , , J 1
where x is the independent variable, and π j ( x ) = P ( Y = j | x ) is its probability. Thus, π j = P ( Y i j = 1 ) , with Y being the dependent variable.
The estimated coefficients attained in multivariable logistic models are used to calculate the empirical probabilities according to the following formula:
π j ( x ) = exp ( α j + β j T x ) 1 + h = 1 J 1 exp ( α h + β h T x )
where j π j ( x ) = 1 ; and there are n observations in the sample, j represents the categorical values of an observation i , and h is a row in the matrix X i . Estimated probabilities can be used to predict the possibilities of Y under different conditions of X i [42,45,47]. The statistical significance of independent variables in the model is determined based on z -value and p -value; with p < 0.05 being the conventional level of statistical significance required for a positive result.

4. Results

This section is divided by subheadings. It provides a concise and precise description of the experimental results, their interpretation, as well as the experimental conclusions that can be drawn.

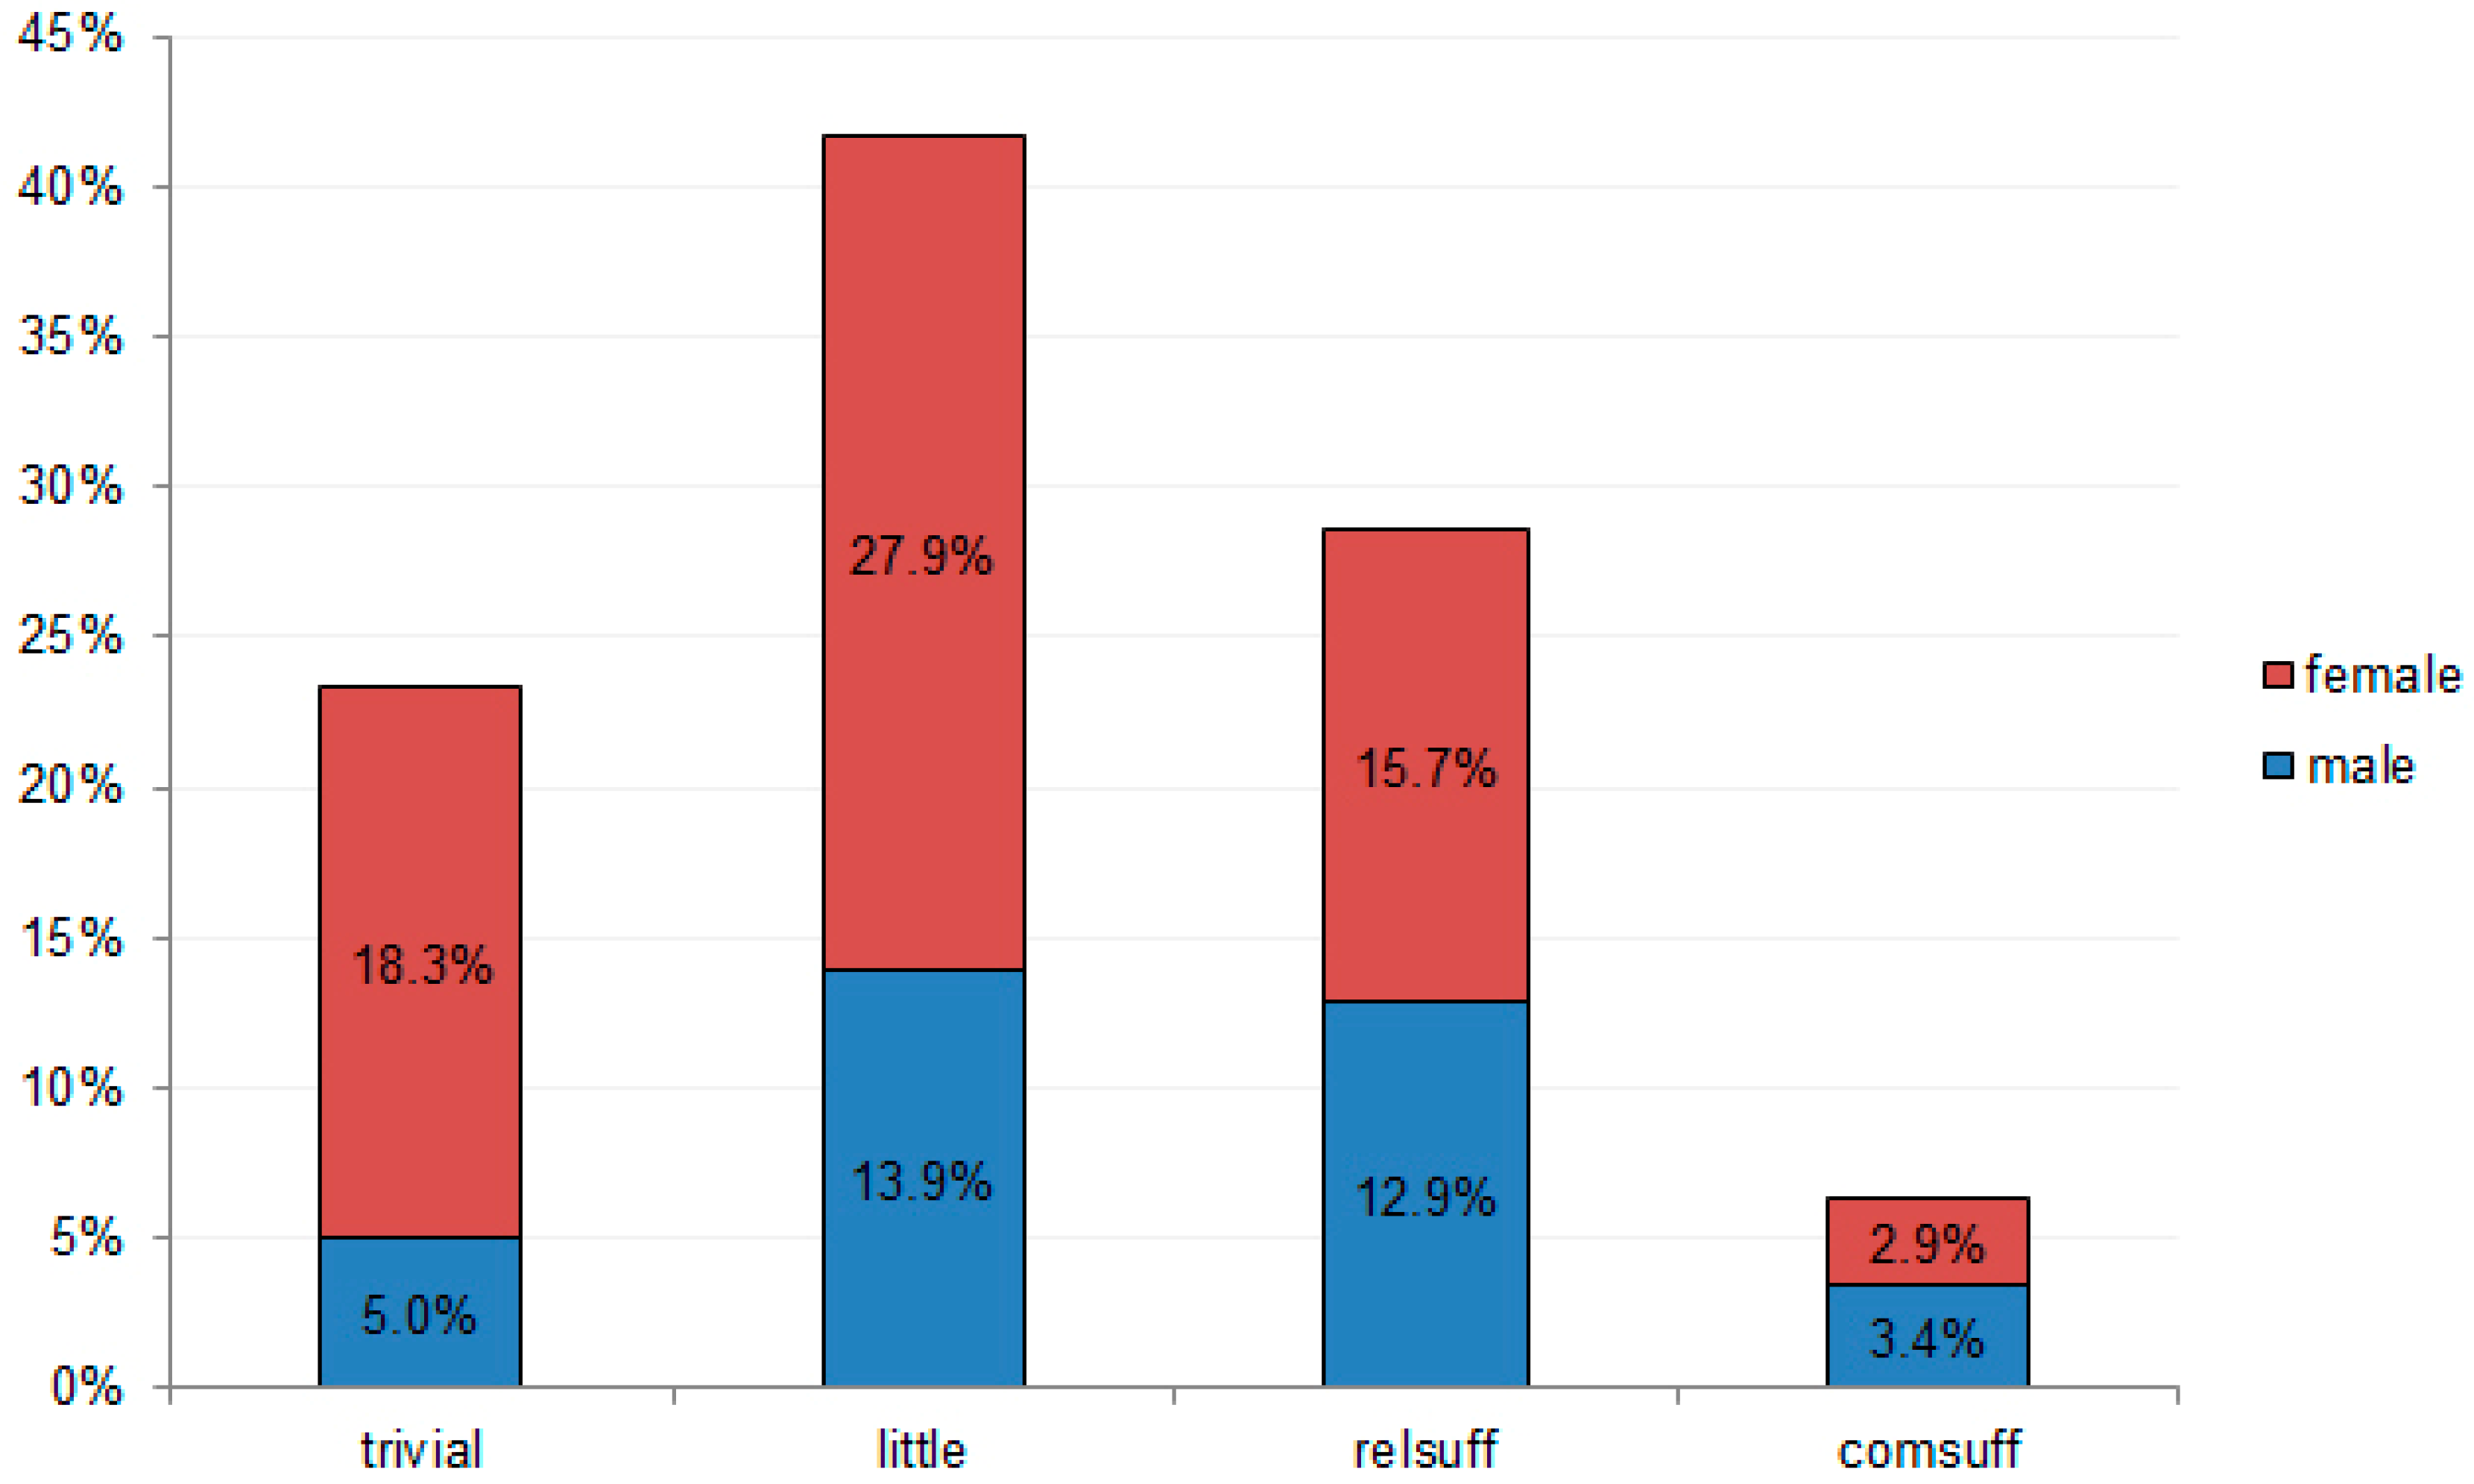
4.1. Descriptive Statistics

Out of a total of 2068 observations obtained in the final sample, the majority of participants were young people (<30 years old) (63.15%), with the proportion of middle-aged and elderly participants (>= 50 years old) only accounting for 5.76% (Table 1). More females than males took part in the survey; females accounted for 64.08%.
It can be seen from Table 1 that the majority of respondents are highly educated, with nearly three-quarters of participants having a university education or a higher degree (73.02%).
Concerning BMI, about 60% the participants are within the normal range, and the rest are distributed evenly between being thin or overweight. The average BMI is also in the normal range, at 20.85 (95% CI: 20.73–20.97) (Table 2). Most participants (60.06%) habitually receive simple health checks at home, including measurements of blood pressure, height, weight, and eyesight, as well as tracking of symptoms.
The level of participation in exercise and sports can be observed in Table 1 and Figure 1. Most survey participants self-reported that they did not regularly engage in physical activities. Those who felt they had a completely sufficient level of EAS represented the smallest group, with under 6%. The largest proportion (41.73%) claimed they did a little exercise, while those who felt their exercise and sports level are relatively sufficient and trivial accounted for 28.58% and 23.31%, respectively.
Figure 1 shows that the number of males and females is distributed unevenly at different activity levels. While more males claim to exercise at a completely sufficient level than females (3.4% versus 2.9%, respectively), females represented a higher proportion in all other levels of EAS regularity.
Also, the perception toward the quality of mass communications on healthcare also plays an important role. In the questionnaire, the study divided this factor into five levels of quality, which corresponds to a scale of 1 to 5, with 1 being the lowest and 5 the highest. The collected data showed that the participants perceived that the healthcare communication they received was only of average quality (2.83 points, 95% CI: 2.79–2.87) (see Table 2).

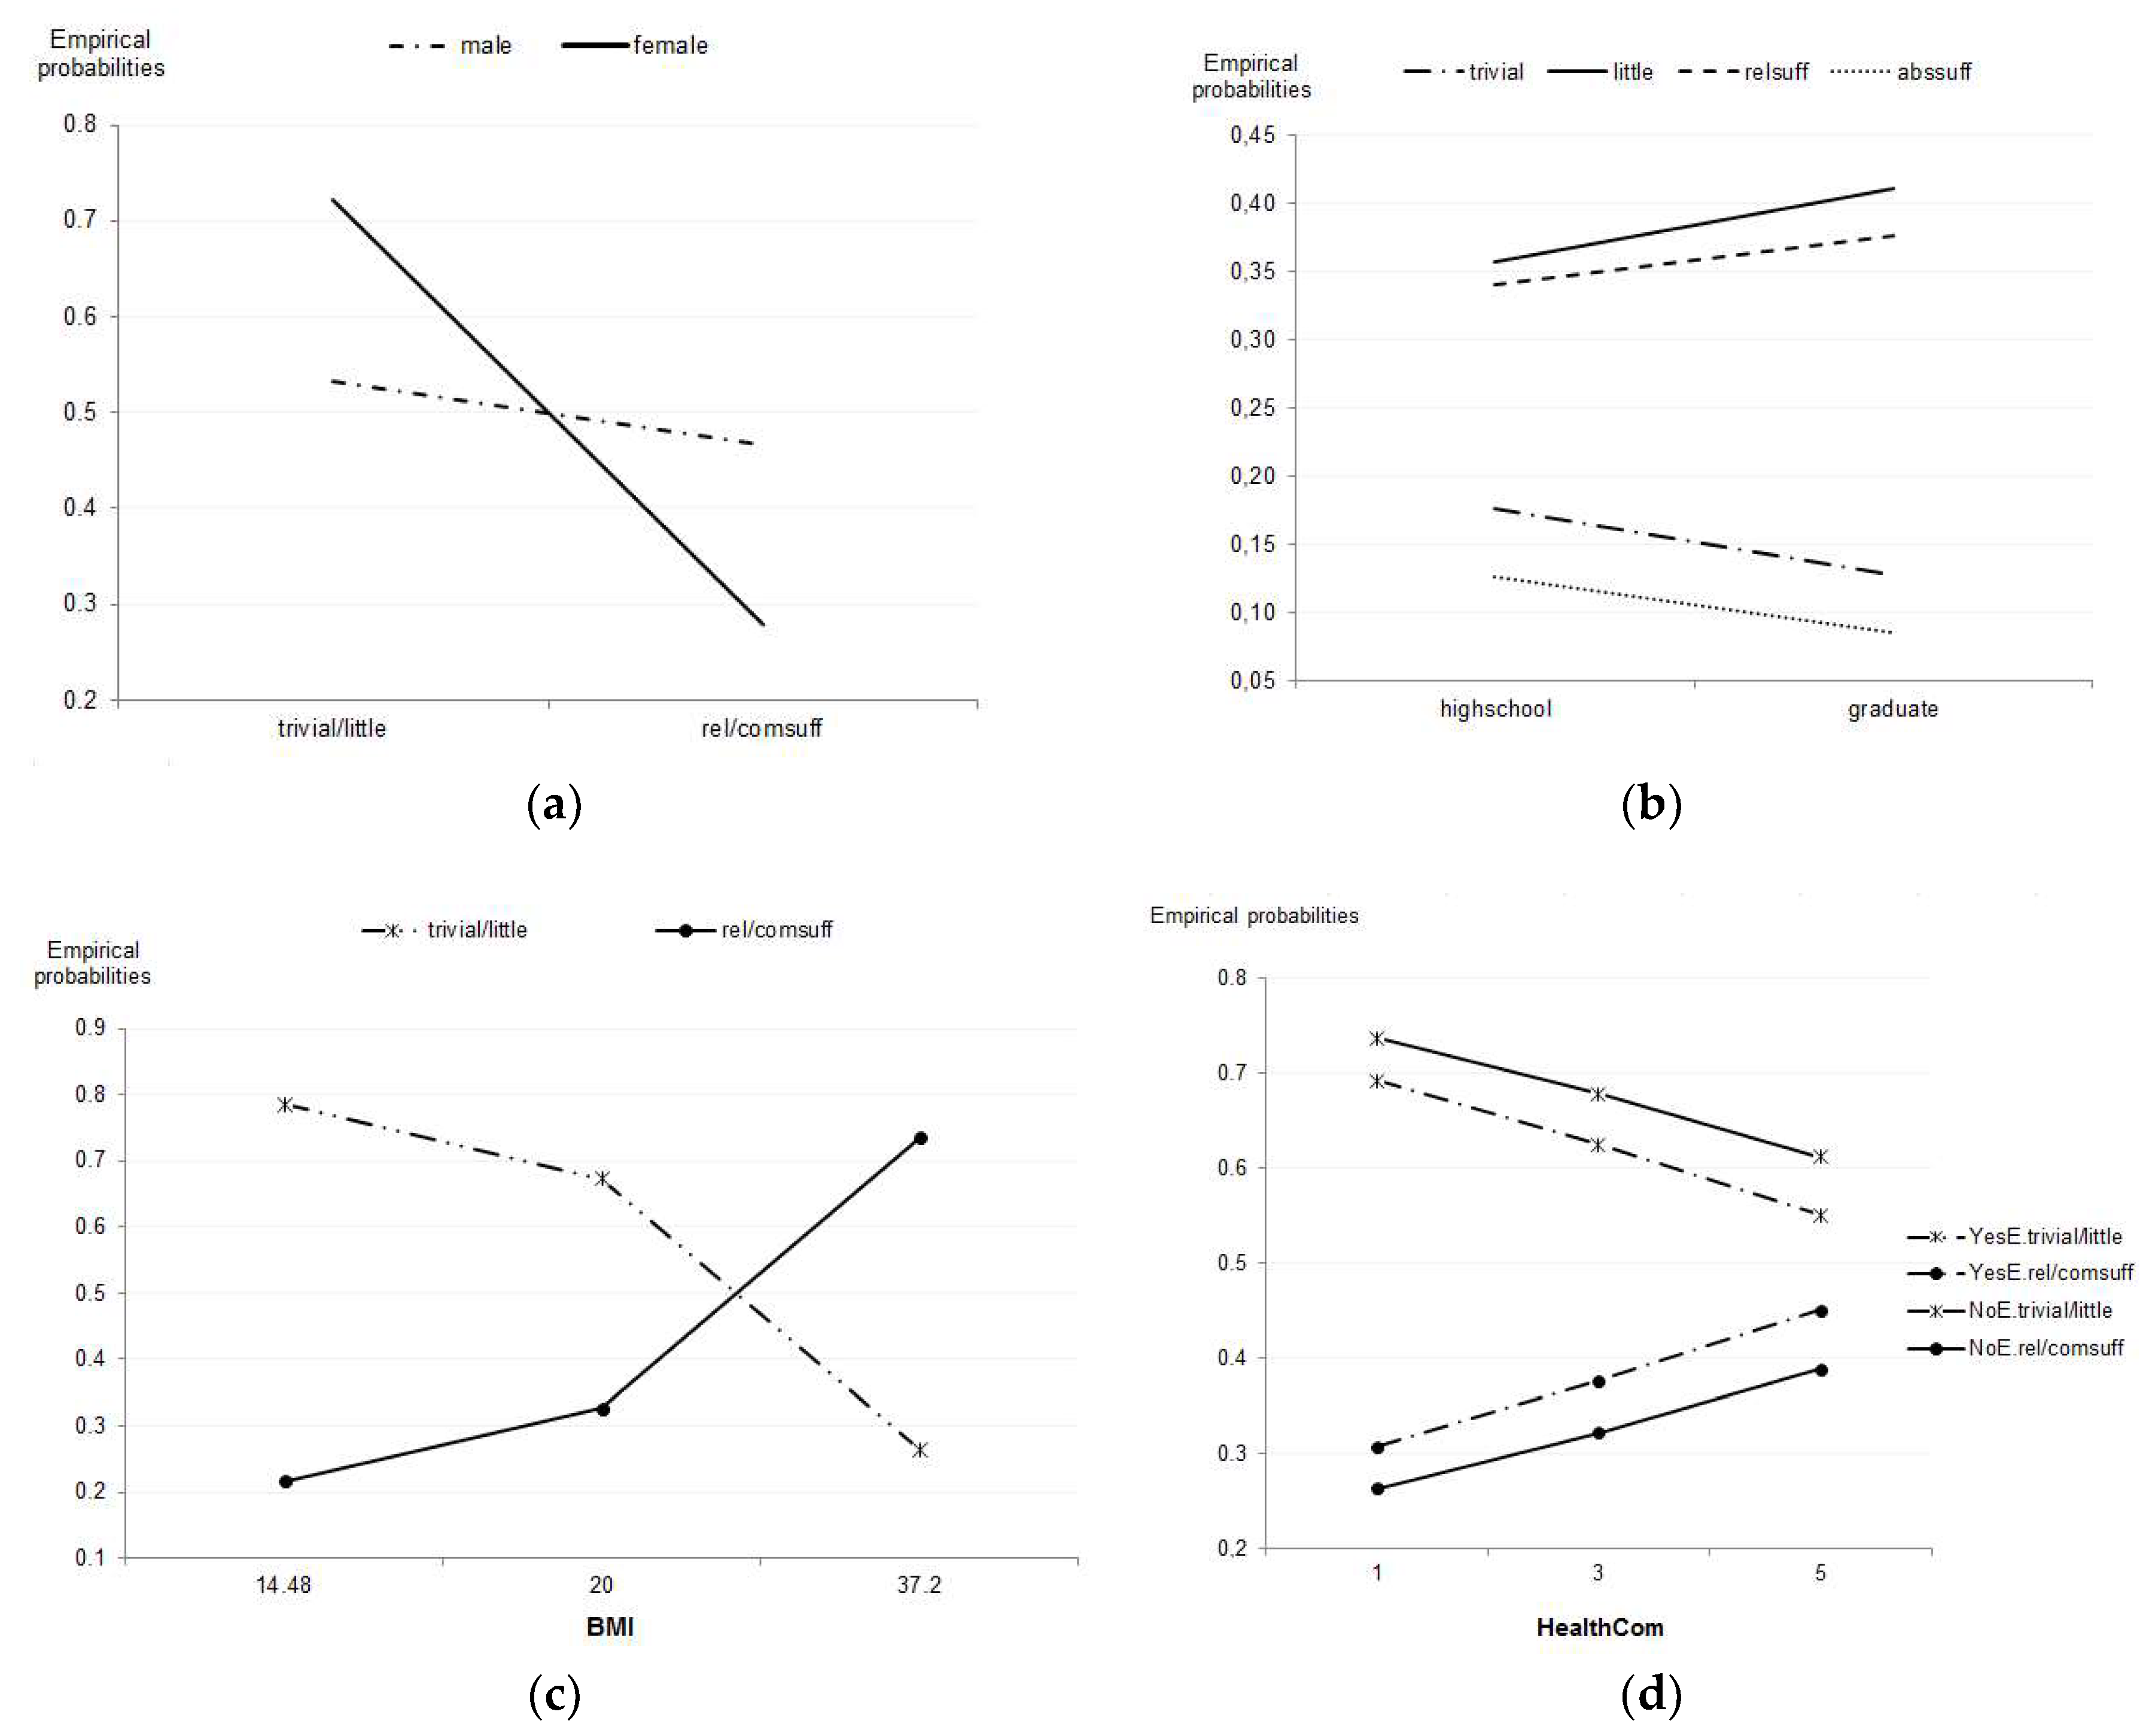
4.2. EAS Regularity Associated with Sex, Educational Background, and BMI

Firstly, the probability of sex and education associated with EAS regularity was considered. The regression model was constructed with the dependent variable being “EvalExer” (the level of EAS regularity), classified into four levels: “Comsuff” (completely sufficient), “Relsuff” (relatively sufficient), “Little” (do exercise but little), and “Trivial” (rarely do exercise); and two predictor variables were “Sex” and “Edu” (educational background). “Sex” includes “Male” and “Female”, while “Edu” has two categories, “Highschool” (the people with high-school education or less) and “Graduate” (the people with a university education or higher). The estimation results follow in Table 3/subTable 3a.
At p < 0.05, most of the estimated coefficients are statistically significant. The estimation equations representing the correlations are presented as follows:
ln π t r i v i a l π c o m s u f f = 1.846 1.437 × M a l e S e x 0.071 × H i g h s c h o o l E d u
ln π l i t t l e π c o m s u f f = 2.387 0.808 × M a l e S e x 0.536 × H i g h s c h o o l E d u
ln π r e l s u f f π c o m s u f f = 1.805 0.315 × M a l e S e x 0.491 × H i g h s c h o o l E d u
From that, the probability of a man with a high-school education or lower that reports exercising relatively sufficiently is as follows:
π r e l s u f f = e 1.805 0.315 0.491 e 1.805 0.315 0.491 + e 2.387 0.808 0.536 + e 1.846 1.437 0.071 + 1 = 0.341
Likewise, the remaining probabilities can also be calculated.
Next, the association of BMI with EAS levels was considered. In this BCL estimation, the dependent variable is still “EvalExer”, and the predictors are “Edu” and “BMI.” The results are reported in Table 3b. From the results, it can be concluded that a relationship between these factors exists. The estimation equations are displayed in Equations (4)–(6).
ln π t r i v i a l π c o m s u f f = 4.006 0.140 × H i g h s c h o o l E d u 0.127 × B M I
ln π l i t t l e π c o m s u f f = 4.158 0.568 × H i g h s c h o o l E d u 0.100 × B M I
ln π r e l s u f f π c o m s u f f = 1.919 0.514 × H i g h s c h o o l E d u 0.012 × B M I

4.3. EAS regularity Associated with Perception on Health Communication Quality and Habitual Health Checks at Home

The physiological factors have been examined above. Now, some other external factors, including perception on healthcare communication about periodic GHEs and habitual health checks at home, are taken into account. Again, the response variable is “EvalExer”, and the two predictors are “ExamTools” (habitual health checks at home with common medical tools), including two options, “Yes” and “No”; and “HealthCom” (perception on the quality of health communication about periodic GHEs), scored from 1 to 5, with 1 being the lowest and 5 the highest. The estimation results are given in Table 3/subTable 3c.
At p < 0.05, the correlations between the above variables are confirmed, with eight out of nine of the estimated coefficients being statistically significant. The empirical relationships are presented in Equations (7)–(9).
l n π t r i v i a l π a b s s u f f = 2.563 0.622 × Y e s E x a m T o o l s 0.297 × H e a l t h C o m
l n π l i t t l e π a b s s u f f = 2.973 0.616 × Y e s E x a m T o o l s 0.236 × H e a l t h C o m
l n π r e l s u f f π a b s s u f f = 2.205 0.464 × Y e s E x a m T o o l s 0.132 × H e a l t h C o m

4.4. Interpretation of Estimation Results

The regression results partly show preliminary assessments about the association of the variables and people’s EAS levels. The following discussion will give more details about both the degree and tendency of each factor. The figures were built using conditional probabilities (see Appendix A).

4.4.1. Physiological Factors

Figure 2a depicts the EAS tendency between males and females with high school education or less. It can be seen that for females, the probability of EAS at the trivial or little level is above 70%, and it drops dramatically to below 30% when associated with relatively or completely sufficient level of physical exercise. In contrast, for males, the probability of EAS at the trivial or little level is just above 50%, but it drops slightly to just slightly below 50%. The different slopes of the two lines demonstrate this tendency. These analytical results show that males tend to be more active than females in both groups of educational background, with the difference amounting to as much as 18.9% (Figure 2a). This is easily explained by the fact that males are generally conceived as the strong genus, as tending to prefer physical activities to females, and as having to do hard work more often. On the other hand, women might think that they often do housework, shopping, and taking care of children, which already require a significant amount of mobilization, so they do not necessarily participate in additional pure sports activities [15]. Moreover, the majority of female participants in the survey said they did not have enough time for themselves, as their official work and housework took up all their time.
Meanwhile, Figure 2c helps clarify the trends of changes in activity levels in association with BMI. From this, it can be seen that when BMI increases from 18 to 23 (within the normal range), the “trivial/little” line (the probability of not exercising or training at negligible level) goes down, and the “rel/comsuff” (the probability of exercising relatively and absolutely sufficiently) goes up. This shows that people with a larger physique tend to exercise more. In particular, those with the largest BMI (BMI = 37.2) have a likelihood of exercising regularly as high as 74%, whereas this figure for the thinnest person (BMI = 14.48) is only slightly above 21% (Figure 2c). This can be explained by the fact that those who are overweight tend to choose exercise and sports as an effective and safe method to lose weight. Also, in the case of Vietnam, the higher average BMI of males compared with females could also be an explanation. The relationship between BMI and sex leads to the correlation between BMI, sex, and activity levels.

4.4.2. External Factors

Concerning the lines showing EAS level changes in relation to educational background, in Figure 2b, it can be observed that the lines of “trivial” and “comsuff” have the same downward trend, moving from the association with “highschool” to “graduate”. Meanwhile, in contrast, the “little” and the “relsuff” lines both go up. An interpretation here is that Hanoi people with a university education or higher tend to feel they spend relatively sufficient or little time doing exercise. In contrast, Figure 2b also showed that those with a low level of education had two distinct trends, either reporting to engage in much more or much less exercise compared with those with higher levels of education.
Previous studies have shown the influence of the media on health care quality assessment, as well as on medical care [33,44]. This paper continues to show the media’s association with EAS regularity. The evidence suggests that the “trivial_little” line goes down and the “rel/comsuff” goes up when the communication quality scored from 1 to 5 (Figure 2d). In other words, those who assess health communication quality as being at the highest level are 12% more likely to exercise frequently than those who assess it as being at the lowest. This means that when the communication quality is improved, people are more conscious about sports training, and this figure can be up to 45% (in the case of the regular check-ups at home being “yes”). The reason for this is that keeping track of healthcare information may prompt people to worry more than usual, which means more attention will be paid to their health [21,22]. Such information helps people understand the importance and benefits of habitual physical exercise, and, as a result, they will engage in more EAS.
In a similar vein, the study revealed that those who examine their health frequently also tend to attend sports activities more regularly. The above position of the lines representing relatively and completely sufficient exercise of those who usually practice common health checks in their home (“YesE.rel/comsuff”) compared with which of those who do not (“NoE.rel/comsuff”) provides support for this argument.

5. Discussion

5.1. Policy Implications

By evaluating the association of the self-reported regularity of leisure time EAS with two group of factors: (i) physiological factors (sex, body mass index or BMI) and (ii) external factors (education, health communication, medical practice at home), this study has filled in the gap in the literature on EAS correlations in a developing country of the middle-income level. The new insights can be used for forming policy related to social health; this section will discuss the implications.
In October 2017, the ruling Communist Party of Vietnam issued Resolution 21 on population works in the new era, which sets the target of bringing up the average Vietnamese height by 4 cm by 2030, representing a major goal in improving social public health status. Particularly, a Vietnamese male aged 18 years should reach 168.5 cm and females 157.5 cm over the next decade [48]. By comparison with regional countries, the height of Vietnamese youth is on par with that of Indonesians and Philippines, but is below that of Singaporeans, Japanese, Thai, and Malaysians [49]. By showing the connection between EAS regularity and certain groups of factors, this study is instrumental in helping policymakers realize the above goal.
For example, the study found that the probability of females with a university education or higher feeling that they spend little or insufficient time exercising is 70%. Public health workers could use this information to target and promote more EAS participation among this group. Regarding BMI, because people with a larger physique tend to report exercising more (Figure 2c), a policy promoting EAS should take into account the population with a leaner physique. Most importantly, the study found an association between positive perception of health communication and people’s engagement in EAS. Thus, this result suggests campaigns aimed at better health information coverage could encourage more Vietnamese people to exercise more regularly.
Another implication is that as knowing the factors associated with physical inactivity, which are increasingly seen to be among the causes of non-communicable diseases (NCDs) in countries of low and middle income [4], could improve evidence-based planning of public health interventions for NCDs. This is especially important for Vietnam, where NCDs, principally cardiovascular disease, diabetes, cancers, and chronic respiratory diseases, cause 73% of all deaths (more than 379,000) each year, according to WHO data [50]. Therefore, although the dataset covers only one location of Vietnam, the analysis results are no doubt useful for policy interpretation in other developing countries.

5.2. Limitations

The study is not without limitations. First of all, as the survey is exclusively based in Hanoi and its nearby areas, it poses a major geographical limitation. In order to investigate regional differences as well as shifting in behaviors and attitudes, it is necessary to conduct a nationwide survey, which would require resources beyond our current capacity. Hence, the findings in the study cannot be generalized to other regions in Vietnam, especially the rural or mountainous areas. Future research could improve upon this limitation by increasing the diversity of socio-demographic factors.
Secondly, the study is limited to the subjective perception of participants on whether or not they feel the amount of time they spend exercising is sufficient. The data were collected on a self-report basis, and thus the results are prone to subjective interpretation. Future research directions could refine the questionnaire by explicitly defining the amount of time one exercises that is sufficient or insufficient.

6. Conclusions

Overall, the above analyses drew links between EAS regularity and two groups of factors, the physiological ones (sex, BMI) and the external ones (education, health communication, and health checkup at home). Particularly, people with higher BMI are more inclined to do more EAS, perhaps because they want to work out to get fitter. The findings also show that those with a low level of education show two distinct trends, either reporting to engage in much more or much less exercise compared with those with higher levels of education. On the contrary, the people with higher education tend to stick with what they feel is a relatively sufficient or little but non-trivial amount of time exercising.
Furthermore, for females, those who graduate from university or have a higher degree usually claimed to exercise less than those with lower education, perhaps because of their job’s attributes and their different routines. The study also found an opposite propensity among males, even if the differences in both sexes are negligible.
As for people’s perception of health communication quality, the study found that as this perception got better, people were also more likely to report spending relatively or completely sufficient time doing sports and physical exercise. It seems that better-perceived quality of health information tends to make people more aware of their health status, so they actively take measures to care for themselves. The findings also indicate that those who habitually conduct simple health checks at home tend to self-report to be more active. Also, when considering the impact of media quality and regular monitoring of health status in comparison, the latter seems to have a greater influence, with the absolute value of the estimated coefficients being significantly larger.
Finally, although this study could be improved through surveying a larger demographic and defining which level of exercise is sufficient, it has provided a perspective from a developing country, and the information obtained through the empirical analyses is shown to have valuable implications for policy-makers and public health workers.

Author Contributions

Conceptualization, methodology, and supervision, Q.-H.V.; data curation, validation, and computations, Q.-H.V., V.-P.L., and T.-T.V.; investigation, Q.-H.V., H.M.T., and A.-D.H.; writing—original draft preparation, T.-T.V.; writing—review and editing, M.-T.H. and H.K.T.N.; visualization, T.-T.V., M.-T.H., and H.K.T.N. All co-authors read and approved the manuscript.

Funding

The authors received no external funding for this research.

Acknowledgments

The authors would like to thank Vuong & Associates’ research team for assisting in collecting the raw data and preparing the dataset for this study: Dam Thu Ha, Nghiem Phu Kien Cuong, and Do Thu Hang.

Conflicts of Interest

The authors declare no conflict of interest.

Appendix A

a. Probabilities of EAS regularity towards gender and education.
“EvalExer”“trivial”“little”“relsuff”“abssuff”
“Edu”|”Sex”“male”“female”“male”“female”“male”“female”“male”“female”
“highschool”0.1760.3470.3570.3750.3410.2190.1260.059
“graduate”0.1280.2610.4110.4480.3760.2500.0850.041
b. Probabilities of EAS regularity towards BMI.
“EvalExer”
“bmi”“edu”“trivial”“little”“relsuff”“abssuff”
14.48“highschool”0.3700.4150.1670.049
“graduate”0.2860.4930.1880.033
20“highschool”0.2920.3810.2490.078
“graduate”0.2240.4470.2770.052
37.20“highschool”0.0860.1790.5310.204
“graduate”0.0660.2090.5890.135
c. Probabilities of EAS regularity towards health communication quality and usual medical practice in the family.
“EvalExer”
“HealthCom”“Examtools”“trivial”“little”“relsuff”“abssuff”
1Yes0.2650.4270.2560.051
No0.2830.4540.2340.029
3Yes0.2220.4030.2980.078
No0.2410.4370.2770.045
5Yes0.1800.3700.3360.114

References

  1. Van Bui, T.; Blizzard, C.L.; Luong, K.N.; Le Van Truong, N.; Tran, B.Q.; Otahal, P.; Srikanth, V.; Nelson, M.R.; Au, T.B.; Ha, S.T. Physical activity in Vietnam: Estimates and measurement issues. PLoS ONE 2015, 10, e0140941. [Google Scholar]
  2. Althoff, T.; Hicks, J.L.; King, A.C.; Delp, S.L.; Leskovec, J. Large-scale physical activity data reveal worldwide activity inequality. Nature 2017, 547, 336–339. [Google Scholar] [CrossRef] [PubMed] [Green Version]
  3. Ha, P. Vietnamese People among the Most Sedentary in the World—Survey. Available online: https://e.vnexpress.net/news/business/data-speaks/vietnamese-people-among-the-most-sedentary-in-the-world-survey-3613038.html (accessed on 17 April 2018).
  4. Tuan, N.; Tuong, P.; Popkin, B. Body mass index (BMI) dynamics in Vietnam. Eur. J. Clin. Nutr. 2008, 62, 78–86. [Google Scholar] [CrossRef] [PubMed]
  5. Cuong, T.; Dibley, M.; Bowe, S.; Hanh, T.; Loan, T. Obesity in adults: An emerging problem in urban areas of Ho Chi Minh City, Vietnam. Eur. J. Clin. Nutr. 2007, 61, 673–681. [Google Scholar] [CrossRef] [PubMed]
  6. Nguyen, M.D.; Beresford, S.A.; Drewnowski, A. Trends in overweight by socio-economic status in Vietnam: 1992 to 2002. Public Health Nutr. 2007, 10, 115–121. [Google Scholar] [CrossRef] [PubMed]
  7. Craig, D. Familiar Medicine: Everyday Health Knowledge and Practice in Today’s Vietnam; University of Hawaii Press: Honolulu, HI, USA, 2002. [Google Scholar]
  8. Bauman, A.E.; Reis, R.S.; Sallis, J.F.; Wells, J.C.; Loos, R.J.; Martin, B.W.; Lancet Physical Activity Series Working Group. Correlates of physical activity: Why are some people physically active and others not? Lancet 2012, 380, 258–271. [Google Scholar] [CrossRef]
  9. De Rezende, L.F.M.; Azeredo, C.M.; Canella, D.S.; Claro, R.M.; de Castro, I.R.R.; Levy, R.B.; do Carmo Luiz, O. Sociodemographic and behavioral factors associated with physical activity in Brazilian adolescents. BMC Public Health 2014, 14, 485. [Google Scholar] [CrossRef] [PubMed] [Green Version]
  10. Heseltine, R.; Skelton, D.A.; Kendrick, D.; Morris, R.W.; Griffin, M.; Haworth, D.; Masud, T.; Iliffe, S. “Keeping Moving”: Factors associated with sedentary behaviour among older people recruited to an exercise promotion trial in general practice. BMC Fam. Pract. 2015, 16, 67. [Google Scholar] [CrossRef] [PubMed]
  11. Humpel, N.; Owen, N.; Leslie, E. Environmental factors associated with adults’ participation in physical activity: A review. Am. J. Prevent. Med. 2002, 22, 188–199. [Google Scholar] [CrossRef]
  12. Bonaiuto, M.; Aiello, A.; Perugini, M.; Bonnes, M.; Ercolani, A.P. Multidimensional perception of residential environment quality and neighbourhood attachment in the urban environment. J. Environ. Psychol. 1999, 19, 331–352. [Google Scholar] [CrossRef]
  13. Minichilli, F.; Gorini, F.; Ascari, E.; Bianchi, F.; Coi, A.; Fredianelli, L.; Licitra, G.; Manzoli, F.; Mezzasalma, L.; Cori, L. Annoyance Judgment and Measurements of Environmental Noise: A Focus on Italian Secondary Schools. Int. J. Environ. Res. Public Health 2018, 15, 208. [Google Scholar] [CrossRef] [PubMed]
  14. Cassina, L.; Fredianelli, L.; Menichini, I.; Chiari, C.; Licitra, G. Audio-Visual Preferences and Tranquillity Ratings in Urban Areas. Environments 2018, 5, 1. [Google Scholar] [CrossRef]
  15. Wilson, M.G.; Ellison, G.M.; Cable, N.T. Basic science behind the cardiovascular benefits of exercise. Br. J. Sports Med. 2016, 50, 93–99. [Google Scholar] [CrossRef] [PubMed] [Green Version]
  16. Kenney, W.L.; Wilmore, J.; Costill, D. Physiology of Sport and Exercise, 6th ed.; Human Kinetics: Champaign, IL, USA, 2015. [Google Scholar]
  17. McNally, S. Exercise: The Miracle Cure and the Role of the Doctor in Promoting It; Academy of Medical Royal Colleges: London, UK, 2015. [Google Scholar]
  18. Macera, C.A.; Jones, D.A.; Yore, M.; Ham, S.; Kohl, H.W.; Kimsey Jr, C.; Buchner, D. Prevalence of physical activity, including lifestyle activities among adults-United States, 2000–2001. Morb. Mortality Wkly. Rep. 2003, 52, 764–769. [Google Scholar]
  19. Beck, B.R.; Daly, R.M.; Singh, M.A.F.; Taaffe, D.R. Exercise and Sports Science Australia (ESSA) position statement on exercise prescription for the prevention and management of osteoporosis. J. Sci. Med. Sport 2017, 20, 438–445. [Google Scholar] [CrossRef] [PubMed]
  20. Sharman, J.E.; Stowasser, M. Australian association for exercise and sports science position statement on exercise and hypertension. J. Sci. Med. Sport 2009, 12, 252–257. [Google Scholar] [CrossRef] [PubMed]
  21. Tiedemann, A.; Sherrington, C.; Close, J.C.; Lord, S.R. Exercise and Sports Science Australia position statement on exercise and falls prevention in older people. J. Sci. Med. Sport 2011, 14, 489–495. [Google Scholar] [CrossRef] [PubMed]
  22. Valderrabano, V.; Steiger, C. Treatment and prevention of osteoarthritis through exercise and sports. J. Aging Res. 2011, 2011, 374653. [Google Scholar] [CrossRef] [PubMed]
  23. Smart, N.A.; Williams, A.D.; Levinger, I.; Selig, S.; Howden, E.; Coombes, J.S.; Fassett, R.G. Exercise & Sports Science Australia (ESSA) position statement on exercise and chronic kidney disease. J. Sci. Med. Sport 2013, 16, 406–411. [Google Scholar] [PubMed]
  24. Warner, S.; Dixon, M.A. Competition, gender, and the sport experience: An exploration among college athletes. Sport Educ. Soc. 2015, 20, 527–545. [Google Scholar] [CrossRef]
  25. Sheel, A.W.; Richards, J.C.; Foster, G.E.; Guenette, J.A. Sex differences in respiratory exercise physiology. Sports Med. 2004, 34, 567–579. [Google Scholar] [CrossRef] [PubMed]
  26. Hagströmer, M.; Kwak, L.; Oja, P.; Sjöström, M. A 6 year longitudinal study of accelerometer-measured physical activity and sedentary time in Swedish adults. J. Sci. Med. Sport 2015, 18, 553–557. [Google Scholar] [CrossRef] [PubMed]
  27. Flegal, K.M.; Carroll, M.D.; Kit, B.K.; Ogden, C.L. Prevalence of obesity and trends in the distribution of body mass index among US adults, 1999-2010. JAMA 2012, 307, 491–497. [Google Scholar] [CrossRef] [PubMed]
  28. Ho, A.J.; Raji, C.A.; Becker, J.T.; Lopez, O.L.; Kuller, L.H.; Hua, X.; Dinov, I.D.; Stein, J.L.; Rosano, C.; Toga, A.W. The effects of physical activity, education, and body mass index on the aging brain. Hum. Brain Mapping 2011, 32, 1371–1382. [Google Scholar] [CrossRef] [PubMed]
  29. Jackson, A.; Stanforth, P.; Gagnon, J.; Rankinen, T.; Leon, A.; Rao, D.; Skinner, J.; Bouchard, C.; Wilmore, J. The effect of sex, age and race on estimating percentage body fat from body mass index: The Heritage Family Study. Int. J. Obesity 2002, 26, 789–796. [Google Scholar] [CrossRef] [PubMed]
  30. Wang, J.; Thornton, J.C.; Russell, M.; Burastero, S.; Heymsfield, S.; Pierson Jr, R.N. Asians have lower body mass index (BMI) but higher percent body fat than do whites: Comparisons of anthropometric measurements. Am. J. Clin. Nutr. 1994, 60, 23–28. [Google Scholar] [CrossRef] [PubMed]
  31. Sundquist, J.; Johansson, S.-E. The influence of socioeconomic status, ethnicity and lifestyle on body mass index in a longitudinal study. Int. J. Epidemiol. 1998, 27, 57–63. [Google Scholar] [CrossRef] [PubMed] [Green Version]
  32. Rantanen, T.; Parkatti, T.; Heikkinen, E. Muscle strength according to level of physical exercise and educational background in middle-aged women in Finland. Eur. J. Appl. Physiol. Occup. Physiol. 1992, 65, 507–512. [Google Scholar] [CrossRef] [PubMed]
  33. Keller, P.A.; Lehmann, D.R. Designing Effective Health Communications: A Meta-Analysis. J. Public Policy Mark. 2008, 27, 117–130. [Google Scholar] [CrossRef] [Green Version]
  34. Regitz-Zagrosek, V. Sex and gender differences in health. Sci. Soc. Ser. Sex Sci. 2012, 13, 596–603. [Google Scholar] [CrossRef] [PubMed] [Green Version]
  35. Mansfield, A.K.; Addis, M.E.; Mahalik, J.R. “Why won’t he go to the doctor?”: The psychology of men’s help seeking. Int. J. Men’s Health 2003, 2, 93. [Google Scholar] [CrossRef]
  36. Wellstead, P. Information behaviour of Australian men experiencing stressful life events: The role of social networks and confidants. Inf. Res. 2011, 16, 12120429. [Google Scholar]
  37. Block, L.G.; Keller, P.A. Effects of self-efficacy and vividness on the persuasiveness of health communications. J. Consum. Psychol. 1997, 6, 31–54. [Google Scholar] [CrossRef]
  38. Ek, S. Gender differences in health information behaviour: A Finnish population-based survey. Health Promot. Int. 2015, 30, 736–745. [Google Scholar] [CrossRef] [PubMed]
  39. Kreps, G.L.; Sivaram, R. Strategic health communication across the continuum of breast cancer care in limited-resource countries. Cancer 2008, 113, 2331–2337. [Google Scholar] [CrossRef] [PubMed] [Green Version]
  40. Hiatt, R.; Pasick, R.; Stewart, S.; Bloom, J.; Davis, P.; Gardiner, P.; Johnston, M.; Luce, J.; Schorr, K.; Brunner, W.; et al. Community-based cancer screening for underserved women: Design and baseline findings from the Breast and Cervical Cancer Intervention Study. Prev. Med. 2001, 33, 190–203. [Google Scholar] [CrossRef] [PubMed]
  41. Vuong, Q.H. Vietnam General Health Examinations Propensity Survey 2016. Available online: https://osf.io/afz2w/ (accessed on 23 October 2018).
  42. Vuong, Q.H.; Ho, T.M.; Nguyen, H.K.; Vuong, T.T. Healthcare consumers’ sensitivity to costs: A reflection on behavioural economics from an emerging market. Palgrave Commun. 2018, 4, 70. [Google Scholar] [CrossRef]
  43. Vuong, Q.-H.; La, V.-P.; Vuong, T.-T.; Ho, M.-T.; Nguyen, H.-K.T.; Nguyen, V.-H.; Pham, H.-H.; Ho, M.-T. An open database of productivity in Vietnam’s social sciences and humanities for public use. Sci. Data 2018, 5, 180188. [Google Scholar] [CrossRef] [PubMed]
  44. Wilkinson, M.D.; Dumontier, M.; Aalbersberg, I.J.; Appleton, G.; Axton, M.; Baak, A.; Blomberg, N.; Boiten, J.-W.; da Silva Santos, L.B.; Bourne, P.E. The FAIR Guiding Principles for scientific data management and stewardship. Sci. Data 2016, 3, 160018. [Google Scholar] [CrossRef] [PubMed] [Green Version]
  45. Vuong, Q.H. Survey data on Vietnamese propensity to attend periodic general health examinations. Scientific Data 2017, 4, 170142. [Google Scholar] [CrossRef] [PubMed] [Green Version]
  46. Agresti, A. Categorical Data Analysis; John Wiley & Sons: Hoboken, NJ, USA, 2003. [Google Scholar]
  47. Vuong, Q.H.; Vuong, T.T.; Ho, T.M.; Nguyen, H.V. Psychological and socio-economic factors affecting social sustainability through impacts on perceived health care quality and public health: The case of Vietnam. Sustainability 2017, 9, 1456. [Google Scholar] [CrossRef]
  48. State Audit of Vietnam. Nghi Quyet 21 NQ-TW cua Ban Chap Hanh Trung Uong Dang Ve Cong Tac Dan So Trong Tinh Hinh Doi Moi [Resolution 21 of Central Steering Committee on Population Works in a New era]. Available online: http://vanban.sav.gov.vn/2072-1-ddt/nghi-quyet-21nqtw-ngay-25102017-cua-ban-chap-hanh-trung-uong-ve-cong-tac-dan-so-trong-tinh-hinh-moi.sav (accessed on 17 April 2018).
  49. Duy Tien. Vietnamese among the Shortest, Research Reveals. Available online: http://en.cand.com.vn/Law-Society/Vietnamese-among-the-shortest-research-reveals-459912/ (accessed on 3 October 2018).
  50. World Health Organization. UN Interagency Task Force on NCDs Joint Country Mission to Viet Nam. Available online: http://www.who.int/ncds/un-task-force/vietnam-mission-september-2016/en/ (accessed on 17 April 2018).
Figure 1. Distribution of respondents towards the level of exercise and sports (EAS) regularity, and by sex.
Sustainability 10 03828 g001
Figure 2. Probability lines represent EAS regularity levels towards physiological and external factors: (a) between males and females; (b) differences of intensivity levels between people with different education backgrounds; (c) activity levels against BMI; and, (d) association of perceived health communication value and exercise activity.
Sustainability 10 03828 g002
Table 1. Descriptive statistics of the sample. BMI—body mass index.
CharacteristicsNPercentage (%)
Age
<30130663.15
30–4964331.09
≥501195.76
Sex
Male72835.20
Female134064.80
Educational background
High school or less55826.98
University or above1.51073.02
BMI
<18.5 (Underweight)40819.73
18.5–22.99 (Normal)124260.06
23–24.99 (Pre-obese)27913.49
25–29.99 (Obese level I)1286.19
>=30 (Obese level II)110.53
Checking up health at home regularly (blood pressure, weight, eyesight, etc.)
Yes124260.06
No82639.94
The level of exercise and sports regularity
Completely sufficient1326.38
Relatively sufficient59128.58
Little86341.73
Trivial48223.31
Table 2. Descriptive statistics for continuous variables.
CharacteristicsMinMaxAverageSDCI
Age188329.1710.0928.73–29.60
BMI14.4837.2020.852.6920.73–20.96
Health communication quality perception152.831.1702.79–2.87
Table 3. Exercise and sports (EAS) regularity associated with sex, educational background, and BMI.
(3a)Intercept“Sex”“Edu”
“Male”“Highschool”
β 0 β 1 β 2
logit(trivial|comsuff)1.846 ***
[12.065]
−1.437 ***
[−6.926]
−0.071
[−0.338]
logit(little|comsuff)2.387 ***
[16.134]
−0.808 ***
[−4.256]
−0.536 **
[−2.686]
logit(relsuff|comsuff)1.805 ***
[11.818]
−0.315
[−1.623]
−0.491 *
[−2.394]
Significant codes: 0 ‘***’ 0.001 ‘**’ 0.01 ‘*’ 0.05 ‘.’ 0.1 ‘ ’ 1; z−value in square brackets; baseline category for “Sex” = “Female” and “Edu” = “Graduate”. Log-likelihood: −36.94 with 3 degrees of freedom. Residual deviance: 4.17 with 3 degrees of freedom.
(3b)Intercept“Edu”“BMI”
“Highschool”
β 0 β 1 β 2
logit(trivial|comsuff)4.006 ***
[5.297]
−0.14
[−0.677]
−0.127 ***
[−3.586]
logit(little|comsuff)4.158 ***
[5.837]
−0.568 **
[−2.860]
−0.100 **
[−3.025]
logit(relsuff|comsuff)1.919 **
[2.658]
−0.514 *
[−2.510]
−0.012
[−0.366]
Significant codes: 0 ‘***’ 0.001 ‘**’ 0.01 ‘*’ 0.05 ‘.’ 0.1 ‘ ’ 1; z−value in square brackets; baseline category for “Edu” = “Graduate”. Log-likelihood: −2533.25 with 6195 degrees of freedom. Residual deviance: 5066.50 with 6195 degrees of freedom
(3c)Intercept“ExamTools”“HealthCom”
“Yes”
β 0 β 1 β 2
logit(trivial|comsuff)2.563 ***
[7.566]
−0.622 **
[−2.867]
−0.297 **
[−2.976]
logit(little|comsuff)2.973 ***
[9.144]
−0.616 **
[−2.960]
−0.236 *
[−2.497]
logit(relsuff|comsuff)2.205 ***
[6.600]
−0.464 *
[−2.171]
−0.132
[−1.358]
Significant codes: 0 ‘***’ 0.001 ‘**’ 0.01 ‘*’ 0.05 ‘.’ 0.1 ‘ ’ 1; z−value in square brackets; baseline category for “ExamTools” = “No”. Log-likelihood: −2546.62 with 6195 degrees of freedom. Residual deviance: 5093.25 with 6195 degrees of freedom.

