On the Use of Satellite Sentinel 2 Data for Automatic Mapping of Burnt Areas and Burn Severity


1
Institute of Methodologies for Environmental Analysis, Italian Research Council, C.da S. Loja, Tito Scalo, 85050 Potenza, Italy
2
Laboratorio Ecotono, Institute for Research on Biodiversity and the Environment, National Scientific and Technical Research Council, Sarmiento 440, Buenos Aires, Argentina
*
Author to whom correspondence should be addressed.
Sustainability 2018, 10(11), 3889; https://0-doi-org.brum.beds.ac.uk/10.3390/su10113889
Submission received: 1 August 2018
/
Revised: 20 October 2018
/
Accepted: 23 October 2018
/
Published: 25 October 2018
(This article belongs to the Special Issue Sustainable Land Uses and Rural Governance)
Abstract
:In this paper, we present and discuss the preliminary tools we devised for the automatic recognition of burnt areas and burn severity developed in the framework of the EU-funded SERV_FORFIRE project. The project is focused on the set up of operational services for fire monitoring and mitigation specifically devised for decision-makers and planning authorities. The main objectives of SERV_FORFIRE are: (i) to create a bridge between observations, model development, operational products, information translation and user uptake; and (ii) to contribute to creating an international collaborative community made up of researchers and decision-makers and planning authorities. For the purpose of this study, investigations into a fire burnt area were conducted in the south of Italy from a fire that occurred on 10 August 2017, affecting both the protected natural site of Pignola (Potenza, South of Italy) and agricultural lands. Sentinel 2 data were processed to identify and map different burnt areas and burn severity levels. Local Index for Statistical Analyses LISA were used to overcome the limits of fixed threshold values and to devise an automatic approach that is easier to re-apply to diverse ecosystems and geographic regions. The validation was assessed using 15 random plots selected from in situ analyses performed extensively in the investigated burnt area. The field survey showed a success rate of around 95%, whereas the commission and omission errors were around 3% of and 2%, respectively. Overall, our findings indicate that the use of Sentinel 2 data allows the development of standardized burn severity maps to evaluate fire effects and address post-fire management activities that support planning, decision-making, and mitigation strategies.
1. Introduction
Rural and urban development remains a key priority area in the growth process oriented at sustainable economic development to improve quality of life and preserve the environment. Today it is well recognized that to establish a sustainable future, the protection and preservation of natural resources and the landscape is a basic need, especially in rural development addressed at integrated management, which takes into account the economic, social and environmental dimensions of sustainable development [1]. This approach is particularly important for small towns, which can play a crucial role and represent a key component of national and regional urban systems across the world, being that more than one-fifth of the world’s urban population lives in centers with up to 50,000 inhabitants.
The links and interactions between ‘rural’ and ‘urban’ are an increasingly important component of livelihoods and production systems and the promotion of a better management of urban–rural interactions is mandatory in order to: (i) support and encourage sustainable resource management; (ii) develop better practices in agriculture and forest management; and (iii) preserve our natural resources for future generations. For these reasons, forest fires are today recognized as a global ecological and social problem with expected potential increasing trends also due to land abandonment and climate change. Fires are one of the most important causes of land degradation, as they induce significant alterations not only in the vegetation cover but also in the fauna, soil, and atmosphere, producing high direct and indirect losses, including economic losses.
Fire affects vegetation, landscape and the environment in the short- as well as the long-term. Short-term, fires induce patch homogenization and create positive feedback to future fire susceptibility, fuel loading, fire spreading and intensity, and facilitate alien plant invasions. Long-term, fires lead to permanent changes in the composition of the vegetation community, cause a reduction in forests and a loss of biodiversity, and impact vegetation dynamics. Moreover, fires induce soil degradation, and the alteration of landscape patterns and ecosystem functioning, thus speeding up desertification processes. Therefore, it is necessary to protect communities, infrastructure and natural resources from fire damage through sustainable preventive landscape management, which should include policy, cultural, technical, social, financial, organizational, economic and market aspects [2].
Prevention activities coupled with the use of reliable monitoring systems are the relevant strategies to limit fire and post-fire damage. After fire, the ability to promptly map burnt areas is of primary importance for the adequate management of damaged areas and to limit additional post-fire damages and danger.
Earth observation (EO) techniques can provide: (i) operational tools that support environmental protection; and (ii) key information necessary to guide post-fire management activities and support decisions to mitigate the impact of fire, mitigate fire-induced risk (such as increases in erosion processes, proneness to landslides) and facilitate post-fire recovery. In this paper, we provide the preliminary tools that we devised to obtain automatic recognition of burnt areas and burn severity, as developed in the framework of the SERV_FORFIRE project [3]. The main objectives of this project are: (i) to create a bridge between observations, model development, operational products, information translation and user uptake; and (ii) to contribute to creating an international collaborative community of climate information providers, experts in remote sensing, soil and vegetation, risk management and mitigation, along with users, decision-makers and planning authorities in order to:
- strengthen the science–policy–society nexus using a participatory approach, by improving already operational or experimentally tested climate services in Europe, tailoring relevant information for decision and policy-makers through a participative and circular approach, capacity building user-centric tools, specific training programs, dissemination activities; and
- increase the efficiency of decision- and policy-makers responses, to improve the preparedness level of our societies and to limit the high economic cost of the impact of climate variability on fire and post-fire risks, developing methods and specific procedures within the framework of fire and post-fire risk management in Europe at climatic time scales (from seasonal to longer time scales).
SERV_FORFIRE will act as a bridge between the users and the science and devise solution-oriented models and adaptable innovative schemes for fire and post-fire risk management and mitigation in order to preserve the fragile resources and environments of areas vulnerable to fire and recently exposed to post-fire disturbance, which has been further enhanced due to climate change. Therefore, the expected impact of the SERV_FORFIRE project on the societal challenges addressed will be, among others, the following:
- ✓
- Contribute to European good governance and management of fire and post-fire risk to preserve natural vegetation and improve forest management problems, versus climate change and environmental impacts, and minimizing losses mainly focusing on fire in the wildland–urban interface and related to citizen health.
- ✓
- Environmentally protect both nature (flora, fauna, soil, atmosphere, landscape, ecosystems, etc.) and citizens and also provide assistance to stakeholders.
- ✓
- Train stakeholders to facilitate fire management as well as to identify and adopt suitable adaptation and mitigation strategies.
- ✓
- Improve the public perception of the European management capability of fire emergency crises.
2. Materials and Methods
2.1. Study Area
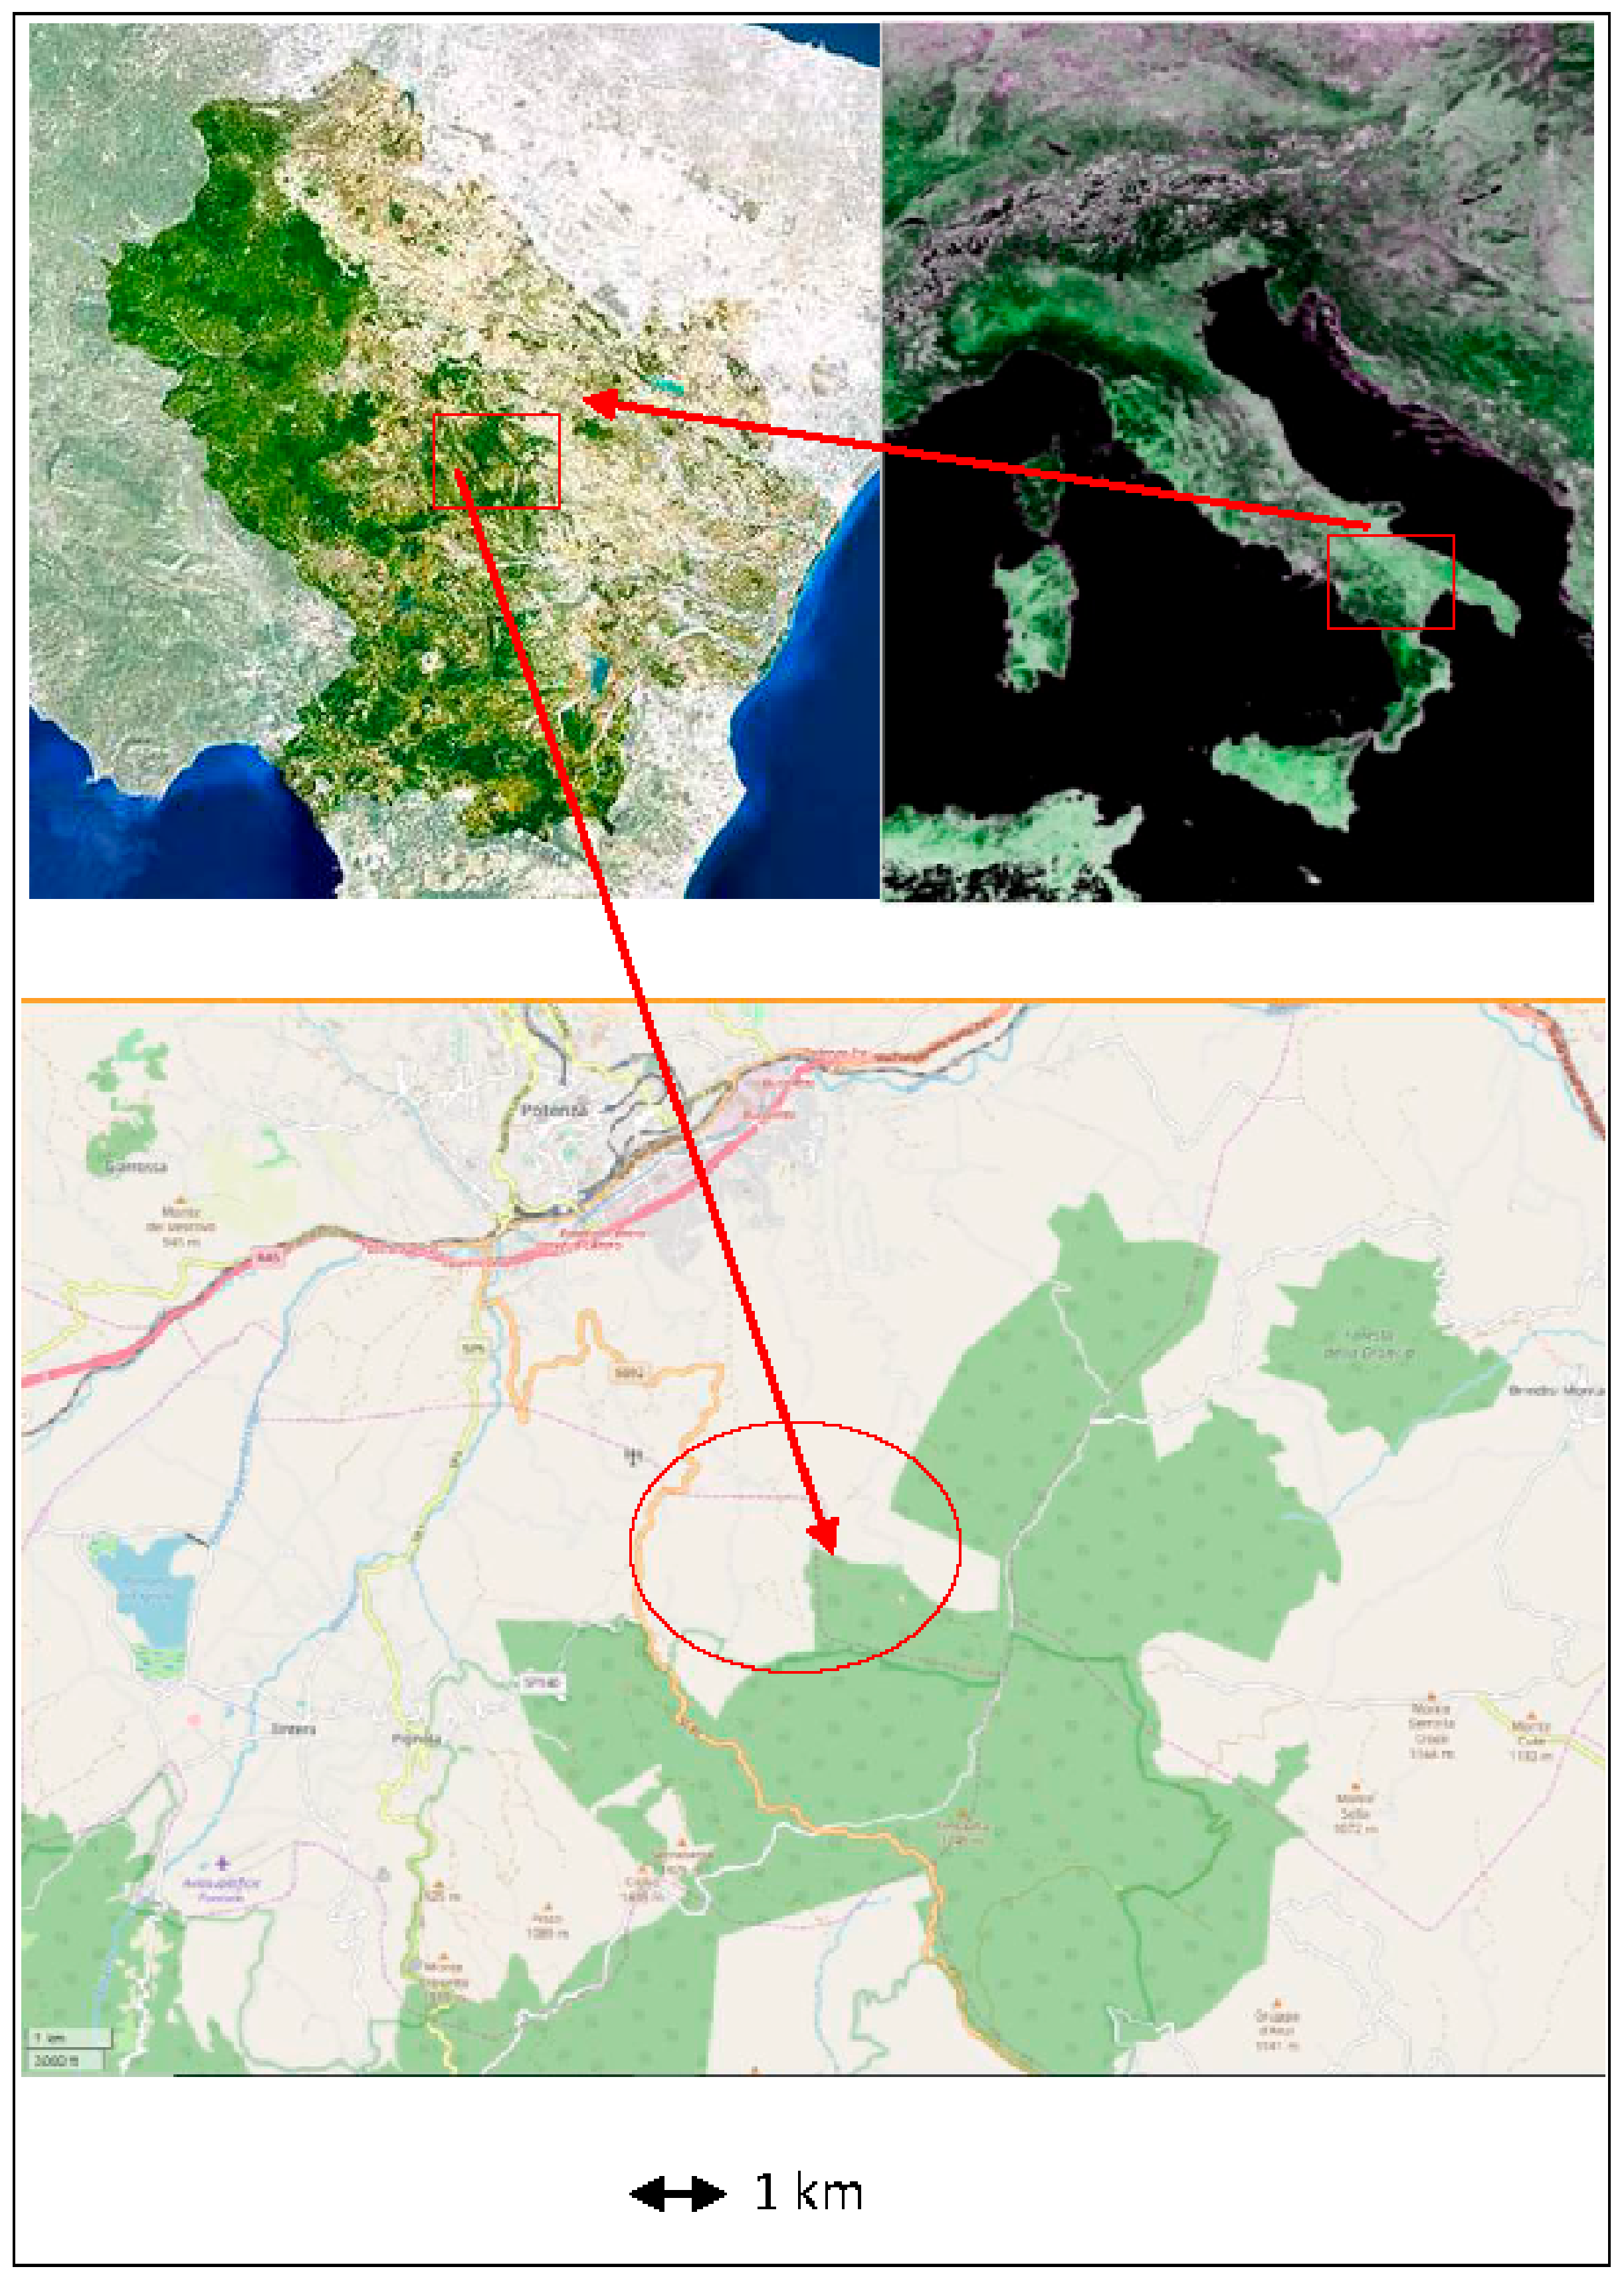
The analysis was performed at a test site close to the town of Potenza (Basilicata region) in southern Italy, as shown in Figure 1. The Basilicata region has 131 municipalities, scattered over an area of about 9992 km2 with approximately 587,517 inhabitants and, therefore, is one of the most sparsely populated regions of Italy. The two provinces Potenza and Matera (each with around 70,000 inhabitants) are the biggest urban areas.
For the purpose of our analysis, we considered a fire event that occurred close to Potenza on 10 August 2017, affecting both agricultural land and a protected natural area (on the Natura2000 list) that covers approximately 175 hectares.
The protected area is characterized by woodland made up mainly of Fagus sylvatica, Ilex aquifolium and Arum cylindraceum, with the presence of Quercus cerris and a new implantation of Abies alba and shrubland. Particularly relevant is the presence of Acer cappadocicum subsp. lobelii, Acer opalussubsp. obtusatum, Arum cylindraceum, Euphorbia coralloides, Lathyrus digitatus, Lathyrus jordanii, and Malus fiorentina Galanthus nivalis Ruscus aculeatus.
Several ornithic communities have been recorded, in particular the subendemic species of the Dendrocopos medium and doves such as Milvus milvus. The presence of Ficedula albicollis is particularly important as it is considered to have been dramatically reduced in Italy due to the use of insecticides and fertilizer, as mentioned in Annex I to Directive 79/409/Environment and European Commission (EEC) and Directive 2009/147/EC and International Union for Conservation of Nature (IUCN) 2010 list, which attests the high natural value of the area.
Among the amphibians present in the area, we note the Salamandrina terdigitata, monotype, endemic entity of the Italian Apennine, listed as a vulnerable species on the IUCN, (Annexes II and IV of Directive 92/43 EEC, Annex II of the Berne Convention and the red list of Italian amphibians) and the Italic included in Annex IV to Directive 92/43 EEC and Annex III to the Berne Convention. Although not in immediate danger, it is a highly specialized species that suffers detriment as a result of the loss of water quality and is therefore an excellent bio-indicator. Among the reptiles, the presence of Elaphe quatuorlineata is quite relevant as it is particularly rare in Italy and is in regression throughout the whole European territory, (included in Annexes II and IV of Directive 92/43 EEC and in Annex II to the Berne Convention).
2.2. Method
The remote sensing of burned areas has traditionally been based on optical data and carried out using vegetation indices (see for example [4,5,6,7,8,9,10,11,12,13,14,15,16,17]) that are a spectral combination of diverse bands, devised to emphasize the spectral changes caused by fire on vegetation in the short- and long-term. The vegetation indices operate by contrasting intense chlorophyll pigment absorption in the red (RED in Equation (1)) against the high reflectance of leaf mesophyll in the most commonly used spectral channels for vegetation monitoring at near infrared (NIR in Equation (1)) and shortwave (SWIR in Equation (2)). The simplest form of vegetation index is simply a ratio between two digital values from these two spectral bands. The most widely used index is the well-known normalized difference vegetation index (NDVI), computed using Equation (1):
NDVI = [NIR − RED]/[NIR + RED]
The normalization of the NDVI reduces the effects of the variations caused by atmospheric contamination. High vegetation index values identify pixels covered by substantial proportions of healthy vegetation. The NDVI is indicative of plant photosynthetic activity and has been found to be related to the green leaf area index and the fraction of photosynthetically active radiation absorbed by vegetation. Therefore, variations in the NDVI values become indicative of variations in vegetation composition and dynamics. More recently, the normalized burn ratio (NBR) computed as the normalized difference between the NIR and SWIR bands (Equation (2) showed) has been considered particularly effective in estimating fire effects on vegetation, as, for example, experienced in [17].
NBR = (NIR − SWIR)/(NIR + SWIR)
The NBR is particularly sensitive to changes in the amount of live green vegetation, moisture content, and soil conditions that occur after fire. For the purpose of our analysis, we used the delta NBR (ΔNBR) computed as the difference between the NBR maps obtained before and after the fire (Equation (3)).
ΔNBR= NBRprefire − NBRpostfire
The ΔNBR is expected to perform better at capturing fire patterns especially if it is jointly used with statistical indicators, as in [17].
Therefore, in this study, the ΔNBR was used as it is expected to perform better than NBR in capturing the spatial complexity of fire-induced features and patterns (see [11]). It is expected that the ΔNBR maps should highlight burnt areas, characterize burn severity levels, and provide indications of the changes induced by fire in terms of biomass loss, carbon release, and smoke production. Table 1 shows the different ranges of ΔNBR values suggested by the United States Geological Survey (USGS) to categorize burn severity.
Nevertheless, it must be highlighted that the use of fixed threshold values is generally not suitable for fragmented landscapes (as in the case of our study area) and are inadequate for vegetation types and geographic regions different to those for which they were devised. Fixed threshold values cannot adequately inform us about the effects of fire on plants that vary significantly within the same fire perimeter due to the fuel types and distribution (in the study site, both protected woodland and agricultural areas were present), fire behavior, fire residence time, and heat rate, which altogether affect the level of damage that the plants suffer. To overcome this drawback, one of the most effective approaches, specifically designed to map burned areas (as in [17]), is based on the use of statistical analysis computed using Getis and Ord to enhance fire severity levels.
In this paper, the most common statistical analyses Moran, Getis–Ord and Geary were applied to ΔNBR in order to compare and assess their performance. There were many indicators of spatial autocorrelation generally denoted as: global indicators and local indicators, the latter are more suitable to identify second-order effects. Global statistics inform us (by a single value) about the magnitude of autocorrelation for the whole region under investigation. The local statistics inform us about local clusters and rely on the distance information captured in the distance matrix. These indicators measure if and how much the dataset is auto-correlated on the basis of the distance used to define the neighborhood of a given region. For digital images, global indicators provide one value for the whole image to indicate the magnitude of the spatial association, whereas the local indicators provide a new image with an autocorrelation value for each pixel. Therefore, local indicators are able to identify discrete spatial patterns that may not otherwise be apparent from global statistics. The output of local indicators is an image that provides, for each calculated index, a measure of autocorrelation around that pixel.
The Moran’s index I (Moran 1948) is defined in Equation (4) and is actually one of the principal global indicators of autocorrelation:
where N is the total pixel number, Xi and Xj are the intensity in points i and j (with i ≠ j), is the average value, wij is an element of the weight matrix.
I ∈ [−1; 1]; if I ∈ [−1; 0) there is a negative autocorrelation; if I ∈ (0; 1] there is positive autocorrelation.
Theoretically, if I converges to 0 there is null autocorrelation, in most of the cases, instead of 0, the value used to affirm the presence of null autocorrelation is given by Equation (5):
where N is the number of events in the whole distribution.
The second global indicator of spatial autocorrelation is Geary’s C (Geary 1954), expressed by Formula (6):
where symbols have the same meaning as in Equation (1).
C ∈ [0; 2]; if C ∈ [0; 1) there is positive autocorrelation; if C(0; 2] there is negative autocorrelation; if C ∈ converges to 1 there is null autocorrelation.
The most common local indicators of spatial autocorrelation see [18], denoted as LISA, are: local Moran’s I (Anselin 1995), local Geary’s C (Cliff and Ord 1981), and Getis–Ord local Gi (Getis and Ord 1992; Illian et al. 2008). The local Moran’s I index is defined according to Equation (7).
Local Geary’s C Index is defined according to Equation (8).
Getis and Ord’s Gi is defined according to Equation (9).
Such geo-statistical analysis tools are available in several open source tools (R for example) as well as in commercial software, ranging from Geographic Information System (GIS) to image processing software.
For digital images, the global indicators provide one value for the whole image to indicate the magnitude of the spatial association, whereas the local indicators provide a new image with a value of the autocorrelation for each pixel. Therefore, local indicators are able to identify discrete spatial patterns that may not be apparent from global statistics. These indicators show a different concept of spatial association:
- (1)
- Local Moran’s I: a high value of the index means positive correlation both for high values and for low values of intensity;
- (2)
- Local Geary’s C: detects areas of dissimilarity between events;
- (3)
- Getis and Ord’s Gi: a high value of the index means positive correlation for high values of intensity, while a low value of the index means positive correlation for low values of intensity.
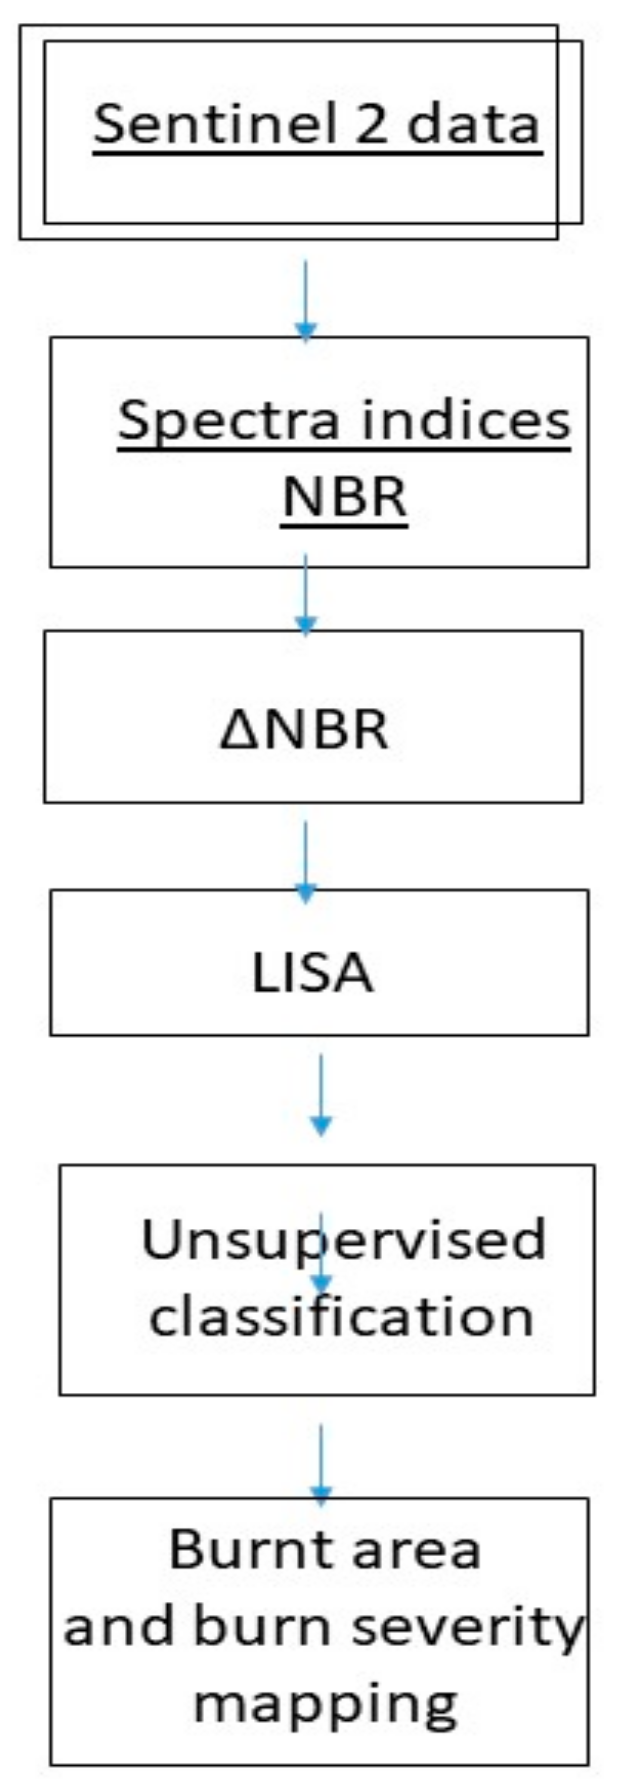
In this paper, we qualitatively compared the ΔNBR maps and the classification from the different LISA indices obtained using unsupervised classification, in order to categorize the burn severity levels without using fixed thresholds. A number of unsupervised classification algorithms are commonly used in remote sensing, including K-means clustering, and the iterative self-organizing data analysis technique (ISODATA). These are quite similar, even if ISODATA is considered more flexible compared to the K-means method, but requires the empirical selection of many more parameters. For this reason, in this study we used the K-means algorithm. The Flow chart of data processing is shown in Figure 3.
3. Results
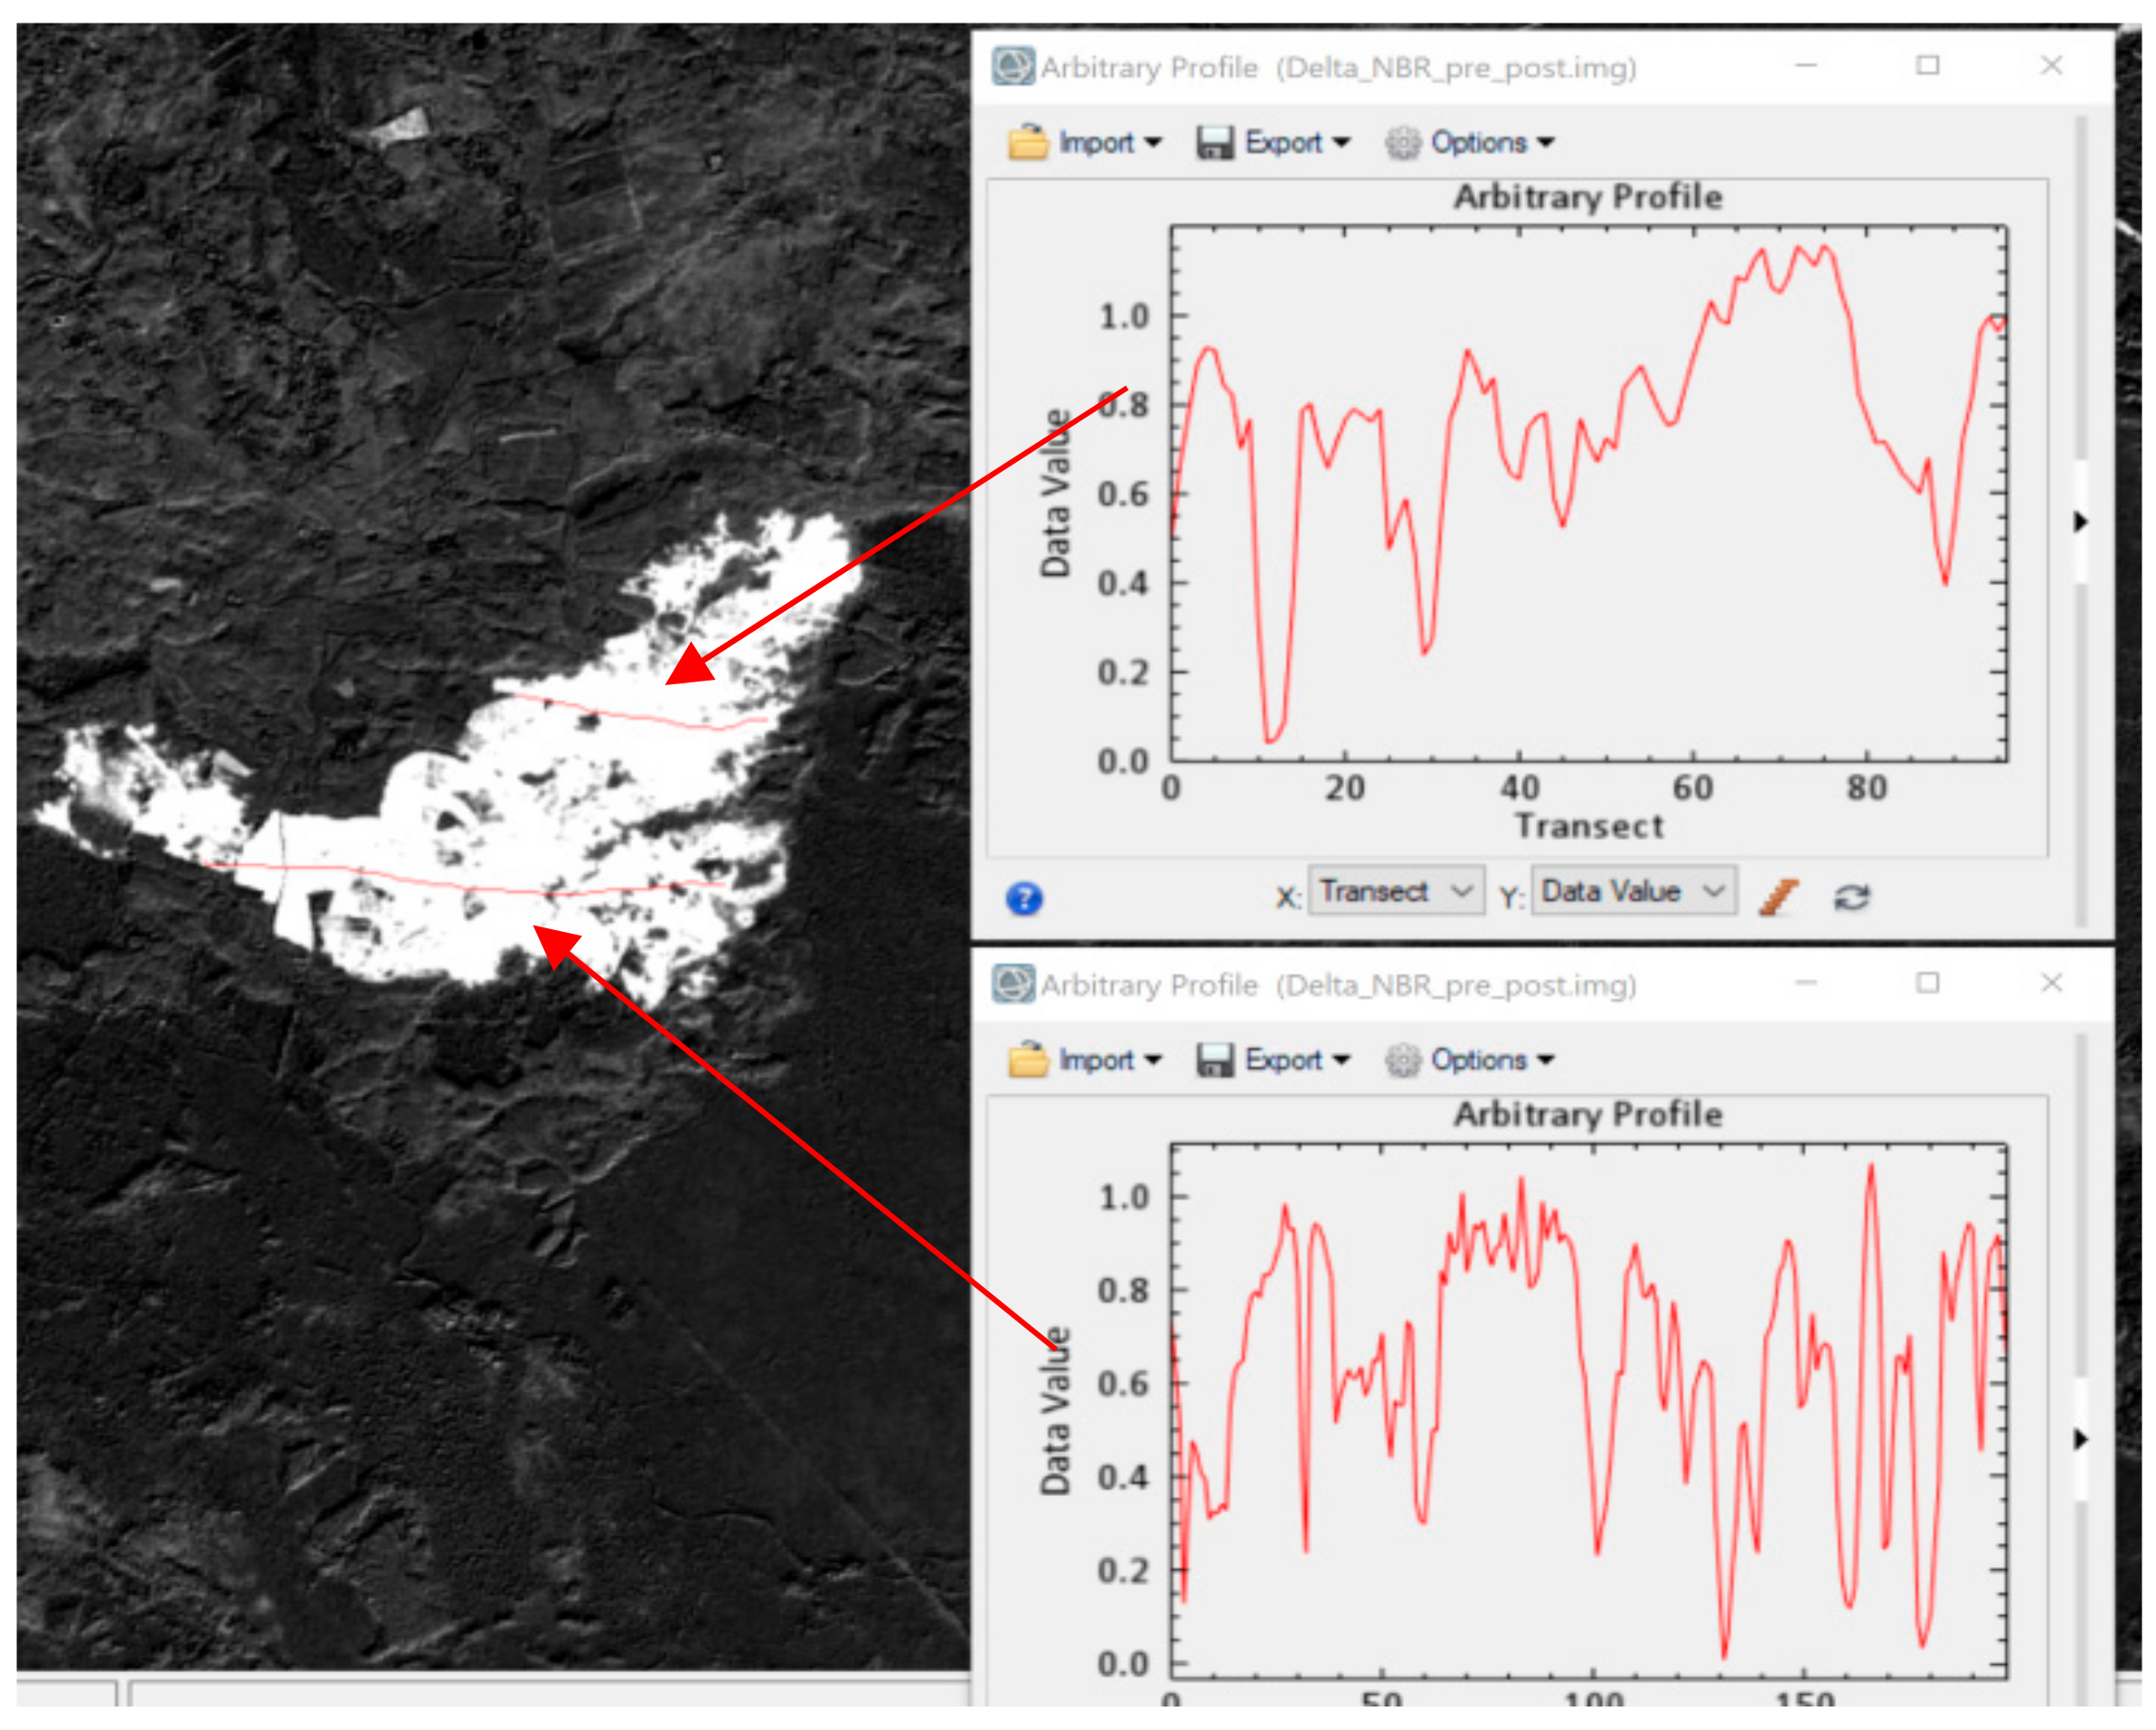
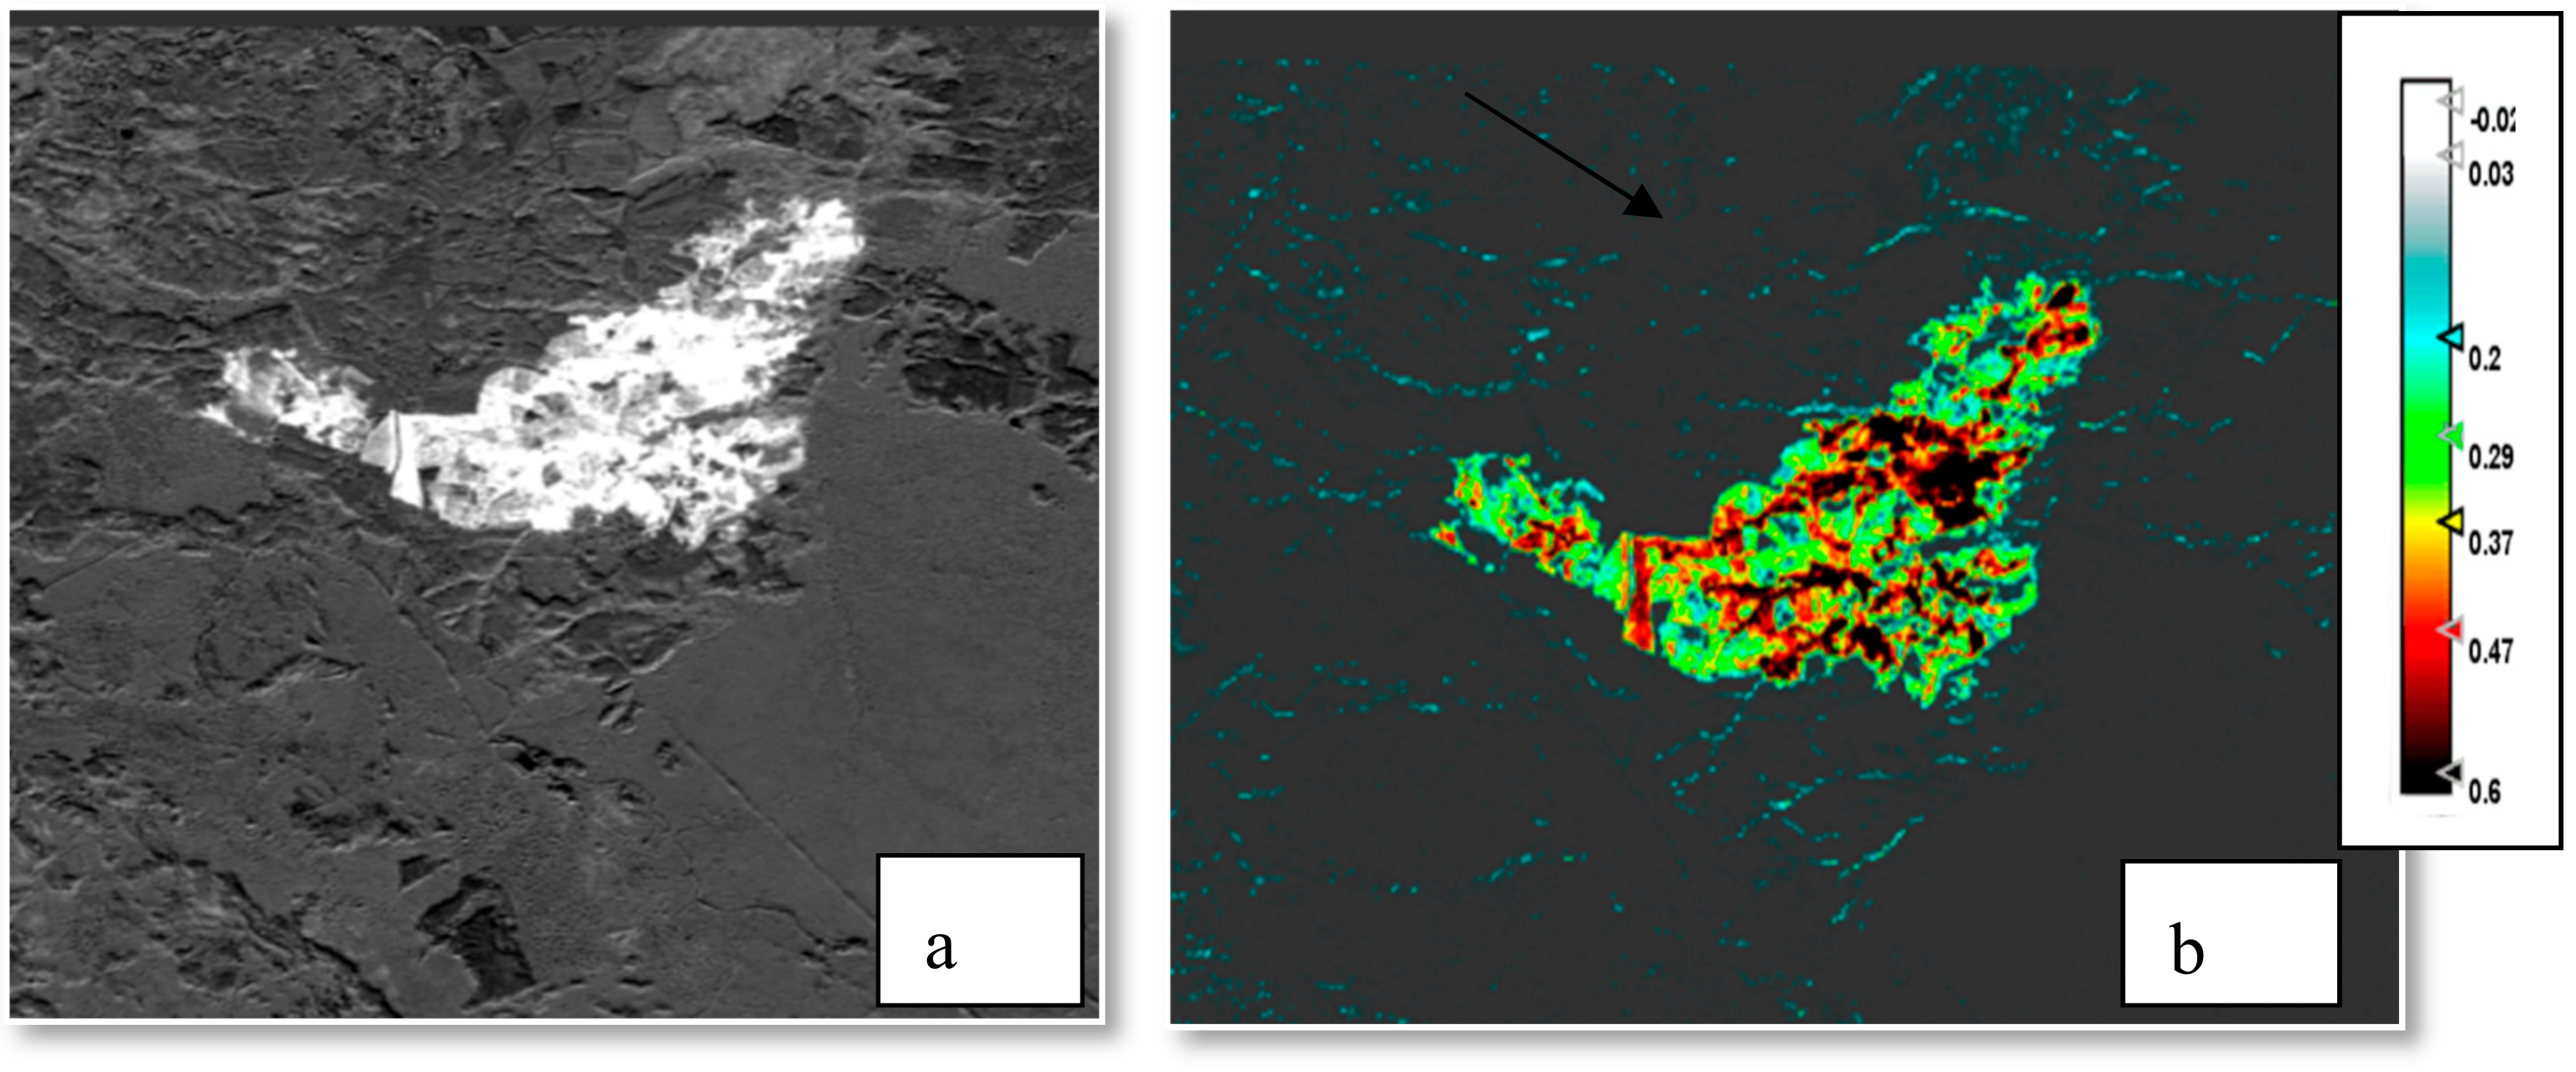
For the purpose of our investigation, we first analyzed a satellite-based ΔNBR map obtained from the difference between the pre- and post-fire index (from Sentinel 2 images acquired on 6 August 2018 and on 18 August 2018, respectively). The results from the satellite-based analyses were compared with an in situ survey conducted immediately after the fire occurrence. Figure 4 shows the ΔNBR and two profiles showing the spatial variation of the ΔNBR index values along the two plots indicated by the red lines on the right side of Figure 4. To make the interpretation of the ΔNBR values easier, the reader is referred to Table 1 and Figure 5b, which shows the diverse ΔNBR burn severity classes according to the USGS categorization.
The joint analysis of Figure 4 and the two plots (related to the transects in the red lines) clearly highlights that the effects of fire on plants vary significantly inside the fire perimeter due to the specific characteristics of the fire-affected area, the vegetation cover in term of type and status, and the fire behavior itself. Nevertheless, the joint analysis of Table 1 and Figure 4 and Figure 5 clearly show that according to the USGS categorization the whole area was generally at moderate–high and high burn severity. In fact, the ΔNBR values in the range 0.44 to 0.66 are related to moderate–high burn severity and values bigger than 0.66 indicate a higher burn severity. Moreover, the cyan areas in Figure 5 are characterized by values between 0.1 to 0.27, which according to the USGS categorization should refer to a low-severity burn. This is not accurate and suggests the need to improve the classification, leaving out the erroneous areas not affected by fire but classified as low-severity.
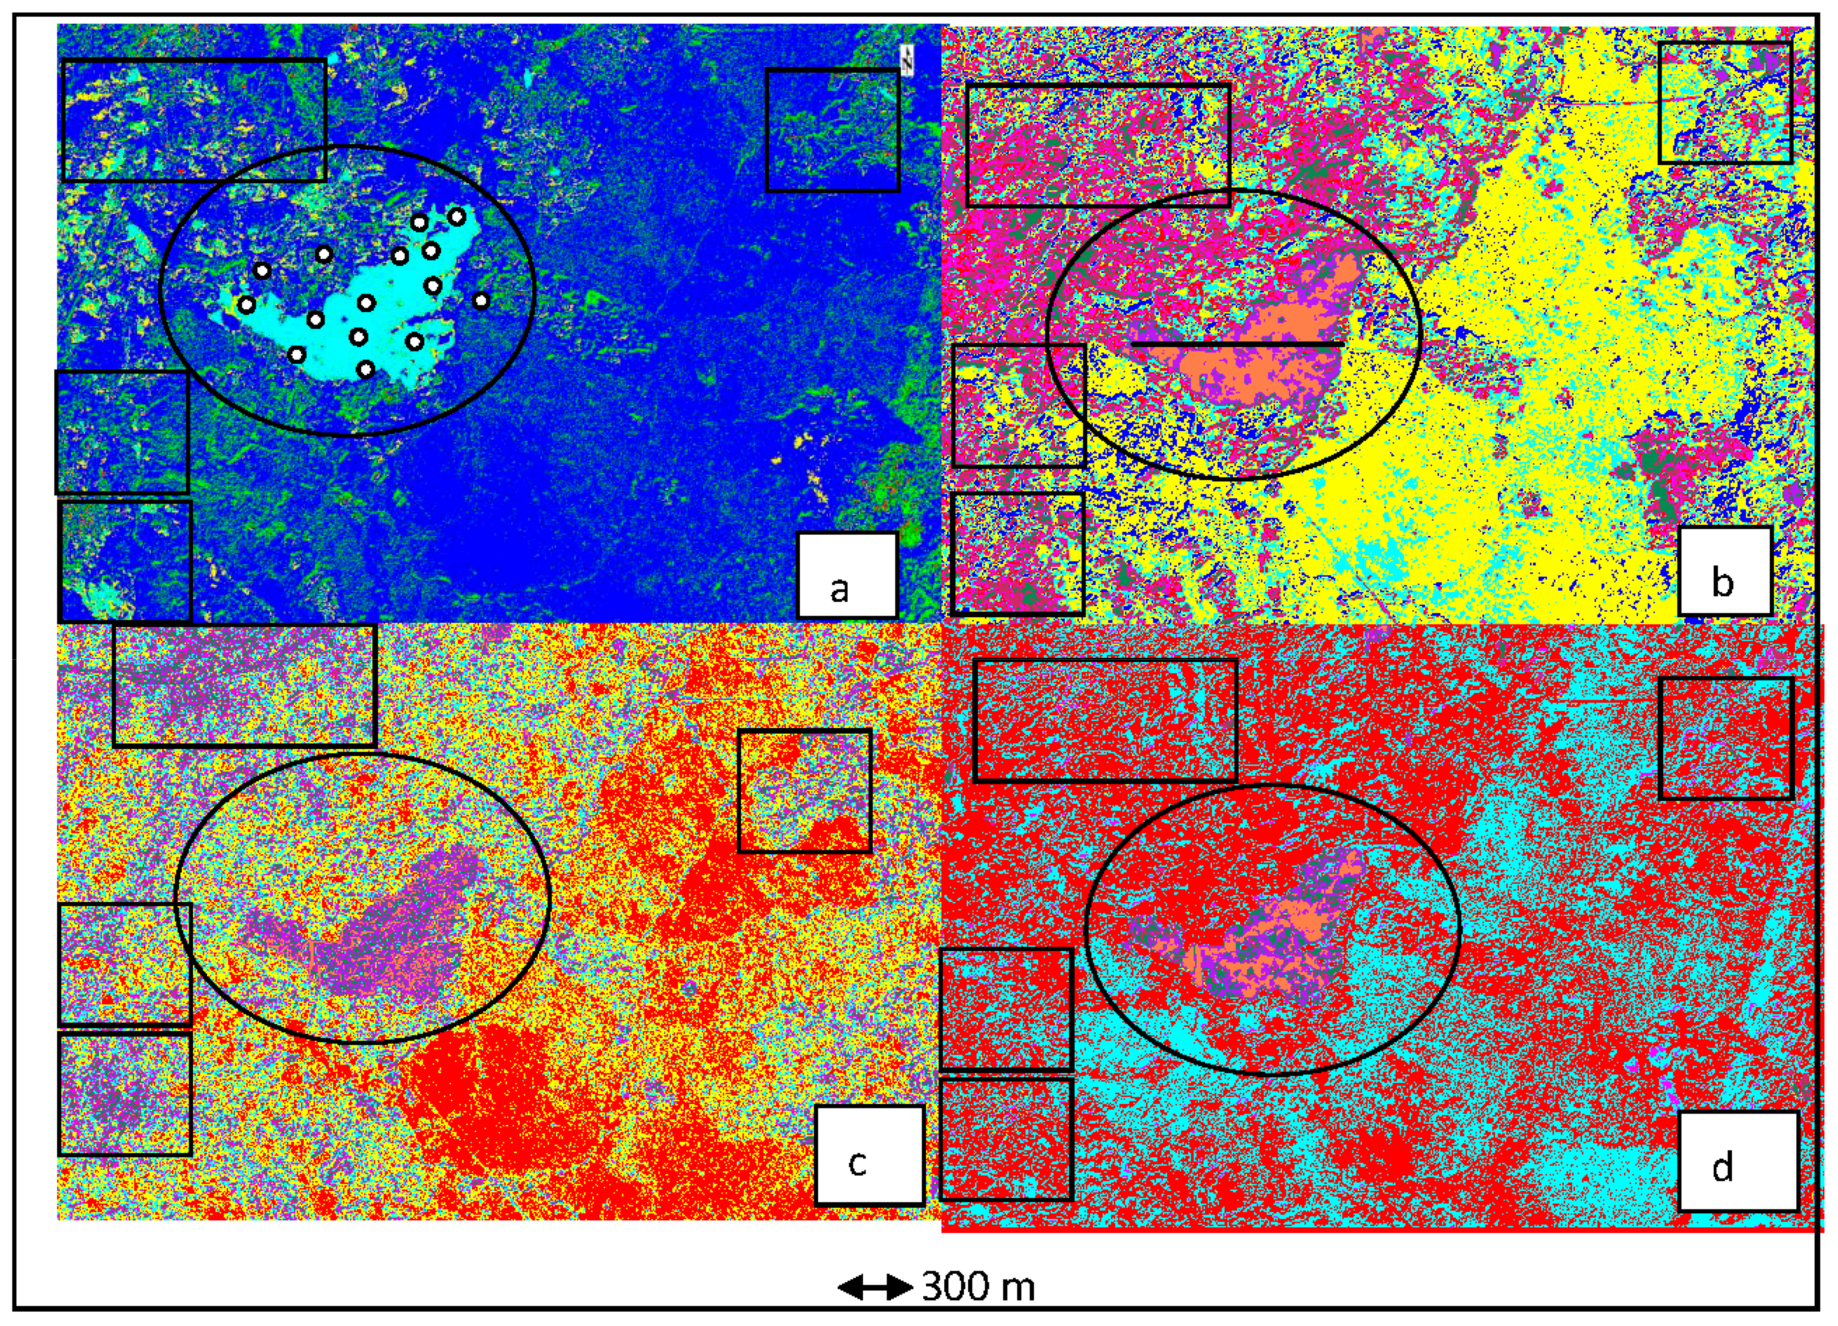
In order to assess whether it is possible to: (i) improve the USGS categorization; (ii) automatically discriminate fire-affected from unaffected areas; and (iii) categorize the different burn severity levels, an unsupervised classification based on K-means was applied to ΔNBR and to the outputs of LISA, Getis and Ord’s Gi, Geary and Moran obtained from ΔNBR (see Figure 6).
A comparison of the images in Figure 6 shows that the classification of the ΔNBR map (see Figure 6a) does not provide any discrimination among the diverse ΔNBR values and still provides commission errors classifying fire-affected areas as burnt areas (Figure 6a).
Following [17], significant improvements were expected from the classification of the LISA indicators shown in Figure 6b–d. The outputs from the classification of the Getis–Ord Gi, Geary (see Figure 6b,c) were not able to capture the burn severity and were also affected by commission errors. Moran (see Figure 6d) was able to better discriminate fire-affected from unaffected areas and to reliably characterize burn severity.
Moran was able to provide a reliable identification of burn severity linked with the vegetation cover types. For example (see Figure 6), the purple class is related to agricultural lands that are less vegetated than other areas, whereas the orange class is actually linked to natural vegetated areas that were much more affected by fire in terms of burn severity. Therefore, the agricultural lands were classified as lower (green areas) and very low (purple areas) burn severity, whereas the higher values generally occurred in woodlands and were classified as moderate burn severity according to the outputs from classification step. Therefore, our methodology coupled with field surveys enabled us to better characterize the burn severity degree that was overestimated by the USGS categorization. Overall, the Moran statistics of the ΔNBR were able (i) to well capture the differences in land cover of the study area characterized by high fragmentation and heterogeneity; and in turn (ii) to reliably characterize burn severity, as it is a function of the physical and ecological characteristics of the fire-affected area. The obtained results were successfully validated using field surveys that well fit with the satellite-based burn severity categorization (see Figure 7). This was assessed using 15 plots randomly selected from the in situ analysis extensively performed in the study area. The field survey showed a high rate of success of around 95% and a low percentage of both of commission errors and of omission errors (around 3% and 2%, respectively). These were mainly found in areas characterized by mixed land cover and land use types, i.e., pixels partially made up of agricultural areas and woodland, and/or fire-affected and unaffected pixels.
4. Discussion
In this paper, we presented and discussed a methodology developed in order to automatically map burned areas and burn severity, developed in the framework of the project SERV_FORFIRE “Integrated services and approaches for assessing the effects of climate change and extreme events for fire and post fire risk prevention”. (Project SERV_FORFIRE is part of the European Research Area for Climate Services ERA4CS, and European Research Area- NETwork ERA-NET initiated by JPI Climate). The approach devised herein was based on the joint use of: (i) satellite Sentinel 2 data, from which the spectral indices ΔNBR were computed to enhance fire-affected areas; (ii) statistical analysis based on LISA indices (Moran’s I, Geary’s C, and the Getis–Ord Local Gi index); and (iii) automatic unsupervised classification. The LISA and unsupervised classification steps were included in order to overcome the limits of using fixed threshold values that provide the misclassification of both the burnt area and the burn severity degree. The methodology we devised, coupled with the field survey, enabled us to better characterize the burn severity degrees that were overestimated by the USGS categorization (see Figure 5 and Figure 7).
The main improvement obtained from LISA was the fact that: (i) Moran was able to provide a reliable identification of burn severity linked with the vegetation cover types; and (ii) it enabled the automatic classification of the fire severity in a more general manner as it is based on the statistical analysis of the spatial distribution of the ΔNBR. As a whole, the approach herein proposed enabled the automatic categorization of different burn severity levels without using fixed threshold values, and therefore it can be more easily re-applied to diverse ecosystems and geographic regions.
The methodology we proposed is “stand alone” and does not require the use of land use or land cover maps. Our findings indicated that the use of Sentinel 2 data does allow us to develop standardized burn-severity maps to evaluate fire effects and address post-fire management activities and post-fire restoration strategies according to the magnitude of the damage and the condition of the affected site.
The use of LISA enabled us to capture the diverse burn severity levels without the need to have a land use land cover map, which is often not available at the same spatial resolution as Sentinel 2, but with lower details (as for example in [19,20,21]) on thermal information [22].
Managers need to be aware of the impacts that fire can have on soil systems, and how these impacts can lead to undesired changes in site productivity, sustainability, biological diversity, and watershed hydrological response. For this reason, reliable and qualified information on fire-affected areas and burn severity (and expected changes) is crucial to mitigate post-fire damage and optimize strategies related to post-fire damage management. Fire represents one of the main disturbances to Mediterranean ecosystems, causing profound transformations at different temporal and spatial scales, including vegetation cover, landscape, ecosystems, soils, etc. In order to limit fire damage, fire agencies need to have effective decision support tools able to provide timely information. In this context, remote sensing techniques can provide very important information and tools supporting fire risk monitoring and mitigation.
Today a lot of active and passive satellite and aerial sensors provide useful data for the diverse phases of fire monitoring from risk estimation to the identification of mitigation strategies. The full exploitation of the data provided by diverse sensors can easily be integrated with all the available information (in the digital and non-digital format) within a GIS environment to also facilitate the elaboration, exploitation and publication of heterogeneous data sources in operational contexts.
Today it is well recognized that for a sustainable future the protection and preservation of natural resources and landscapes can be usefully supported by satellite data, in particular those provided by the Sentinel missions. The methodology herein proposed, developed for Sentinel 2 data, is expected to also provide improvements for other applications such as, for example, land use and land cover classification, as in [23], especially that addressing the monitoring of rural and urban development in order to assess: (i) the growth processes and effects of urban policies on the development of urban areas [24]; (ii) the spatial/temporal analysis of the urban–rural gradient structure [25]; (iii) urban fragmentation at the regional scale [26]; and (iv) trends of land use/land cover [27] and their potential impact on natural resources and the environment.
Author Contributions
Conceptualization, R.L. and L.G.; Data curation, R.L., B.T. and L.G.; Formal analysis, R.L.; Funding acquisition, R.L.; Investigation, R.L.; Methodology, R.L.; Project administration, R.L.; Resources, R.L.; Software, R.L.; Supervision, R.L.; Validation, R.L.; Visualization, R.L.; Writing—original draft, R.L.; Writing—review & editing, R.L. and L.G.
Funding
This research was funded by EU Grant 690462 I the framework of SERV_FORFIRE project.
Acknowledgments
The activities were carried out within the project SERV_FORFIRE “Integrated services and approaches for assessing effects of climate change and extreme events for fire and post-fire risk prevention” [28]. Project SERV_FORFIRE is part of ERA4CS, an ERA-NET initiated by JPI Climate, and funded by FORMAS (SE), DLR (DE), BMWFW (AT), IFD (DK), MINECO (ES), ANR (FR) with co-funding by the European Union (Grant 690462). The investigations were performed jointly with the Protezione Civile of the Basilicata Region. Special thanks to Guido Loperte for the support and data.
Conflicts of Interest
The authors declare no conflicts of interest.
References
- Sustainable Development. Available online: https://sustainabledevelopment.un.org/topics/index.php?menu=1483 (accessed on 25 October 2018).[Green Version]
- Fire and Post-Fire Management. Available online: http://www.fao.org/forestry/firemanagement/en/ (accessed on 25 October 2018).
- Sentinel Data User Guide. Available online: https://sentinels.copernicus.eu/web/sentinel/user-guides/document-library/-/asset_publisher/xlslt4309D5h/content/sentinel-2-user-handbook (accessed on 25 october 2018).
- Lasaponara, R. On the use of principal component analysis (PCA) for evaluating interannual vegetation anomalies from SPOT/VEGETATION NDVI temporal series. Ecol. Model. 2006, 194, 429–434. [Google Scholar] [CrossRef]
- Lentile, L.B.; Holden, Z.A.; Smith, A.M.S.; Falkowski, M.J.; Hudak, A.T.; Morgan, P.; Lewis, S.A.; Gessler, P.E.; Benson, N.C. Remote sensing techniques to assess active fire characteristics and post-fire effects. Int. J. Wildland Fire 2006, 15, 319–345. [Google Scholar] [CrossRef]
- Fernández-Manso, A.; Fernández-Manso, O.; Quintano, C. SENTINEL-2A red-edge spectral indices suitability for discriminating burn severity. Int. J. Appl. Earth Obs. Geoinf. 2016, 50, 170–175. [Google Scholar] [CrossRef]
- Hall, J.V.; Loboda, T.V.; Giglio, L.; McCarty, G.W. A MODIS-based burned area assessment for Russian croplands: Mapping requirements and challenges. Remote Sens. Environ. 2016, 184, 506–521. [Google Scholar] [CrossRef]
- Quintano, C.; Fernández-Manso, A.; Fernández-Manso, O. Combination of Landsat and Sentinel-2 MSI data for initial assessing of burn severity. Int. J. Appl. Earth Obs. Geoinf. 2018, 64, 221–225. [Google Scholar] [CrossRef] [Green Version]
- Zhang, T.; Wooster, M.J.; de Jong, M.C.; Xu, W. How well does the ‘small fire boost’ methodology used within the GFED4.1s fire emissions database represent the timing, location and magnitude of agricultural burning? Remote Sens. 2018, 10, 823. [Google Scholar] [CrossRef]
- Çolak, E.; Sunar, A.F. Remote sensing & GIS integration for monitoring the areas affected by forest fires: A case study in Izmir, Turkey. Int. Arch. Photogramm. Remote Sens. Spat. Inf. Sci. 2018, 42, 165–170. [Google Scholar]
- Pepe, M.; Parente, C. Burned Area Recognition by Change Detection Analysis Using Images Derived from Sentinel-2 Satellite: The Case Study of Sorrento Peninsula, Italy. J. Appl. Eng. Sci. 2018, 16, 225–232. [Google Scholar] [CrossRef]
- Engelbrecht, J.; Theron, A.; Vhengani, L. A normalised difference alpha-angle approach to burn scar extraction on multiple-polarisation Sar data. In Proceedings of the International Geoscience and Remote Sensing Symposium (IGARSS), Fort Worth, TX, USA, 23–28 July 2017; pp. 4274–4277. [Google Scholar]
- Martinis, S.; Caspard, M.; Plank, S.; Clandillon, S.; Haouet, S. Mapping burn scars, fire severity and soil erosion susceptibility in Southern France using multisensoral satellite data. In Proceedings of the International Geoscience and Remote Sensing Symposium (IGARSS), Fort Worth, TX, USA, 23–28 July 2017; pp. 1099–1102. [Google Scholar]
- Guerrero, A.; Pineda, L.; Palà, V.; Corbera, J. Severity study in Albinyana (Catalunya) forest fire, using SENTINEL-2 data [Estudio de Severidad en el incendio de Albinyana (Catalunya) a partir de datos SENTINEL-2] (2017). Rev. Teledetecc. 2017, 49, 115–121. [Google Scholar] [CrossRef]
- Chu, T.; Guo, X. Remote sensing techniques in monitoring post-fire effect sand patterns of forest recovery in boreal forest regions: A review. Remote Sens. 2014, 6, 470–520. [Google Scholar] [CrossRef]
- Navarro, G.; Caballero, I.; Silva, G.; Parra, P.-C.; Vázquez, Á.; Caldeira, R. Evaluation of forest fire on Madeira Island using Sentinel-2A MSI imagery. Int. J. Appl. Earth Obs. Geoinf. 2017, 58, 97–106. [Google Scholar] [CrossRef]
- Lanorte, A.; Danese, M.; Lasaponara, R.; Murgante, B. Multiscale mapping of burnt area and severity using multisensor satellite data and spatial autocorrelation analysis. Int. J. Appl. Earth Obs. Geoinf. 2013, 20, 42–51. [Google Scholar] [CrossRef]
- Anselin, L.; Syabri, I.; Kho, Y. GeoDa: An Introduction to Spatial Data Analysis. Geogr. Anal. 2006, 38, 5–22. [Google Scholar] [CrossRef] [Green Version]
- Balacco, G.; Figorito, B.; Tarantino, E.; Gioia, A.; Iacobellis, V. Space-time LAI variability in Northern Puglia (Italy) from SPOT VGTdata. Environ. Monitor. Assess. 2015, 187, 434. [Google Scholar] [CrossRef] [PubMed]
- Trombetta, A.; Iacobellis, V.; Tarantino, E.; Gentile, F. Calibration of the AquaCrop model for winter wheat using MODIS LAIimages. Agric. Water Manag. 2016, 164, 304–316. [Google Scholar] [CrossRef]
- Novelli, A.; Tarantino, E.; Fratino, U.; Iacobellis, V.; Romano, G.; Gentile, F. A data fusion algorithm based on the Kalman filter toestimate leaf area index evolution in durum wheat by using field measurements and MODIS surface reflectance data. Remote Sens. Lett. 2016, 7, 476–484. [Google Scholar] [CrossRef]
- Tarantino, E. Monitoring spatial and temporal distribution of Sea Surface Temperature with TIR sensor data. Ital. J. Remote Sens. 2012, 44, 97–107. [Google Scholar] [CrossRef]
- Modica, G.; Pollino, M.; Solano, F. Sentinel-2 Imagery for Mapping Cork Oak (Quercus suber L.) Distribution in Calabria (Italy): Capabilities and Quantitative Estimation. In New Metropolitan Perspectives. ISHT 2018. Smart Innovation, Systems and Technologies; Calabrò, F., Della Spina, L., Bevilacqua, C., Eds.; Springer: Cham, Switzerland, 2019; Volume 100, pp. 60–67. [Google Scholar]
- Amato, F.; Maimone, B.; Martellozzo, F.; Nolè, G.; Murgante, B. The effects of urban policies on the development of urban areas. Sustainability 2016, 8, 297. [Google Scholar] [CrossRef] [Green Version]
- Modica, G.; Vizzari, M.; Pollino, M.; Fichera, C.R.; Zoccali, P.; di Fazio, S. Spatio-temporal analysis of the urban–rural gradient structure: An application in a Mediterranean mountainous landscape (Serra San Bruno, Italy). Earth Syst. Dyn. 2012, 3, 263–279. [Google Scholar] [CrossRef]
- Saganeiti, L.; Favale, A.; Pilogallo, A.; Scorza, F.; Murgante, B. Assessing Urban Fragmentation at Regional Scale Using Sprinkling Indexes. Sustainability 2018, 10, 3274. [Google Scholar] [CrossRef]
- Di Fazio, S.; Modica, G.; Zoccali, P. Evolution Trends of Land Use/Land Cover in a Mediterranean Forest Landscape in Italy. In Computational Science and Its Applications—ICCSA 2011, Part I, Lecture Notes in Computer Science; Murgante, B., Gervasi, O., Iglesias, A., Taniar, D., Apduhan, B.O., Eds.; Springer: Cham, Switzerland, 2011; Volume 6782, pp. 284–299. [Google Scholar]
- ERA 4CS Climate Initiative. Available online: http://jpi-climate.eu/nl/25223459-SERV_FORFIRE.html (accessed on 25 October 2018).
Figure 1.
Location of the study area.

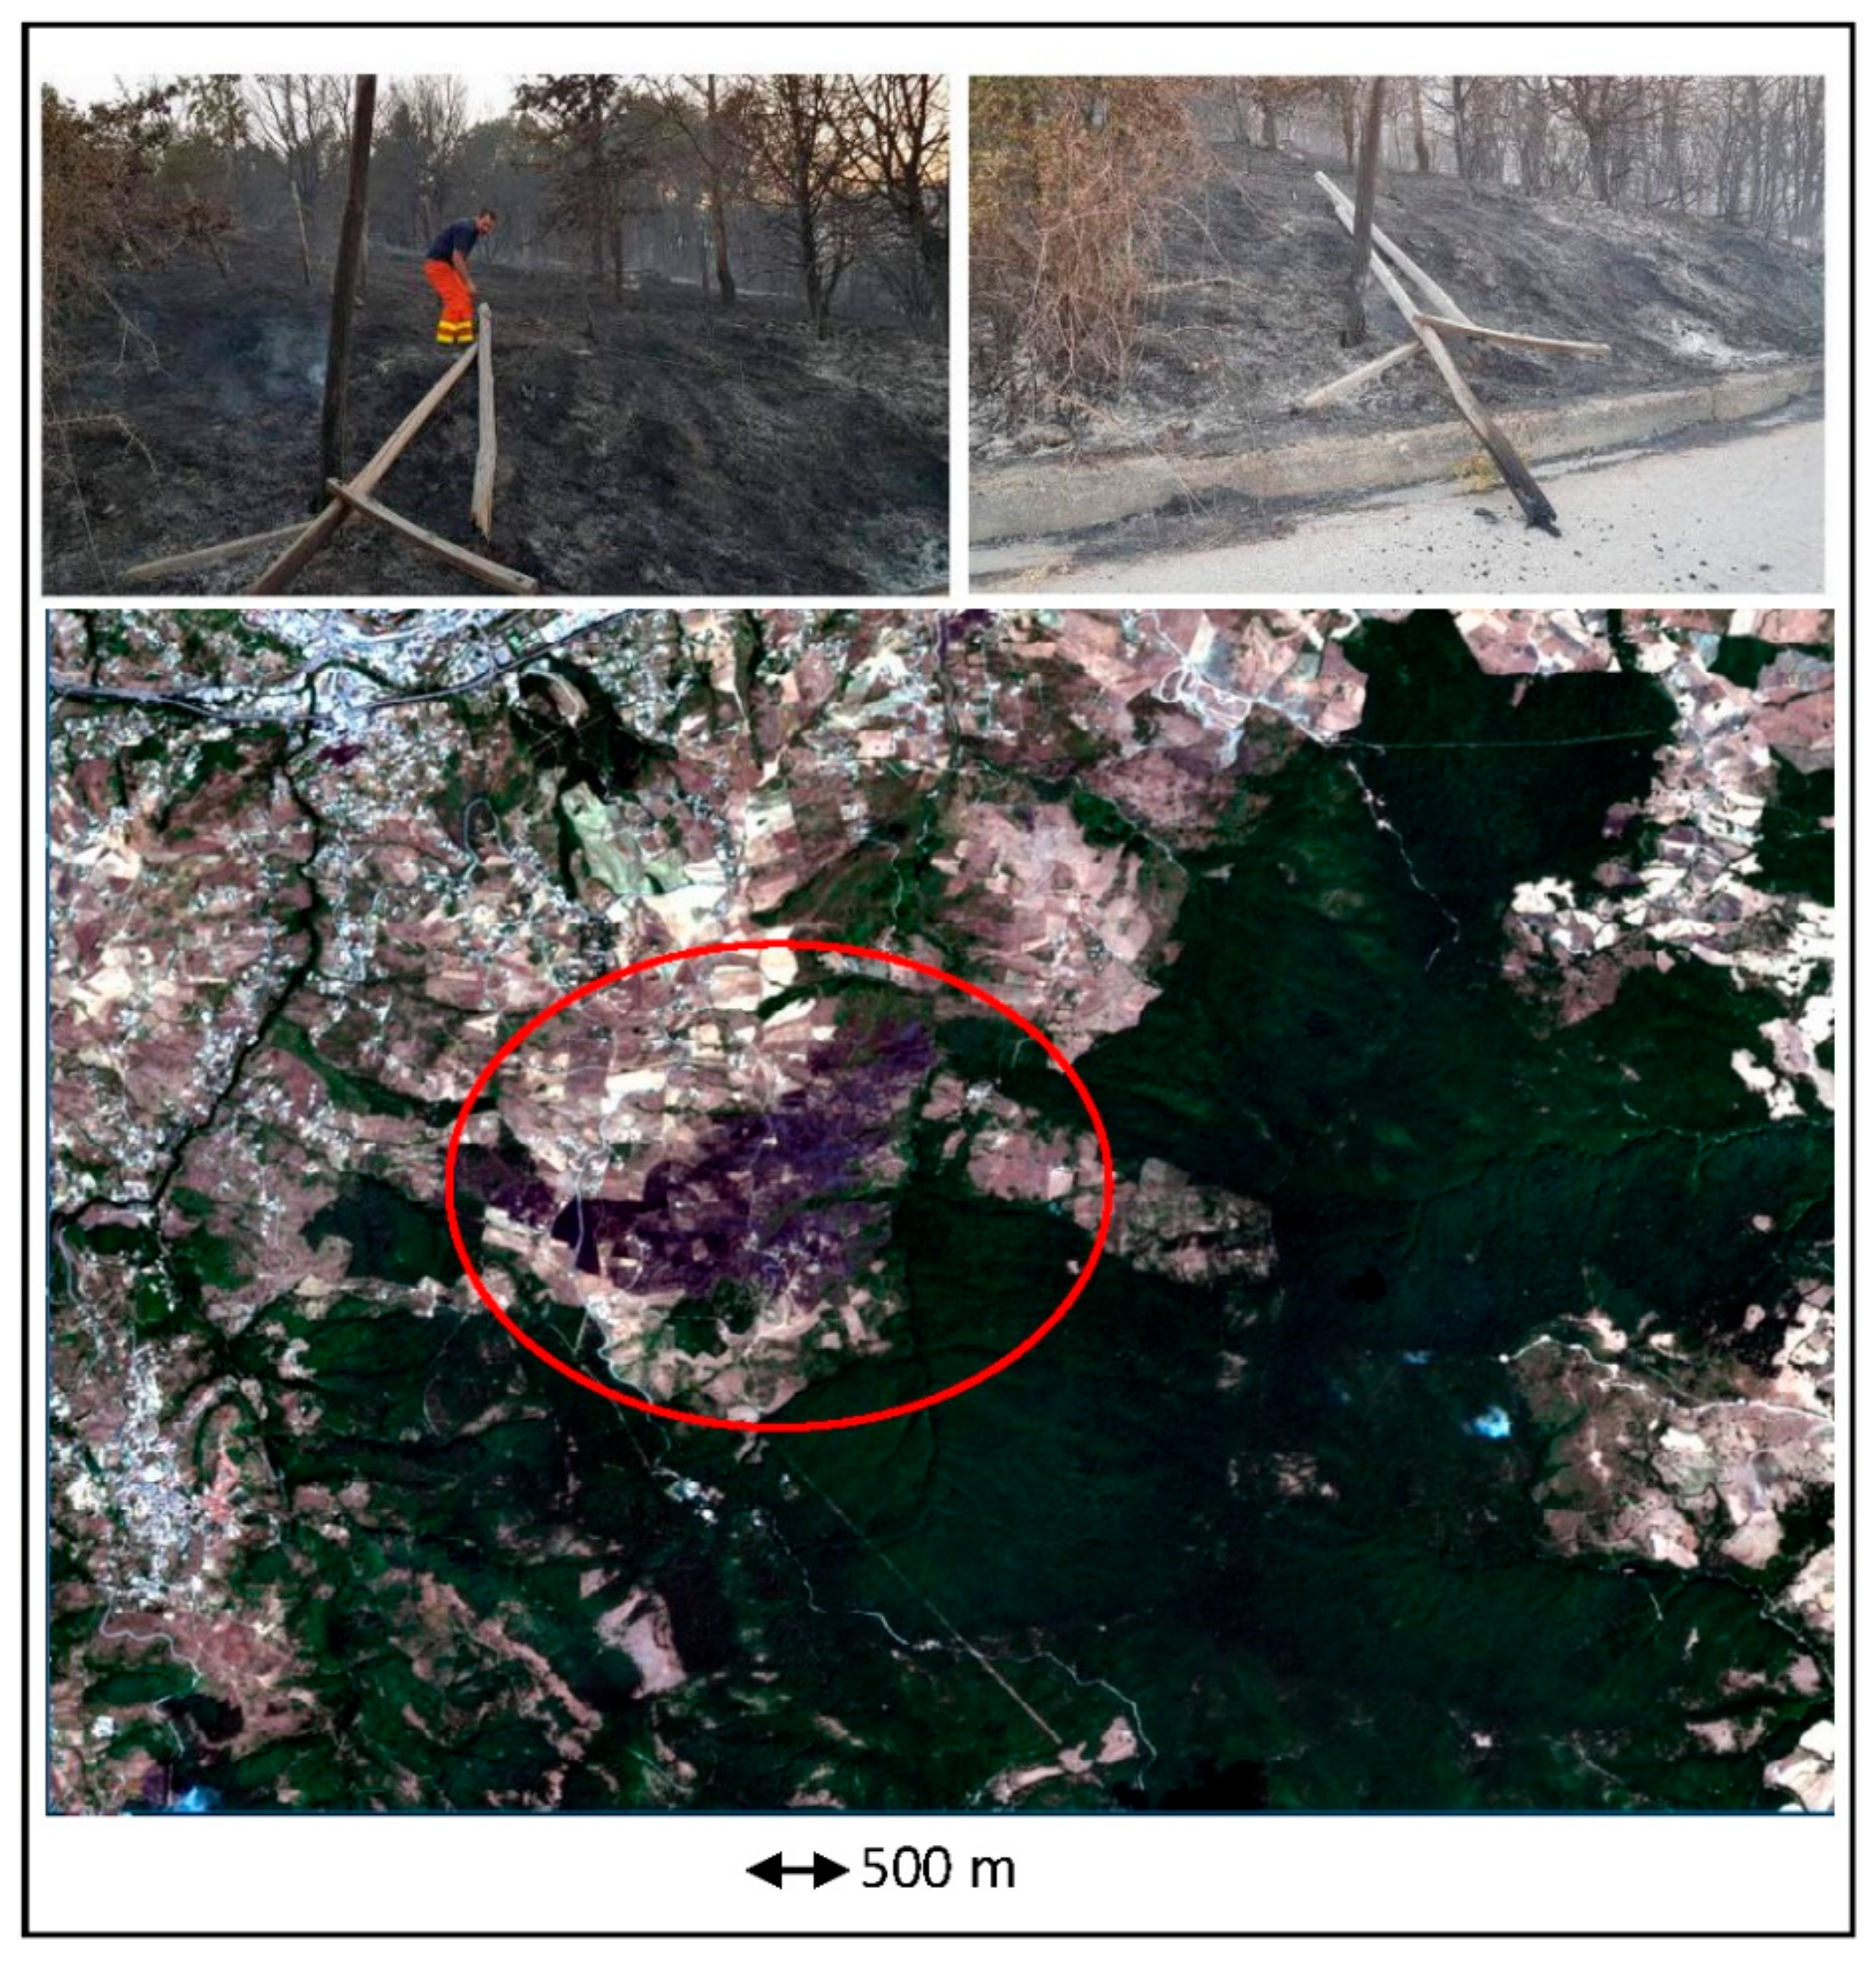
Figure 2.
Upper: Photographs from the study area as it was on 11 August 2017. Lower: red green blue (RGB) spectral channel composition of Sentinel 2, the purple area in the red circle is the site affected by fire on 10 August 2017.
Figure 2.
Upper: Photographs from the study area as it was on 11 August 2017. Lower: red green blue (RGB) spectral channel composition of Sentinel 2, the purple area in the red circle is the site affected by fire on 10 August 2017.

Figure 3.
Flow chart of data processing (made using ENVI software) for Sentinel 2 data downloaded free of charge from the ESA web site, as available in pre-processed format (from the calibration to the atmospheric correction, see [3]).
Figure 3.
Flow chart of data processing (made using ENVI software) for Sentinel 2 data downloaded free of charge from the ESA web site, as available in pre-processed format (from the calibration to the atmospheric correction, see [3]).

Figure 4.
ΔNBR maps obtained from the difference between the pre- and post-fire index (from Sentinel 2 images acquired on 6 August 2018 and 18 August 2018, respectively). On the right, the graphs show the ΔNBR values for the transects indicated in red by the arrows.
Figure 4.
ΔNBR maps obtained from the difference between the pre- and post-fire index (from Sentinel 2 images acquired on 6 August 2018 and 18 August 2018, respectively). On the right, the graphs show the ΔNBR values for the transects indicated in red by the arrows.

Figure 5.
ΔNBR (a) and its categorization (b) based on fixed thresholds from USGS (see Table 1).
Figure 5.
ΔNBR (a) and its categorization (b) based on fixed thresholds from USGS (see Table 1).

Figure 6.
Results of the K-means classifications applied (searching for 10 classes) to: ΔNBR (a); Getis–Ord Gi (b); Geary (c), and Moran (d). Small circles in (a) indicate the locations of field surveys conducted for the evaluation process. To facilitate the interpretation in (a–d), the big circles indicate fire-affected areas; the black rectangular boxes in (a–c) show the misclassification; whereas in (d) the Moran classification well discriminated the areas unaffected by fire marked in red and cyan from the zoomed in fire-affected area, which enhances the diverse fire severity degrees.

Figure 7.
Upper right: Google Earth image with the polygon showing the area affected by fire and the diverse surface conditions from woodland to agricultural areas. Upper left: K-means of the Moran ΔNBR maps and burn severity categorizations for (i) fire-affected (from moderate to very low as shown in the pictures from left to right); and (ii) fire-unaffected areas with changed and unchanged areas (classes). Lower: pictures from the in situ analysis conducted from 10–18 August 2017. The classes identified for the fire-unaffected areas were not significant because the only change (in land use and land cover) occurred in the period of observation (less than two weeks from 6–18 August) was related to the fire occurrence.


Table 1.
The ΔNBR burn severity categories, according to the USGS categorization.
| ΔNBR | Burn Severity |
|---|---|
| <−0.25 | High post-fire regrowth |
| −0.25–−0.1 | Low post-fire regrowth |
| −0.1–+0.1 | Unburned |
| 0.1–0.27 | Low-severity burn |
| 0.27–0.44 | Moderate–low severity burn |
| 0.44–0.66 | Moderate–high severity burn |
| >0.66 | High-severity burn |
© 2018 by the authors. Licensee MDPI, Basel, Switzerland. This article is an open access article distributed under the terms and conditions of the Creative Commons Attribution (CC BY) license (http://creativecommons.org/licenses/by/4.0/).
Share and Cite
MDPI and ACS Style
Lasaponara, R.; Tucci, B.; Ghermandi, L. On the Use of Satellite Sentinel 2 Data for Automatic Mapping of Burnt Areas and Burn Severity. Sustainability 2018, 10, 3889. https://0-doi-org.brum.beds.ac.uk/10.3390/su10113889
AMA Style
Lasaponara R, Tucci B, Ghermandi L. On the Use of Satellite Sentinel 2 Data for Automatic Mapping of Burnt Areas and Burn Severity. Sustainability. 2018; 10(11):3889. https://0-doi-org.brum.beds.ac.uk/10.3390/su10113889
Chicago/Turabian StyleLasaponara, Rosa, Biagio Tucci, and Luciana Ghermandi. 2018. "On the Use of Satellite Sentinel 2 Data for Automatic Mapping of Burnt Areas and Burn Severity" Sustainability 10, no. 11: 3889. https://0-doi-org.brum.beds.ac.uk/10.3390/su10113889
Note that from the first issue of 2016, this journal uses article numbers instead of page numbers. See further details here.