Comprehensive Evaluation of Regional Sustainable Development Based on Data Envelopment Analysis


1
School of Management Science and Engineering, Nanjing University of Information Science & Technology, Nanjing 210044, China
2
Institute of Climate Change and Public Policy, Nanjing University of Information Science & Technology, Nanjing 210044, China
3
China Institute of Manufacturing Development, Nanjing University of Information Science & Technology, Nanjing 210044, China
4
School of Marine Sciences, Nanjing University of Information Science & Technology, Nanjing 210044, China
*
Author to whom correspondence should be addressed.
Sustainability 2018, 10(11), 3897; https://0-doi-org.brum.beds.ac.uk/10.3390/su10113897
Submission received: 9 October 2018
/
Revised: 22 October 2018
/
Accepted: 23 October 2018
/
Published: 26 October 2018
(This article belongs to the Special Issue Transition from China-Made to China-Innovation
)
Abstract
:In the light of the shortcomings of the analytic hierarchy process and other common regional sustainable development evaluation methods, this paper proposes the use of a combination of subjective and objective weights to generate input/output indicators using the Data Envelopment Analysis (DEA) method. Using this methodology, we construct a comprehensive evaluation index which is useful in expanding the application of Data Envelopment Analysis (DEA) in the comprehensive evaluation of sustainable development. Moreover, this paper addresses the shortfalls of the traditional DEA evaluation model and uses the Super-Slack Based Measure (SBM)-Undesirable and DEA-Malmquist evaluation models, which are based on traditional DEA model optimization, to analyze the spatio-temporal characteristics of sustainable development on regional scales. Using China’s Yangzte River Economic Belt as an example, an empirical analysis is carried out. We show that analysis results are virtually identical to the extant situation and can objectively reflect the status and abilities of sustainable development in each subregion. Additionally, from the angles of input, output and technological progress, this paper uses the DEA evaluation method to analyze the reasons behind the slow development in several provinces and municipalities along the Yangzte River Economic Belt (YERB). The regional characteristics of each province and city within our study are combined to explore the optimal mechanisms for sustainable development.
1. Introduction
In the present context of resource shortages, ecological degradation and rapid population growth, the theories of sustainable development guides people into understanding that resources and the environment are not only endogenous variables of societal and economic development, but are also rigid constraints in societal progress and economic growth [1]. As an important carrier of sustainable development strategy, regions play a vital role in the process of sustainable development. With the continuous development of sustainable regional development, theoretical research foci have gradually shifted away from definitions and attributes to comprehensive evaluation. It is of great significance to carefully guide regional sustainable development by conducting comprehensive evaluations of sustainable development. In most developing countries, insufficiently systematic and comprehensive assessments, in addition to putting undue emphasis on using GDP as a main indicator of regional sustainable development levels without considering resources and the environment as rigid constraints, has led to severe problems with their resources, environment and populations [2]. Presently, though possessing the world’s second largest economy, China is however also the largest energy consumer and carbon emitter. Thus, one cannot ignore the effect that China’s development has on the global ecological environment. Consequently, sustainably implementing development is the singular path upon which China must tread and is an urgent demand internationally. This paper provides a comprehensive evaluation of regional sustainable development, providing China’s Yangtze River Economic Belt as an example. Through a combination of entropy and DEA methods, a practical and operable comprehensive evaluation index system is built for regional sustainable development, to realize an objective and accurate evaluation of regional development status. Accordingly, it puts forward countermeasures and suggestions to effectively guide the specific practice of regional sustainable development.
2. Research Status
In order to harmonize national and regional ecological, economic and social benefits, we construct a set of practical and operable regional sustainable development evaluation models, using them as sound justification to formulate and adjust regional policies. It is aimed at realizing an objective and accurate evaluation of the level of regional sustainable development, and to investigate the reasons for why sustainable development in an evaluated object is encumbered. The results of comprehensive evaluation of regional sustainable development are usually based on the establishment of evaluation index system reflecting social, economic, resource, environmental and institutions at various levels. Index weights are determined by the Delphi Method, analytic hierarchy process (AHP), Grey Relational Analysis and Principal Component Analysis (PCA) [3,4,5,6,7,8,9]. Then, the weighted average of index values is used to calculate evaluation results. This kind of evaluation method carries the sustainable development appraisal to the weighted average of the evaluation index value through the system science index system establishment and the reasonable index weight determination. It is characterized by its ability to scientifically reflect the level and ability of sustainable development in a specific region. However, it cannot be ignored that these evaluation methods also have obvious shortcomings. Firstly, although the evaluation results can only rank evaluated objects and are unable to explain the reasons behind that ranking, nor can they provide a basis for future development through optimization. Secondly and more importantly, such methods to a certain extent also conceal the costs of sacrificing resources and the environment for social progress and economic growth. Because weighted averages were used in the calculation of evaluation results, higher economic and social evaluation index values compensate for lower resources and environment index values. Thirdly, the number and total weight of the resources and environment evaluation indices are usually fewer/less than those of the economy and society, which makes it easier to compensate for higher economy and society indices. Combining this with the on the ground reality of regional development, this is precisely the phenomenon of most developing countries’ practice, where resources and the environment are sacrificed for social progress and economic growth. Careful attention should be paid here to avoid embarking on the old road that developed countries in the 20th century have gone through: first consumption, then economy, first pollution, then governance. Therefore, some scholars have tried to apply Data Envelopment Analysis (DEA) to the comprehensive evaluation of regional sustainable development [10,11,12,13,14].
DEA is an effective method to solve the comprehensive evaluation problem characterized by multi-input/output and large, complex systems. This method is a non-parametric research method, based on relative efficiency, which uses a mathematical programming model to evaluate decision-making units (DMUs) with multiple inputs and outputs from the perspective of inputs and outputs. This method does not need to restrict the production function and can avoid the subjective decision and objective factor dimensionality, and the impact of a unit’s impact on evaluation results. In addition, the DEA evaluation method can measure not only the relative efficiency of each decision-making unit, but also point out the reasons and extent of its inefficiency, and then provide a regulatory basis for improving the efficiency of DMUs [15]. However, compared with the parameter research method, the DEA method requires less evaluation indices, but if the number of evaluation indices is too large, most or even all DMUs are likely to have effective results. Therefore, the DEA method requires that the product of the number of input and output indicators is less than the number of DMUs, while the total number of input and output indicators should be less than twice the number of DMUs. That is: [16]. However, in the comprehensive evaluation of regional sustainable development, the evaluation index system often contains several evaluation indicators. Therefore, to obtain comprehensive and objective evaluation results of DEA, it is necessary to further rationally generate comprehensive input and output indicators of DEA on the basis of a science-based evaluation index system.
To sum up, this paper takes the comprehensive evaluation of regional sustainable development as an example, according to the requirements of the number of indicators of DEA method, on the basis of constructing the comprehensive evaluation index system of regional sustainable development, and further uses the method of combining subjective and objective weights to generate the comprehensive index of DEA input and output. Then it provides ideas for the application of the DEA method in the comprehensive evaluation of sustainable development.
3. DEA Evaluation Model
3.1. Super-SBM-Undesirable Evaluation Model
The explanation of invalid DMUs by traditional DEA evaluation model only includes narrowing or enlarging the proportion of input and output. But in specific applications, the gap between the current state of the invalid DMU and the strong effective target value is not only included in the part of the equal proportion improvement, but also the part of the relaxation improvement. Based on the above shortcomings, Tone (2003) innovatively incorporated the relaxation variables into the objective function and constructed a non-radial and non-angle DEA evaluation model, which can measure the relaxation variables, namely, the Slack Based Measure (SBM) model. This model can effectively avoid the deviation caused by the difference of radial and angle choice [17]. On the other hand, with the wide application of the DEA model, more and more scholars have found that in some production processes, undesired outputs, such as sewage, waste gas and disasters, will also be produced with desirable and desirable outputs. According to practical significance, the traditional DEA model is no longer suitable for evaluating the relative efficiency of the undesired output DMU only when the undesired output is as efficient as possible DMU. Based on the problem of undesirable output, scholars worldwide have put forward a variety of processing ideas, as shown in Table 1. At the same time, the traditional DEA model sometimes presents a situation by which multiple DMUs have efficiencies equal to 1, and this has the effect of inhibiting the DEA model from a further evaluation and analysis of those effective DMUs. Therefore, based on the traditional DEA model, Andersen and Petersen (1993) proposed a super efficiency model which can further distinguish DMUs of efficiencies equal to 1 [18].
In summary, based on the SBM model built by Tone and its processing methods for undesirable outputs and combining the super efficiency evaluation model established by Andersen and Petersen, this paper constructs a DEA model, the Super-SBM-Undesirable evaluation model, which is suitable for comprehensive evaluation of regional sustainable development.
In this paper, a brief introduction of the SBM-Undesirable model built by Tone is introduced. Based on this, the Super-SBM-Undesirable evaluation model is derived from the basic idea of the super efficiency evaluation model. The SBM-Undesirable evaluation model, based on scale returned unchanged, is constructed as follows:
where is the comprehensive technical efficiency value of target DMU. The greater the value of A, the higher the level of sustainable development in the region; represents the weight vector, and indicates the importance of input and output indicators to regional sustainable development; k represents the kth DMU. That is, the kth evaluated area; , and represent the slack of input, desirable output and undesired output respectively. That is, in the process of regional development, the amount of input value and unexpected output value should be reduced, and the amount of expected output value should be increased. The actual input value of the DMU and the denominator of the objective function are reduced or expanded in proportion to the output value relative to the production front. That is, input and output inefficiency. From Equation (1) we can see that the SBM-Undesirable model puts the input and output slack directly into the objective function and measures the gap between the relaxation of the variable and the best production frontier. This method solves the slack problem of input and output in the traditional DEA model, and solves the problem of comprehensive technical efficiency evaluation under the assumption of undesirable outputs.
The core idea of the super efficiency DEA evaluation model constructed by Andersen and Petersen is to remove the evaluated DMUs from the reference set. In this method, DMU efficiencies are derived from regions with the highest values, so that the efficiencies of effective DMUs will be greater than 1, allowing the further partitioning of effective DMUs. Based on the above principles, Super-SBM-Undesirable evaluation model as derived from a harmony of the SBM-Undesirable and super efficiency evaluation models is defined as follows:
The Super-SBM-Undesirable model is simultaneously able to measure DMU efficiency and can also calculate DMU input and undesirable output redundancy rates, in addition to desirable output rate of insufficiency. When < 1, DMU is ineffective and the level of regional sustainable development is low, the sources of inefficiency of the evaluated unit can be decomposed into [23]:
where indicates the input redundancy rate, the proportion of input elements can be reduced in the process of regional development; indicates insufficiency of desirable outputs, the output can expand the proportion in the process of regional development; indicates the undesirable output redundancy, the undesired output can be reduced in the process of regional development; the other variables are consistent with Equation (2).
Above we can see that the Super-SBM-Undesirable evaluation model constructed in this paper has three significant characteristics: firstly, it is able to measure relaxed input and output variables; secondly, it fully considers and effectively solves the problem of undesirable outputs; third and finally, it can carry on a further evaluation and analysis of the effective DMUs. Therefore, compared with the traditional DEA model, the Super-SBM-Undesirable model is more accurate and can more faithfully evaluate and analyze regional sustainable development.
3.2. DEA-Malmquist Productivity Index Evaluation Model
On the one hand, based on the Super-SBM-Undesirable model, this paper analyzes the comprehensive technical efficiency of regional sustainable development across different temporal cross-sections, and on the other, uses the DEA-Malmquist productivity index evaluation model from a spatial cross-section to analyze a region’s past total factor productivity (TFP) throughout production histories.
Fare et al. (2007) constructed a Malmquist productivity index from t to t + 1. Decomposition is achieved using the first order difference method and the relationship between the changes of comprehensive technical efficiency, production technology, and TFP in the two separate periods where DMU is objectively evaluated. The equation is as follows [24]:
where TFPC, EC and TC respectively represent the change index of TFP, the change index of the comprehensive technical efficiency and the change index of production technology, from t to t + 1; a TFPC greater than 1 indicates that the level of regional sustainable development is on the rise; EC greater than 1 indicates that regional management level is on the rise in the process of regional sustainable development; TC greater than 1 indicates that regional production technology is on the rise in the process of regional sustainable development; and respectively represent input vectors and output vectors from t to t + 1; and respectively represent the distance function of DMU in the period of t and t + 1 when referring to the production technology of t period; and are the distance functions of DMU in the period of t and t + 1 when referring to the production technology in the t+1 era.
Considering the variable return on scale, EC can be further decomposed into the change index of pure technical efficiency (PTEC) and the change index of scale efficiency index (SEC) between t and t + 1. PTEC greater than 1 indicates that regional management level has been improving continuously in the process of regional sustainable development. SEC greater than 1 indicates that regional resource allocation structure is constantly improving. Not only can the refined decomposition explain the specific reasons for the changes in comprehensive technical efficiency, but also explain the changes in TFP. The decomposition is carried out as follows:
4. Examples of Application—Comprehensive Evaluation of Sustainable Development of the Yangtze River Economic Belt
The Yangtze River Economic Belt (YERB) covers 11 provinces and municipalities (the upper reaches are Guizhou, Sichuan, Yunnan and Chongqing; the middle reaches are Hunan, Hubei, Jiangxi and Anhui; the lower reaches are Jiangsu, Zhejiang and Shanghai), representing about 45% of China’s GDP. Approximately 600 million people are nurtured on a land area covering 2.05 million square kilometers and occupies a critical position with great development potential in the China’s future development. Therefore, studies on sustainable development throughout the YERB will play an important guiding role in the future development of the entire Chinese economy.
4.1. Establishing an Evaluation Index System
Establishing a systematic and scientific comprehensive evaluation index system is a key step in the comprehensive evaluation of regional sustainable development of the YERB. It is not only a judgment basis for the level and trend of sustainable development of the YERB, but also a necessary basis for formulating countermeasures to sustainable development regulations in the future. In applying the DEA method to evaluate the level of sustainable development in the YERB over the previous decade, it has been required that during the establishment of an evaluation index system, it should not only meet basic DEA method requirements, but also follow the three principles of purposefulness, comparability and operability.
This paper establishes a comprehensive evaluation index system for the sustainable development of the YERB, which includes input, desirable and undesirable outputs (as shown in Table 2). Based on the principles of input and output, we take resource consumption, urban construction, education, science, technology, culture and medical development, in addition to social security, economic development, pollution and disasters, as the variables by which we can systematically and scientifically assess YERB sustainable development. To ensure the index system is as scientific as possible, this paper draws lessons from the relevant literature on the setting of indicators at all levels, giving priority to the selection of indicators that appear most prevalently. Subsequently, based on these indicators, other representative and comparative indicators have been added. In addition, the final determination of the index system required the solicitation of the opinions of experts from university experts, scientific research institutes, planning departments, environmental departments, statistical departments and so on. Due to a limitation of space, those are not expounded upon individually.
4.2. Construction of DEA Input and Output Comprehensive Index
The objective weight of each index is obtained by the entropy method, while the subjective weight of each index is obtained by referring to relevant literature and expert consultation. Based on the idea of combining subjective and objective weights, this paper synthesized 29 three-level indicators into the input, desirable output and undesirable output as required by DEA evaluation model, including five comprehensive indicators: natural resources consumption, social resources consumption, social development, economic development, pollution disasters and accidents. The specific steps for generating comprehensive indicators are as follows:
4.2.1. Data Acquisition and Standardization
Several datasets were directly extracted from the 2007–2016 China Statistical Yearbook [25,26,27,28,29,30,31,32,33,34], China Statistical Yearbook on Environment [35,36,37,38,39,40,41,42,43,44], China Energy Statistical Yearbook [45,46,47,48,49,50,51,52,53,54], in addition to the provincial and municipal statistical yearbooks.
Given the varying dimensions and magnitudes of the original sample data values, a standardization exercise must be carried out before comprehensive indices are synthesized. Many methods are available to achieve this, including but not limited to, maximum standardization, Z-score standardization and decimal standardization. This paper chooses the most commonly used maximum standardization method to process the original data to eliminate dimension variability. The basic formula of maximum value standardization is:
where Xi represents the standardized value, xi represents the original value before standardization, and i represents the ith evaluation unit of n evaluated units.
4.2.2. Determining Index Weight
The determination of index weight includes two stages: firstly, the weight of each third-level index under the second-level index is determined; secondly, the weight of each second-level index under the first-level index is determined. If a secondary index contains only one tertiary index, such as “land” and “water”, the weight of the lower Tertiary index can be regarded as 100%. Taking the weight of the two-level index “urban development” as an example, the specific process of determining the index weight is as follows:
- ➢
- Determination of objective weight. The objective weights of four third level indices, namely, , , , , are obtained by the entropy method;
- ➢
- Determination of subjective weight. By referring to relevant literature and consulting experts’ opinions, the subjective weights of the three-level indices, namely, , ,, and were obtained.
- ➢
- Final determination of index weight. By synthesizing subjective and objective weights, we can get the weights of the three-level indicators under the secondary indicators of urban development: .
The weight of each evaluation index is shown in Table 3.
4.2.3. Determining Composite Index Values
Based on the weights of three-level and two-level indicators, five first-level indicators of natural resources consumption, social resources consumption, social development, economic development, pollution disasters and accidents are deduced, which are X1, X2, Y1, Y2 and Y3. Taking the deduction of the first level index of social resources consumption of the ith object as an example, the derivation process is as follows:
(1) The derivation of two-level index values. The two-level indicators are: . Among them, and respectively show the proportion of investment in environmental pollution control to GDP and the weight of per capita investment in fixed assets; and are the third-level indicators under the ith evaluated object. The ratio of investment ith environmental pollution control to GDP and the per capita investment ith fixed assets after standardization are listed respectively. Because there is only one third-level indicator under the second-level indicator “labor”, the comprehensive index value of labor force is the standardized index value of the third-level indicator “employment proportion”.
(2) The derivation of the first level index value. The weights of “capital” and “labor force” secondary indices are expressed by and respectively, and the index values of “capital” and “labor” secondary indices are expressed by and respectively. Then the comprehensive index value of the first-level index of social resources consumption of the ith evaluated object is: .
4.3. Result Evaluation Analysis
The Super-SBM-Undesirable and Malmquist productivity index evaluation models are constructed by taking natural and social resources consumption as input indices, while social and economic development were listed as desirable output indices, leaving pollution, disasters and accidents as undesirable output indices. Model evaluation results are computed using MATLAB.
Based on the comprehensive technical efficiency of the provinces and municipalities identified in Section 4, this paper analyzes the spatial and temporal evolution of the overall level of sustainable development of the YERB from 2006–2015. Taking 2015 as an example, the paper conducts a projection analysis on the provinces and municipalities with efficiencies, determines the degree and ideal magnitude of input–output values to find out the key factors restricting the sustainable development in these areas. Using the Malmquist TFP index and its corresponding decomposition index, this paper evaluates and analyzes the ten-year changes of the comprehensive technical efficiency of various provinces and municipalities from a dynamic point of view and corroborates and supplements results with the Super-SBM-Undesirable model. Simultaneously, we also analyze the spatiotemporal evolution of YERB TFP from 2006–2015, and reveal the deep-seated reasons hidden behind the sustainable development from the perspective of EC and TC.
4.3.1. Result Analysis of Technical Efficiency of Time Cross Section
(1) Analysis of spatio-temporal evolution of comprehensive technical efficiency:
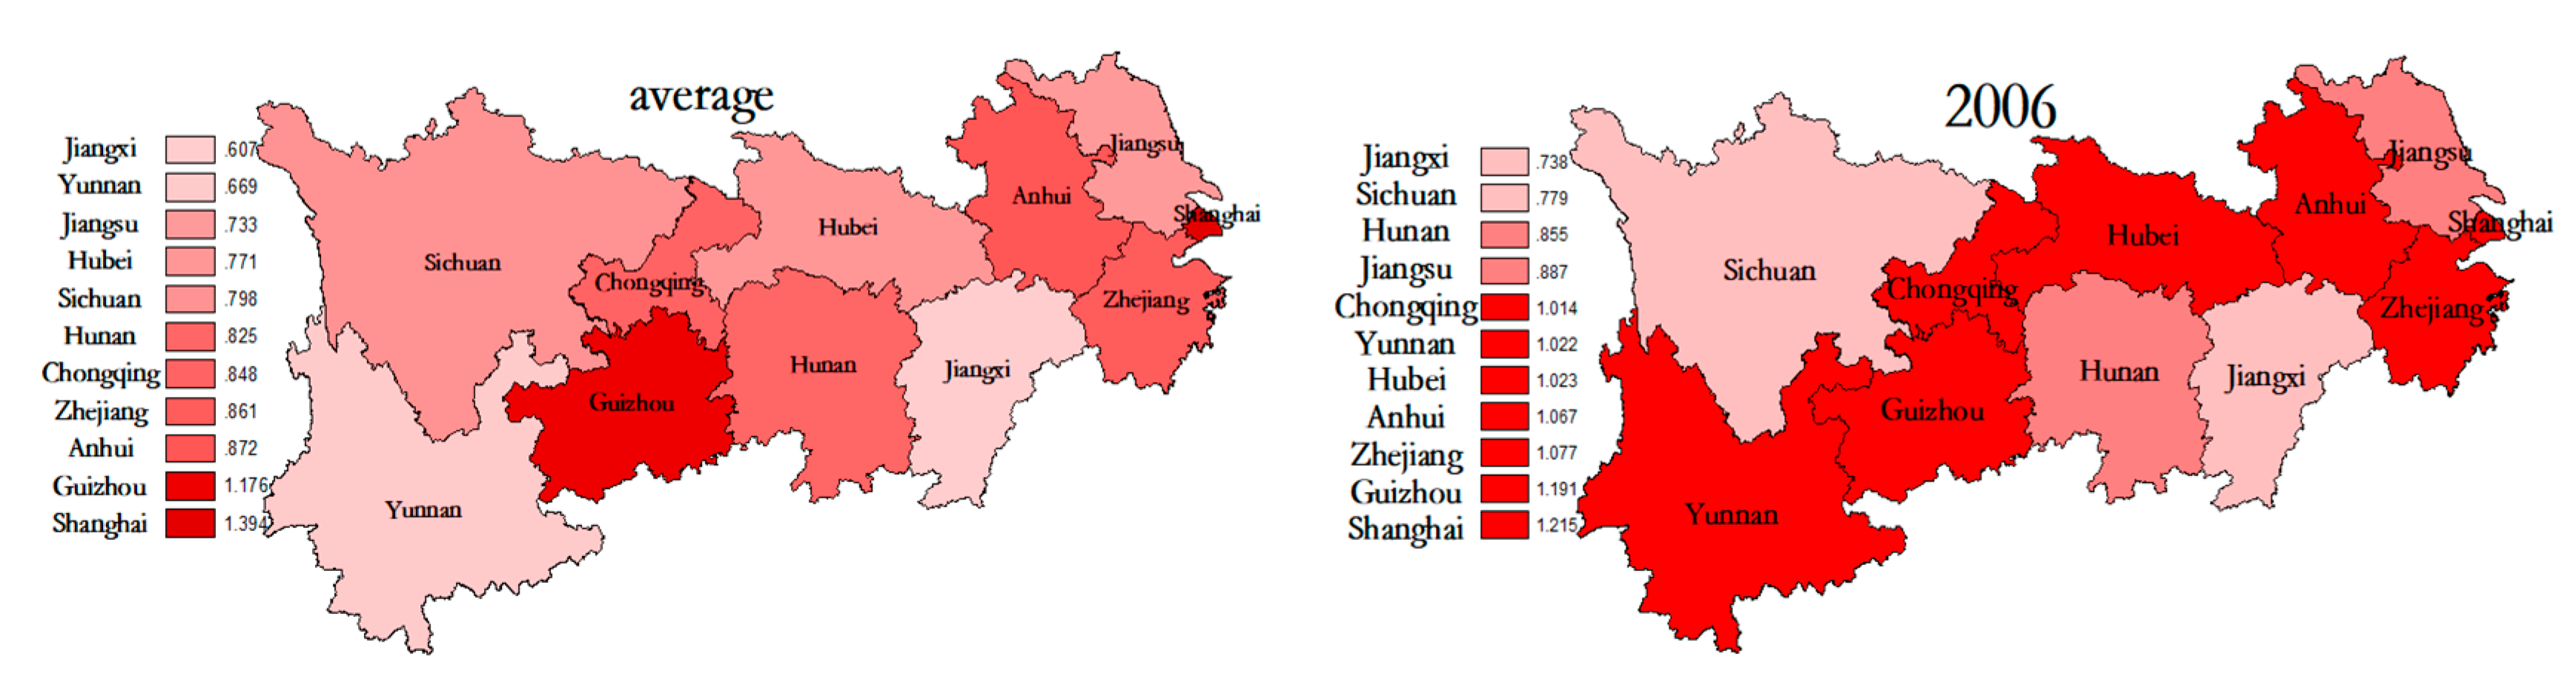
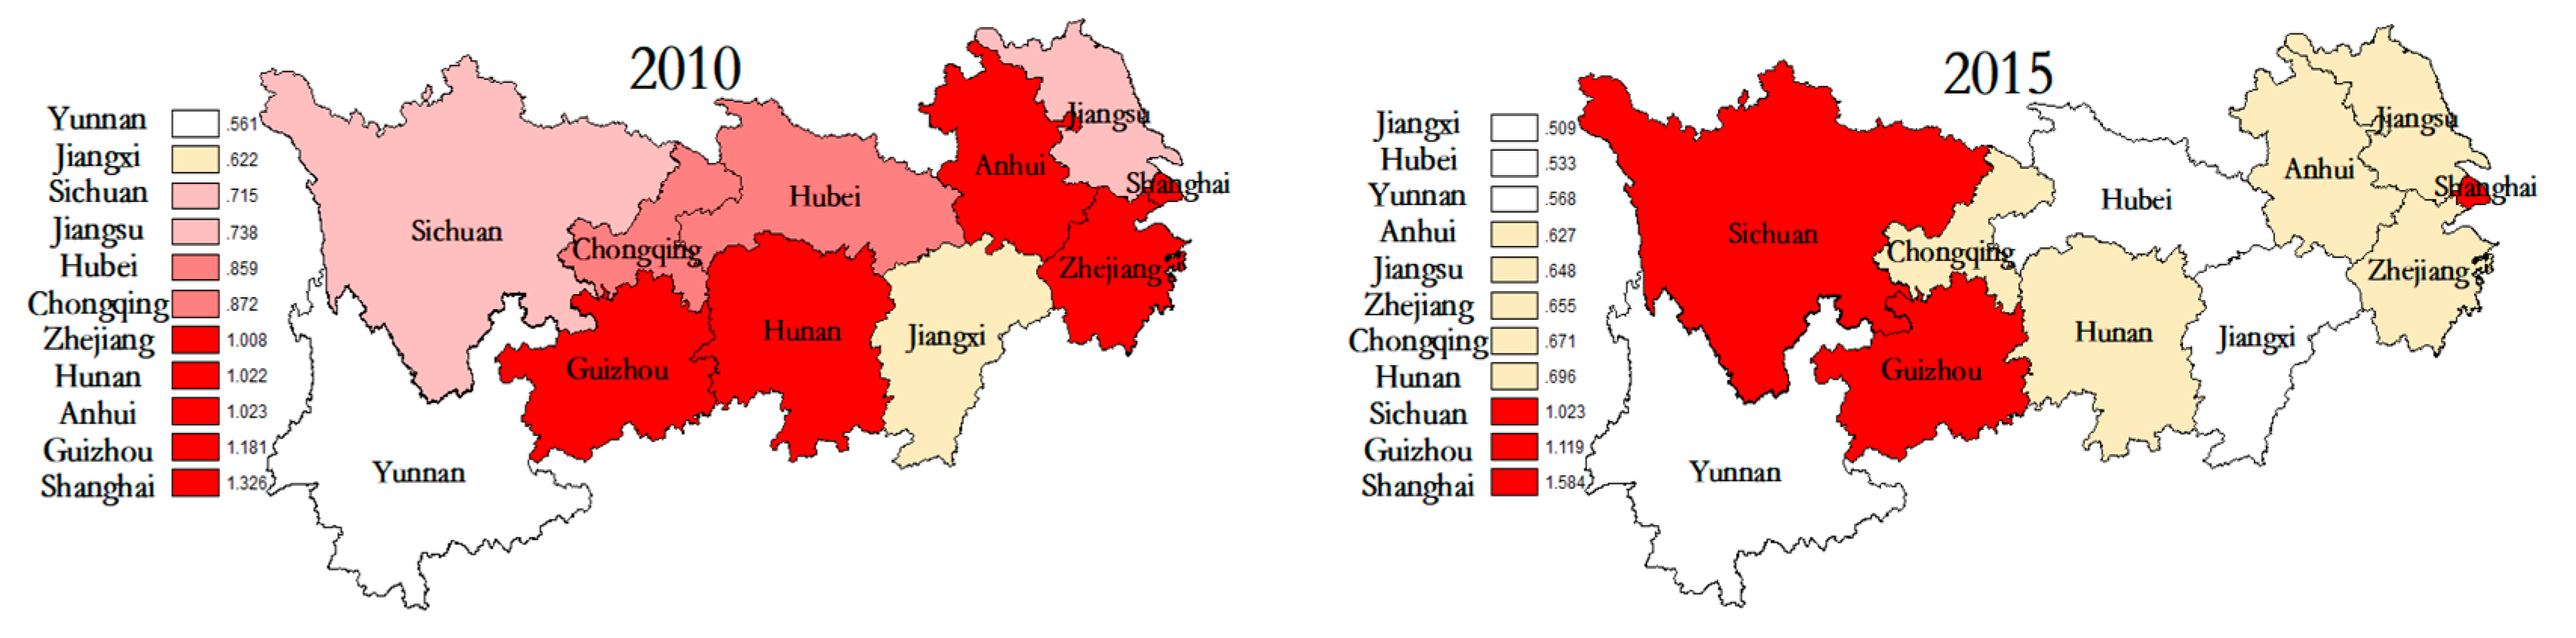
We take the representative years of 2006, 2010, 2015 and the average value of the Yangtze River Economic Belt 2006–2015 comprehensive technical efficiency of sustainable development for spatial and temporal evolution analysis. The comprehensive technical efficiency of provinces and municipalities is sorted according to the calculation results. ArcGIS 10.2 was used to draw the spatio-temporal evolution map of YERB comprehensive technical efficiency in sustainable development from 2006–2015. The deeper red shading in the map represents higher comprehensive technical efficiency of a given province or city (Figure 1).
(a). Through the geographical distribution map of the mean of sustainable development efficiency in Figure 1, we can find that the overall level of sustainable development of the YERB is not very high. Among the 11 provinces and municipalities, only Shanghai and Guizhou have an average annual comprehensive technical efficiency of more than 1. That is, only Shanghai and Guizhou have achieved optimal levels of input and output during the study period. While vigorously developing their socioeconomic situations, Shanghai and Guizhou have paid attention to the efficient allocation of resources, the protection of ecological environment, the prevention and control of natural disasters and the maintenance of social order.
(b). Furthermore, from Figure 1, we can see that the comprehensive technical efficiency gap between the 11 provinces and municipalities in the YERB is growing. In 2006, the technical efficiency variance of 11 provinces and municipalities was 0.024 and the extreme value was 0.477, among which Shanghai (1.215) had the highest efficiency and Jiangxi (0.738) had the lowest efficiency; In 2010, the technical efficiency variance of 11 provinces and municipalities was 0.056 and the extreme value was 0.764, of which Shanghai (1.326) was the most efficient and Yunnan (0.561) was the least efficient; By 2015, the technical efficiency variance of 11 provinces and municipalities was 0.107, the extreme value was 1.074, the highest efficiency was Shanghai (1.584), and the lowest efficiency was Jiangxi (0.509). We can see that comprehensive technical efficiency of the YERB has continuously deteriorated. In 2006, the average technical efficiency of 11 provinces and municipalities was 0.988, of which 7 provinces and municipalities had efficiency greater than 1, with no provinces and municipalities with efficiency less than 0.6. In 2010, the average technical efficiency of 11 provinces and municipalities was 0.903, of which 5 provinces and municipalities were more than 1, and 1 provincial and municipality was less than 0.6. In 2015, the average technical efficiency of 11 provinces and municipalities was 0.785, of which only 3 provinces and municipalities had efficiency greater than 1 and 3 provinces and municipalities had efficiency less than 0.6. It shows that 11 provinces and municipalities in the YERB have facilitated many types of development in the past ten years. The level of sustainable development varies among provinces and municipalities. In exploring the road of sustainable development, there are not only provinces and municipalities with successful transformation of development mode, but also provinces and municipalities with backward development mode. Due to the different development concepts and objectives of the provinces and municipalities, the gap of technical efficiency between the provinces and municipalities in the YERB is widening. On the other hand, because of the influence of international and national environment, most of the 11 provinces and municipalities take GDP as the main index to measure the development level of the region, ignoring the constraints of resources, environment and social order, and ultimately make the overall governance efficiency of the economic belt deteriorating.
(c). In the upper reaches of the YERB, the comprehensive technical efficiency level of Guizhou in the past decade has always been in a relatively effective state, with an average value of 1.176; The efficiency level of Sichuan has changed from slow decline in 2006–2010 to high-speed growth in 2010–2015. By 2015, the efficiency of Sichuan has reached 1.023, becoming one of the three effective provinces and municipalities; The efficiency level of Chongqing and Yunnan dropped sharply, from 1.014 to 0.671 and 1.022 to 0.568 respectively. Hunan, Hubei, Jiangxi and Anhui, located in the middle reaches of the YERB, have the same level of development resources and conditions because of their similar geographical location, and have the same level of development policies, resulting in similar trends in the level of efficiency change, showing a yearly gradual decline. Then, the efficiency level of Jiangsu and Zhejiang located in the lower reaches of the YERB is low and decreases yearly. It shows that the social progress and economic growth of Jiangsu and Zhejiang, as the major economic provinces in China, have been achieved at the expense of resources and environment in the past decade. Jiangsu and Zhejiang provinces should pay enough attention to the problem, optimize and upgrade the development model in the future, and adhere to the road of sustainable development. Finally, Shanghai, located at the forefront of the YERB, has maintained a relatively effective level of comprehensive technical efficiency in the past decade, and its efficiency value has always been ranked first. With its unique geographical position and policy support, Shanghai has rapidly developed into a financial center of China and an international metropolis. Compared with Jiangsu and Zhejiang provinces, Shanghai’s rapid development is not based on sacrificing resources and environment, but on technological innovation, making full use of existing resources, and pursuing the coordinated and balanced development of society, economy, culture and ecosystem.
(2) Analysis of reasons for projection based on production front surface
To explore the causes of ineffective comprehensive technical efficiency of the studied provinces and municipalities, a projection analysis from the perspective of input output is presented and determines the gap between the attribute ideal values. In the Super-SBM-Undesirable evaluation model, when the comprehensive technical efficiency is less than 1, the size of relaxation variables reflect the reason of efficiency loss. , , respectively represent the input redundancy rate, desirable output insufficiency rate, undesirable output redundancy rate. Taking 2015 as an example, this paper makes a static projection analysis of the ineffective provinces and municipalities from three angles: input redundancy, desirable output insufficiency and undesirable output redundancy rates. According to Figure 1, there are 8 provinces and municipalities which, based on our assessment are inefficient. In decreasing order of efficiency, they are Jiangxi, Hubei, Yunnan, Anhui, Jiangsu, Zhejiang, Chongqing and Hunan. The slack are shown in Table 4.
From the input point of view, there are different degrees of redundancy in the input of natural resources in the eight ineffective provinces and municipalities (where input redundancy rates are negative), thus resulting in the low utilization efficiency of natural resources, which challenge their future developments. Besides being influenced by the redundancy of natural resources input, the redundancy of social resource inputs is also an important reason for the inefficiency of sustainable development in Jiangsu, Zhejiang and Chongqing. The higher the redundancy rate, the lower the utilization of funds and labor. In the future development process, the three provinces and municipalities need to improve the capital, labor distribution system, management structure and other aspects to achieve the full use of social resources. From the perspective of output, the eight ineffective provinces and municipalities have different degrees of social development output shortage, of which Jiangxi is the most serious, the desirable output shortage rate is 35.99%, followed by Hubei, 34.14%. Those areas are less affected by the insufficient output of economic development, where only Zhejiang is strongly affected by it, where the insufficiency rate of desirable output is 10.79%. It shows that under the goal of sustainable development, the eight ineffective provinces and municipalities should further develop in terms of social progress and economic growth. Among them, the task of the future development of Jiangxi and Hubei is the most arduous. On the undesirable output redundancy rate, there are very high undesirable output redundancies in those areas. It further shows that in the development of the past decade, the development model of the provinces and municipalities is more extensive, running along a single track of pursuing socioeconomic development, rather than also considering the environment which leads to ecological deterioration, more frequent disasters, and the need for the stabilization of social order.
4.3.2. Result Analysis of Malmquist Total Factor Productivity Index of Spatial Cross Section
Super-SBM-Undesirable evaluation model is used to evaluate and analyze the relative level of sustainable development of provinces and municipalities in the YERB at a certain time cross-section. However, it cannot reflect the internal factors behind the annual changes in the level of sustainable development of provinces and municipalities from the perspective of their own comparison. Therefore, with the help of Malmquist productivity index evaluation model based on DEA, this paper makes a deeper evaluation analysis of the level of sustainable development of provinces and municipalities from the dynamic spatial cross-section and finds out the key factors that restrict the sustainable development of provinces and municipalities.
(1) overall analysis of the YERB
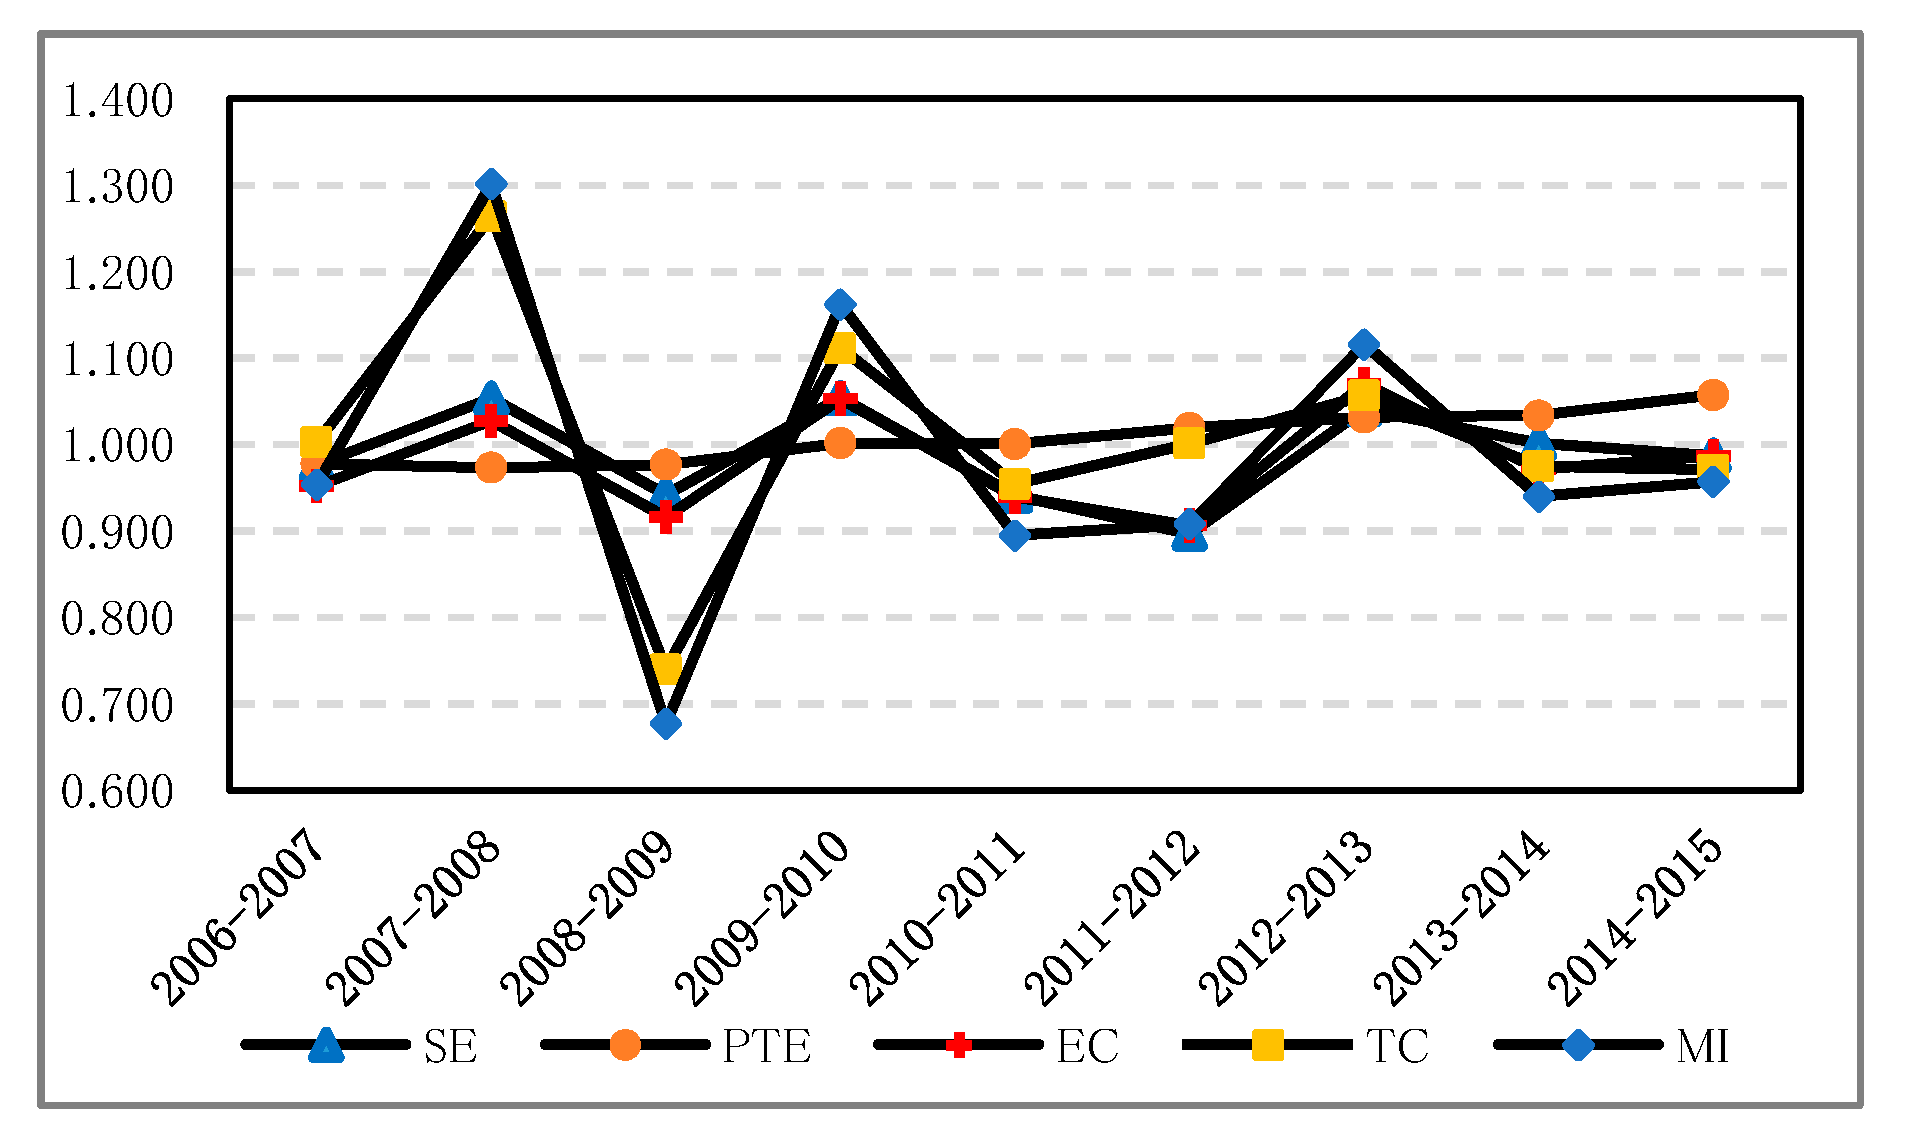
As shown in Table 5 and Figure 2, it can be found that excluding PTEC, SEC, EC, TC and TFPC greatly fluctuate. Firstly, except for a few years, where EC is concerned, values are basically less than 1. This shows that the overall technical efficiency of the YERB is declining, which is mutually corroborated with the results of the Super-SBM-Undesirable model evaluation above. Secondly, SEC and EC show a trend of synchronous change and are generally less than 1, showing that efficiency has an inhibitory effect on the promotion of comprehensive technical efficiency. Continuing, it also reflects that the YERB has not been in the optimal production scale in the past development process. At the same time, with the rapid development of society and economy, investment and financing for development has gradually increased, there are too many duplicate development investments, thus resulting in the decline of comprehensive technical efficiency. We can also see that PTEC is generally larger than 1, and is increasing year by year, displaying that the internal management system of the YERB is constantly optimized and the management levels have continuously improved, thus promoting the growth of comprehensive technical efficiency. From the perspective of TC, the fluctuation of TC and TFPC is large, and the trend is synchronous. During, and due to, the 2008 international financial crisis, TC and TFPC showed a large decline. It is indicated that the influence of TC is the dominant factor affecting the TFPC fluctuation in the YERB. In other words, the main reason why TFPC in the YERB has fluctuated greatly over the past decade is that the contribution of comprehensive technical efficiency is far lower than that of technological progress, which plays a vital role in the development process.
(2) Result analysis of 11 provinces and municipalities
As shown in Table 6, TFPC in the provinces and municipalities of the YERB in addition to its decomposition shows large degrees of fluctuation over the 2006–2015 period. Only Guizhou, Shanghai and Sichuan have an EC average of more than 1. This is consistent with the conclusion that only Guizhou, Shanghai and Sichuan have improved their comprehensive technical efficiency, while the other provinces and municipalities have shown a decreasing trend. Also, in Table 6, we can see that only Jiangxi, Yunnan and Chongqing are in decline because of SEC. This shows that those three provinces have failed to make optimum use of resources, which results in the severe problem of resource redundancy during the past development process. Only Zhejiang province has been affected by a diminishing PTEC value. This shows that the internal management structure of Zhejiang does not match the actual management needs. It is recommended that Zhejiang improve its management mechanisms and management level. As total factor productivities throughout the studied regions are mostly less than 1, this then indicates a downward trend. Using mean TFPC, it is Jiangsu, Shanghai and Yunnan have values greater than 1. From the perspective of technical efficiency and technological progress, TFP in Hubei, Jiangxi, Zhejiang, Chongqing, Anhui and Hunan decreased because of the influence of technology, while Anhui and Hunan are also affected by TC. By contrast, Guizhou and Sichuan TFP declined only by TC.
In summary, the provinces with TFPC less than 1 are mainly affected by the change of technological efficiency. At the same time, it also shows that technological progress plays a vital role in improving the total factor productivity of provinces and municipalities. In the future development practice, we should adhere to the technology-oriented, optimize the management structure, make full use of production resources and take the road of sustainable development.
5. Discussion
In summary, the results of using DEA method to evaluate the sustainable development level of the YERB are basically consistent with the actual situation, objectively reflecting the sustainable development ability of the provinces and cities. This is because, firstly, regardless of whether we assess the problem from the viewpoint of a single input/output index, or a comprehensive input/output index, the input index value of provinces and cities that are evaluated as DEA effective is relatively small, and the output index value is relatively large. On the contrary, the input index value of provinces and cities that are evaluated as ineffective DEA is relatively large, and the output index value is relatively small. Secondly, based on the results of time cross section analysis, we can see that the overall level of sustainable development of the YERB is not optimistic. Among the 11 provinces and cities, only Shanghai and Guizhou have an annual average comprehensive technical efficiency of more than 1, while the other provinces and cities are less than 1. The gap of comprehensive technical efficiency between the 11 provinces and cities is expanding. The main reasons for the inefficiency of the comprehensive technical efficiency of the provinces and municipalities in the YERB lie in the high environmental, disaster and accident undesirable output and natural resource consumption input redundancies, in conjunction with insufficient output of social development, rather than the redundancy of social resources consumption and the lack of desirable output of economic development. Then, based on the results of spatial cross section analysis, we can see that in the past decade, the main reason for the great fluctuation of TFPC in the YERB is that the contribution of comprehensive technical efficiency is far lower than that of technological progress, and technological progress plays a vital role in the development process. At the same time, the fluctuation of TFPC and its decomposition index in various provinces and cities is larger. Therefore, compared with other methods commonly used in the evaluation of regional sustainable development, the application of the DEA method to evaluate regional sustainable development has unique advantages. Applying the DEA method to evaluate regional sustainable development can not only give the relative efficiency of input and output of the evaluated object, but also give the reason and degree of ineffectiveness of the evaluated object and provide the basis for the early warning and regulation of sustainable development.
6. Conclusions and Insights
On the basis of establishing the comprehensive evaluation index system of regional sustainable development, this paper used the method of combining subjective and objective weights to generate the DEA input and output comprehensive index, and then applies the DEA evaluation method to the comprehensive evaluation of regional sustainable development. Taking the YERB as an example, the following conclusions and implications are drawn:
(1) Different from other commonly used evaluation methods, applying DEA method to comprehensive evaluation of regional sustainable development can effectively provide the basis for early warning and regulation of regional sustainable development. On one hand, the comprehensive evaluation of regional sustainable development based on DEA method is not only able to give the relative efficiency of the input and output of the evaluated object, but also give the reason and degree of invalidation of the evaluated object. On the other hand, the use of DEA method can effectively overcome the commonplace shortcomings of comprehensive evaluation methods which cover up the phenomenon of sacrificing resources and the environment for economic growth and social progress to a certain extent. Furthermore, it can effectively prevent regional development from going too far along the old road that developed countries in the 20th century have gone through: first consumption, then economy, first pollution, then governance. Therefore, the DEA method is very promising for sustainable development evaluation.
(2) Based on the principles of purposiveness, comparability and maneuverability of index system design, this paper designed a comprehensive evaluation index system of regional sustainable development, which includes 5 first-class, 16 second-class and 29 third-class indices. According to the requirement of DEA method on the quantity of indicators, the method of combining subjective and objective weights is further adopted to generate the DEA input and output comprehensive indicators, to provide ideas for the application of DEA method in sustainable development evaluation.
(3) This paper used the optimized DEA evaluation model to analyze the spatial and temporal evolution of the sustainable development level of the whole region and its sub-regions from the static and dynamic perspective. At the same time, this paper analyzed the causes of ineffective sub-regions of DEA from the perspective of input–output and exponential decomposition and put forward some optimization suggestions.
(4) This paper illustrated the importance of carefully selecting the evaluation method and methods by which an index system is to be built. The evaluation results show that on one hand, the sustainable development of the YERB in the past decade is serious, not only the gap between the provinces and municipalities in the comprehensive technical efficiency is widening, but also the efficiency level of the provinces and municipalities is showing a downward trend. On the other hand, the main reasons for the inefficiency of the comprehensive technical efficiency of the provinces and municipalities in the YERB lie in the high undesirable output redundancy of “environment, disaster and accident”, “natural resource consumption” input redundancy and the insufficient desirable output of “social development”. Rather than the “social resources consumption” and the lack of desirable output of “economic development”. Moreover, the evaluation results show that TC promotes TFP, EC inhibits TFP, and once again shows that “production technology is the first productive force.” The evaluation results are basically consistent with the actual situation, which objectively reflects the level of sustainable development of the Yangtze River Economic Belt in recent years. Additionally, the evaluation results show that TC has a strong homotropy to the change of TFP and promotes the change of TFP. This evaluation result is basically consistent with the actual situation and objectively reflects the sustainable development level of the YERB in recent years.
(5) Provinces and municipalities with redundant inputs need to improve their capital, labor distribution system, management structure and other aspects to make full use of social resources. Provinces and municipalities that lack desirable output will need to further introduce resources and vigorously develop the society and economy. Provinces and municipalities with high undesirable output need to strengthen the control of the ecological environment, reduce pollution sources and increase investment in environmental control. Based on PTE and SE, suggestions for improving the level of comprehensive technical efficiency are put forward. Provinces and municipalities with PTEC values of less than 1 should consistently optimize their management systems and improve their management levels. Places with SEC values less than 1 indicates that the province and city is not yet in the optimal production scale and need to increase the development of investment and financing, and early warning against duplicate investment, redundant investment phenomenon. Places with TC values less than 1 perhaps can vigorously develop science and technology and promote social and economic development with technological innovation.
(6) It should be indicated that in light of the complex regional sustainable development systems, the construction of the evaluation index needs to be combined with the actual regional development and be constantly adjusted and optimized. The index system established in this paper and the generation of DEA input and output comprehensive index only provide a new idea for the evaluation of regional sustainable development. The setting of each specific index in the index system and the concrete method of the comprehensive generation of the index needs to be continuously improved in practical applications.
(7) Finally, although this paper constructed a Super-SBM-Undesirable model to evaluate the level of regional sustainable development and uses DEA-Malmquist model to analyze the internal factors affecting regional sustainable development, there is no in-depth study of the external factors affecting regional sustainable development. In future research, the Tobit econometric model can be employed to study the external factors affecting regional sustainable development, such as economic scale, industrial structure, population density and any other external factors.
Author Contributions
Z.L., D.T., M.H. and B.J.B. contributed equally to this work. Z.L., D.T., M.H. and B.J.B. read and approved the final manuscript.
Funding
This research was funded by The Open Fund of the China Institute of Manufacturing Development, Nanjing University of Information Science and Technology, P.R. China grant number SK20180090-14 and The Open Fund of the Institute of Climate Change and Public Policy, Nanjing University of Information Science and Technology, P.R. China grant number 18QHA015.
Acknowledgments
We thank the editor and reviewers for careful review and insightful comments. We would like to thank Brandon J. Bethel for his contributions in polishing the language and content of the paper.
Conflicts of Interest
The authors declare no conflict of interest.
References
- Griggs, D.; Stafford-Smith, M.; Gaffney, O.; Rockström, J.; Öhman, M.C.; Shyamsundar, P.; Steffen, W.; Glaser, G.; Kanie, N.; Noble, I. Policy: Sustainable development goals for people and planet. Nature 2013, 495, 305–307. [Google Scholar] [CrossRef] [PubMed]
- Söderqvist, T.; Eggert, H.; Olsson, B. Economic Valuation for Sustainable Development in the Swedish Coastal Zone. Ambio 2005, 34, 169–175. [Google Scholar] [CrossRef] [PubMed]
- Henning, J.; Jordaan, H. Determinants of Financial Sustainability for Farm Credit Applications—A. Delphi Study. Sustainability 2016, 8, 77. [Google Scholar] [CrossRef]
- Michael, F.L.; Zainon Noor, Z.; Zardari, N.H.; Figueroa Meza, M.J. Analytical Hierarchy Process Application in Urban Sustainability Indicators Prioritization. Resour. Environ. 2013, 3, 1–5. [Google Scholar]
- Aldegheishem, A. Evaluating the Urban Sustainable Development on the Basis of AHP: A Case Study for Riyadh City. J. Sustain. Dev. 2014, 7, 113–120. [Google Scholar] [CrossRef]
- Bai, L.; Wang, H.; Shi, C.; Du, Q.; Li, Y. Assessment of SIP Buildings for Sustainable Development in Rural China Using AHP-Grey Correlation Analysis. Int. J. Environ. Res. Public Health 2017, 14, 1292. [Google Scholar] [CrossRef] [PubMed]
- Huang, M.; Wang, B. Evaluating green performance of building products based on gray relational analysis and analytic hierarchy process. Environ. Prog. Sustain. Energy 2015, 33, 1389–1395. [Google Scholar] [CrossRef]
- Zhang, N.; Gong, Z.; Yin, K.; Wang, Y. Special Issue “Decision Models in Green Growth and Sustainable Development”. Int. J. Environ. Res. Public Health 2018, 15, 1093. [Google Scholar] [CrossRef] [PubMed]
- He, X.; Wu, Y. City Sustainable Development Evaluation Based on Hesitant Multiplicative Fuzzy Information. Math. Probl. Eng. 2017, 2017, 1–9. [Google Scholar] [CrossRef] [Green Version]
- Lo Storto, C. Ecological efficiency based ranking of cities: A combined DEA cross-efficiency and Shannon’s entropy method. Sustainability 2016, 8, 124. [Google Scholar] [CrossRef]
- Zhao, T.; Yang, Z. Towards green growth and management: Relative efficiency and gaps of Chinese cities. Renew. Sustain. Energy Rev. 2017, 80, 481–494. [Google Scholar] [CrossRef]
- Vlontzos, G.; Niavis, S.; Manos, B. A DEA approach for estimating the agricultural energy and environmental efficiency of EU countries. Renew. Sustain. Energy Rev. 2014, 40, 91–96. [Google Scholar] [CrossRef]
- He, J.; Wan, Y.; Feng, L.; Ai, J.; Wang, Y. An integrated data envelopment analysis and emergy-based ecological footprint methodology in evaluating sustainable development, a case study of Jiangsu Province, China. Ecol. Indic. 2016, 70, 23–34. [Google Scholar] [CrossRef]
- Tang, D.; Tang, J.; Xiao, Z. Environmental regulation efficiency and total factor productivity-Effect analysis based on Chinese data from 2003 to 2013. Ecol. Indic. 2017, 73, 312–318. [Google Scholar] [CrossRef]
- Vlontzos, G.; Pardalos, P.M. Assess and prognosticate green house gas emissions from agricultural production of EU countries, by implementing, DEA Window analysis and artificial neural networks. Renew. Sustain. Energy Rev. 2017, 76, 155–162. [Google Scholar] [CrossRef]
- Cooka, W.D. Data envelopment analysis (DEA)—Thirty years on. Eur. J. Oper. Res. 2009, 192, 1–17. [Google Scholar] [CrossRef]
- Tone, K. A slacks-based measure of efficiency in data envelopment analysis. Eur. J. Oper. Res. 2001, 130, 498–509. [Google Scholar] [CrossRef] [Green Version]
- Andersen, P.; Petersen, N.C. A Procedure for Ranking Efficient Units in Data Envelopment Analysis. Manag. Sci. 1993, 39, 1261–1264. [Google Scholar] [CrossRef]
- Hailu, A. Nonparametric Productivity Analysis with Undesirable Outputs: Reply. Am. J. Agric. Econ. 2001, 85, 1075–1077. [Google Scholar] [CrossRef]
- Seiford, L.M.; Zhu, J. A response to comments on modeling undesirable factors in efficiency evaluation. Eur. J. Oper. Res. 2005, 161, 579–581. [Google Scholar] [CrossRef]
- Tone, K.; Tsutsui, M. Dynamic DEA: A slacks-based measure approach. Omega. 2010, 38, 145–156. [Google Scholar] [CrossRef]
- Fare, R.; Grosskopf, S.; Pasurkajr, C. Environmental production functions and environmental directional distance functions. Energy 2007, 32, 1055–1066. [Google Scholar] [CrossRef]
- Zhou, C.; Shi, C.; Wang, S.; Zhang, G. Estimation of eco-efficiency and its influencing factors in Guangdong province based on Super-SBM and panel regression models. Ecol. Indic. 2018, 86, 67–80. [Google Scholar] [CrossRef]
- Guo, H.; Zhao, Y.; Niu, T.; Tsui, K.L. Hong Kong Hospital Authority resource efficiency evaluation: Via a novel DEA-Malmquist model and Tobit regression model. PLoS ONE 2017, 12, e0184211. [Google Scholar] [CrossRef] [PubMed]
- State Statistical Bureau. China Statistical Yearbook 2007; China Statistic Press: Beijing, China, 2007. (In Chinese)
- State Statistical Bureau. China Statistical Yearbook 2008; China Statistic Press: Beijing, China, 2008. (In Chinese)
- State Statistical Bureau. China Statistical Yearbook 2009; China Statistic Press: Beijing, China, 2009. (In Chinese)
- State Statistical Bureau. China Statistical Yearbook 2010; China Statistic Press: Beijing, China, 2010. (In Chinese)
- State Statistical Bureau. China Statistical Yearbook 2011; China Statistic Press: Beijing, China, 2011. (In Chinese)
- State Statistical Bureau. China Statistical Yearbook 2012; China Statistic Press: Beijing, China, 2012. (In Chinese)
- State Statistical Bureau. China Statistical Yearbook 2013; China Statistic Press: Beijing, China, 2013. (In Chinese)
- State Statistical Bureau. China Statistical Yearbook 2014; China Statistic Press: Beijing, China, 2014. (In Chinese)
- State Statistical Bureau. China Statistical Yearbook 2015; China Statistic Press: Beijing, China, 2015. (In Chinese)
- State Statistical Bureau. China Statistical Yearbook 2016; China Statistic Press: Beijing, China, 2016. (In Chinese)
- State Statistical Bureau. China Statistical Yearbook on Environment 2007; China Statistic Press: Beijing, China, 2004. (In Chinese)
- State Statistical Bureau. China Statistical Yearbook on Environment 2008; China Statistic Press: Beijing, China, 2005. (In Chinese)
- State Statistical Bureau. China Statistical Yearbook on Environment 2009; China Statistic Press: Beijing, China, 2006. (In Chinese)
- State Statistical Bureau. China Statistical Yearbook on Environment 2010; China Statistic Press: Beijing, China, 2007. (In Chinese)
- State Statistical Bureau. China Statistical Yearbook on Environment 2011; China Statistic Press: Beijing, China, 2008. (In Chinese)
- State Statistical Bureau. China Statistical Yearbook on Environment 2012; China Statistic Press: Beijing, China, 2009. (In Chinese)
- State Statistical Bureau. China Statistical Yearbook on Environment 2013; China Statistic Press: Beijing, China, 2010. (In Chinese)
- State Statistical Bureau. China Statistical Yearbook on Environment 2014; China Statistic Press: Beijing, China, 2011. (In Chinese)
- State Statistical Bureau. China Statistical Yearbook on Environment 2015; China Statistic Press: Beijing, China, 2012. (In Chinese)
- State Statistical Bureau. China Statistical Yearbook on Environment 2016; China Statistic Press: Beijing, China, 2013. (In Chinese)
- State Statistical Bureau. China Energy Statistical Yearbook 2007; China Statistic Press: Beijing, China, 2014. (In Chinese)
- State Statistical Bureau. China Energy Statistical Yearbook 2008; China Statistic Press: Beijing, China, 2014. (In Chinese)
- State Statistical Bureau. China Energy Statistical Yearbook 2009; China Statistic Press: Beijing, China, 2014. (In Chinese)
- State Statistical Bureau. China Energy Statistical Yearbook 2010; China Statistic Press: Beijing, China, 2014. (In Chinese)
- State Statistical Bureau. China Energy Statistical Yearbook 2011; China Statistic Press: Beijing, China, 2014. (In Chinese)
- State Statistical Bureau. China Energy Statistical Yearbook 2012; China Statistic Press: Beijing, China, 2014. (In Chinese)
- State Statistical Bureau. China Energy Statistical Yearbook 2013; China Statistic Press: Beijing, China, 2014. (In Chinese)
- State Statistical Bureau. China Energy Statistical Yearbook 2014; China Statistic Press: Beijing, China, 2014. (In Chinese)
- State Statistical Bureau. China Energy Statistical Yearbook 2015; China Statistic Press: Beijing, China, 2014. (In Chinese)
- State Statistical Bureau. China Energy Statistical Yearbook 2016; China Statistic Press: Beijing, China, 2014. (In Chinese)
Figure 1.
Spatio-temporal evolution map of comprehensive technical efficiency in Yangzte River Economic Belt (YERB) from 2006 to 2015.
Figure 1.
Spatio-temporal evolution map of comprehensive technical efficiency in Yangzte River Economic Belt (YERB) from 2006 to 2015.


Figure 2.
The annual variation line chart of the YERB’s overall TFPC and its decomposition index.


Table 1.
Summary evaluation of undesired output treatments.
| Processing Method | Representative Figure | Evaluation | |
|---|---|---|---|
| 1 | Undesirable output is regarded as an input variable | Hailu et al. (2001) [19] | The disadvantage of treating undesirable outputs as input variables is that the method is inconsistent with reality production process. |
| 2 | Multiplying undesired output by −1 | Seiford et al. (2005) [20] | The problem of undesirable output is better solved, but under the influence of strong convexity constraint, the method can only be evaluated in the case of variable scale returns. |
| 3 | Non-radial treatment | Tone (2010) [21] | It effectively solves the problem of non-desirable output and improves the accuracy of evaluation. However, when there are multiple DMU effective, it is difficult to further evaluate the effective DMU. |
| 4 | Distance function method | Fare et al. (2007) [22] | It effectively solves the problem of undesirable outputs but cannot measure input and output slack variables. |
Table 2.
Evaluation index system for regional sustainable development.
| Type | First Level Index | Second Level Index | Third Level Index |
|---|---|---|---|
| Input | Natural resource consumption (X1) | Land (X11) | Land area per capita (X111) |
| Water (X12) | Per capita water consumption (X121) | ||
| Energy (X13) | Total energy consumption per capita (X131) | ||
| Social resource consumption (X2) | Capital (X21) | Investment in environmental pollution control accounts for GDP share (X211) | |
| Investment in fixed assets per capita (X212) | |||
| Labor (X22) | Employment ratio (X221) | ||
| Desirable output | Social development (Y1) | Urban development (Y11) | Urban road area per capita (Y111) |
| Green coverage area per capita (Y112) | |||
| Urban area per capita (Y113) | |||
| Urban population ratio (Y114) | |||
| Education, technology, culture and health care (Y12) | Three kinds of patent authorization per capita in China (Y121) | ||
| Number of health workers per 10000 people (Y122) | |||
| Consumption of education, culture and entertainment per capita (Y123) | |||
| Number of full-time teachers in Colleges and universities per ten thousand people (Y124) | |||
| Social Security (Y13) | Basic old-age insurance coverage ratio (Y131) | ||
| Unemployment insurance coverage ratio (Y132) | |||
| Insurance ratio of medical insurance for urban employees (Y133) | |||
| Insurance ratio of industrial injury insurance (Y134) | |||
| Birth insurance coverage ratio (Y135) | |||
| Living Standards (Y14) | consumption expenditure per capita (Y141) | ||
| Disposable income per capita (Y142) | |||
| Economic development (Y2) | Economic Growth (Y21) | GDP growth rate (Y211) | |
| Economic Structure (Y22) | Third industry share (Y221) | ||
| Economic Scale (Y23) | GDP per capita (Y231) | ||
| Undesirable output | Pollution, disasters and accidents (Y3) | Water Pollution (Y31) | Wastewater discharge per capita (Y311) |
| Air Pollution (Y32) | SO2 emissions per capita (Y321) | ||
| Smoke and dust emissions per capita (Y322) | |||
| Natural Disasters (Y33) | Direct economic losses natural disasters per capita (Y331) | ||
| Traffic Accidents (Y34) | Direct economic loss traffic accident per capita (Y341) |
Table 3.
Evaluation index weights.
| Index | X11 | X12 | X13 | X21 | X22 | Y11 | Y12 | Y13 | Y14 | Y21 | Y22 | Y23 |
| Objective weight | 0.689 | 0.168 | 0.143 | 0.179 | 0.821 | 0.251 | 0.248 | 0.249 | 0.252 | 0.334 | 0.336 | 0.331 |
| Subjective weight | 0.200 | 0.350 | 0.450 | 0.500 | 0.500 | 0.250 | 0.250 | 0.250 | 0.250 | 0.300 | 0.300 | 0.400 |
| Final Weight | 0.528 | 0.225 | 0.247 | 0.179 | 0.821 | 0.251 | 0.248 | 0.249 | 0.252 | 0.301 | 0.302 | 0.397 |
| Index | Y31 | Y32 | Y33 | Y34 | X111 | X121 | X131 | X211 | X212 | X221 | Y111 | Y112 |
| Objective weight | 0.116 | 0.102 | 0.435 | 0.346 | 1.000 | 1.000 | 1.000 | 0.648 | 0.352 | 1.000 | 0.205 | 0.428 |
| Subjective weight | 0.250 | 0.250 | 0.250 | 0.250 | 1.000 | 1.000 | 1.000 | 0.200 | 0.800 | 1.000 | 0.200 | 0.200 |
| Final Weight | 0.116 | 0.102 | 0.435 | 0.346 | 1.000 | 1.000 | 1.000 | 0.315 | 0.685 | 1.000 | 0.173 | 0.361 |
| Index | Y113 | Y114 | Y121 | Y122 | Y123 | Y124 | Y131 | Y132 | Y133 | Y134 | Y135 | Y141 |
| Objective weight | 0.314 | 0.054 | 0.032 | 0.555 | 0.310 | 0.103 | 0.195 | 0.203 | 0.168 | 0.223 | 0.210 | 0.469 |
| Subjective weight | 0.300 | 0.300 | 0.200 | 0.300 | 0.200 | 0.300 | 0.200 | 0.200 | 0.200 | 0.200 | 0.200 | 0.500 |
| Final Weight | 0.398 | 0.068 | 0.024 | 0.626 | 0.233 | 0.116 | 0.195 | 0.203 | 0.168 | 0.223 | 0.210 | 0.469 |
| Index | Y142 | Y211 | Y221 | Y232 | Y311 | Y321 | Y322 | Y331 | Y341 | |||
| Objective weight | 0.531 | 1.000 | 1.000 | 1.000 | 1.000 | 0.749 | 0.251 | 1.000 | 1.000 | |||
| Subjective weight | 0.500 | 1.000 | 1.000 | 1.000 | 1.000 | 0.600 | 0.400 | 1.000 | 1.000 | |||
| Final weight | 0.531 | 1.000 | 1.000 | 1.000 | 1.000 | 0.818 | 0.182 | 1.000 | 1.000 |
Table 4.
Analysis of static projection of inefficiency provinces and municipalities.
| Input Redundancy Rate (%) | Desirable Output Insufficiency Rate (%) | Undesirable Output Redundancy Rate (%) | |||
|---|---|---|---|---|---|
| Natural Resource Consumption | Social Resource Consumption | Social Development | Economic Development | Pollution, Disasters and Accidents | |
| Jiangxi | −110.98 | 0.00 | 35.99 | 0.00 | −342.79 |
| Hubei | −90.53 | 0.00 | 34.14 | 0.00 | −329.21 |
| Yunnan | −117.71 | 0.00 | 17.34 | 0.00 | −179.79 |
| Anhui | −57.24 | 0.00 | 10.60 | 0.00 | −384.73 |
| Jiangsu | −47.76 | −3.61 | 4.52 | 0.00 | −310.94 |
| Zhejiang | −16.02 | −16.53 | 0.00 | 10.79 | −456.50 |
| Chongqing | −35.95 | −1.01 | 27.23 | 0.00 | −93.15 |
| Hunan | −29.13 | 0.00 | 10.66 | 0.00 | −239.66 |
Table 5.
Annual variation of the YERB’s overall change index of total factor productivity (TFPC) and its decomposition index.
Table 5.
Annual variation of the YERB’s overall change index of total factor productivity (TFPC) and its decomposition index.
| Period | SEC | PTEC | EC | TC | TFPC |
|---|---|---|---|---|---|
| 2006–2007 | 0.976 | 0.978 | 0.952 | 1.003 | 0.953 |
| 2007–2008 | 1.053 | 0.973 | 1.027 | 1.264 | 1.301 |
| 2008–2009 | 0.942 | 0.977 | 0.916 | 0.740 | 0.677 |
| 2009–2010 | 1.054 | 1.001 | 1.053 | 1.111 | 1.162 |
| 2010–2011 | 0.941 | 1.001 | 0.939 | 0.954 | 0.895 |
| 2011–2012 | 0.897 | 1.019 | 0.906 | 1.001 | 0.908 |
| 2012–2013 | 1.041 | 1.031 | 1.070 | 1.056 | 1.116 |
| 2013–2014 | 1.002 | 1.034 | 0.971 | 0.974 | 0.940 |
| 2014–2015 | 0.987 | 1.057 | 0.987 | 0.970 | 0.957 |
| mean | 0.988 | 1.008 | 0.980 | 1.008 | 0.990 |
Table 6.
Annual variation of the YERB provinces’ and cities’ TFPC and its decomposition index.
| 2006–2007 | 2010–2011 | |||||||||
| SEC | PTEC | EC | TC | TFPC | SEC | PTEC | EC | TC | TFPC | |
| Anhui | 1.086 | 0.913 | 0.992 | 0.998 | 0.990 | 0.994 | 0.990 | 0.985 | 0.912 | 0.898 |
| Guizhou | 0.938 | 1.073 | 1.006 | 0.983 | 0.989 | 1.095 | 0.882 | 0.967 | 0.935 | 0.904 |
| Hubei | 1.005 | 1.010 | 1.015 | 0.994 | 1.010 | 0.936 | 0.916 | 0.858 | 0.946 | 0.811 |
| Hunan | 1.159 | 0.865 | 1.003 | 1.026 | 1.029 | 0.957 | 0.864 | 0.827 | 0.972 | 0.804 |
| Jiangsu | 0.959 | 0.983 | 0.943 | 1.004 | 0.946 | 0.989 | 0.937 | 0.927 | 0.998 | 0.925 |
| Jiangxi | 0.956 | 0.975 | 0.932 | 1.025 | 0.955 | 0.903 | 1.037 | 0.936 | 0.981 | 0.918 |
| Shanghai | 1.052 | 1.009 | 1.062 | 0.943 | 1.001 | 0.997 | 1.044 | 1.041 | 0.941 | 0.980 |
| Sichuan | 0.995 | 0.967 | 0.963 | 1.019 | 0.981 | 0.940 | 1.064 | 1.000 | 0.956 | 0.956 |
| Yunnan | 0.662 | 0.977 | 0.647 | 1.018 | 0.658 | 0.943 | 1.195 | 1.127 | 0.947 | 1.067 |
| Zhejiang | 0.986 | 0.979 | 0.965 | 1.020 | 0.984 | 0.722 | 0.987 | 0.713 | 1.004 | 0.716 |
| Chongqing | 0.939 | 1.005 | 0.944 | 1.001 | 0.944 | 0.875 | 1.089 | 0.952 | 0.905 | 0.862 |
| mean | 0.976 | 0.978 | 0.952 | 1.003 | 0.953 | 0.941 | 1.001 | 0.939 | 0.954 | 0.895 |
| 2014–2015 | Mean | |||||||||
| SEC | PTEC | EC | TC | TFPC | SEC | PTEC | EC | TC | TFPC | |
| Anhui | 0.934 | 0.924 | 0.863 | 0.968 | 0.835 | 0.963 | 0.992 | 0.956 | 0.995 | 0.959 |
| Guizhou | 0.875 | 1.177 | 1.030 | 0.982 | 1.011 | 1.013 | 1.008 | 1.004 | 0.981 | 0.973 |
| Hubei | 0.969 | 1.096 | 1.062 | 0.955 | 1.014 | 0.970 | 0.963 | 0.936 | 1.012 | 0.954 |
| Hunan | 0.994 | 0.881 | 0.875 | 0.995 | 0.871 | 0.994 | 0.994 | 0.986 | 0.971 | 0.959 |
| Jiangsu | 0.983 | 1.073 | 1.055 | 0.944 | 0.995 | 0.988 | 0.978 | 0.967 | 1.064 | 1.034 |
| Jiangxi | 0.960 | 1.030 | 0.989 | 0.952 | 0.941 | 0.959 | 1.004 | 0.963 | 1.019 | 0.980 |
| Shanghai | 1.656 | 0.506 | 0.838 | 0.990 | 0.829 | 1.038 | 1.093 | 1.037 | 1.039 | 1.059 |
| Sichuan | 1.002 | 0.968 | 0.970 | 1.001 | 0.971 | 1.016 | 1.040 | 1.047 | 0.943 | 0.978 |
| Yunnan | 0.664 | 1.692 | 1.124 | 0.994 | 1.117 | 0.962 | 1.045 | 0.985 | 0.987 | 1.011 |
| Zhejiang | 0.999 | 0.985 | 0.983 | 0.964 | 0.948 | 1.006 | 0.957 | 0.951 | 1.046 | 0.996 |
| Chongqing | 0.822 | 1.297 | 1.067 | 0.931 | 0.993 | 0.958 | 1.013 | 0.959 | 1.033 | 0.986 |
| mean | 0.987 | 1.057 | 0.987 | 0.970 | 0.957 | 0.988 | 1.008 | 0.980 | 1.008 | 0.990 |
© 2018 by the authors. Licensee MDPI, Basel, Switzerland. This article is an open access article distributed under the terms and conditions of the Creative Commons Attribution (CC BY) license (http://creativecommons.org/licenses/by/4.0/).
Share and Cite
MDPI and ACS Style
Li, Z.; Tang, D.; Han, M.; Bethel, B.J. Comprehensive Evaluation of Regional Sustainable Development Based on Data Envelopment Analysis. Sustainability 2018, 10, 3897. https://0-doi-org.brum.beds.ac.uk/10.3390/su10113897
AMA Style
Li Z, Tang D, Han M, Bethel BJ. Comprehensive Evaluation of Regional Sustainable Development Based on Data Envelopment Analysis. Sustainability. 2018; 10(11):3897. https://0-doi-org.brum.beds.ac.uk/10.3390/su10113897
Chicago/Turabian StyleLi, Zhijiang, Decai Tang, Mang Han, and Brandon J. Bethel. 2018. "Comprehensive Evaluation of Regional Sustainable Development Based on Data Envelopment Analysis" Sustainability 10, no. 11: 3897. https://0-doi-org.brum.beds.ac.uk/10.3390/su10113897
Note that from the first issue of 2016, this journal uses article numbers instead of page numbers. See further details here.