1. Introduction
Agricultural residues possess a significant unused potential in renewable energy, where their exploitation may be achieved by raising awareness among local stakeholders [
1,
2]. To date, research has tackled the issue of their utilization, highlighting both the positive and weak points connected to their usage and providing recommendations for the proper set up of the logistic chain [
3,
4,
5,
6]. Supporting such a business is therefore fundamental and decision support systems (DSS) and decision support tools (DST) can assist stakeholders. DSTs can be dynamic software tools that suggest the optimal decision path as user inputs vary by acting as information sources [
7]. Mobile communication technologies and tools, with the subsequent availability of cloud-based data storage integration and retrieval, make the inventory and monitoring of data almost instantaneous [
8]. Computational analysis or monitoring tools are becoming increasingly readier to use [
9] and also enable the involvement of farmers in the research process [
10,
11].
The management of woody crops (orchards, olive groves and vineyards), produces significant quantities of woody residues [
12]. These are usually windrowed between the rows of trees to then be chipped/ground for mulching into the orchard or taken apart for on-site combustion. Both options are an extra cost for the farmer, ranging from 100 € ha
−1 to 200 € ha
−1 [
13], making them more of a disposal problem than an opportunity for additional revenue. Just as for forest residues, collecting and using woody residues from agriculture as fuel results in an excellent energy balance, a net reduction in pollutant emission and a benefit for global warming control [
14,
15]. Moreover, several studies confirm agricultural residues in general, and vineyard by-products in particular, may represent a targeted source of fuel in European countries [
16], such that the development of dedicated harvesting equipment enhances the technical sustainability of fuel procurement systems based on woody crops [
17,
18]. As aforementioned, to date, bioenergy production has not considered biomass from fruit tree plantations because of unsolved technical problems in harvesting or a lack of information on the amounts and the qualities of the residues. Harvesting and logistics account for the most expensive costs in this biomass supply chain. Knowing the real amounts, the characteristics and the places of the available residual biomass in each orchard, would therefore enable more specific planning and cheaper logistics operations.
This work presents the background studies to develop an app in which the aim is to provide a technical support tool to help farmers understand the heating potential of pruning and to enable them to organize data from their own orchards. The app enables assessment of the energy potential of the pruning within the frame of the farm energy balance, sharing this information at a district level to match the availability of biomass with the heating energy balance of agro-industrial buildings (e.g., barns, warehouses, greenhouses). A local supply chain can be created that would greatly benefit from a traceable system that could be used for quality control and the effective management of pruning residues. The result would be an improved efficiency of the whole system through actions taken to promote using agricultural residues for renewable energy production [
19], leading to an increased level of sustainability at the district level (i.e., cooperatives, typical production areas, agricultural production companies, etc.) [
20]. Indeed, it has been reported that:
Sharing data and information among the actors of the supply chain has a fundamental role [
21];
projects at both district and household level are vital towards sustainability because of the ability to scale-up their impacts [
22];
exploiting woody biomass for self-consumption is a valid alternative to conventional heating systems [
23].
Starting from the building energy consumption, the DST calculates the biofuel required, and if needed, the additional biofuel or conventional fossil fuels to be purchased outside the district to cover the requirement. At the current development stage, to achieve the full optimization of the supply chain, the DST requires the end user to know the energy consumption of the building; nevertheless, being able to deal with different levels of uncertainty creates a way to indicate potential drawbacks during the setup of the supply chain.
2. Materials and Methods
To allow the matching of biofuel availability with the energy required to heat the buildings, the tasks of the research are to:
Identify residual biomass availability;
Assess available thermal energy;
Define the heatable surface area of buildings (residential and industrial) and greenhouses;
Possibly extend the tool to other European countries.
2.1. Identification of the Residual Biomass Availability
Several factors (i.e., the planting pattern, the variety, the shape of the plants, the use of irrigation, plant age and size and the frequency of pruning) affect the quantity of residual biomass from pruning operations. To assess the quantity of available biomass, the average quantities of biomass (metric tons of dry matter (d.m.) per hectare) resulting from the annual pruning of fruit trees were considered.
Table 1 reports the average quantities of pruning residues from eight woody crops together with the related sources.
These data were organized in a drop-down menu: After selecting the species they are interested in, the user can input the area of surface (hectares) the crop grows on. Regarding the harvesting efficiency, it varies greatly in relation to machine type, pick-up settings and the cultivated plant (0.4 to 18%) [
30,
31]. Because of this, the default value of 90% was chosen. Calculations then automatically assess the quantity of available biomass (t year
−1) with the moisture level set at 15%.
2.2. Assessment of Available Thermal Energy
The Lower Heating Value (LHV) of woody biomass ranges between 4.1 and 4.3 kWh kg
−1 [
32,
33]. Given this, to take into account all of the possible differences among the diverse biomasses resulting from the natural variability of the growing conditions, together with the worst-case scenario, the constant value of 4.00 kWh kg
−1 was chosen as the reference LHV for all the considered crops. This value, multiplied by the yearly available biomass (t year
−1), results in the annual potential energy available from pruning (kWh year
−1).
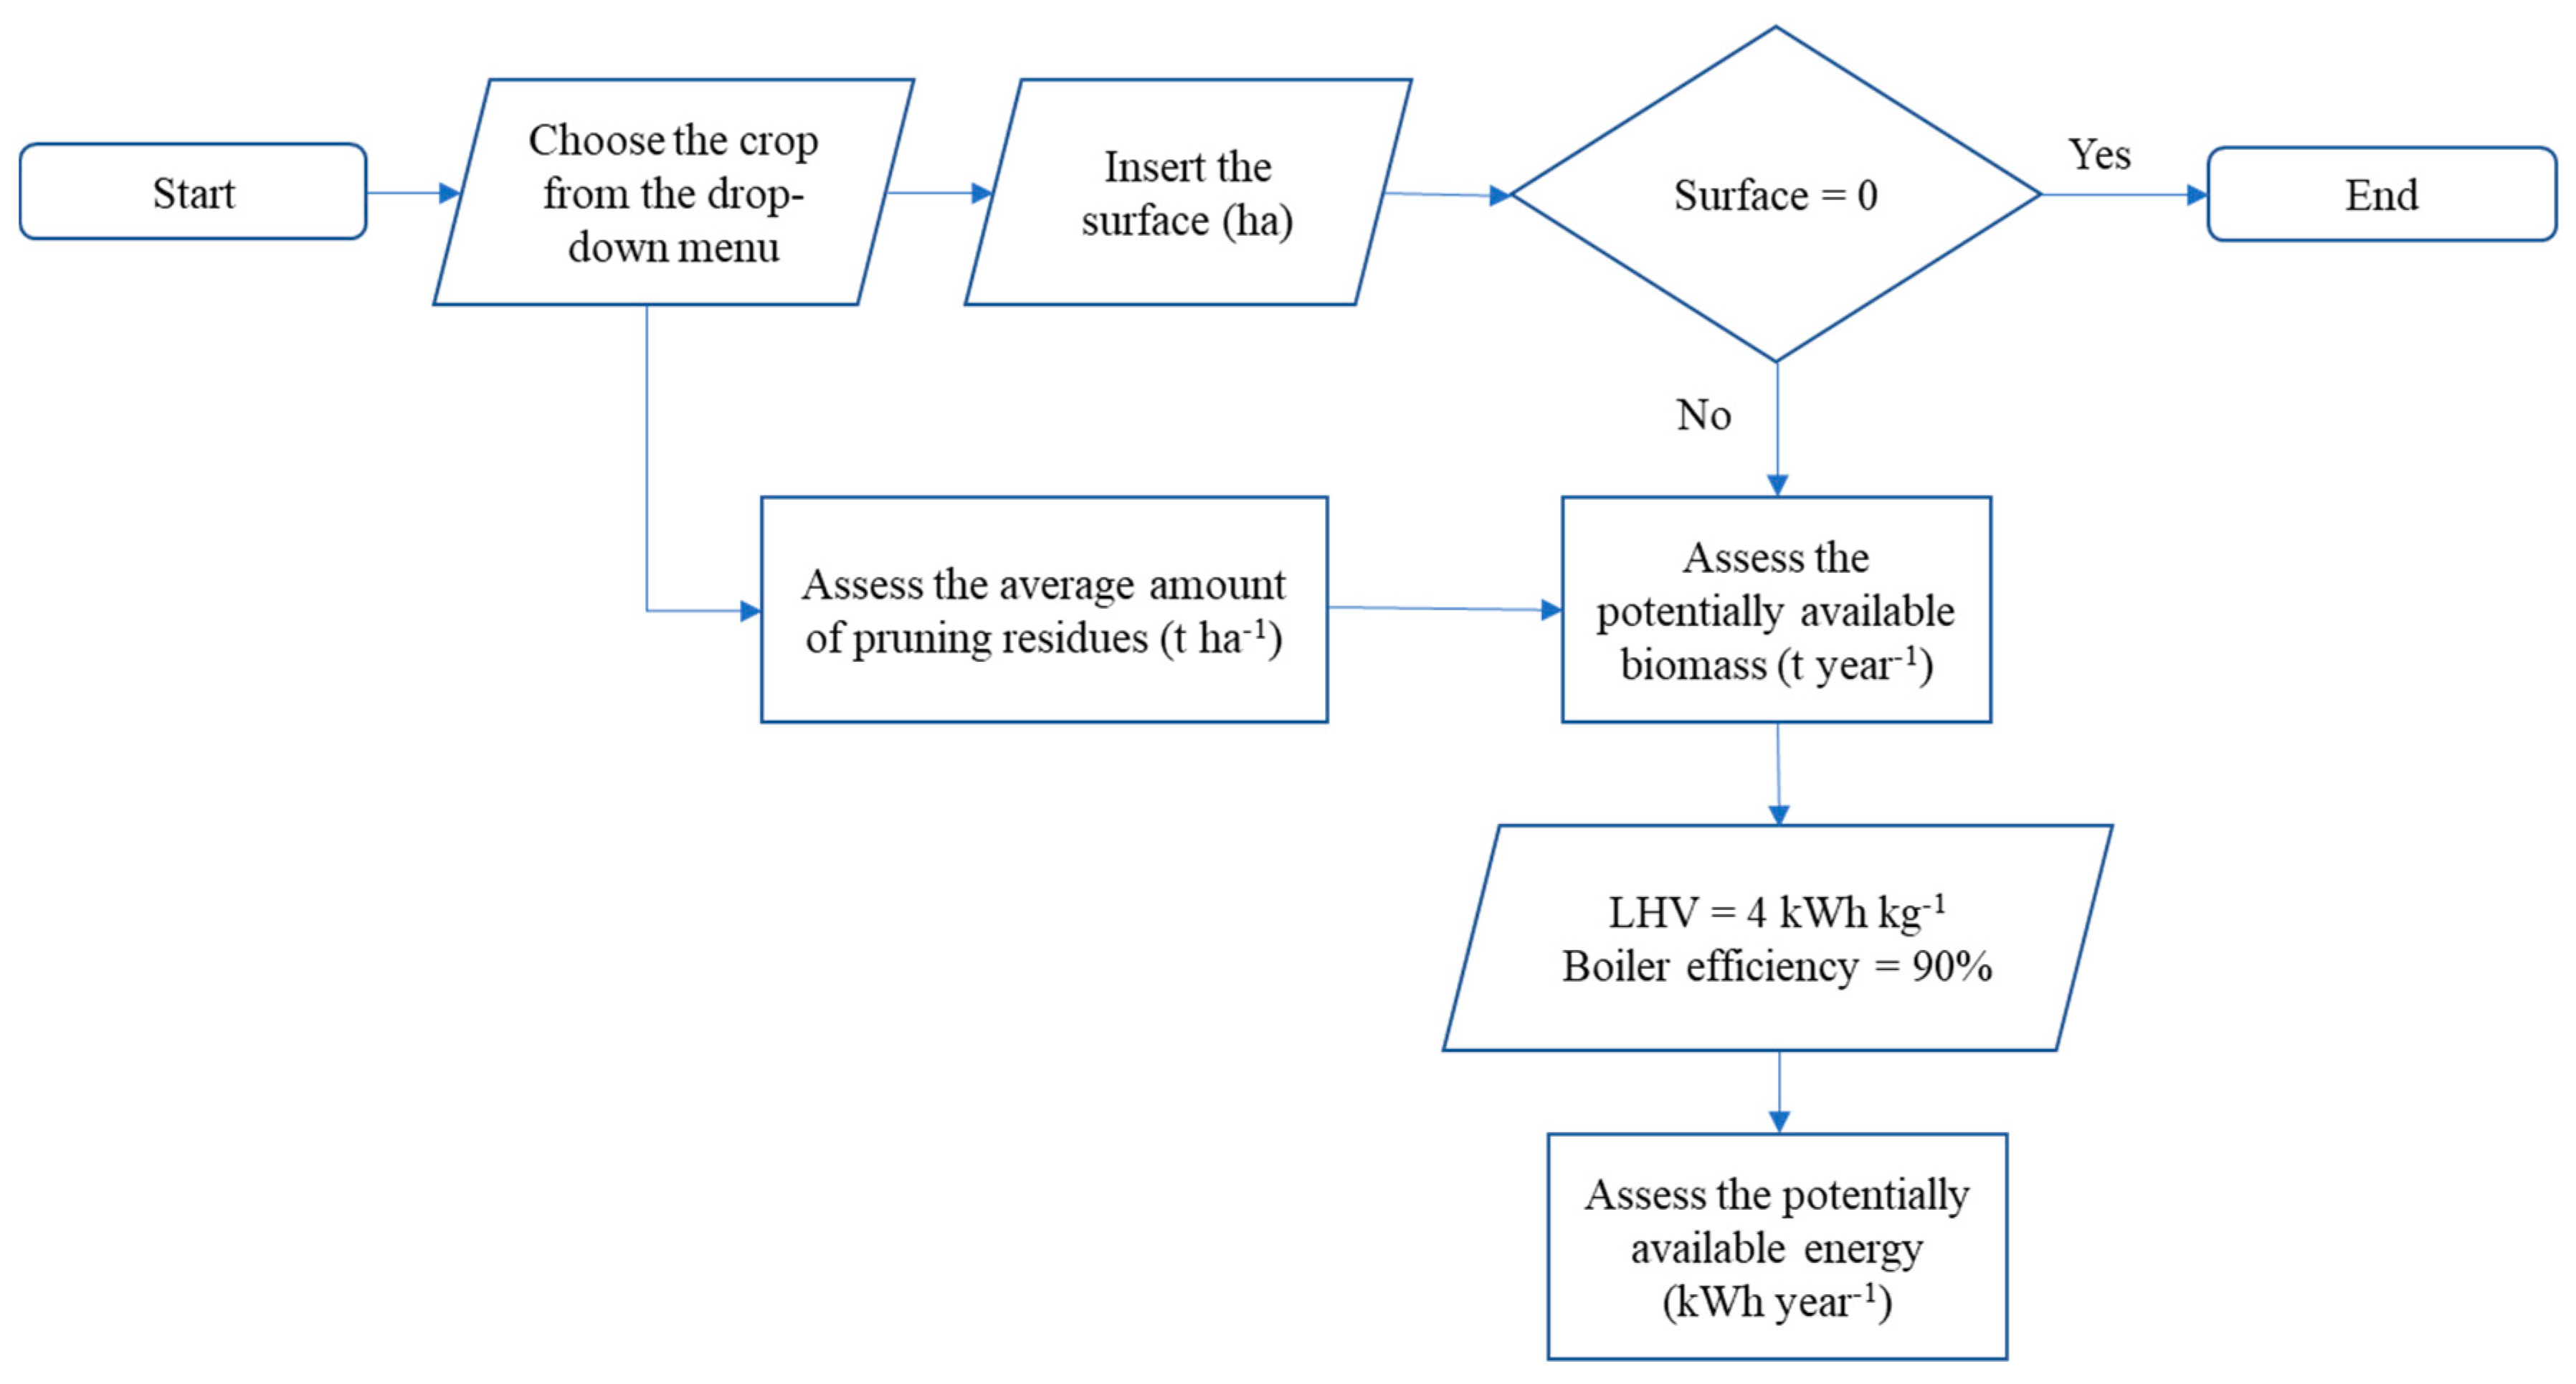
The efficiency of a biomass wood boiler has been considered equal to 90%, a value adopted since current regulatory assessment in Italy on the efficiency of a woody biomass boiler specifies two levels of subsidies on varying the Nominal Power (NP) of the heating plant. Following the certification of heating plants in compliance with the UNI EN 303-5 standard [
34], it is possible to obtain a 50% fiscal subsidy if the boiler efficiency is >70% [
35]. This subsidy may increase up to 65% if the boiler efficiency is greater than 87 + log (NP) [
36]. Accordingly, retaining the boiler size class lower than 100 kW as appropriate at the farm level, it seems fundamental that boiler efficiency is at least 90%. A flowchart was created to better describe this phase (
Figure 1).
2.3. Definition of the Heatable Surface Area of Buildings (Residential and Industrial) and Greenhouses
Starting from the amount of energy potentially available from pruning residues, the first step the tool makes is to calculate the maximum surface area the user can heat without any use of fossil fuels in buildings (both residential and industrial) and greenhouses.
2.3.1. Residential and Agro-Industrial Buildings
For a given house or apartment, the maximum heatable surface results from two parameters: The apartment or building energy classification and the Heating Degree Day (HDD) of the specific municipality the home is located in. In detail, the indications of the Italian Decree n. 192 of 19 August 2005 (“Buildings classification”) [
37], helped in calculating the energy requirements per square meter on the basis of the surface/volume (S/V) ratio defined by the outside dispersing surface (S, m
2) and the total heated volume (V, m
3). The S/V ratio ranges from 0.2 to 0.9 and because of this calculations were made considering the average S/V value of 0.55. Building energy classification prescribes eight classes (from A+, for the best insulation, to G when insulation is very low). To improve the user interface and simplify the tool application, the eight classes have been summarized into three insulation levels:
Low: The mean value for a building in class G and F;
Average: A mean value between C, D and E;
High: The mean value of A+, A and B.
The outcome of this stage was refined further by considering the HDD value (the number of degrees that a day’s average temperature is below 18 °C, namely the temperature below which residential buildings need to be heated). Increasing values of HDD define six climatic zones (labelled from A for the lowest to F for maximum heating need) [
38].
Table 2 shows the results of these calculations.
A drop-down menu in the spreadsheet organises the list of all the municipalities in Italy together with their HDD value and with the label of the climatic zone. The DST is therefore preloaded with a list such that when the user chooses the name of the municipality where the building is located, the tool automatically gives the following information:
For industrial buildings, the organisation of calculations follows the same steps. The difference is that the tool reports the energy requirement for the heatable volume (kWh year
−1 m
−3,
Table 3) instead of the surface area, considering the greater height variability in agro-industrial buildings.
If the climatic zone of the municipality and the insulation level play the same role as before, it is not possible to operate the same standardization because of two reasons, firstly the different heights these buildings may have and secondly the differences in the performed working tasks that sometimes cause the building to stay open or cool down. Here, the well-being temperature for sedentary activities is usually between 20–23 °C, but in the case of standing or heavy work it can range from 12–19 °C [
39]. Because of this, based on the experience of technicians, an approximate quantification of the maximum heatable volume was achieved considering that the energy requirement of an industrial building is twice that of a residential unit (to be considered merely indicative).
As described above, the information is attainable from the drop-down menu. Once the user selects the municipality, all the information related to it (province, HDD, climatic zone and thermal energy requirements for low, medium and high insulation levels) appears.
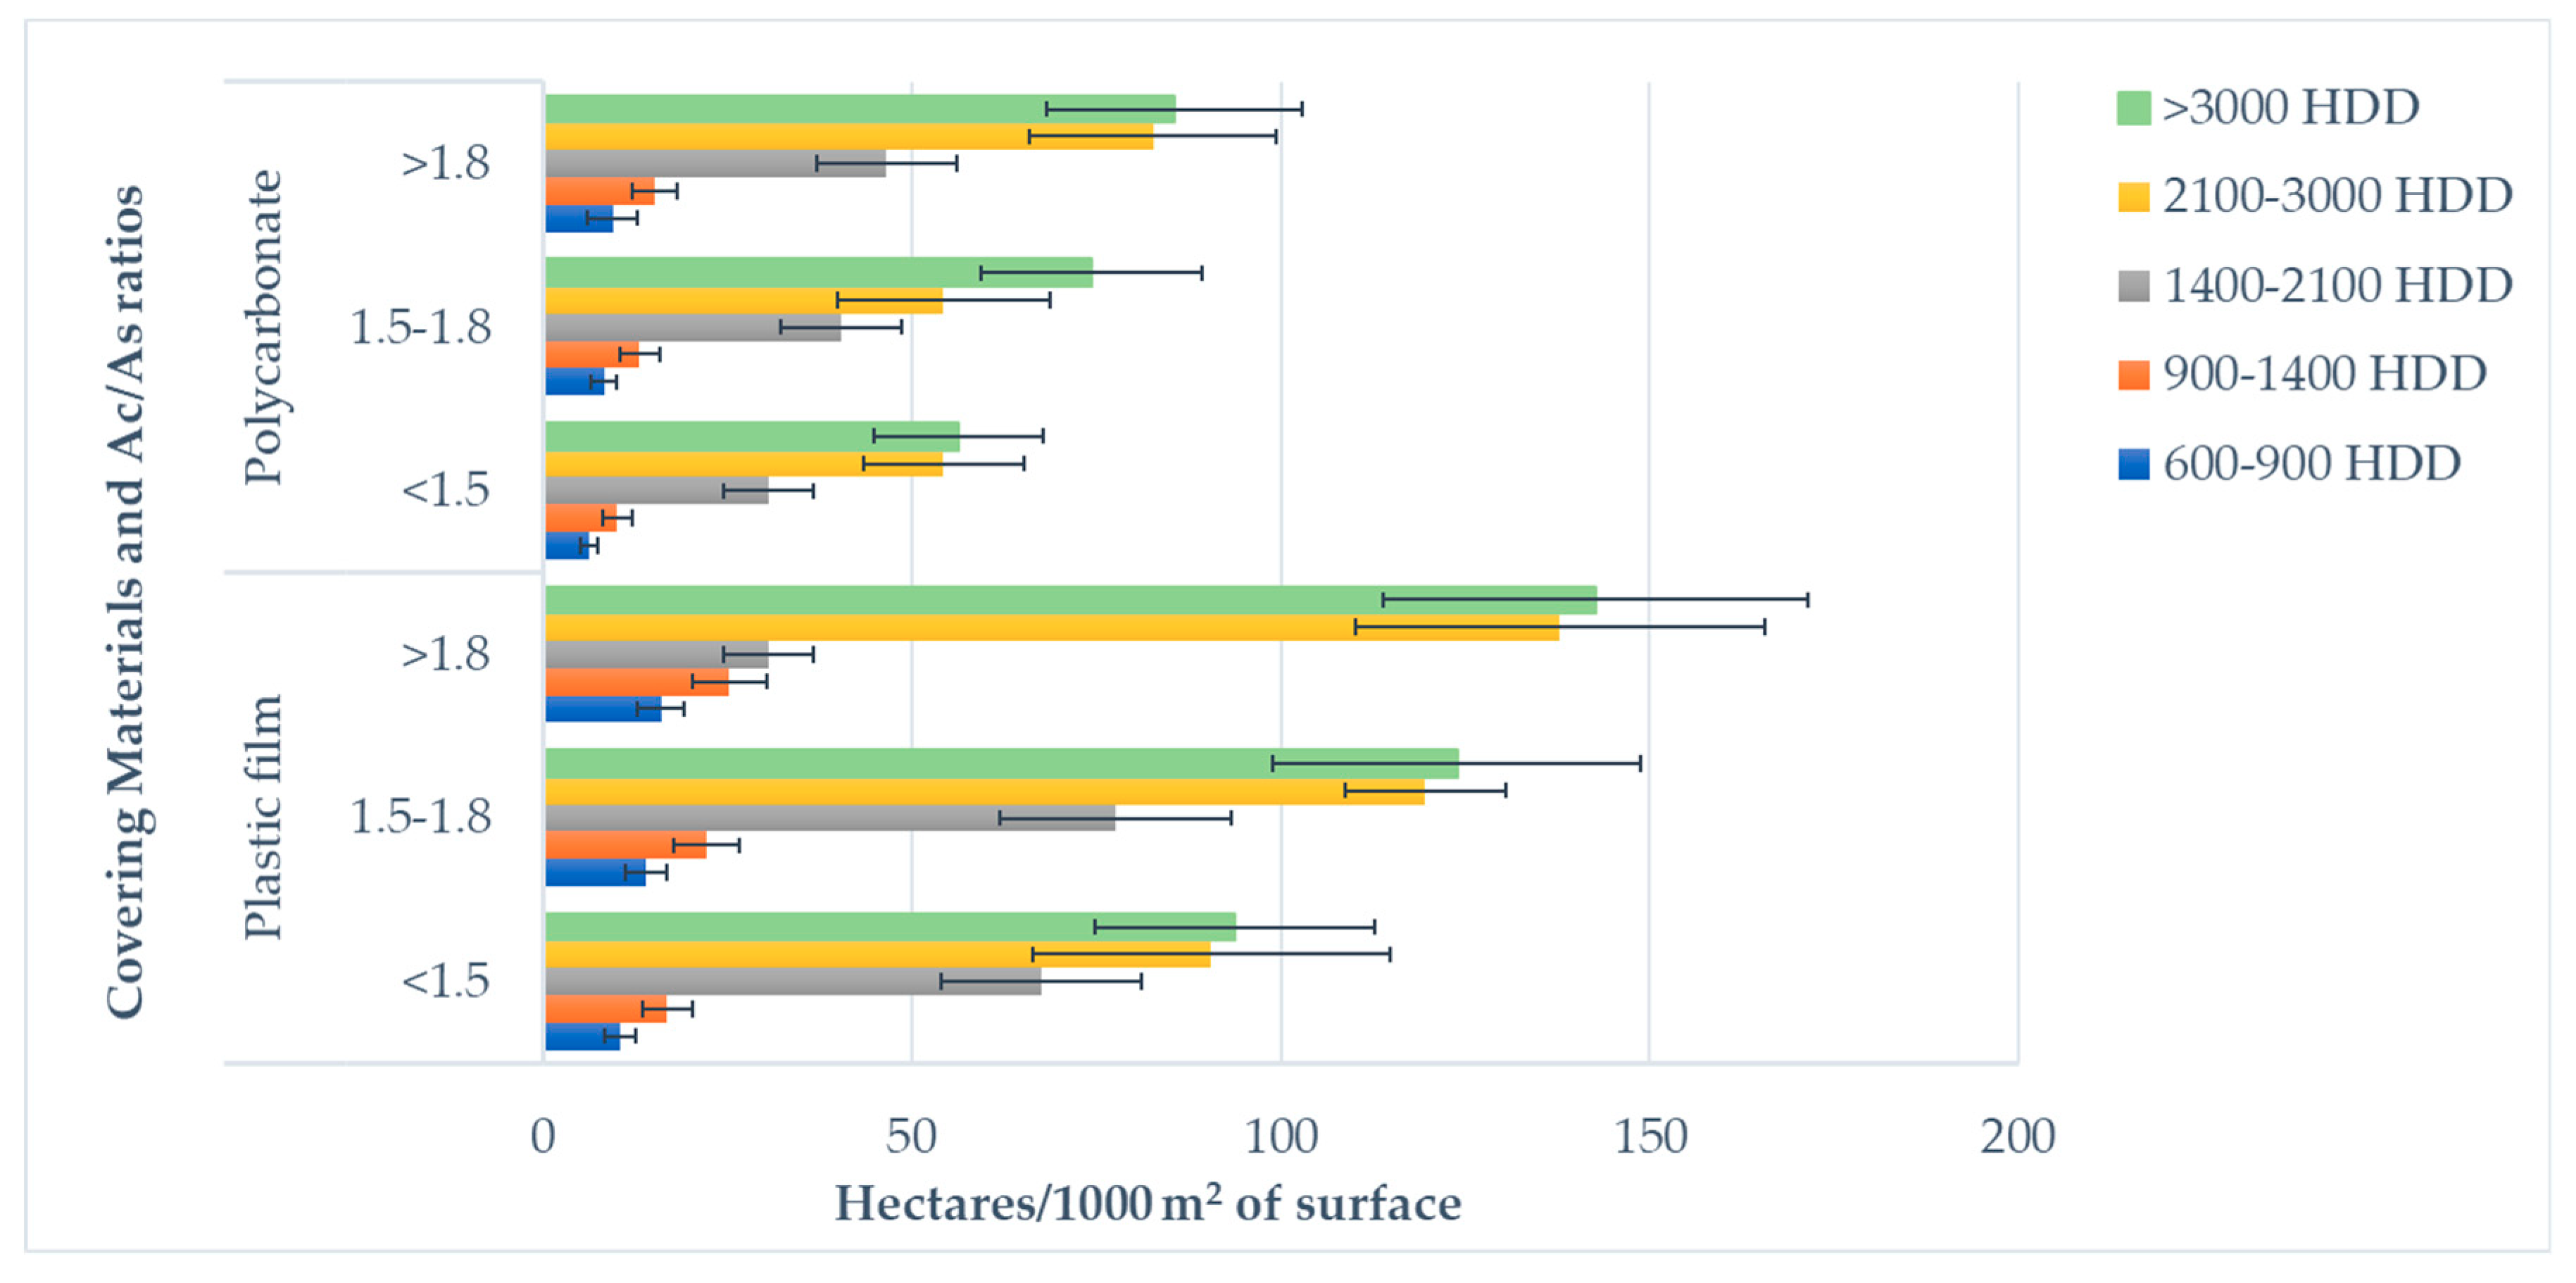
2.3.2. Greenhouses
Greenhouses are a special kind of agro-industrial building. Regarding the heating of greenhouses, the standard reference used in this research is the annex 40E to the Italian Republic Official Journal of 2 January 2013 (Ministry of Economic Development, 2013) [
40]. Here, the energy consumption for greenhouses is reported as equivalent to diesel fuel and they have a thermal plant efficiency of 0.9. We took as reference unit a square meter of the heated greenhouse. The assessment of the energetic requirement considers the
Ac/
As ratio that results from the division of the covering surface (
Ac) with the ground surface (
As) of the greenhouse (Equation (1)):
where
Q is the required thermal energy (kWh year
−1 m
−2),
Ac is the surface area cover (m
2),
As is the ground surface (m
2),
U is the global coefficient of thermal dispersion (W m
−2 K
−1),
Ti is the temperature inside the greenhouse (°C),
Te is the outside air temperature (°C),
h is the greenhouse operating hours duration,
is the boiler efficiency, which for simplification purposes is considered to be 0.9 even though the standard uses simplified tables for the diesel fuel consumption of traditional greenhouses chosen for reference. Relating these requirements to the energy of 1 t of biomass at a 15% moisture level enabled the compiling of
Table 4 which shows the maximum surface that can be heated with such an amount of biomass.
In this case, the user enters the municipality where the greenhouse is located and the greenhouse surface, then the tool automatically gives information about the province, the climatic zone and the heating degree days, indicating the amount of biomass required to autonomously heat the given surface with the available energy (see
Section 2.1 and
Section 2.2).
2.4. Comparison with Real Data
The output of the set of codes was tested against some case studies whose findings have been published by the Italian ENAMA (Ente Nazionale per la Meccanizzazione Agricola) [
41]. Overall, fifteen case studies were examined: Six were related to using woody biofuel to heat residential buildings, while the remaining nine reported its use for greenhouse heating.
There was a great deal of uncertainty with these specific situations since none reported the hectares of wood crops producing the pruning residues and also, even if they were self-sufficient, the amount of the thermal energy required was not noted. Given this, the functioning of the DST was tested by focusing on the used amount of biomass per square meter of greenhouse (t
d.m. m
−2) and its usage (i.e., residential or industrial). In the case of residential buildings, the comparison was carried out considering the surface to be heated. Moreover, the used dataset includes the production of warm water, however the app does not take this into account in its current form. Data underwent statistical processing by means of Minitab statistical software and Microsoft Excel Spreadsheet using Pearson’s correlation coefficient
r, the coefficient of determination
R2, the root mean square error (RMSE) and the percentage bias of prediction (PBIAS) dimensionless index [
42,
43] for the evaluation.
3. Results
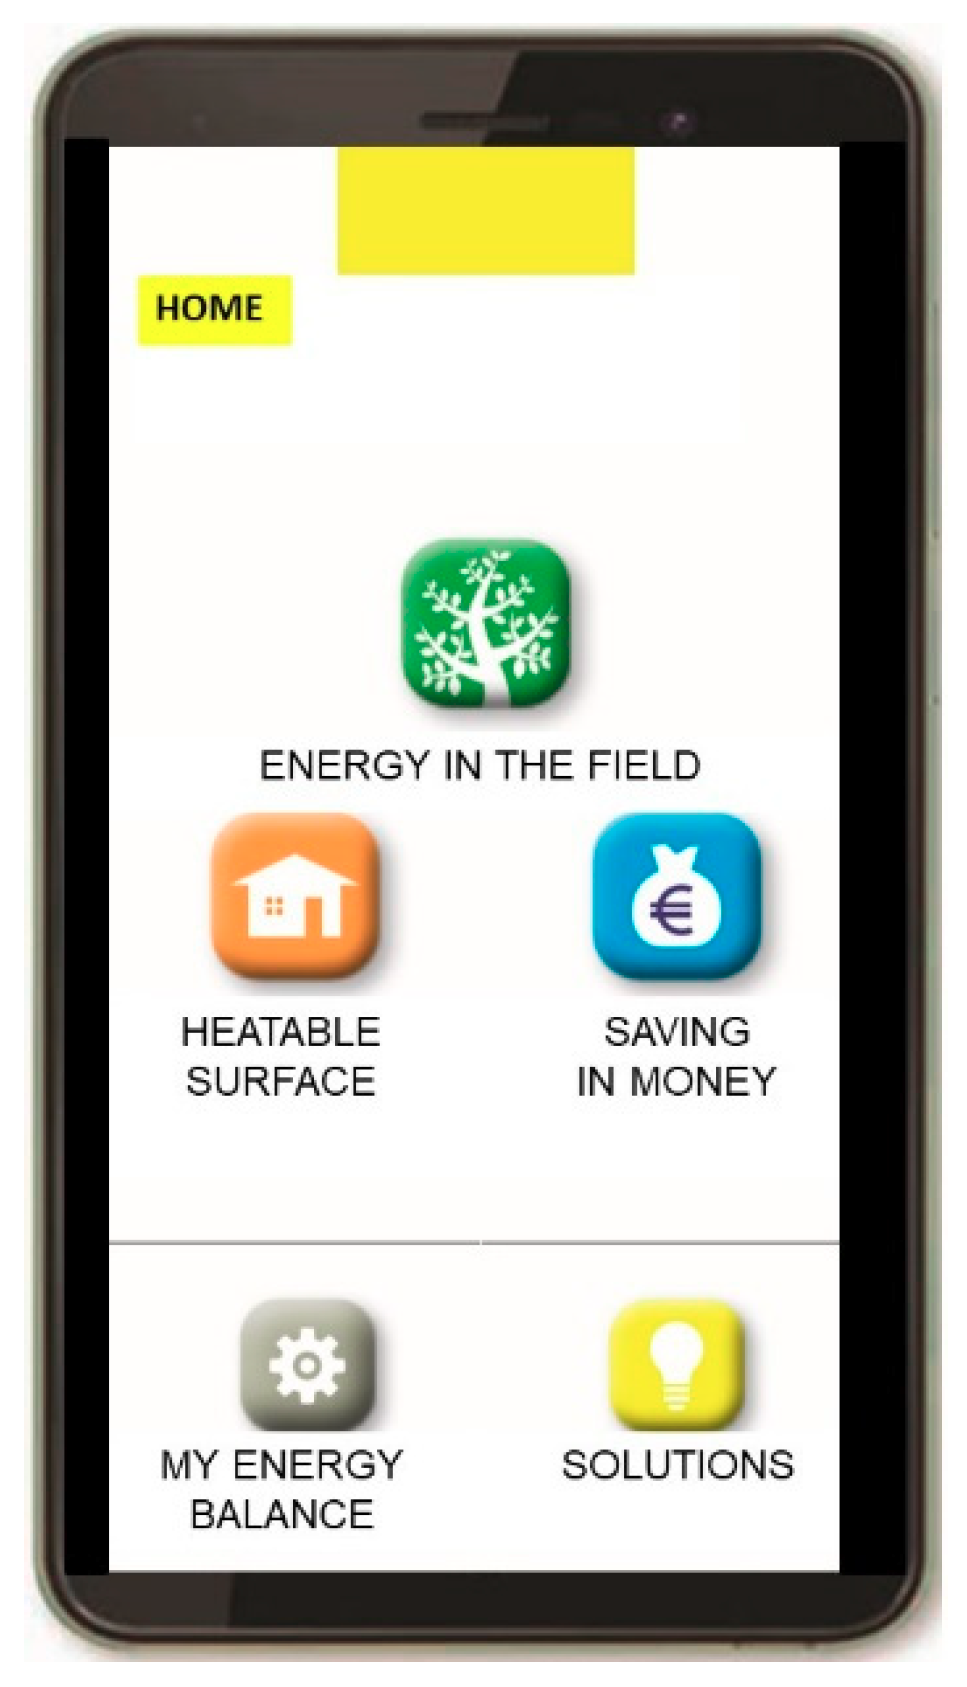
The application has been developed to allow the user an initial approach without logging on. It can be used in English or Italian and has five choices (
Figure 2): (1) Energy availability in the field; (2) heatable building surface; (3) saving in money; (4) energy balance; and (5) technical solutions.
3.1. First Approach
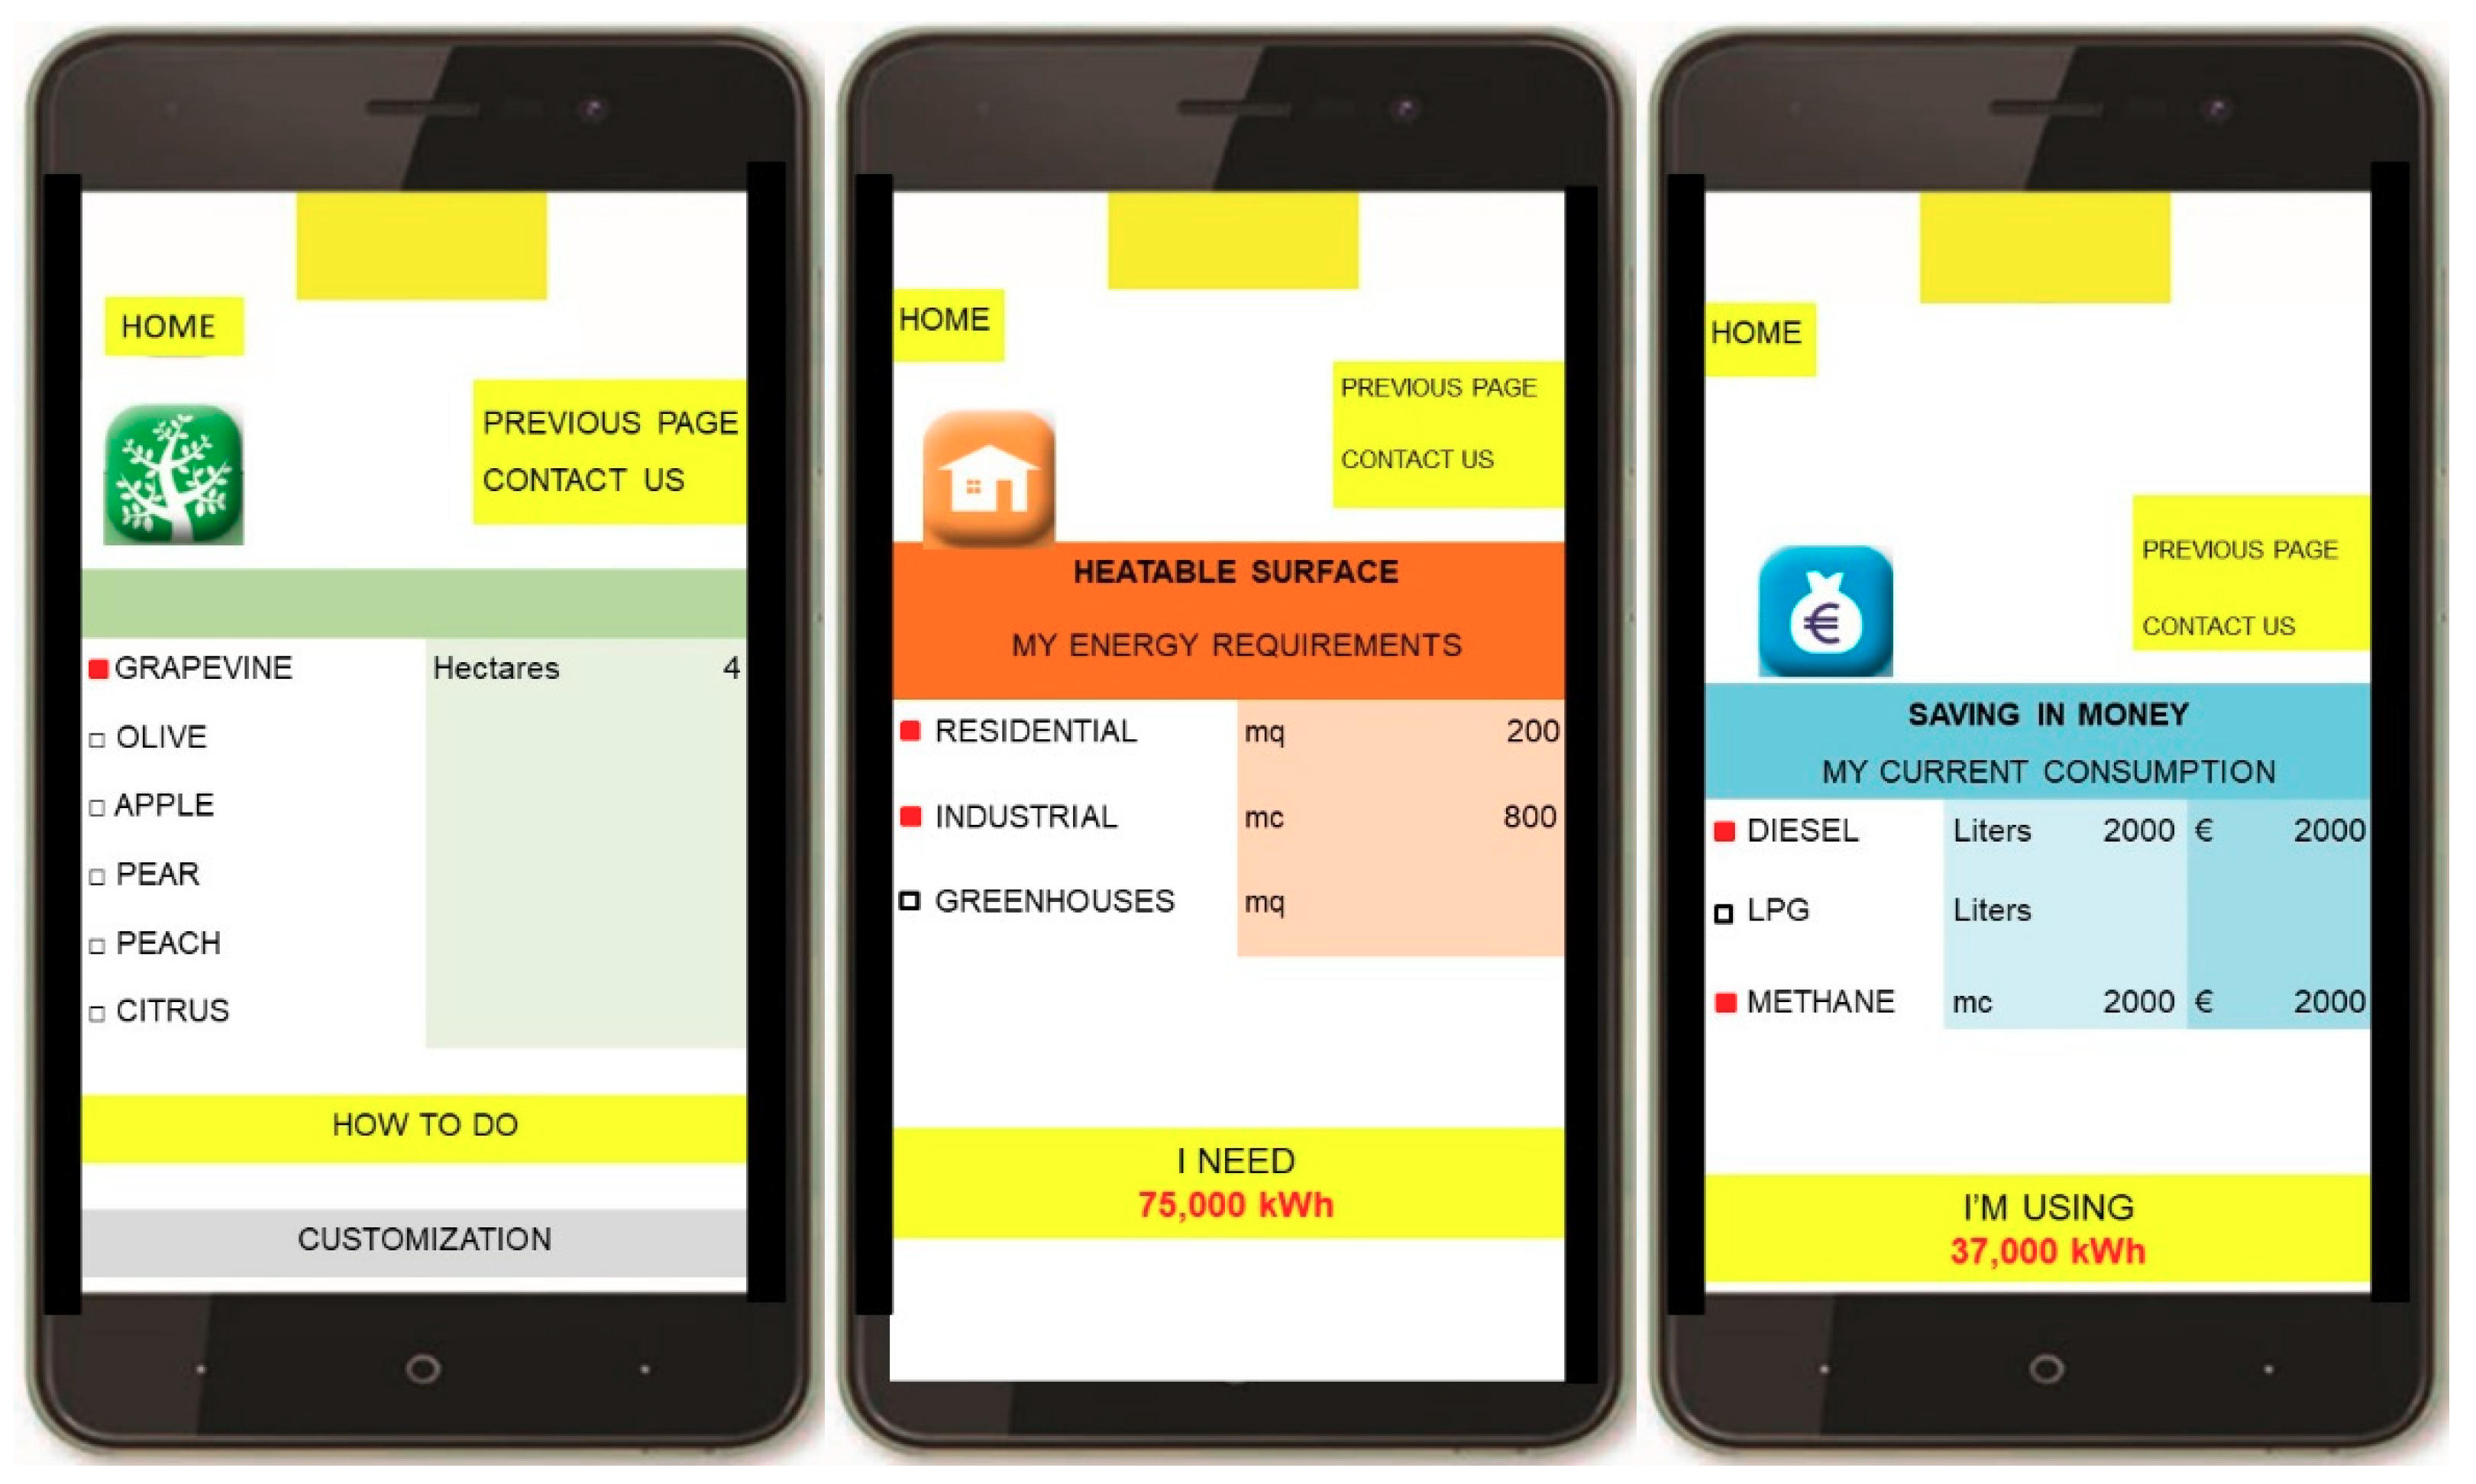
The first three options (the energy availability in the field, the heatable surface and the savings in money) indicate what the user wants to know. Selecting any of these options opens the first interface; in practice, this chooses which data must be inserted and what the output will be. The pages that open are shown in
Figure 3. If the user selects “Energy in the field”, the app requires the user to choose the cultivar and the field surface. The first output on the same page is the available thermal energy. The calculation of available thermal energy is automatic because the LHV is set at 4.00 kWh kg
−1 and the boiler efficiency to 0.9. Scrolling the screen, the application then shows the heatable surface of a residential or industrial building or a greenhouse related to the level of insulation and the climatic classification. The other output is the equivalent in methane, diesel or LPG requirements. In this way, knowing the pruning amount as a quantification of thermal energy and its potential “equivalent” in money is immediately apparent. Thanks to this information, it can instantly be seen that 30 ha of olive trees gives an equivalent energy of 18,000 m
3 of methane.
In the same way, the user can select “heatable surface” or “saving in money” and input the surfaces to heat. The relevant outputs are the requirements of energy in kWh and the equivalent hectares of pruning. The equivalent in methane, diesel and LPG may also reported. If “Saving in money” is chosen, the user can insert their fossil fuel consumption and the outputs are the required amount of energy and the equivalent hectares of pruning.
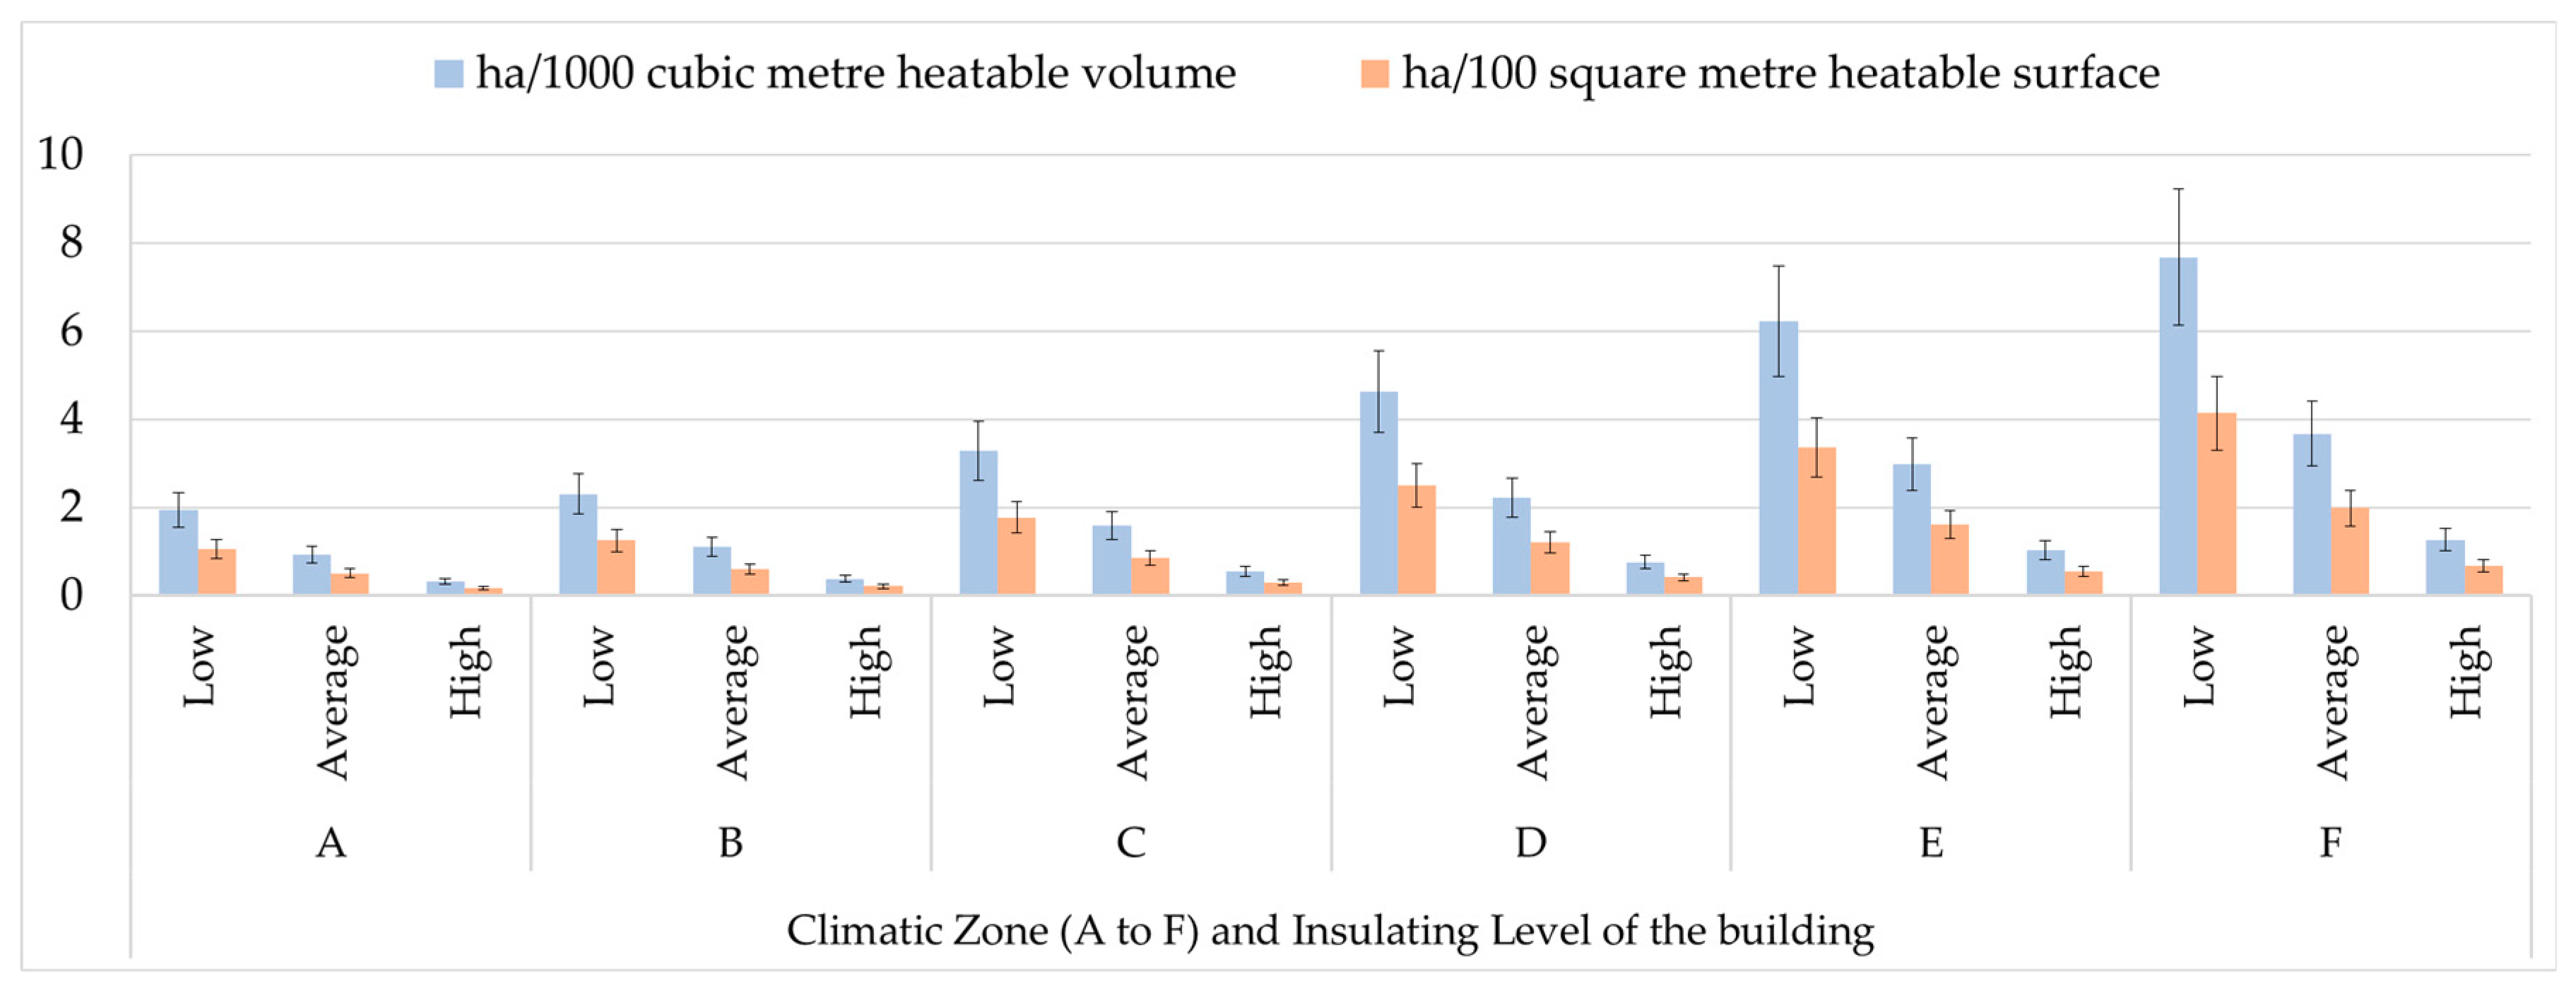
Doing so, the heatable surface is instantly correlated with the hectares used for cultivation (
Figure 4 and
Figure 5).
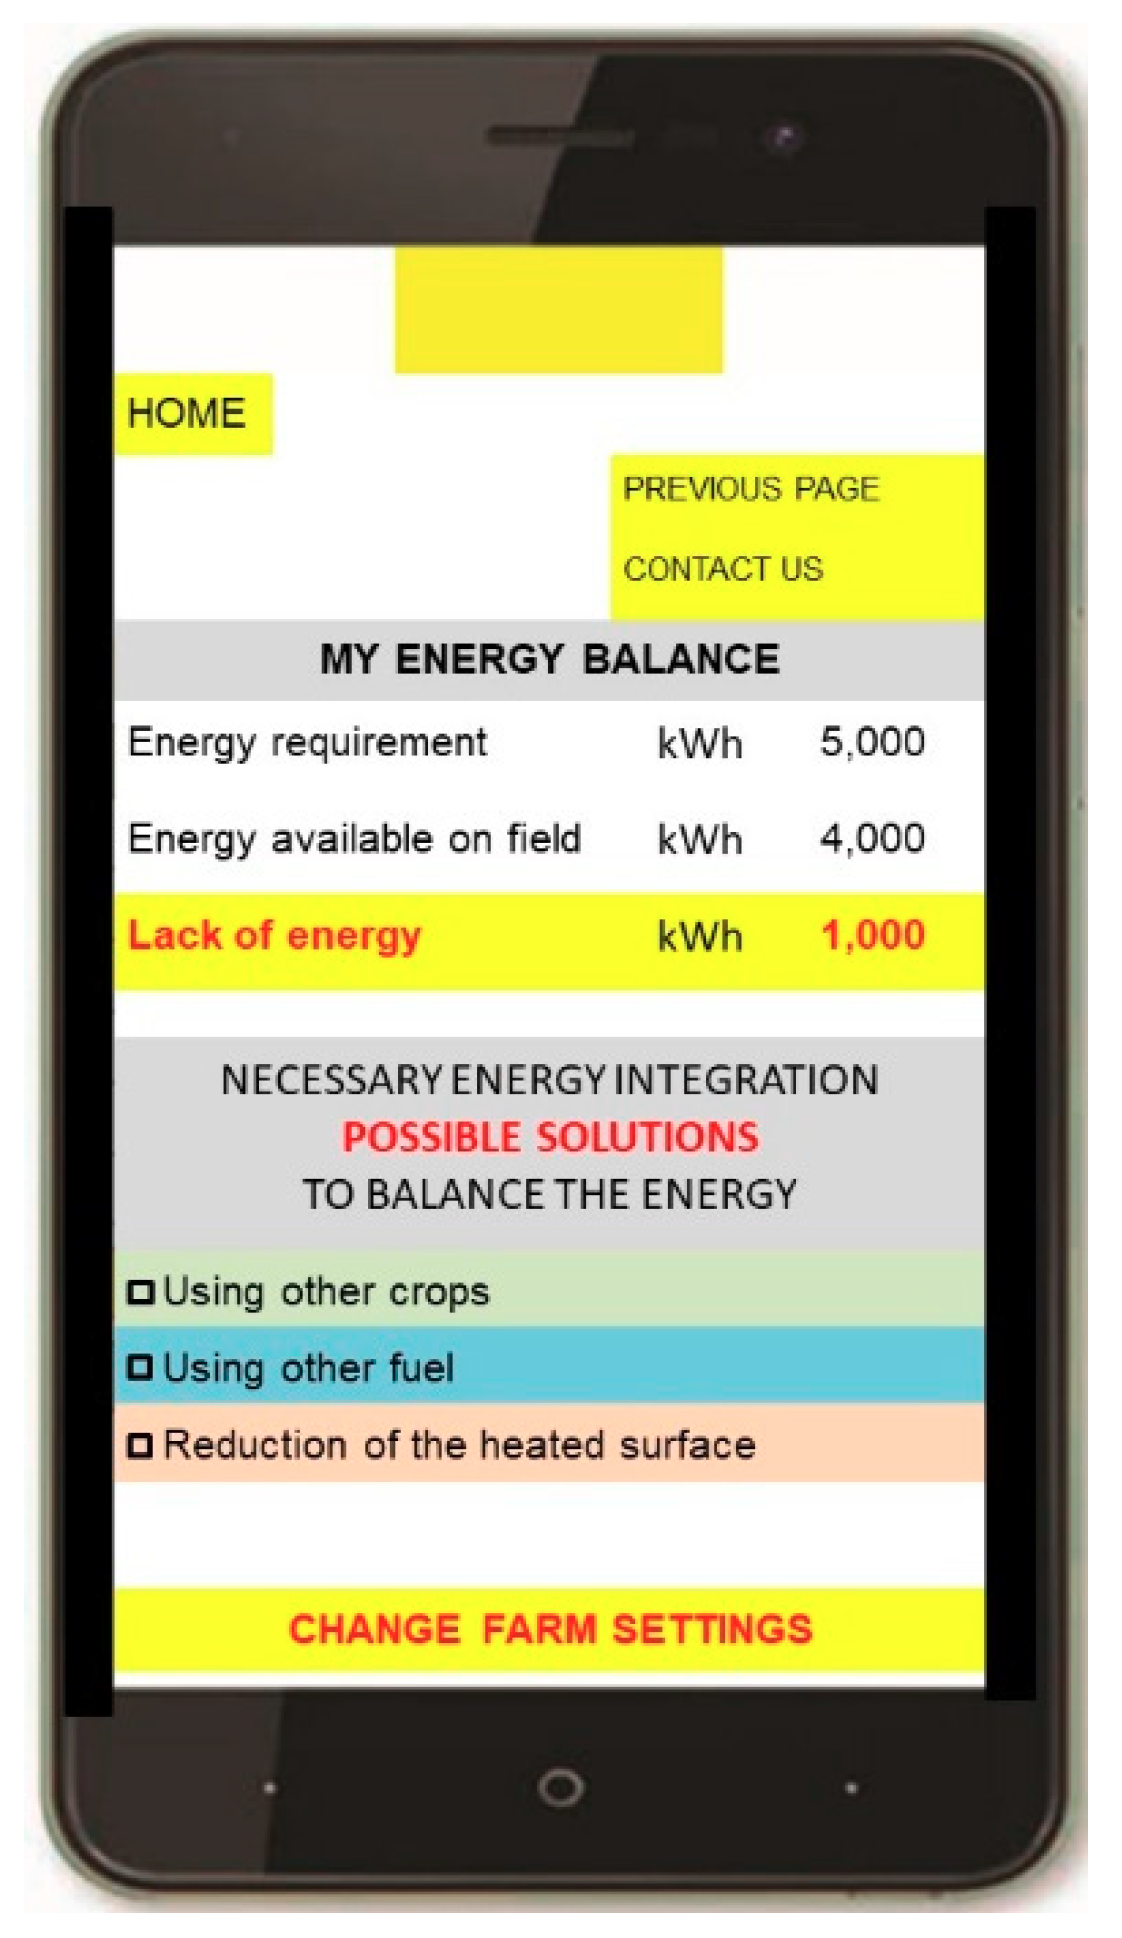
3.2. My Energy Balance
The most interesting and perhaps valuable selection, in line with the main aim for a technical support tool to help farmers understand the heating potential of pruning, is the page “My energy balance”. This part of the application requires the user to log in. Now the information of the municipality is required so that the results will be applicable to the user.
Three pages similar to the first three options must be filled. These pages represent the energy in the field, the heatable surface and saving in money. The user should insert the right cultivar and the relevant hectares, the surfaces actually heated and the real annual fuel consumption. The output is the farmer energy balance which is a comparison between the actual energy requirement and the energy available in the field thanks to pruning.
The user interface is shown in
Figure 6. Obviously, the balance could present a surplus or a lack of energy available in the field. If a surplus, the tool indicates how much surface can be heated, if a lack of energy, once again the three pictures of
Figure 2 indicate how many hectares are needed of the specific cultivar or fuel to achieve the balance, or otherwise how much surface it is not possible to heat.
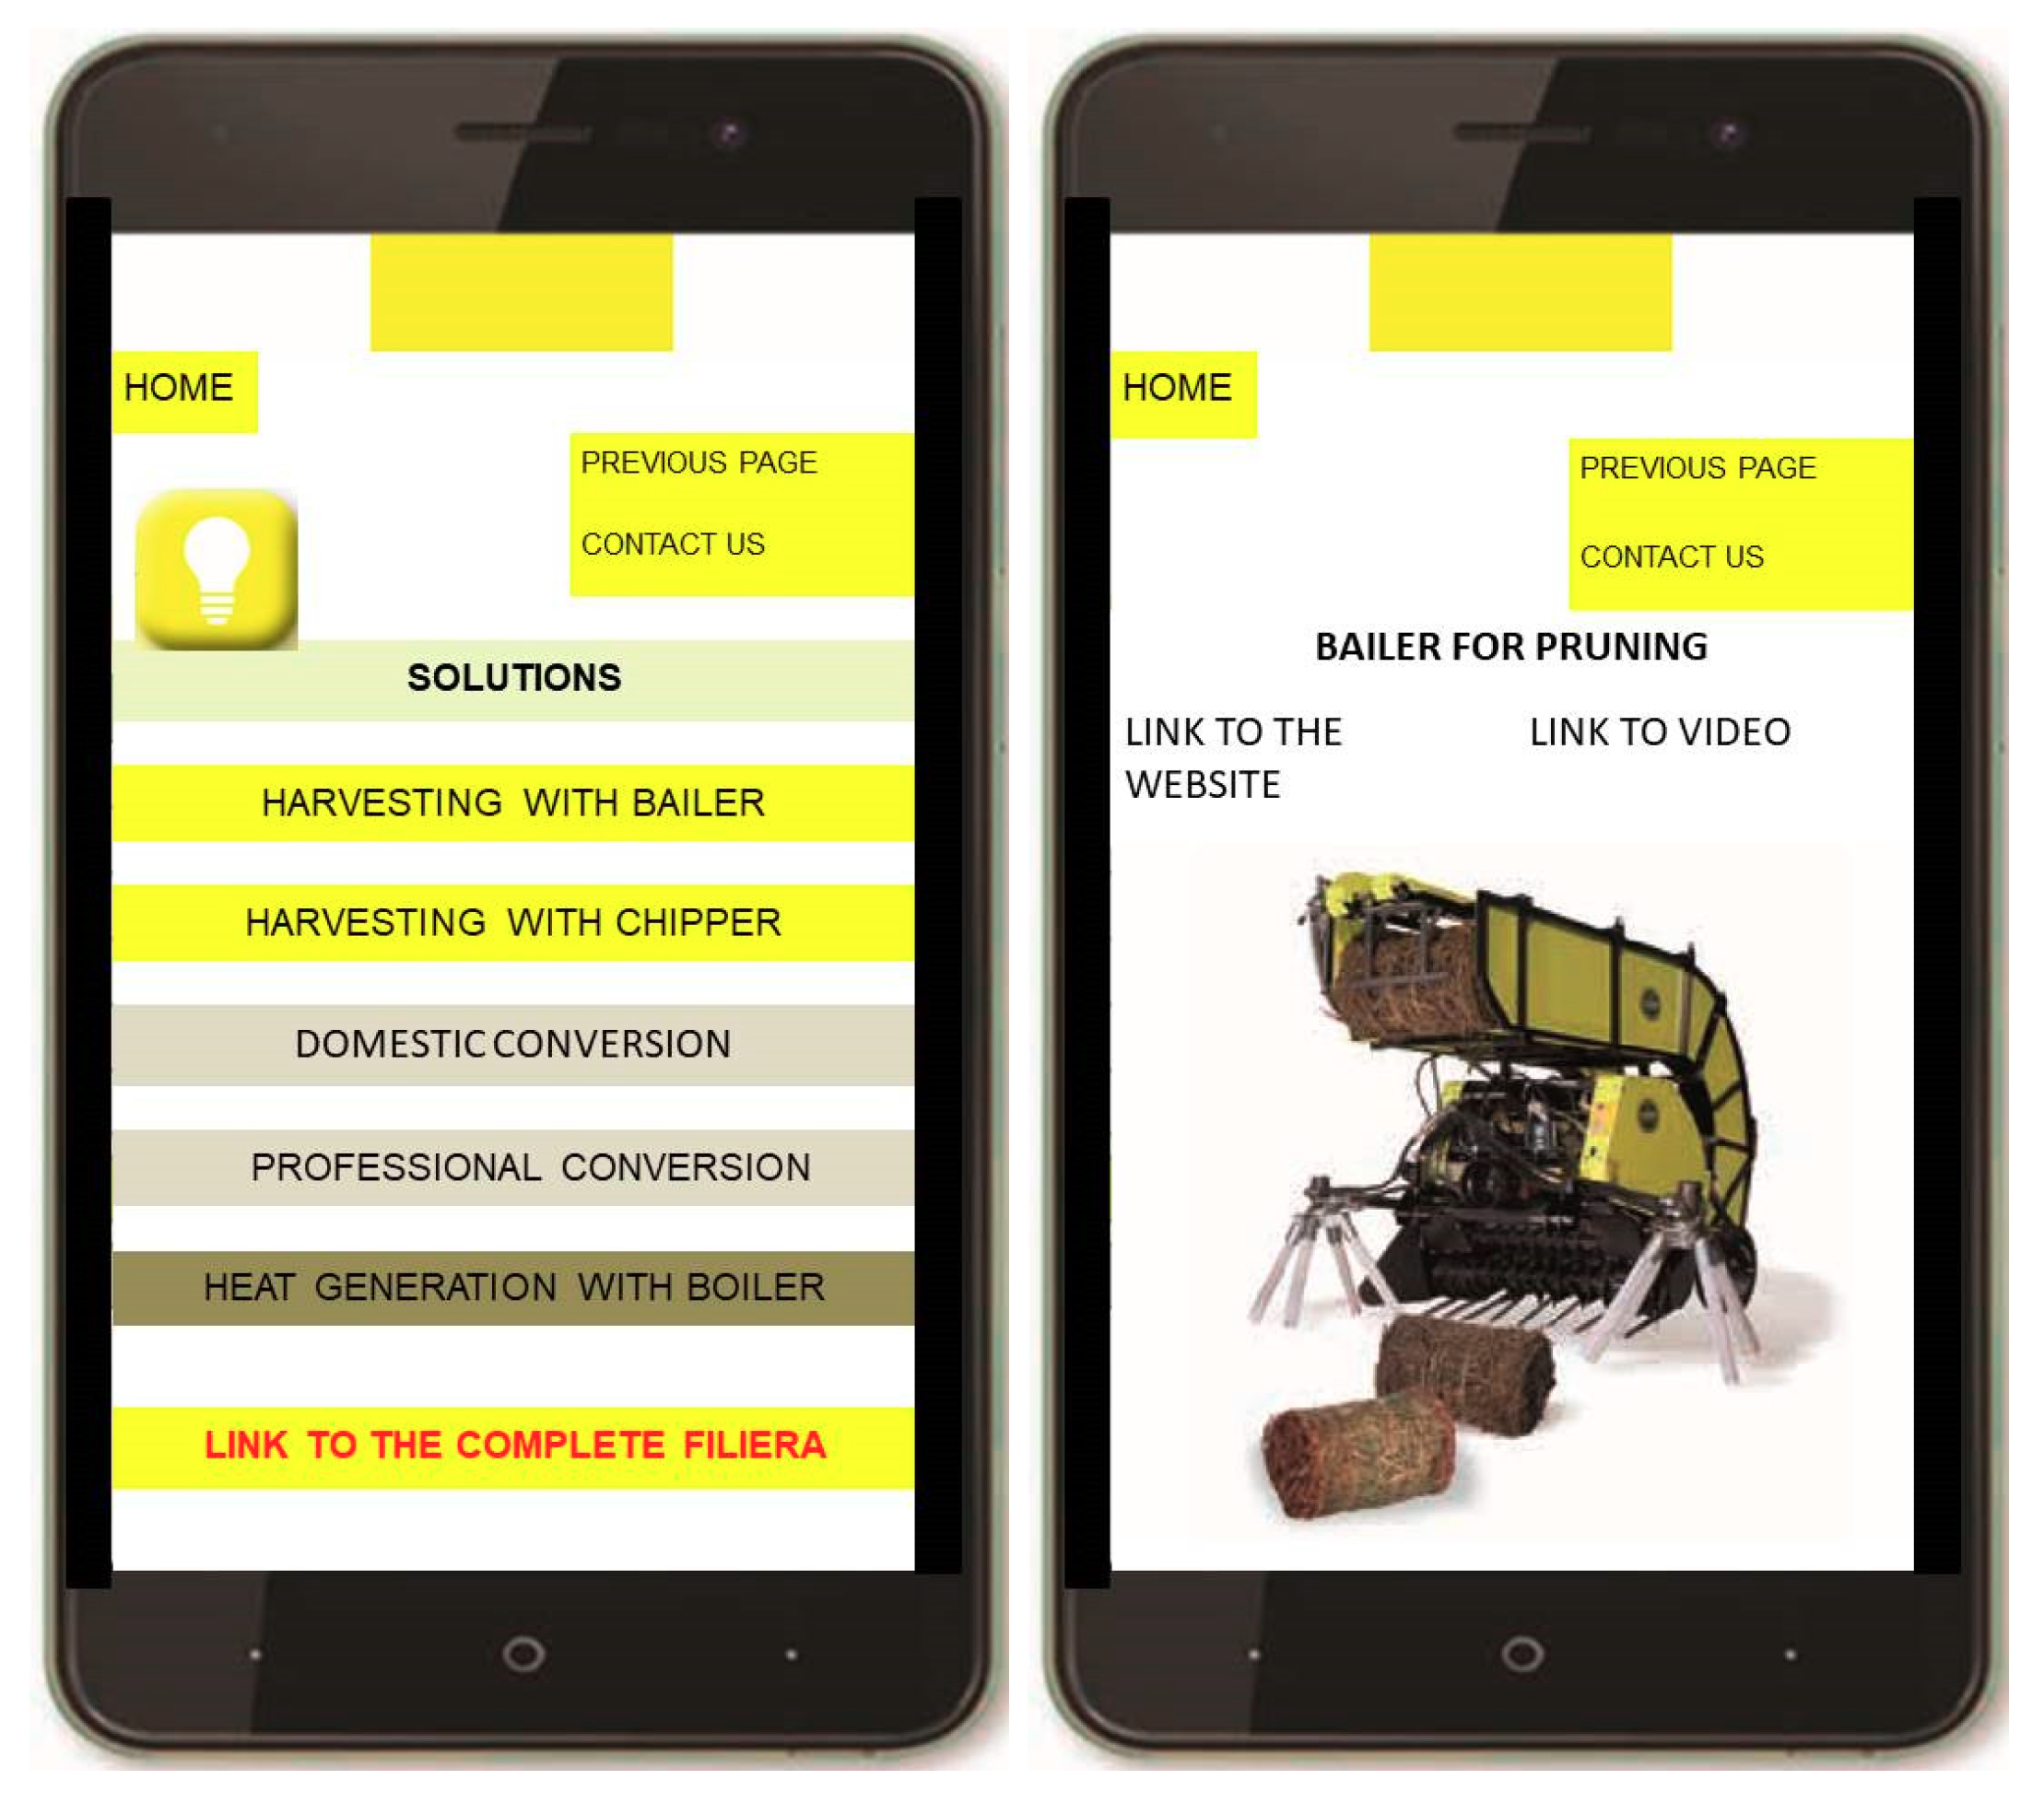
3.3. Solutions
The last option in the app, “solutions”, shows some technical solutions to collect and burn the biofuel. The complete production process, starting from baling, chipping or pruning till arriving at the specific boiler for heating production is described in this option (
Figure 7).
The main aim of “solutions” is to indicate what the tool has determined technically feasible. Since the calculations within the app have followed technical norms, a focused study on the farm is still necessary, both as a pruning evaluation and as an energy need evaluation, in order to choose the correct line of mechanization. For this reason, the technical solutions are presented but are not technically connected with the “energy balance” section.
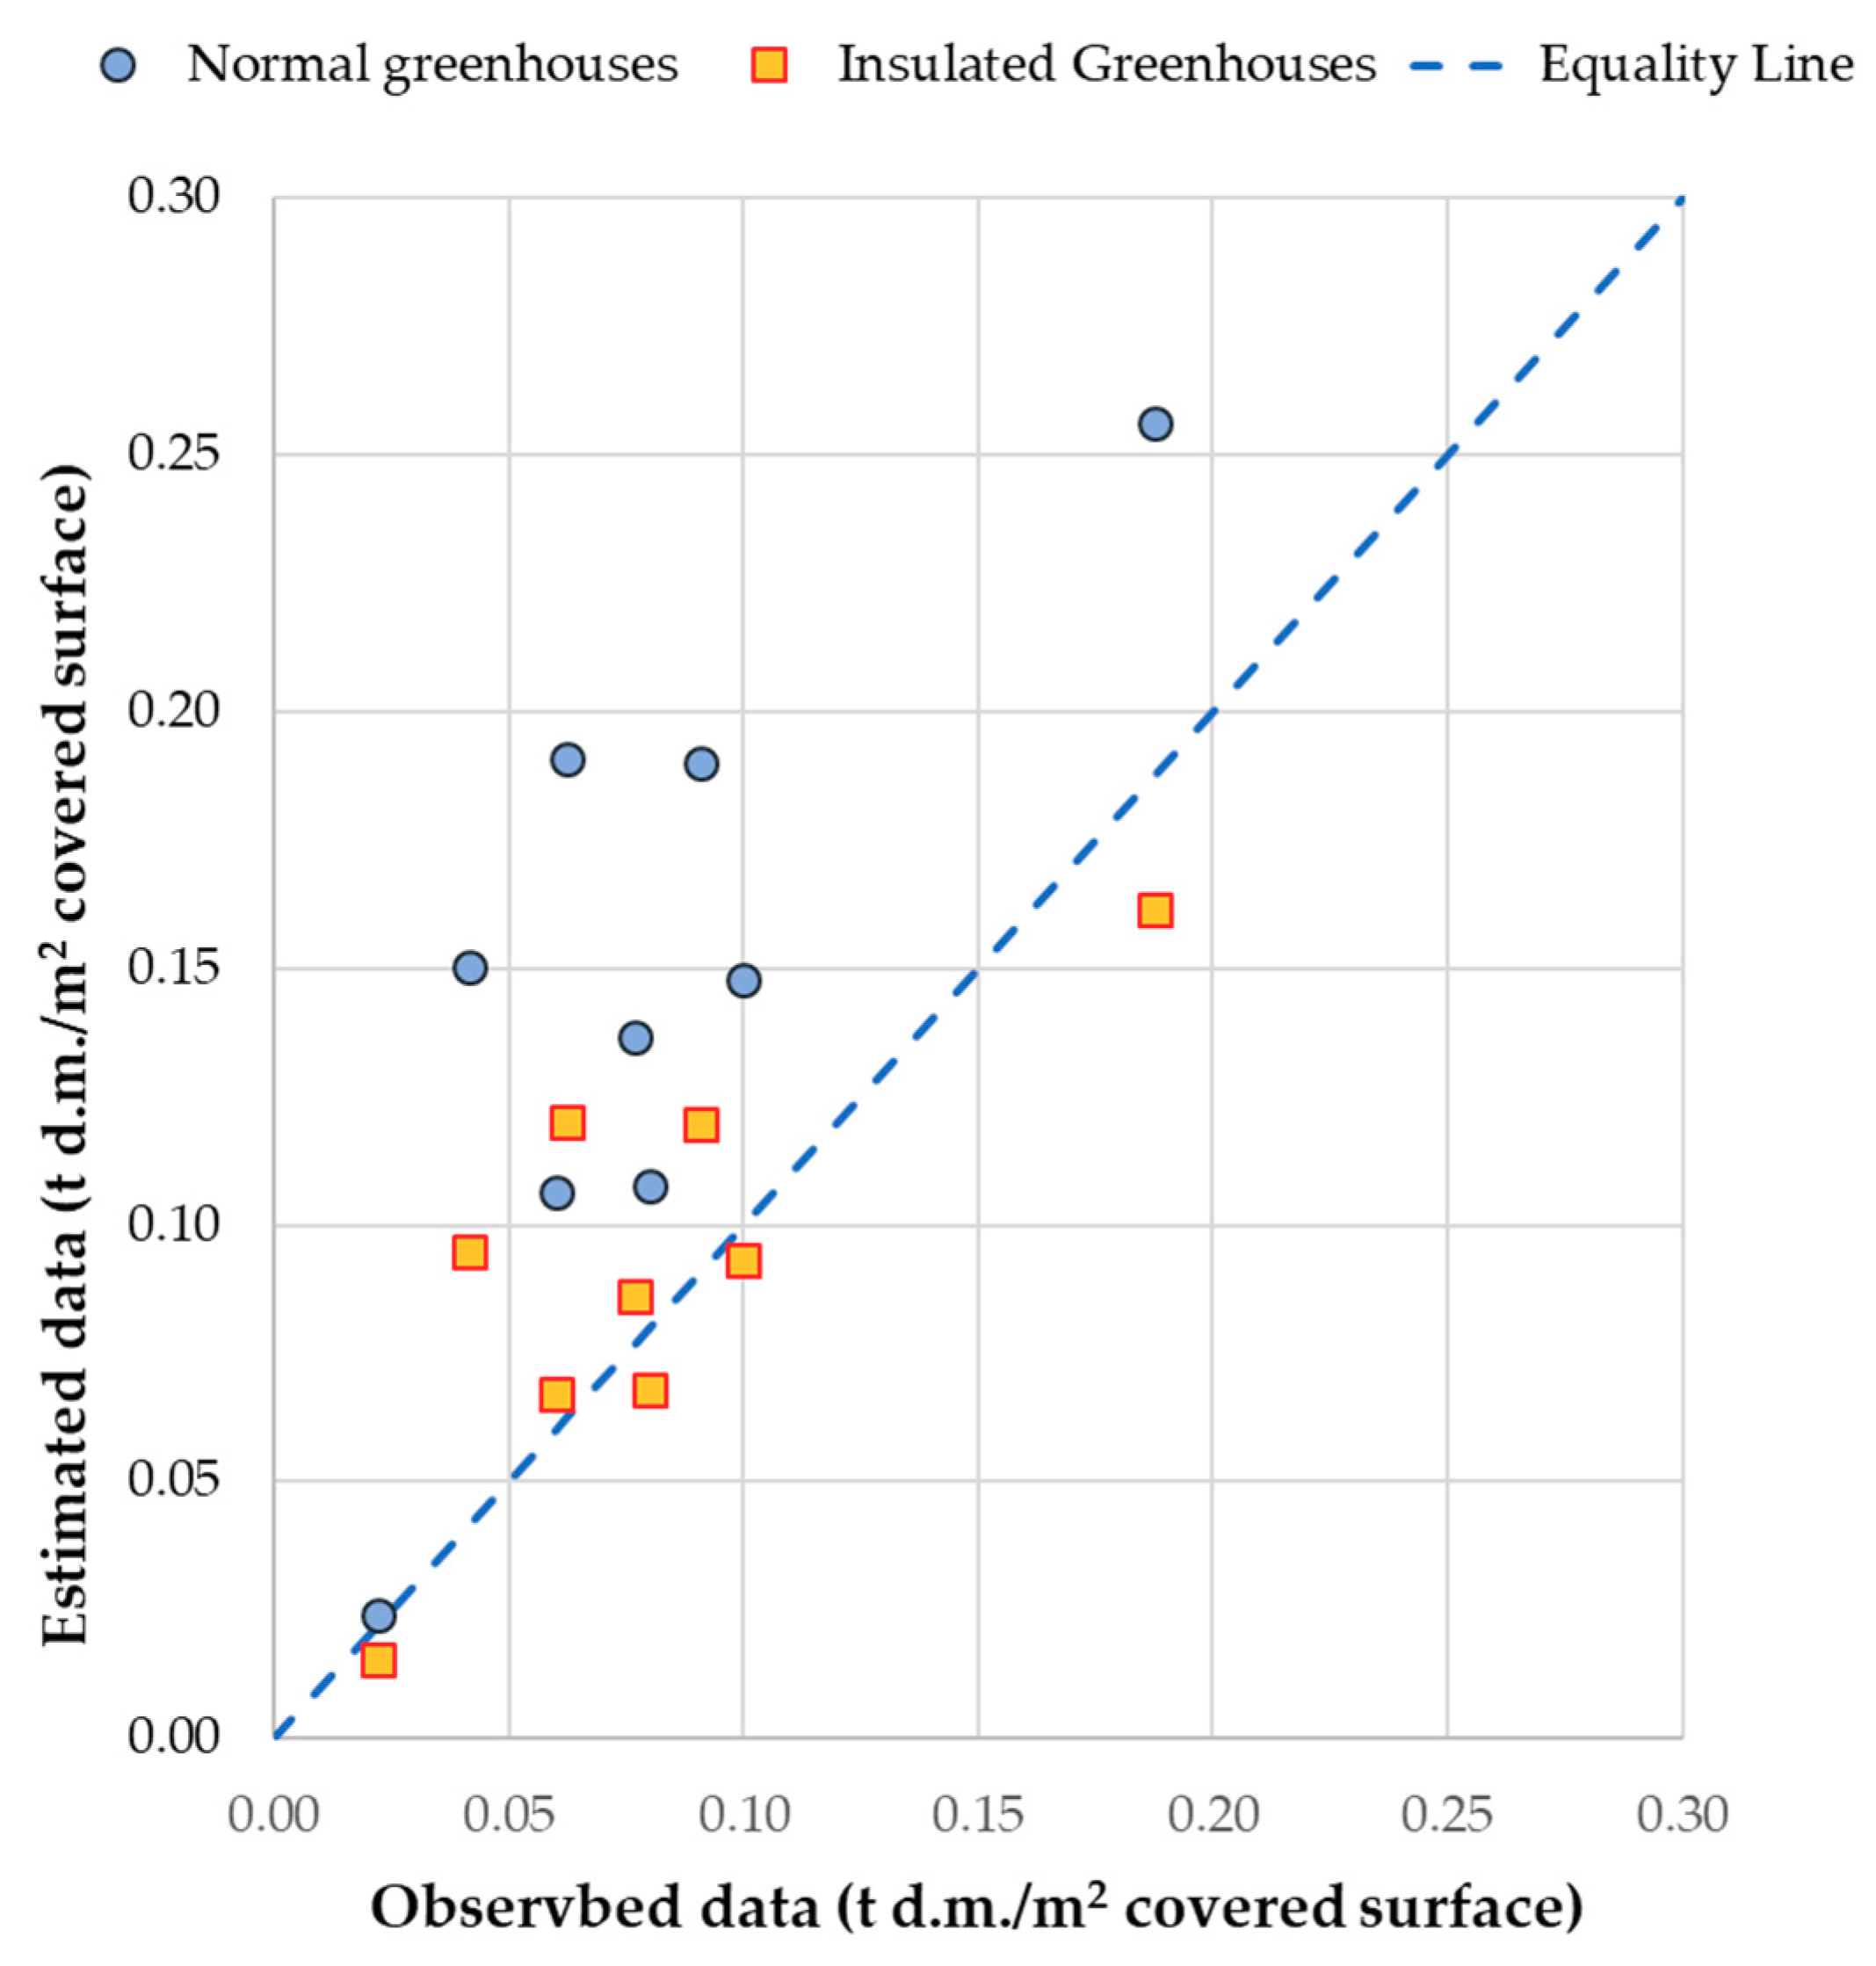
3.4. Comparison with Real Data
Evaluation of the app performance in all cases revealed an overall correlation coefficient of 0.79 and a coefficient of determination (
R2) equal to 0.62 (rises to 0.92 for residential buildings). If the average bias of the estimate is about 20% for residential buildings, things change when greenhouses are considered. As a matter of fact, the comparison between the estimated and observed data results in an RMSE of 0.08 t
d.m. but the bias reaches a value of −51.8%, since for normal greenhouses the values seem to be evenly distributed above the equality line (
Figure 8). It is important to note that this does not happen in the case of insulated greenhouses, so that data appears to be more comparable (with a bias of −14%).
In detail, the
r and
R2 indexes indicated that the app calculations reproduce the trends in the observed data quite well [
44]. Nevertheless, the PBIAS value is quite far from the optimal (optimum PBIAS is 0), indicating that there is something that the app currently does not consider, such that its estimations based on the heating requirements are higher than those observed (particularly in reference to greenhouses). This means that some building parameters (e.g., for greenhouses, what the coverings are made of) have insulating performances that the code, set up with the current regulatory assessment, does not include.
This is the reason why the average overestimation of 94% occurs. In practice, the app requires double the effective wood consumption. However, it is worth noting that these case studies have undergone a complete revision of their heating management, so if we consider the coefficient regarding an insulated greenhouse then a 32% overestimation of the needed chipped biomass occurs.
Since the app was developed based on regulatory assessments, its output should be considered as a reference. The differences shown above highlight the need for having data on as many farming systems as possible to correlate the specific energy requirements with the proper required quantities of pruning residues.
For the first phase of releasing the app, it has been decided to adopt the values reported in
Table 4. In any case, the adoption of “my energy balance” solves the question entirely, suffice for farmers inserting the fossil fuel consumption they currently have. Moreover, it must be considered that one of the main aims of the app is to involve farmers in the research process by collecting data and sharing it with researchers. To this end, a focused approach on the type of farm and the available pruning has been started.
4. Conclusions
Pruning residue may represent an important source of energy biomass, but the process of evaluating the energy availability, adapting the heating system, harvesting, recovering and preparing the biomass for the boiler, means the viability in terms of avoiding costs of residue management and eventual benefits are not immediate. Therefore, pruning residues are harvested by forwarding them to a collection point, shredding the residue and collecting it into bins, a method that offers all the benefits of rapid handling, or by baling with the advantage that stored bales incur minimal dry matter losses compared to shredded residues, which allows the maximization of the energy potential of pruning.
This research paper has presented a new tool designed to indicate to any potential user the amounts and quality of pruning residues needed to cover the energy requirements for the heating of both residential and agro-industrial buildings (i.e., greenhouses). The tool suggests the amounts of required biomass, and in case they are not fully available, how much fossil fuels (diesel oil, methane or Liquid Petroleum Gas (LPG)) are needed to complete the energy requirement.
Knowing the real amounts and the energy potential of the available residual biomass in the orchard therefore allows planning and evaluation of the benefits. Currently, many data related to pruning quantities and cultivated surfaces are available and there are also case studies on the use of pruning residues as biofuel but there is a lack of information bridging these data. Even the case studies do not explain the features of the heated buildings and this problem arises following the great deal of uncertainty that the comparison with real data highlighted.
This mobile application will allow creating a link between the local biomass availability with the energy requirements for heating buildings. On one hand, this enables the end user to be aware of the energetic potential of pruning, while on the other, farmers can become involved in the research process by collecting data and sharing it. The app introduces a focused approach on the type of farm and available pruning by matching energy requirements with the biofuel from pruning. It offers policy makers new modes of planning and the possibility of decentralized and self-contained systems, provided that adequate development and support programs are regulated at the district or community level.
Author Contributions
Conceptualization, C.B., A.B., G.R., G.M. and R.S.; Data curation, M.B. and M.C.; Formal analysis, M.B. and G.M.; Methodology, M.C., A.B., G.R. and R.S.; Software, G.M.; Supervision, A.B. and R.S.; Writing—original draft, C.B., M.B. and M.C.
Funding
This work was supported by the Italian Ministry of Agriculture (MiPAAFT) under the AGROENER project (Decree n. 26329, 1 April 2016)—
http://agroener.crea.gov.it/.
Conflicts of Interest
The authors declare no conflict of interest. The funders had no role in the design of the study; in the collection, analyses, or interpretation of data; in the writing of the manuscript, or in the decision to publish the results.
Abbreviations
| DSS | Decision Support Systems |
| DST | Decision Support Tools |
| LHV | Lower Heating Value |
| NP | Nominal power |
| HDD | Heating Degree Day |
| S/V | Surface/Volume ratio |
| Ac/As | Greenhouse covering surface/Ground surface ratio |
| RMSE | Root Mean Square Error |
| PBIAS | Percentage bias of prediction |
References
- UNEP—United Nations Environmental Programme. Converting Waste Agricultural Biomass into a Resource—Compendium of Technologies. Division of Technology, Industry and Economics, International Environmental Technology Centre: Osaka/Shiga, Japan, 2009. Available online: http://www.fao.org/sustainable-food-value-chains/library/details/en/c/266093/ (accessed on 24 October 2018).
- UNEP—United Nations Environmental Programme. Technologies for Converting Waste Agricultural Biomass to Energy. Reading Material. Division of Technology, Industry and Economics, International Environmental Technology Centre, 2013. Available online: http://www.mag.go.cr (accessed on 24 October 2018).
- Rentizelas, A.A.; Tolis, A.J.; Tatsiopoulos, I.P. Logistics issues of biomass: The storage problem and the multi-biomass supply chain. Renew. Sustain. Energy Rev. 2009, 13, 887–894. [Google Scholar] [CrossRef] [Green Version]
- Bischoff, W.-A.; Küpfer, C.; Schleicher, S.; Bukowski, P.; Dyjakon, A. Pruning to Energy: A Case Study on Social and Ecological Benefits of a Value Chain. In Proceedings of the 24th European Biomass Conference and Exhibition, Amsterdam, The Netherlands, 6–9 June 2016; pp. 1377–1380. [Google Scholar] [CrossRef]
- García-Galindo, D.; Gómez-Palmero, M.; López, E.; Sebastián, F.; Jirjis, R.; Gebresenbet, G.; Germer, S.; Pari, L.; Suardi, A.; Lapeña, A.; et al. Agricultural Pruning Harvesting Demonstrations in Germany, France and Spain. Lessons Learned and Recommendations. In Proceedings of the 24th European Biomass Conference and Exhibition, Amsterdam, The Netherlands, 6–9 June 2016; pp. 1727–1733. [Google Scholar] [CrossRef]
- Carvalho, J.; Mota, A.; Soares, M.; Arauji, J.; Vilarinho, C. MOVBIO—Mobilization of Biomass for Energy Recovery towards a Sustainable Development. Eur. J. Sustain. Dev. 2018, 7, 483–488. [Google Scholar] [CrossRef]
- Rose, D.C.; Sutherland, W.J.; Parker, C.; Lobley, M.; Winter, M.; Morris, C.; Twining, S.; Foulkes, C.; Amano, T.; Dicks, L.V. Decision support tools for agriculture: Towards effective design and delivery. Agric. Syst. 2016, 149, 165–174. [Google Scholar] [CrossRef]
- Costopoulos, C.; Ntaliani, M.; Karetsos, S. Studying Mobile Apps for Agriculture. IOSR J. Mob. Comput. Appl. 2016, 3, 44–49. [Google Scholar] [CrossRef]
- Pongnumkul, S.; Chaovalit, P.; Surasvadi, N. Application of Smartphone-based Sensors in Agriculture: A Systematic Review of Research. J. Sens. 2015. [Google Scholar] [CrossRef]
- Dehnen-Schmutz, K.; Foster, G.L.; Owen, L.; Persello, S. Exploring the role of smartphone technology for citizen science in agriculture. Agron. Sustain. Dev. 2016. [Google Scholar] [CrossRef]
- Herrick, J.E.; Karl, J.W.; McCord, S.E.; Buenemann, M.; Riginos, C.; Courtright, E.; Van Zee, J.; Ganguli, A.C.; Angerer, J.; Brown, J.R.; et al. Two new mobile apps for rangeland inventory and monitoring by landowners and land managers. Rangelands 2017, 39, 46–55. [Google Scholar] [CrossRef]
- FAOSTAT. Production Crops Area Harvested, 2016 Data; FAO: Rome, Italy, 2016. [Google Scholar]
- Mazzei, T.; Migliarini, S.; Nocentini, G. La Filiera Legno Energia, Risultati Del Progetto Interregionale Woodland Energy; ARSIA: Tuscany, Italy, 2009; ISBN 978-88-8295-106-1. [Google Scholar]
- Jones, G.; Loeffler, D.; Calkin, D.; Chung, W. Forest treatment residues for thermal energy compared with disposal by onsite burning: Emissions and energy return. Biomass Bioenergy 2010, 34, 737–746. [Google Scholar] [CrossRef]
- Dyjakon, A. Harvesting and Baling of Pruned Biomass in Apple Orchards for Energy Production. Energies 2018, 11, 1680. [Google Scholar] [CrossRef]
- Velazquez-Marti, B.; Fernandez-Gonzales, E.; Lopez-Cortez, I.; Salazar-Hernandez, D.M. Quantification of the residual biomass obtained from pruning of trees in Mediterranean olive groves. Biomass Bioenergy 2011, 35, 3208–3217. [Google Scholar] [CrossRef]
- Spinelli, R.; Magagnotti, N.; Nati, C. Harvesting vineyard pruning residues for energy use. Biosyst. Eng. 2010, 105, 316–322. [Google Scholar] [CrossRef]
- Spinelli, R.; Picchi, G. Industrial harvesting of olive tree pruning residue for energy biomass. Bioresour. Technol. 2010, 101, 730–735. [Google Scholar] [CrossRef] [PubMed]
- Bosona, T.; Gebresenbet, G.; Olsson, S. Traceability System for Improved Utilization of Solid Biofuel from Agricultural Prunings. Sustainability 2018, 10, 258. [Google Scholar] [CrossRef]
- Zambon, I.; Colantoni, A.; Cecchini, M.; Mosconi, E.M. Article Rethinking Sustainability within the Viticulture Realities Integrating Economy, Landscape and Energy. Sustainability 2018, 10, 320. [Google Scholar] [CrossRef]
- Köhler, J.H.; Hohmann, C.; Dütschke, E. Sustainability Transitions in Local Communities: District Heating, Water Systems and Communal Housing Projects; Working Paper Sustainability and Innovation, No. S11/2018; Fraunhofer ISI: Karlsruhe, Germany, 2018. [Google Scholar]
- Luederitz, C.; Abson, D.J.; Audet, R.; Lang, D.J. Many pathways toward sustainability. Not conflict but co-learning between transition narra-tives. Sustain. Sci. 2017, 12, 393–407. [Google Scholar] [CrossRef]
- Verani, S.; Sperandio, G.; Picchio, R.; Marchi, E.; Costa, C. Sustainability Assessment of a Self-Consumption Wood-Energy Chain on Small Scale for Heat Generation in Central Italy. Energies 2015, 8, 5182–5197. [Google Scholar] [CrossRef] [Green Version]
- ENAMA—Ente Nazionale per la Meccanizzazione Agricola. Valorizzazione Energetica Delle Biomasse Legnose. Rome, Italy, October 2010. Available online: https://www.enama.it/userfiles/PaginaSezione/files/booklet/verde.pdf (accessed on 23 March 2018).
- Magagnotti, N.; Pari, L.; Picchi, G.; Spinelli, R. Technology alternatives for tapping the pruning residue resource. Bioresour. Technol. 2013, 128, 697–702. [Google Scholar] [CrossRef] [PubMed]
- Assirelli, A.; Croce, S.; Acampora, A. 2012 Potature di olivo da energia: Le trinciacaricatrici più adatte. L’Informatore Agrario 2012, 25, 32–36. [Google Scholar]
- Bilandzija, N.; Voca, N.; Kricka, T.; Matin, A.; Jurisic, V. Energy potential of fruit tree pruned biomass in Croatia. Span. J. Agric. Res. 2012, 10, 292–298. [Google Scholar] [CrossRef]
- Pari, L.; Alfano, V.; Garcia-Galindo, D.; Suardi, A.; Santangelo, E. Pruning Biomass Potential in Italy Related to Crop Characteristics, Agricultural Practices and Agro-Climatic Conditions. Energies 2018, 11, 1365. [Google Scholar] [CrossRef]
- Di Giacinto, S.; Leonardo, L.; Menghini, G.; Delfanti, L.; Egidi, G.; De Benedictis, L.; Riccioni, S.; Salvati, L. A Model for Estimating Pruned Biomass Obtained from Corylus avellana L. Appl. Math. Sci. 2014, 8, 6555–6564. [Google Scholar] [CrossRef]
- Bisaglia, C.; Romano, E. Utilization of vineyard prunings: A new mechanization system from residues harvest to CHIPS production. Biomass Bioenergy 2018, 115, 136–142. [Google Scholar] [CrossRef]
- Acampora, A.; Croce, S.; Assirelli, A.; Del Giudice, A.; Spinelli, R.; Suardi, A.; Pari, L. Product contamination and harvesting losses from mechanized recovery of olive tree pruning residues for energy use. Renew. Energy 2013, 53, 350–353. [Google Scholar] [CrossRef]
- Picchi, G.; Silvestri, S.; Cristoforetti, A. Vineyard residues as a fuel for domestic boilers in Trento Province (Italy): Comparison to wood chips and means of polluting emissions control. Fuel 2013, 113, 43–49. [Google Scholar] [CrossRef]
- Picchi, G.; Lombardini, C.; Pari, L.; Spinelli, R. Physical and chemical characteristics of renewable fuel obtained from pruning residues. J. Clean. Prod. 2018, 171, 457–463. [Google Scholar] [CrossRef]
- UNI EN 303-5:2012. Heating Boilers—Part 5: Heating Boilers for Solid Fuels, Manually and Automatically Stoked, Nominal Heat Output of up to 500 kW—Terminology, Requirements, Testing and Marking; Ente nazionale italiano di unificazione (UNI): Milan, Italy, 2012. [Google Scholar]
- D.P.R. 22 December 1986, n. 917. Approvazione del testo unico delle imposte sui redditi. Ital. Repub. Off. J. Rome, Italy, 1986. n. 302. Available online: http://www.gazzettaufficiale.it/ (accessed on 22 March 2018).
- Decree 16 February 2016. Aggiornamento della disciplina per l’incentivazione di interventi di piccole dimensioni per l’incremento dell’efficienza energetica e per la produzione di energia termica da fonti rinnovabili. Ital. Repub. Off. J. Rome, Italy, 2016. n. 51. Available online: http://www.gazzettaufficiale.it/ (accessed on 22 March 2018).
- Decree 19 August 2005, n. 192. “Attuazione della direttiva 2002/91/CE relativa al rendimento energetico nell’edilizia “coordinato con il D.Lgs. 311/2006, con il D.M. 26//09, con la L. 99/2009 e con il D.Lgs. 56/2010 -Annex C: Requisiti energetici degli edifici”. Ital. Repub. Off. J. Rome, Italy, 2005. n. 222. Available online: http://www.gazzettaufficiale.it/ (accessed on 20 March 2018).
- D.P.R. 26 agosto 1993, n. 412 Allegato A-Tabella dei gradi giorno dei comuni italiani raggruppati per regione e provincia. Ital. Repub. Off. J. Rome, Italy, 1993. n. 242. Available online: http://www.gazzettaufficiale.it/ (accessed on 20 March 2018).
- Norme Suisse 180 2014. Isolamento Termico, Protezione Contro L’umidità e Clima Interno Degli Edifici; Sociètè suisse des Ingènieurs et des Architettes (SIA): Zurich, Switzerland, 2014. [Google Scholar]
- Economic Development Ministry Decree 28/12/2012. “Incentivazione della produzione di energia termica da fonti rinnovabili ed interventi di efficienza energetica di piccole dimensioni”. Annex 40E: “Installazione di impianto di riscaldamento alimentatoa biomassa legnosa nel settore della serricoltura”. Ital. Repub. Off. J. Rome, Italy, 2013. n. 1. Available online: http://www.gazzettaufficiale.it/ (accessed on 20 March 2013).
- Francescato, V.; Berno, F.; Negrin, M.; Berton, M.; Zanetti, G. “Risparmio Energetico e Biomasse Agroforestali per il Riscaldamento delle Serre”, Padova, Italy. Available online: www.enama.it/studi-e-pubblicazioni/sbd5a3b41 (accessed on 10 September 2018). (In Italian).
- Moriasi, D.N.; Arnold, J.G.; Van Liew, M.W.; Bingner, R.L.; Harmel, R.D.; Veith, T.L. Model evaluation guidelines for systematic quantification of accuracy of watershed simulations. Trans. ASABE 2007, 50, 885–900. [Google Scholar] [CrossRef]
- Loague, K.; Green, R.E. Statistical and graphical methods for evaluating solute transport models: Overview and application. J. Contam. Hydrol. 1991, 7, 51–73. [Google Scholar] [CrossRef]
- Anderton, S.; Latron, J.; Gallart, F. Sensitivity analysis and multi-response, multi-criteria evaluation of a physically based distributed model. Hydrol. Process. 2002, 16, 333–353. [Google Scholar] [CrossRef]
© 2018 by the authors. Licensee MDPI, Basel, Switzerland. This article is an open access article distributed under the terms and conditions of the Creative Commons Attribution (CC BY) license (http://creativecommons.org/licenses/by/4.0/).

 ,
, 


