TMT’s Attention towards Financial Goals and Innovation Investment: Evidence from China


1
School of Economics and Management, Tongji University, Shanghai 200092, China
2
School of Management, Fudan University, Shanghai 200433, China
*
Author to whom correspondence should be addressed.
Sustainability 2018, 10(11), 4236; https://0-doi-org.brum.beds.ac.uk/10.3390/su10114236
Submission received: 12 October 2018
/
Revised: 9 November 2018
/
Accepted: 12 November 2018
/
Published: 16 November 2018
(This article belongs to the Special Issue Transition from China-Made to China-Innovation
)
Abstract
:Will the top managers’ attention to financial goals such as profit targets, operating expenses or debt payback schedule affect the firm’s innovation investment? The purpose of this study was to examine the relationship between the attention that the top management team (TMT) allocate on financial goals and R&D investment in Chinese firms. The roles of ownership type and company size as moderating effects in the relationship were also analyzed. This study used a panel dataset of 484 firms listed on the Shanghai Stock Exchange from 2010 to 2014. The results show that TMT’s attention to monetary objectives was negatively related to the R&D investment. In the state-owned and large-scale enterprises, the negative relationship between the TMT’s financial orientation and R&D investment is weak compared to that in private companies and smaller enterprises, respectively. Several conclusions have been drawn. First, the attention paid by TMT to financial goals significantly affects the innovation investment of the company. Specifically, when executives press the importance of monetary targets, they reduce innovation investment, given that the effects of firm-specific characteristics are controlled. Second, corporate ownership significantly moderates the relationship. Given the same degree of attention bias toward financial targets, compared with those in private companies, executives in state-owned companies tend to be more willing to invest in corporate innovation activities. Third, as the size of the company increases, the company’s comprehensive strength and ability to resist risks would increase, which in turn raises the willingness to undertake high-cost and long-term-to-realize-benefit innovation activities, thus alleviating the effect of TMT’s pressure on financial performance.
1. Introduction
Innovation is a critical motive of economic growth and development. It is also the cornerstone of business survival and the main driving force for business expansion. Since the concept was first put forward by Schumpeter (1934), the role and influence of innovation has become increasingly significant, especially in the 21st century when the society becomes more and more knowledge-based under the development and promotion of information technology. China used to be known for four great inventions in ancient times (i.e., compass, gunpowder, papermaking and printing), but innovation in the big country has slowed down and been surpassed by Western nations in modern times due to wars and poverty. Over the past 30 years, the growth of Chinese economy has been based on labor-intensive production and imported ideas and technology. However, resources are limited and imitation strategy is unsustainable for development. If Chinese companies want to change this kind of low-level imitation, they must change from imitation to independent innovation. Recognizing this problem, China has placed a determined emphasis on innovation and set the goal of becoming “an innovation-oriented nation”.
According to upper echelons theory [1], the strategic choices of enterprises such as innovation investment are not only influenced by the external environment and internal structure of the enterprise, but the top management team, as the decision makers, and their cognitive foundations and values are also important influencing factors. Since the introduction of upper echelons theory, more and more scholars have considered the influence of characteristics and perceptions of executive officers on the company’s strategic choices [2,3,4]. The mechanism is: due to the limitation of CEO cognition, greater CEO attention and focus are allocated to certain issues than to others [5], and they are normally the ones that they believe to be critical for the company’s growth and survival [6]. This is consistent with the attention-based view, which considers that studying corporate behavior is equivalent to discussing how the senior management team allocates and manages their limited attention.
Most existing literature centers on the impact on corporate innovation investment of the aspects of contextual factors such as institutional environment [7], corporate culture [8], stock liquidity [9], and stakeholder orientation [10]. Less research examines the influence of senior executives’ characteristics, among which the most remarkable are the predictions relating to CEO spatial (organization’s external versus internal focus) and temporal (past, present and future) biases [11,12,13]. Thus, CEO attention bias has been investigated as a predictor of innovation, but the bias toward financial goals, which is more or less seen in any CEO in reality during their cognitive processes of considering, planning and decision making, has been neglected. Therefore, based on upper echelons theory, attention-based view as well as the conceptual and practical understandings of financial orientation in enterprises, we studied the relationship between the executives’ attention allocated on financial goals and the company’s investment in innovation. In addition, contextual variables such as company size or ownership structure, which shape the organizational culture, governance structure and environment stimuli [14,15], may in turn moderate the above relationship, given that executives’ strategic decision-making process should be varied across different situations that they encounter. Therefore, we took the notion of the ownership type and the firm size as the moderators in the model.
The main contribution of this paper first lies in the examination of TMT’s psychological attention bias toward financial goals and further revealing its mechanism of inhibiting corporate innovation investment. We theorize and empirically illustrate that top managers’ biases in characteristically attending to the finance-related approaches and objectives shape the level of investment that the firm spends on innovation. The finding would add to the literature another implication of managerial psychology consideration in organizational outcomes prediction. Second, the variation of the relationship in different types of ownership and sizes of firm is also a contribution of this paper. We specify the environmental boundary conditions of TMT’s financial orientation in shaping innovation investment. Individuals’ cognition and action are not unidirectional and predictable from their characteristics, but linked to the context that they are situated, especially for top managers who have to constantly keep sharp ears and keen eyes on the changing environment to make lucid decisions. The findings, therefore, are expected to be both theoretically and practically meaningful. Third, the theories of upper echelons and attention-based view were applied in Chinese context, where the collective culture is distinct from the more individualistic Western contexts described in previous studies. The factors of whether a firm is private or state-owned and big- or small-sized might limit managerial discretion in Chinese organizational context [16] which in turn determines the extent to which managers resort to their psychological characteristics in making decision [17]. Lastly, with LIWC text analysis software, we directly quantified the psychological variable of TMT’s attention towards financial goals via text analysis method, which could be further developed by future research.
2. Theory and Hypotheses
2.1. TMT’s Attention and Strategic Choice
Attention, as defined by Ocasio (1997) [18], “encompass the noticing, encoding, interpreting, and focusing of time and effort by organizational decision-makers”. Herbert Simon (1948) [19] first proposed the concept of “Attention” as a new perspective to approach firm behavior by highlighting the bounded human rationality which results from the limits of attentional capacity of humans in explaining how firms make their decisions. He considered the organization as an attention-allocation system, where the key issues and answers that policy makers can focus on are limited, and how to effectively allocate the attention of decision makers becomes critical to decision-making. If decision makers face more information than they can handle, their attention becomes more selective [20]. Attention, therefore, is a type of organizational resource which is scarce yet vital, and understanding how decision makers’ attention is allocated and distributed can lead to the understanding of organizational behaviors [20,21,22]. Ocasio (1997) [18] further put forward attention-based view of the firm. He pointed out that “concern” is the process in which managers selectively focus their attention on the factors that they consider important and ignore other parts. Executives’ decision-making and subsequent organizational actions depend on what questions and answers executives focus on. The notion of attention allocation and the view based on it have been used to explain various organizational managerial processes, for instance, decision making [23,24], organizational change [25,26], management innovation [27,28], internationalization strategies [29,30], and expatriation effects [31].
In combination with the upper echelons theory, which emphasizes the role of top executives as the reflection of the organization [1], Ocasia’s theory can be expanded to suggest that the allocation of attention by the top management team members is an important part of the company’s strategic decision-making. The members are the top managers involved in strategic decision making identified by the CEO [32,33]. Setting directions of the company is the power and implicitly the obligation of CEOs [34]. However, in the case of environmental turbulence, when the situation becomes more complicated, making important strategic decisions would be tremendously difficult for a single top executive. Therefore, organizational outcomes should be understood as the result of a TMT’s attention allocation rather than a single CEO’s [35]. The attention will affect the managers’ selection and understanding of various types of information. Managers will have the option of focusing on information that they consider important, interpreting and giving meaning to them, and then determining the company’s future strategy based on these translated information [36]. Their attention allocation and translation, which guide their focus toward competing goals, therefore in turn will influence the company’s strategic direction and performance. Cho and Hambrick (2006) [25] further integrated the upper echelons theory with the attention-based view to study the relationship between management’s attention and corporate strategy decisions. Accordingly, the focus of the TMT’s attention drives the direction of the company’s strategic decision-making, and the TMT tends to make corresponding decisions on the events they care about. In a social environment with an explosive growth of information, managers’ time and energy are limited, and the attention they can allocate to different goals would therefore be limited and vary from one to another.
2.2. TMT’s Attention towards Financial Goals and Enterprise Innovation Investment
Literature on CEO’s financial orientation describes finance-driven managers to be biased toward the financial “way” of viewing things and making decisions [37]. This way may include valuing and paying much attention to market indicators as well as other short-term performance measures. Based on the conceptualization of innovation, we propose that the TMT’s biased attention toward financial goals may hinder the investment in innovation of the company.
Given the primary role of top management team in the company’s survival and success, it is reasonable to suggest that the extent to which innovation is encouraged or held back in a company directly depends on the executive managers’ assessment on and the level of attention they pay to the innovation opportunities. Innovation is central to firms’ competitive advantage and sustainable development. The significance of innovation for the economy’s growth as well as the firm’s survival has been acknowledged by a wide range of studies in the literature [38,39,40]. At the same time, innovation is a challenging mission since it encompasses a high level of risk. While the outcome of innovation is long term and unpredictable, the investment in innovation projects will generally affect the profits of the current period. Although future earnings may be enormous and contribute long-term values to the company, it has to pass the test of time and the risk of failure is undeniable [41]. Hence, innovation is considered to be opposite to short-term orientation. It is implied in various research on financial performance that, once the company faces the threat of hostile takeover or other financial depression situations, managerial myopia is exacerbated and managers are induced to sacrifice long-term intangible investment such as innovation and instead focus on the current profits [42,43,44,45]. In contrast, a high level of innovation is predicted by CEO’s greater focus on the future [13]. Thus, based on innovation’s nature of being long-term, unstable and risky, we predict that, if the top managers pay more attention to the financial performance of the company than to other operational perspectives, they will be more attracted by near-term objectives than long-term projects such as innovation investment.
In addition, the evaluation of a manager’s performance is partially measured based on the company’s financial performance during his/her working term. The current accounting information often called in includes depreciation, cash flow, book value, and current investment [46]. This obstructs any CEO from absolutely ignoring the financial returns on projects and requires them to carefully consider innovative projects with high investment risks and long return periods, let alone the fact that he/she has a disposition orientated toward monetary goals [47].
Hypothesis 1.
TMT’s attention towards financial goals has a significant negative effect on the company’s innovation investment.
2.3. The Moderating Role of Ownership Type and Firm Size
The principle of situated attention indicates that the manifestation of individuals’ attention bias and the extent to which it shapes their behaviors and decisions is triggered by the environment that they confront themselves with [48]. The principle highlights the effect of the context in shaping individual cognition, which was mentioned by Fiske and Taylor (1991) [49] as social cognition. Particularly in the case of organizational decision making, all the organizational culture and disciplines that people observe and fit themselves in will in turn affect how they think, where they focus attention and what they decide in any particular situation. This premise brings us to the emphasis on the role of enterprise ownership and firm size as potential moderators which may interact with CEO’s attention focus to ultimately shape the effect on innovation decisions made in a company.
2.3.1. Firm Ownership
The literature on strategic decision making process has acknowledged that corporate control, which is largely determined by the type of ownership, has important implications in the flow of making decision in a company [50,51]. Regarding state-owned enterprises (SOEs), as Lioukas et al. (1993) [51] described it, “the state is the sole or main owner of SOEs and possesses formal power to control their behavior”. The actual autonomy to make decision of executive managers in state-owned companies is certainly restricted, compared to that in private companies. Although the degree of state control in SOEs considerably varies across SOEs and countries, it is widely included in the circumscriptive meaning of public enterprises that “the state, regional governments or cities have significant control, through full, majority, or significant minority ownership” [52,53]. Therefore, state-owned enterprises are characterized by lack of autonomy due to political supervision, which considerably restricts executives from resorting to their personal perceptions, such as attention bias, in making decisions. In addition, unlike private companies which are fully market–oriented, SOEs’ operation and performance are driven by both political and economic forces. Not only pursuing profit maximization, SOEs’ decisions are intervened by government to attain non-economic goals natural resources, regional policies, employment, etc. [54]. Thus, in state-owned companies, even though the TMT’s orientation toward financial goals may drive their attention away from such long-term project as innovation, the government’s non-economic intentions in specific timing, given the control power of the state over such companies will mitigate the influence of biasness in the managers’ attention.
In China, even after a series of intensive and large-scaled reforms initiated in 1978 across three phases in an attempt to transition the nationalized and centralized economy toward a more market-based orientation, and, at micro level, to transform SOEs into modern corporations, state ownership remains dominant in the Chinese economy. The control of the state is not manifested in the number of state-owned companies because the number of SOEs sharply dropped as the result of numerous policies enacted during the reform (i.e., they decreased from 47,958 in 1998 to 5118 in 2009 according to SASACS report). Although the government let go of small companies, they maintained a hold on important firms of critical sectors, such as energy and raw materials, utilities, infrastructure construction, telecommunications, financial services, and subsidized to merge these firms into large SOEs. Eventually, SOEs control a substantial part of total enterprise assets in China even though their total number is marginal.
Despite the Chinese government’s commission of transforming into modern and transparent corporate governance process in SOEs, government authority still attends in almost all of the main functions in the enterprises through the representation of the central and local State Assets Supervision and Administrative Commissions (SASACs). Specifically, to fulfill the duties of a financer, SASAC closely supervises the use of state-owned assets by frequent auditing, drafts organizational regulations and laws, and has the total right to appoint, dismiss and evaluate chiefs. As Du, Tang and Young (2012) [55] emphasized that SASAC functions as a powerful and authoritative board of directors. Under this structure of governance, executive managers’ autonomy and discretion in Chinese state-owned companies are considerably restricted in comparison with private companies. The situational effect theory also manifests itself to explain the reason for CEOs’ mitigating the influence of their personal perceptions in making decisions, given that they do not have the total authority and that their performance and tenure (including appointment, dismissal, and transference) in the company are under the evaluation and arrangement of the SASACs.
Another corporate dimension that is characterized by ownership type is the budget constraint: state-owned companies are normally under a softer budget constraint than private ones [56]. SOEs are protected by different forms of legal barriers, thus are not threatened by competitors and pressured to generate profit to guarantee their long-term existence as in the case of private companies. SOEs’ managers, therefore, are not pushed to pursuit financial objectives. Rather, the companies can tolerate the shortcomings of long payback period and resist potential risks from the innovation investment [57]. In addition, bureaucratic appointment and dismissal remains a principal part in the process of executive selection in large SOEs, which isolates the executives from the replacement threats and secure them a “job for life” [58]. On the contrary, a CEO in a private company is at risk of being replaced if he/she fails in achieving profit targets. Without the strict guidance and supervision but at the same time protection and prioritization of the government as the case of state companies, the performance in the market is the measure for the success and the insurance for the survival of private companies.
Hypothesis 2.
The negative relationship between the level of attention paid by the top management team to financial goals and the innovation investment in state-owned enterprises is weaker than in private enterprises.
2.3.2. Firm Size
The positive relationship between firm size and innovation since it was first presented by Schumpeter (1942) [59] has been retested by massive empirical research. The results produced were mixed. Not all of them came out to support the Schumpeterian hypothesis that large firms are the main motive of technological development, taking into consideration different dimensions of market structure such as industry-specific characteristics or the type of product. However, in the aspect of financial capability which is relevant with the financial orientation we are considering within this research, the literature was consistent that small firms encounter more barriers relating to capital sourcing to approach innovation projects compared to larger firms [60,61]. Innovation process typically accrues large fixed and sunk costs, which need to be prepared before the production, and are independent of the market size and the gross returns, respectively. In addition, research and development (R&D) activities involve a high level of risk [62]. This requires firms to have large sales volumes, large economies of scale, risk diversification, and access to external finance to spread the risk and appropriate returns from innovation [63,64,65,66,67,68]. Given the huge costs incurred during the whole innovation process, if the CEO of the company is biased toward financial goals, he/she will carefully consider the investment and be more reluctant to invest on the innovation project if the company is of small size with scanty financial resource, compared to larger-sized firms.
Hypothesis 3.
The larger the firm size, the weaker the negative relationship between the TMT’s attention towards financial goals and the innovation investment.
3. Methodology
3.1. Data and Sample
The sample of companies we studied comes from A-share manufacturing firms listed in Shanghai Stock Exchange in China. The research data come mainly from two sources: annual Board reports of the sampled companies, from which some specific categories of word were extracted and used to measure the independent variable “TMT’s attention to financial goals”; and the key financial data required for the dependent variable, control variables and moderators measurement were obtained from the China Stock Market and Accounting Research (CSMAR) database. CSMAR is a comprehensive database of China stock returns, covering all companies listed on the Shanghai Stock Exchange and the Shenzhen Stock Exchange, including the data on China stock markets as well as financial statements of China’s listed companies. It is unavoidable that some data would be missing from a single data source. We supplemented the missing data by accessing different reliable websites such as Sina Finance and CNINFO indices.
We collected data on TMT attention focus and control variables from 2010 to 2014, and R&D data for innovation from 2011 to 2015. A time frame of five years is long enough to assess the reflection of financial attention in decision making [12]. Because the formal implementation of corporate projects always lags the emergence of ideas and intentions, we delayed the data of innovation for one year compared to the time of attention focus data. That is, independent variable, control variables and moderators were selected from 2010 to 2014, and the dependent variable was selected from 2011 to 2015. A total of 2341 observation data for five years were obtained.
3.2. Measures
3.2.1. Dependent Variable
R&D investment is one of the oldest and the most commonly used proxy measures of an enterprise’s innovative effort and ability [69,70,71]. Although it is argued that R&D expenditures can only capture the inputs of the innovation process and fails to reflect the productivity as well as quality of innovation because R&D activities data are biased toward formal, organized, systematic and continuous activities [9,72] and there are a other factors that need to come together for a firm to succeed in innovating [73], we still selected to use R&D expenditure data to capture the relationship between top managers’ financial attention and the firm’s innovation for one reason. R&D efforts are cognitive and intentional. Even though the correlation between R&D expenditure and the number of innovation patents is unstable across research, investing in R&D projects does show the organization’s interest on innovative creations. As mentioned above, the actual success or failure of an innovation projects are decided by different collective factors other than R&D investment which may be unpredictable and beyond the managers’ desires. Therefore, the interest in innovation reflected in R&D expenditure would be more connected to the CEO’s attention than other innovation proxies such as patent activity.
The R&D investment of an enterprise generally has two key indicators, R&D expenditure and R&D intensity. The absolute level of R&D expenditure which is expressed by the natural logarithm of the R&D expenditure reflects the level of effort that the firm dedicated to innovation maintaining the current market share [74]. However, R&D intensity, which is expressed as the ratio of R&D input costs to total assets of the company, is the most commonly used measure [75] because it can capture the relative importance of R&D among firms within industry and across industries. Due to the large differences in the total amount of R&D investment made by enterprises of different scales, R&D input intensity can better reflect the R&D investment status that is compatible with the size of the company and its market position. Therefore, we adopted the R&D input intensity indicator as the dependent variable, which is represented by R&D Intensity.
3.2.2. Independent Variable
Text analysis, or content analysis, is defined as a systematic, replicable technique for compressing many words of text into fewer content categories based on explicit rules of coding [76,77,78,79]. The premise underlining the invention of text analysis is that individual’s language can reflect the person’s cognitive and thought patterns [80]. Specifically, the words we habitually choose to use in daily life convey who we are, what we think, or the situation that we are put in [81,82]. Therefore, the analysis of word frequency in a massive amount of text can help to link everyday language use with the individual’s personality, social behavior, and cognitive styles [80,83]. Changes in the use of words can also reflect changes in a man’s attention [84].
We used LIWC2007 text analysis software to analyze TMT’s attention to financial goals. LIWC (Linguistic Inquiry and Word Count) is a text analysis computer program that counts words in psychologically meaningful categories across multiple text files, developed by the team of Pennebaker. After more than ten years of development, LIWC has a fairly good and stable validity and reliability. It can effectively translate textual data into quantitative data for analysis [85]. The core part of LIWC lies in its dictionary. SC-LIWC2007 (LIWC2007 Simplified Chinese Dictionary) includes 74 dimensions, with a total of 7444 words, each of which belongs to one or more different dimensions. The working mechanism is that the program would check if each word of the documents is in the dictionary and, if yes, which category (or categories) the word belongs to. The output, then, provides all LIWC categories together with the rates that each category was used in the given document text.
Finding valid and reliable data sources for managerial attention is challenging. The reluctance of top managers of public companies to participate in survey research results in low response rates [86]. In addition, the biases caused by social desirability, reactivity, researchers’ expectations, etc. are critical problems of interviews or self-reports [87,88]. Therefore, researchers are increasingly using archival sources to measure psychological factors of top managers [87,89]. Following recent management scholarship [25,90], we selected the company’s board report as the text source to analyze top managers’ attention. Board reports are managerial public addresses of major priorities and themes that are important to the firm. The reports include the mentioning and assessment of past achievements, current challenges, and plans for the future [91] and have been used extensively in top managers studies [12,26,88,92]. The content of the reports, therefore, provides investors with an opportunity to see the company through the eyes of management [93,94].
Through the measurement and analysis of SC-LIWC2007, we determined Money as the analysis dimension used for this research which includes a set of keywords such as “sales”, “expenses”, “bonus”, “budget”, “salary income”, “tax cost”, etc. The degree of TMT’s attention to financial goals is represented by the word frequency of Money dimension found in company’s board report, calculated by: Money = Total number of keywords in the text/total word number × 100%. The independent variable—TMT’s attention to financial goals—therefore hereinafter is denoted as “Money” in the analysis. Table 1 shows an illustration of the Money dimension.
3.2.3. Moderating Variables
We proposed two moderating variables: ownership type and firm size. Ownership type is a binary dummy variable. If the enterprise is a state-owned enterprise or the actual controller is a government, the value assigned is 1. If the enterprise is a non-state-owned enterprise, the value assigned is 0. Regarding firm size, we took the natural logarithm of the company’s total assets as the indicator.
3.2.4. Control Variables
According to previous research, profitability, growth rate of sales income [95,96], cash flow of the operating activities [97,98,99], proportion of the first large shareholders, scale of the independent directors, age of the enterprise [100], and redundant resources [101] may affect the level of innovation investment of the enterprise. These factors, therefore, are introduced in the model as control variables.
The names, codes and meanings of the variables studied in this paper are shown in Table 2.
4. Results
4.1. Descriptive Statistics and Correlation Analysis
Table 3 shows the means, standard deviations, and correlation coefficients among the variables. From the results in Table 3, it can be concluded that TMT’s attention to financial goals was negatively correlated with R&D intensity (r = −0.184, p < 0.01). The result was consistent with and provided initial support to our Hypothesis 1. At the same time, in the correlation coefficient matrix, the correlation coefficient between pairs of variables did not exceed 0.4, indicating that the collinearity between the variables of the model is low.
4.2. Hypothesis Testing
4.2.1. Main Effect
To reduce the influence of autocorrelation and heteroskedasticity of panel data on model regression results, we used time-series cross-sectional feasible generalized least squares (FGLS) regression model. While ordinary regression models assume a constant error variance throughout the sample, the data will face heteroskedasticity problem if the variance is not the same. Cross-sectional time-series feasible generalized-least squares regression can help to address this problem [102,103,104,105,106].
Table 4 shows the results of the FGLS regression analysis of the relationship between TMT’s attention toward financial goals and R&D intensity. Model 1 only contains control variables to control for the effects of these potential factors on the dependent variable. According to the results, among the factors that were predicted to influence innovation and thus were controlled in the model, three financial parameters—profitability, sales growth and cash flow of the operating activities—showed a significant effect on the dependent variable. Hypothesis 1 is tested in Model 2 by adding the variable Money. The hypothesis proposed that TMT attention to financial goals is negatively related to the company’s level of innovation investment. The coefficient representing this relationship is negative and significant (β = −6.371, p < 0.01), strongly support the proposition.
4.2.2. Moderating Effect
Hypotheses 2 and 3 proposed that corporate ownership and firm size will moderate the negative relationship between TMT’s attention to financial goals and firms’ innovation investment. Models 4 and 5 show the result of the proposition testing. To further eliminate the influence of multicollinearity, we centralized the independent variable and the moderating variable and created the interaction terms Money × Ownership and Money × Firm size, as shown in Models 4 and 5, respectively. The FGLS regression analysis in Model 4 showed that the coefficient of the interaction term between TMT’s attention toward financial goals and corporate ownership were significant (β = 13.071, p < 0.001), indicating that corporate ownership significantly moderates the relationship. Model 5 also showed the significant moderating effect of firm size (β = 6.508, p < 0.001).
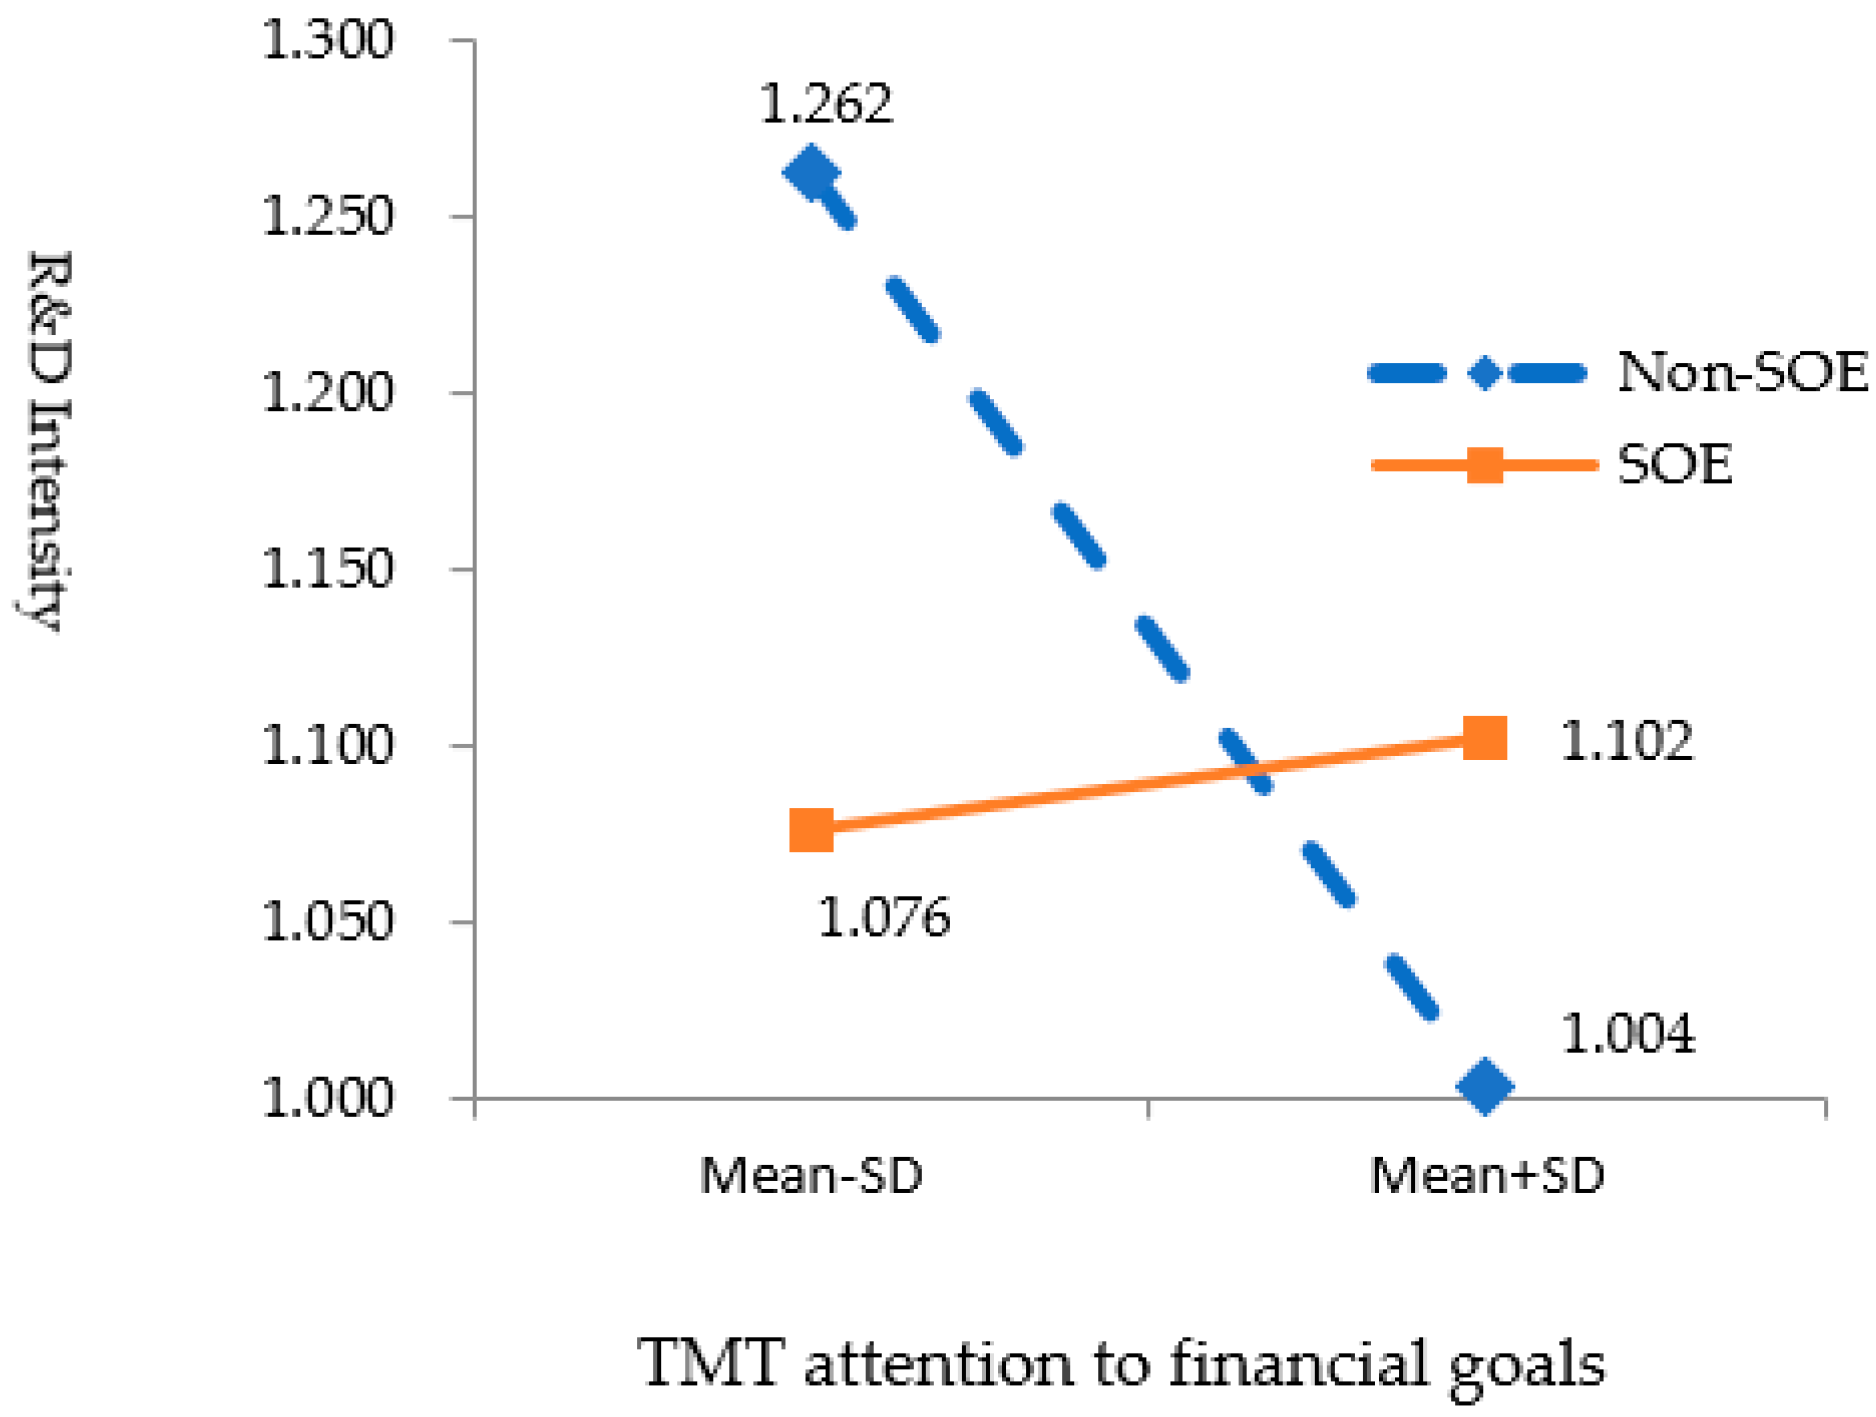
While the regression results can only point out if the moderating effects are statistically significant or not, the plotted interaction graphs in Figure 1 and Figure 2 clarify the comparative strength level and the direction of the moderation. We plotted moderating figures (Figure 1 and Figure 2) using the values of standard deviation below and above the mean to represent the low and high levels of the moderating variables using the coefficients in Model 6 [107] to observe the relationship between the TMT’s attention to financial goals and the corporate innovation investment under different types of ownership and sizes of companies.
In Figure 1, the attention paid by TMT to financial goals in private companies was negatively related to the R&D intensity, whereas in the case of state-owned enterprises the upward slope illustrated a positive relationship. This partially supports the proposition in Hypothesis 2: state ownership not only weakens the negative relationship between TMT financial attention bias but also turn it into positive. Therefore, Hypothesis 2 is partially supported.
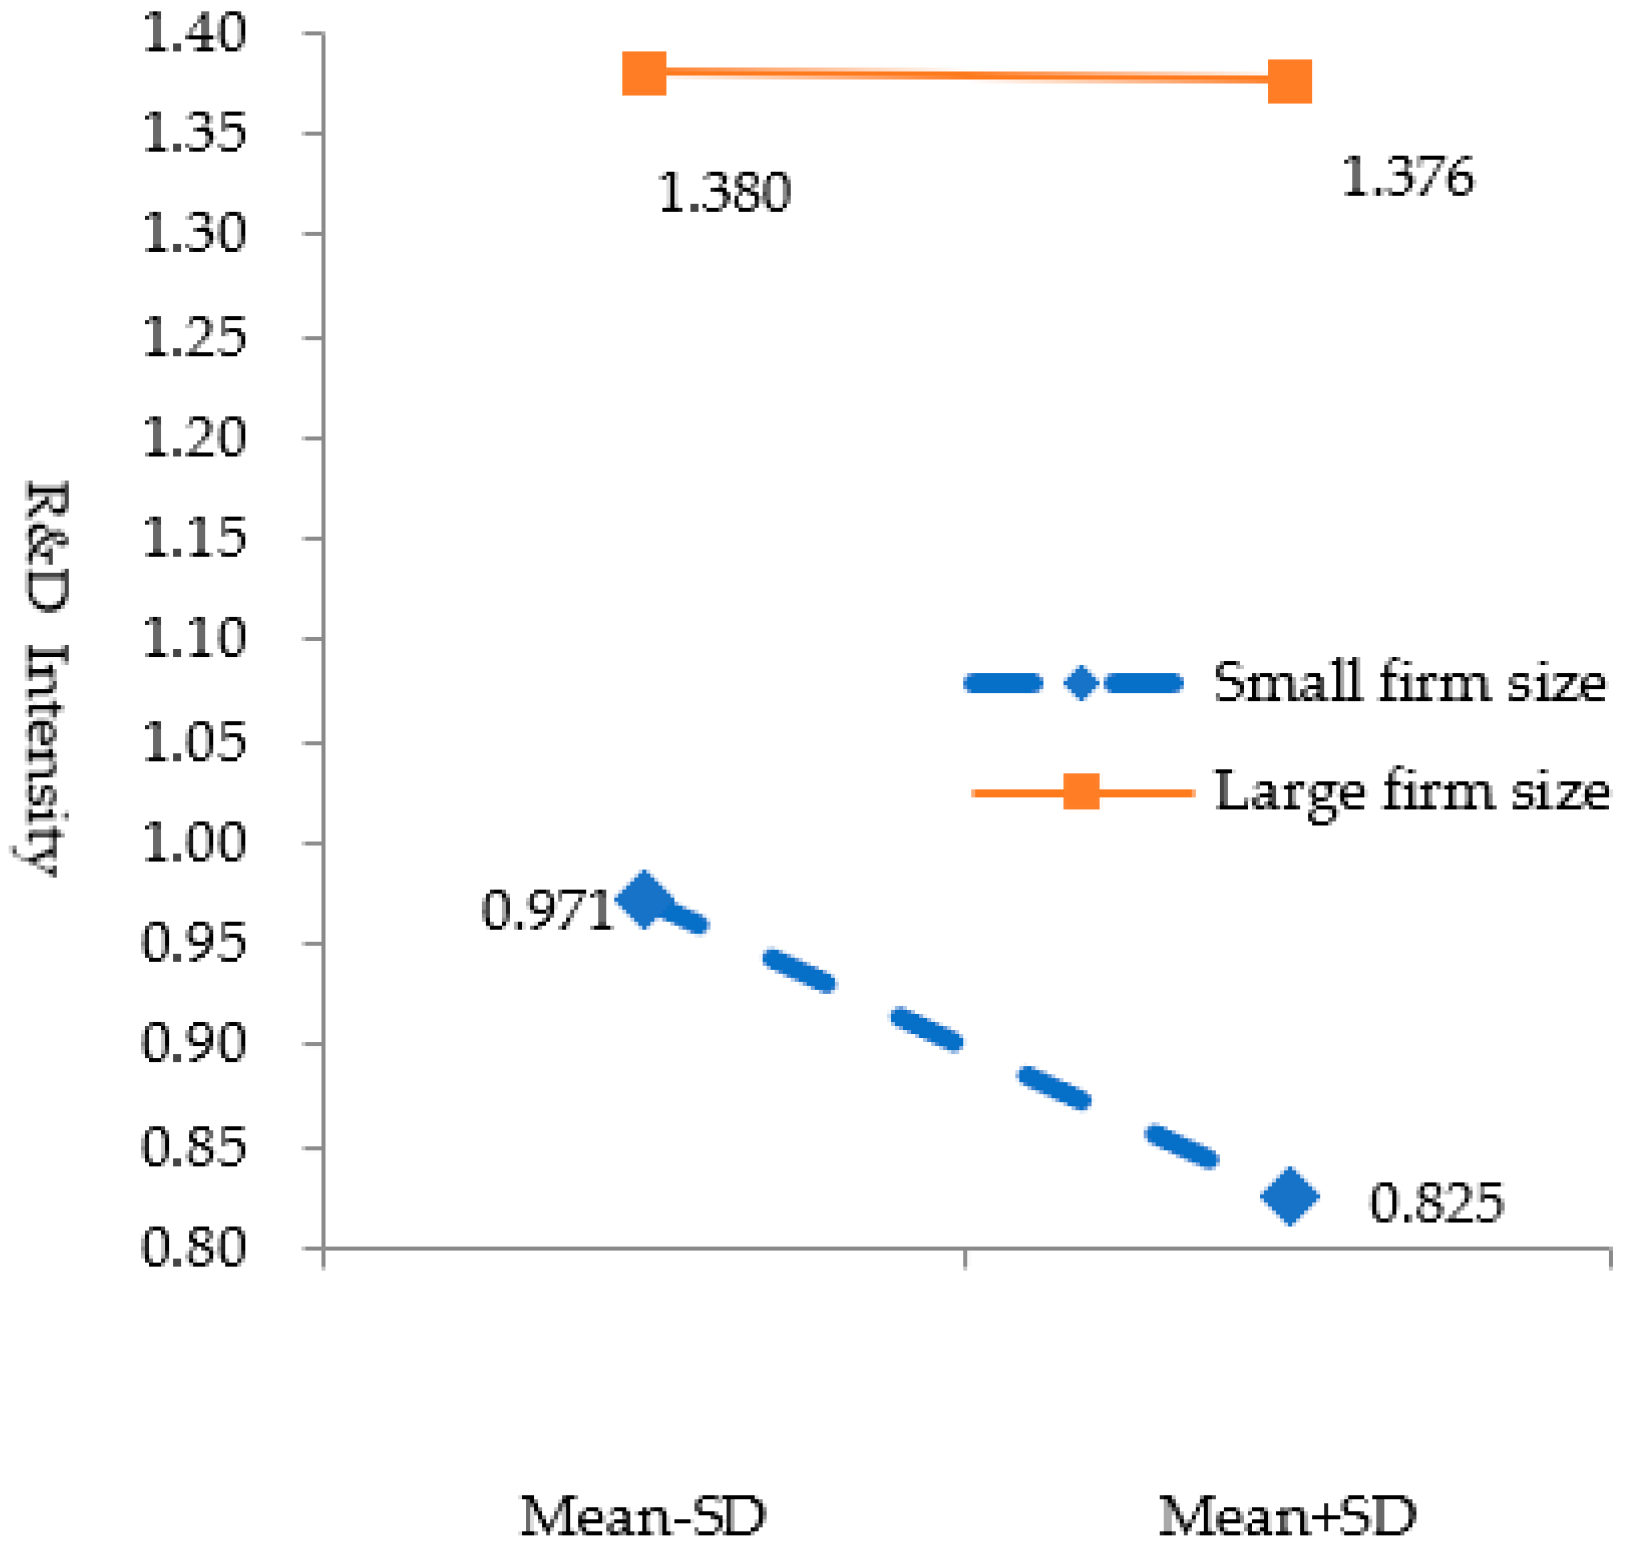
As shown in Figure 2, both lines illustrating the relationship when firm size is small and when firm size is big have downward slopes. In addition, as TMT’s attention to financial goals increases, the R&D intensity decreases significantly faster when the firm size is small (from 0.971 to 0.825). Therefore, Hypothesis 3 is strongly supported, confirming that the relationship between top managers’ attention bias toward financial goals and the level of innovation investment is more negative in small firms than in larger firms.
5. Discussion
5.1. Theoretical Implication
The result of the negative relationship between CEO’s attention bias toward financial and the company’s investment in innovation is consistent with what was captured in the upper echelons theory [1], the bounded rationality literature [108,109] and attention-based view [18]. The premise underlying the upper echelons theory can perfectly align with the notion mentioned in attention-based view as, while Hambrick and Mason explored the human side of managers, i.e., their backgrounds and psychological processes, conceptualizing organizational outcomes to be a reflection of top managers’ characteristics, Ocasio focused on one aspect of the whole mechanism: the attention bias in the manager’s cognitive process. Although top managers play the role as generalists who take an overarching responsibility in the entire company, as the focus of attention principle explained it, they will be selective in the issues that they focus their attention on [18]. The functional orientation which shapes their view would drive their energy, effort and mindfulness toward a limited set of elements and away from the others. Based on this premise, our research proposes and supports the notion that the orientation to the financial way of doing things drives CEOs away from paying attention and investing on long-term projects such as innovation investment. Given the role of innovation in sustainable development of an organization as well as the economy as a whole, enriching the literature with more and fresh considerations on the determinants which may predict the level of corporate innovation is necessary. This is not the first time that managerial attention bias is considered as a predictor of innovation. Previous studies also examined the influence of CEO spatial (organization’s external versus internal focus) and temporal (past, present and future) biases [11,12,13] on the firm’s engagement in innovation. However, by emphasizing the cognitive bias toward financial goals, and illustrating the empirical evidence that it is negatively related to the level of innovation investment in the firm, our paper again acknowledges innovation as a long-term strategic direction in comparison with short-term financial objective.
The mechanism of attention-based view on organizational outcomes such as innovation, however, is not “predictable from the knowledge of individual characteristics”, but is the result of that attention linking to the immediate context in which the manager is situated [18]. On the emphasis of this situated attention principle, this paper examines the contingency of the relationship between TMT’s attention toward financial goals and innovation investment on two contextual factors, ownership and firm size. The relationship turns from negative to positive in the context of state-owned companies. This result does not contradict what was predicted, but the change in the relationship between managers’ attention toward financial goals and innovation investment caused by the difference between ownership types is more extreme than our prediction. The results show that, in state-owned enterprises, TMT’s attention bias toward monetary purposes actually facilitates the investment in R&D activities. We explain the result by re-emphasizing the notion of innovation as a long-term investment which is crucial for the company’s survival and competitive development, and the environment in SOEs as a soft budget constraint context [56,58]. Managers’ myopic vision caused by financial pressure would be alleviated here. Although short-term performance goals often distract most of the senior management team’s attention, the loose monetary restriction in state-owned enterprises may drive financial oriented CEOs to the larger and longer-term benefit and competitiveness created by innovated products, production line, marketing, customer service, etc. The findings acknowledge the role of contextual factor in the interaction with individual characteristics to shape managerial cognition. It highlights that the attention toward financial goals is not always equal to short-term vision and the bias to immediate profitable opportunities, and that innovation can also be appreciated when financial goals are emphasized.
A similar explanation can be applied for the effect of company size. The larger a company is, the looser the budget constraint is, which mitigates the pressure of short-term monetary targets on the investment in innovation projects. At the same time, innovation conducted in large corporation can take advantage of the economies of scale to minimize the average cost and accelerate the benefit earned through the spillover to the whole large scale [63,64,65,66,67,68]. Therefore, large-scale enterprises tend to be more willing to carry out innovation activities for the growth of the enterprise and the promotion of comprehensive competitiveness to realize the long-term planning and sustainable development of the enterprise.
5.2. Practical Implications
One of the most notable implications of our finding is that the bias toward financial goals is more or less seen in any executive manager in reality during their cognitive processes of considering, planning and making decisions. The linkage of managerial attention to finance-related objectives to the firm’s innovation investment, therefore, would be widely applicable in practice.
For instance, the results suggested that, when managers are confronted with tight budget or shareholders’ priority of profit targets, their financially biased attention would be activated and influence their cognition and decision making, causing them to be reluctant to make investments which are risky and take time to realize profit such as innovation. This is good for firms when short-term financial objectives are prioritized and targeted. However, to attain long-run competitiveness, the inflation of top managers’ attentional bias to profit and other immediate gains may limit the firms’ realization of innovative opportunities which leads to missing valuable chances to gain competitive advantage. Therefore, an effective TMT should tread a fine line between short-term profit and revenue versus long-term development, which should begin from broadening managers’ attention to all angles of the picture rather than looking askew at some specific points. To do that, top manager team should be diversified in background, personalities and working styles. Besides, additional managerial training and development programs could be conducted on a regular basis to discuss and update executive managers with the changing environment with new obstacles and opportunities.
In the cases of private and small-sized enterprises, the tight budget and the emphasis on short-term financial objectives may require the company to pay even more attention to balance top management team’s attention in making strategic decisions. Although compared to state-owned and large firms, these firms are more sensitive to short-term spending, therefore all the investments should be more thoroughly considered before being implemented, strategic investment for long-run sustainable development such as innovation should also be prioritized in the strategic managerial level.
5.3. Limitations and Future Research Directions
Our research is bound by some limitations. First, the measurement of management attention—using text analysis by word counting method—may lead to a certain level of bias because the mention of finance-related words in a body of text in some cases does not indicate the writer’s psychological attention. Future research can consider the context of the word use, and embedding alternative sources such as managerial interviews, speeches, press releases, etc. Second, although our research contributes theoretical and practical value, the empirical evidence comes from a single industry in China. Further studies can expand the scope to different sectors to test the generalizability the theoretical constructs and propositions.
6. Conclusions
Scientific and technological innovation is the impetus for Chinese enterprises to realize long-term values and sustainable development. Technological advance resulting from innovation process has brought about great improvement in labor productivity, thus contributing to rapid economic growth and profoundly changing our way of life. Therefore, relevant research on the innovation investment of enterprises is of both theoretical and practical significance. Generalized least squares method was used to do regression analysis of the sampled panel data of 484 A-share manufacturing firms listed on the Shanghai Stock Exchange in China from 2010 to 2014, through which several conclusions have been drawn. First, the attention paid by TMT to financial goals significantly affects the innovation investment of the company. Specifically, when executives press the importance of monetary targets, they reduce innovation investment, given that the effects of firm-specific characteristics are controlled. Second, corporate ownership significantly moderates the relationship. Given the same degree of attention bias toward financial targets, compared with those in private companies, executives in state-owned companies tend to be more willing to invest in corporate innovation activities. Third, as the size of the company increases, the company’s comprehensive strength and ability to resist risks also increases, which in turn raises the willingness to undertake high-cost and long-term-to-realize-benefit innovation activities, thus alleviating the effect of TMT’s pressure on financial performance. The results provide practical implications for firms in balancing strategic attention toward short-run profit and long-term sustainable gains, involving the specific context of different firm sizes and types of ownership.
Author Contributions
Conceptualization, L.T.N. and S.C.; methodology, L.T.N. and K.X.; software, K.X.; validation, S.C. formal analysis, K.X. and L.T.N.; investigation, K.X.; resources, S.C.; writing—original draft preparation, K.X.; writing—review and editing, L.T.N. and G.Y.; visualization, L.T.N.; supervision, S.C.; project administration, S.C.; and funding acquisition, S.C. and G.Y.
Funding
This research was funded by National Natural Science Foundation of China (Grant No. 71672127 and No. 71572041).
Conflicts of Interest
The authors declare no conflict of interest.
References
- Hambrick, D.C.; Mason, P.A. Upper echelons: The organization as a reflection of its top managers. Acad. Manag. Rev. 1984, 9, 193–206. [Google Scholar] [CrossRef]
- Haleblian, J.; Finkelstein, S. Top management team size, CEO dominance, and firm performance: The moderating roles of environmental turbulence and discretion. Acad. Manag. J. 1993, 36, 844–863. [Google Scholar]
- Carpenter, M.A.; Geletkanycz, M.A.; Sanders, W.G. Upper echelons research revisited: Antecedents, elements, and consequences of top management team composition. J. Manag. 2004, 30, 749–778. [Google Scholar] [CrossRef]
- Buyl, T.; Boone, C.; Hendriks, W.; Matthyssens, P. Top management team functional diversity and firm performance: The moderating role of CEO characteristics. J. Manag. Stud. 2011, 48, 151–177. [Google Scholar] [CrossRef]
- Hambrick, D.C.; Finkelstein, S.; Mooney, A.C. Executive job demands: New insights for explaining strategic decisions and leader behaviors. Acad. Manag. Rev. 2005, 30, 472–491. [Google Scholar] [CrossRef]
- Kaplan, S. Cognition, capabilities, and incentives: Assessing firm response to the fiber-optic revolution. Acad. Manag. J. 2008, 51, 672–695. [Google Scholar]
- Chadee, D.; Roxas, B. Institutional environment, innovation capacity and firm performance in Russia. Crit. Perspect. Int. Bus. 2013, 9, 19–39. [Google Scholar] [CrossRef]
- Tellis, G.J.; Prabhu, J.C.; Chandy, R.K. Radical innovation across nations: The preeminence of corporate culture. Br. J. Mark. 2009, 73, 3–23. [Google Scholar] [CrossRef]
- Fang, V.W.; Tian, X.; Tice, S. Does stock liquidity enhance or impede firm innovation? Eur. J. Financ. 2014, 69, 2085–2125. [Google Scholar] [CrossRef]
- Flammer, C.; Kacperczyk, A. The impact of stakeholder orientation on innovation: Evidence from a natural experiment. Manag. Sci. 2015, 62, 1982–2001. [Google Scholar] [CrossRef]
- Balta, M.E.; Woods, A.; Dickson, K. Strategic decision-making processes as a mediator of the effect of board characteristics on company innovation: A study of publicly-listed firms in Greece. Phys. D 2013, 79, 306–319. [Google Scholar]
- Yadav, M.S.; Prabhu, J.C.; Chandy, R.K. Managing the future: CEO attention and innovation outcomes. Br. J. Mark. 2007, 71, 84–101. [Google Scholar] [CrossRef]
- Nadkarni, S.; Chen, J. Bridging yesterday, today, and tomorrow: CEO temporal focus, environmental dynamism, and rate of new product introduction. Acad. Manag. J. 2014, 57, 1810–1833. [Google Scholar] [CrossRef]
- Tan, J. Innovation and risk-taking in a transitional economy: A comparative study of Chinese managers and entrepreneurs. J. Bus. Ventur. 2001, 16, 359–376. [Google Scholar] [CrossRef]
- Lall, S. Technological capabilities and industrialization. World Dev. 1992, 20, 165–186. [Google Scholar] [CrossRef] [Green Version]
- Li, J.; Tang, Y.I. CEO Hubris and firm risk taking in China: The moderating role of managerial discretion. Acad. Manag. J. 2010, 53, 45–68. [Google Scholar] [CrossRef]
- Hambrick, D.C. Upper echelons theory: An update. Acad. Manag. Rev. 2007, 32, 334–343. [Google Scholar] [CrossRef]
- Ocasio, W. Towards an attention-based view of the firm. Strateg. Manag. J. 1997, 18, 187–206. [Google Scholar] [CrossRef]
- Simon, H.A. Administrative Behaviour: A Study of the Decision Making Processes in Administrative Organization; Macmillan Company: London, UK, 1948. [Google Scholar]
- Cyert, R.M.; March, J.G. A Behavioral Theory of the Firm; Prentice-Hall: Englewood Cliffs, NJ, USA, 1963; Volume 2, pp. 169–187. [Google Scholar]
- March, J.G.; Olsen, J.P. Ambiguity and Choice in Organizations; Universitetsforlaget: Oslo, Norway, 1976. [Google Scholar]
- Simon, H.A. Administrative Behaviour: A Study of Decision-Making Processes in Administrative Organizations, 4th ed.; The Free Press: New York, NY, USA, 1947. [Google Scholar]
- Barnett, M.L. An attention-based view of real options reasoning. Acad. Manag. Rev. 2008, 33, 606–628. [Google Scholar] [CrossRef]
- Shepherd, D.A.; McMullen, J.S.; Ocasio, W. Is that an opportunity? An attention model of top managers’ opportunity beliefs for strategic action. Strateg. Manag. J. 2017, 38, 626–644. [Google Scholar] [CrossRef]
- Cho, T.S.; Hambrick, D.C. Attention as the mediator between top management team characteristics and strategic change: The case of airline deregulation. Organ. Sci. 2006, 17, 453–469. [Google Scholar] [CrossRef]
- Eggers, J.P.; Kaplan, S. Cognition and renewal: Comparing CEO and organizational effects on incumbent adaptation to technical change. Organ. Sci. 2009, 20, 461–477. [Google Scholar] [CrossRef]
- Chen, S.; Bu, M.; Wu, S.; Liang, X. How does TMT attention to innovation of Chinese firms influence firm innovation activities? A study on the moderating role of corporate governance. J. Bus. Res. 2015, 68, 1127–1135. [Google Scholar] [CrossRef]
- Ren, C.R.; Guo, C. Middle managers’ strategic role in the corporate entrepreneurial process: Attention-based effects. J. Manag. 2011, 37, 1586–1610. [Google Scholar] [CrossRef]
- Bouquet, C.; Deutsch, Y. The impact of corporate social performance on a firm’s international diversification. J. Bus. Ethics 2008, 80, 755–769. [Google Scholar] [CrossRef]
- Levy, O. The influence of top management team attention patterns on global strategic posture of firms. J. Organ. Behav. 2005, 26, 797–819. [Google Scholar] [CrossRef]
- Plourde, Y.; Parker, S.C.; Schaan, J.L. Expatriation and its effect on headquarters’ attention in the multinational enterprise. Strateg. Manag. J. 2014, 35, 938–947. [Google Scholar] [CrossRef]
- Amason, A.C.; Mooney, A.C. The effects of past performance on top management team conflict in strategic decision making. Int. J. Confl. Manag. 1999, 10, 340–359. [Google Scholar] [CrossRef]
- Simons, T.; Pelled, L.H.; Smith, K.A. Making use of difference: Diversity, debate, and decision comprehensiveness in top management teams. Acad. Manag. J. 1999, 42, 662–673. [Google Scholar]
- Nadler, D.A.; Heilpern, J.D. The CEO in the Context of Discontinuous Change; Harvard Business School Press: Brighton, MA, USA, 1998; pp. 3–27. [Google Scholar]
- Hambrick, D.C. Top management groups: A conceptual integration and reconsideration of the “team” label. In Research in Organizational Behavior; Staw, B., Cummings, L.L., Eds.; JAI Press: Beverly Hill, CA, USA, 1994; Volume 16, pp. 171–213. [Google Scholar]
- Daft, R.L.; Weick, K.E. Toward a model of organizations as interpretation systems. Acad. Manag. Rev. 1984, 9, 284–295. [Google Scholar] [CrossRef]
- Andrews, A.O.; Welbourne, T.M. The people/performance balance in IPO firms: The effect of the Chief Executive Officer's financial orientation. Entrep. Theory. Pract. 2000, 25, 93–106. [Google Scholar] [CrossRef]
- Aghion, P.; Howitt, P. A model of growth through creative destruction. Econometrica 1992, 60, 323–351. [Google Scholar] [CrossRef]
- Grossman, G.M.; Helpman, D. Innovation and Growth in the Global Economy; MIT Press: Cambridge, MA, USA, 1991. [Google Scholar]
- Romer, P.M. Endogenous technological change. J. Polit. Econ. 1990, 98, S71–S102. [Google Scholar] [CrossRef]
- David, P.; Hitt, M.A.; Gimeno, J. The influence of activism by institutional investors on R&D. Acad. Manag. J. 2001, 44, 144–157. [Google Scholar]
- Shleifer, A.; Summers, L.H. Breach of trust in hostile takeovers. In Corporate Takeovers: Causes and Consequences; University of Chicago Press: Chicago, IL, USA, 1988; pp. 33–68. [Google Scholar]
- Kyle, A.S.; Vila, J.L. Noise trading and takeovers. Rand. J. Econ. 1991, 22, 54–71. [Google Scholar] [CrossRef]
- Bushee, B.J. Do institutional investors prefer near-term earnings over long-run value? Contemp. Account. Res. 2001, 18, 207–246. [Google Scholar] [CrossRef]
- Bushee, B.J. The influence of institutional investors on myopic R&D investment behavior. Account. Rev. 1998, 73, 305–333. [Google Scholar]
- Reichelstein, S. Investment decisions and managerial performance evaluation. Rev. Acc. Stud. 1997, 2, 157–180. [Google Scholar] [CrossRef]
- Hansen, G.S.; Hill, C.W.L. Are institutional investors myopic? A time-series study of four technology-driven industries. Strateg. Manag. J. 1991, 12, 1–16. [Google Scholar] [CrossRef]
- Ross, L.; Nisbett, R.E. The Person and the Situation: Perspectives of Social Psychology; Pinter & Martin Publishers: London, UK, 2011. [Google Scholar]
- Fiske, S.T.; Taylor, S. Social Cognition, 2nd ed.; Random House: New York, NY, USA, 1991. [Google Scholar]
- Lioukas, S.; Bourantas, D.; Papadakis, V. Managerial autonomy of state-owned enterprises: Determining factors. Organ. Sci. 1993, 4, 645–666. [Google Scholar] [CrossRef]
- Mintzberg, H. The Nature of Managerial Work; Harper and Row: New York, NY, USA, 1973; Chapters 15–17. [Google Scholar]
- OECD. The Measurement of Scientific and Technical Activities: Proposed Standard practice for Surveys of Research and Development; OECD: Paris, France, 1963. [Google Scholar]
- PWC. State-Owned Enterprises. Catalists for Public Value Creation? Available online: www.prsc.pwc.com (accessed on 29 October 2018).
- Grout, P.A.; Stevens, M. The assessment: Financing and managing public services. Oxf. Rev. Econ. Pol. 2003, 19, 215–234. [Google Scholar] [CrossRef]
- Du, F.; Tang, G.; Young, S.M. Influence activities and favoritism in subjective performance evaluation: Evidence from Chinese state-owned enterprises. Account. Rev. 2012, 87, 1555–1588. [Google Scholar] [CrossRef]
- Jin, Z.; Shang, Y.; Xu, J. The Impact of Government Subsidies on Private R&D and Firm Performance: Does Ownership Matter in China’s Manufacturing Industry? Sustainability 2018, 10, 2205. [Google Scholar]
- Cheng, Q.; Yin, Z.; Ye, J. State-owned enterprises and regional innovation efficiency: From the externality perspective. Ind. Econ. Res. 2015, 77, 10–20. [Google Scholar]
- Liu, F.; Zhang, L. Executive turnover in China’s state-owned enterprises: Government-oriented or market-oriented? China J. Account. Res. 2018, 11, 129–149. [Google Scholar] [CrossRef]
- Schumpeter, J. Creative Destruction. Capital. Soc. Democr. 1942, 825, 82–85. [Google Scholar]
- Galbraith, J.K. American Capitalism; Houghton Mifflin: Boston, MA, USA, 1956. [Google Scholar]
- Scherer, F.M. Industrial Market Structure and Economic Performance, 2nd ed.; Houghton Mifflin: Chicago, IL, USA, 1980. [Google Scholar]
- Symeonidis, G. Innovation, Firm Size and Market Structure; OECD: Paris, France, 1996. [Google Scholar]
- Fisher, F.M.; Temin, P. Returns to scale in research and development: What does the Schumpeterian hypothesis imply? J. Polit. Econ. 1973, 81, 56–70. [Google Scholar] [CrossRef]
- Dosi, G. Sources, procedures and microeconomic effects of innovation. J. Econ. Lit. 1988, 25, 1120–1171. [Google Scholar]
- Acs, Z.J.; Audretsch, D.B. Innovation in large and small firms: An empirical analysis. Am. Econ. Rev. 1988, 78, 678–690. [Google Scholar]
- Acs, J.Z.; Audretsch, D.B. (Eds.) Innovation and Technological Change: An International Comparison; University of Michigan Press: Ann Arbor, MI, USA, 1991. [Google Scholar]
- Acs, J.Z.; Audretsch, D.B. R&D firm size and innovative activity. In Innovation and Technological Change: An International Comparison; University of Michigan Press: Ann Arbor, MI, USA, 1991. [Google Scholar]
- Simeonidis, G. Innovation, Firm Size and Market Structure: Schumpeterian Hypothesis and Some New Themes; OECD Economics Development Working Paper; OECD: Paris, France, 2001; p. 161. [Google Scholar]
- OECD. The Organisation for Economic Co-Operation and Development; OECD: Paris, France, 1963. [Google Scholar]
- UNESCO. Provisional Guide to the Collection of Science Statistics. United Nations Educational Scientific and Cultural Organization; COM/MD/3; UNESCO: Paris, France, 31 December 1968. [Google Scholar]
- Godin, B. The Making of Science, Technology and Innovation Policy: Conceptual Frameworks as Narratives; Centre-Urbanisation Culture Société de l’Institut National de la Recherche Scientifique: Montreal, QC, Canada, 2009; pp. 1945–2005. [Google Scholar]
- Godin, B. Measurement and Statistics on Science and Technology: 1920 to the Present; Routledge: Abingdon, UK, 2004. [Google Scholar]
- Wakeman, S.; Le, T. Measuring the Innovative Activity of New Zealand Firms; New Zealand Productivity Commission: Wellington, New Zealand, 2015. [Google Scholar]
- NSF. Chapter 4: Research and Development: National Trends and International Linkages. In Science and Engineering Indicators 2010; National Science Foundation, National Center for Science and Engineering Statistics, National Science Board: Arlington, VA, USA, 13 October 2015. [Google Scholar]
- Cohen, W.M.; Levin, R.C.; Mowery, D.C. Firm size and R&D intensity: A re-examination. J. Ind. Econ. 1987, 35, 543–565. [Google Scholar]
- Berelson, B. Content Analysis in Communication Research; Free Press: Glencoe, IL, USA, 1952. [Google Scholar]
- U.S. General Accounting Office. Content Analysis: A Methodology for Structuring and Analyzing Written Material; GAO/PEMD-10.3.1; U.S. General Accounting Office: Washington, DC, USA, 1996.
- Krippendorff, K. Content Analysis: An Introduction to Its Methodology; Sage: Newbury Park, CA, USA, 1980. [Google Scholar]
- Weber, R.P. Basic Content Analysis, 2nd ed.; Sage: Newbury Park, CA, USA, 1990. [Google Scholar]
- Sapir, E. Grading, a study in semantics. Philos. Sci. 1944, 11, 93–116. [Google Scholar] [CrossRef]
- Tausczik, Y.R.; Pennebaker, J.W. The psychological meaning of words: LIWC and computerized text analysis methods. J. Lang. Soc. Psychol. 2010, 29, 24–54. [Google Scholar] [CrossRef]
- Chung, C.; Pennebaker, J.W. The Psychological Functions of Function Words. In Frontiers of Social Psychology. Social Communication; Psychology Press: New York, NY, USA, 2007; pp. 343–359. [Google Scholar]
- Gephart, R.P. The textual approach: Risk and blame in disaster sense-making. Acad. Manag. J. 1993, 36, 1465–1514. [Google Scholar]
- Namenwirth, J.Z.; Weber, R.P. Dynamics of Culture; Allen & Unwin: Boston, MA, USA, 2010. [Google Scholar]
- Pennebaker, J.W.; Chung, C.K.; Ireland, M.; Gonzales, A.; Booth, R.J. The development and psychometric properties of LIWC 2007. Austin 2015, 29, 1020–1025. [Google Scholar]
- Cycyota, C.S.; Harrison, D.A. What (not) to expect when surveying executives: A meta-analysis of top manager response rates and techniques over time. Organ. Res. Methods 2006, 9, 133–160. [Google Scholar] [CrossRef]
- Chatterjee, A.; Hambrick, D.C. It’s all about me: Narcissistic chief executive officers and their effects on company strategy and performance. Adm. Sci. Q. 2007, 52, 351–386. [Google Scholar] [CrossRef]
- Roberts, B.W.; Harms, P.; Smiths, J.L.; Dustin, W.; Webb, M. Using multiple methods in personality psychology. In Handbook of Multimethod Measurement in Psychology; Diener, M., Ed.; American Psychological Association: Washington, DC, USA, 2006; pp. 321–335. [Google Scholar]
- Peterson, R.S.; Smith, D.B.; Martorana, P.V.; Owens, P.D. The impact of chief executive officer personality on top management team dynamics: One mechanism by which leadership affects organizational performance. J. Appl. Psychol. 2003, 88, 795–809. [Google Scholar] [CrossRef] [PubMed]
- Kaplan, S.; Murray, F.; Henderson, R. Discontinuities and senior management: Assessing the role of recognition in pharmaceutical firm response to biotechnology. Ind. Corp. Chang. 2003, 12, 203–233. [Google Scholar] [CrossRef]
- Osborne, J.D.; Stubbart, C.I.; Ramaprasad, A. Strategic groups and competitive enactment: A study of dynamic relationships between mental models and performance. Strateg. Manag. J. 2001, 22, 435–454. [Google Scholar] [CrossRef]
- Hu, Y.; Chen, S.; Wang, J. Managerial Humanistic Attention and CSR: Do Firm Characteristics Matter? Sustainability 2018, 10, 4029. [Google Scholar] [CrossRef]
- Roger, R.K.; Grant, J. Content Analysis of Information Cited in Reports of Sell-Side Financial Analysts. J. Financ. Statement Anal. 1997, 3, 17–30. [Google Scholar]
- Clarkson, P.M.; Kao, J.L.; Richardson, G.D. Evidence that management discussion and analysis (MD&A) is a part of a firm's overall disclosure package. Contemp. Account. Res. 1999, 16, 111–134. [Google Scholar] [CrossRef]
- Domadenik, P.; Prasnikar, J.; Svejnar, J. How to increase R&D in transition economies? Evidence from Slovenia. Rev. Dev. Econ. 2008, 12, 193–208. [Google Scholar]
- Coad, A.; Rao, R. Firm growth and R&D expenditure. Econ. Innov. New Technol. 2010, 19, 127–145. [Google Scholar] [Green Version]
- Bloch, C. R&D investment and internal finance: The cash flow effect. Econ. Innov. New Technol. 2005, 14, 213–223. [Google Scholar]
- Mulkay, B.; Hall, B.H.; Mairesse, J. Investment and R&D in France and in the United States. In Investing Today for the World Tomorrow; Herrmann, H., Strauch, R., Eds.; Springer: Berlin, Germany, 2001. [Google Scholar]
- Xu, J.; Sim, J.-W. Characteristics of Corporate R&D Investment in Emerging Markets: Evidence from Manufacturing Industry in China and South Korea. Sustainability 2018, 10, 3002. [Google Scholar]
- Brown, J.R.; Fazzari, S.M.; Petersen, B.C. Financing innovation and growth: Cash flow, external equity, and the 1990s R&D boom. J. Financ. 2009, 64, 151–185. [Google Scholar]
- Bond, S.; Harhoff, D.; Van Reenen, J. Investment, R&D and financial constraints in Britain and Germany. Annales d’Économie et de Statistique 2005, 79–80, 435–463. [Google Scholar]
- Greene, W.H. Econometric analysis. Contr. Manag. Sci. 2002, 89, 182–197. [Google Scholar]
- Wooldridge, J. Econometric Analysis of Crosssection and Panel Data; MIT Press: Cambridge, MA, USA, 2002. [Google Scholar]
- Yang, H.; Zheng, Y.; Zhao, X. Exploration or exploitation? Small firms’ alliance strategies with large firms. Strateg. Manag. J. 2014, 35, 146–157. [Google Scholar] [CrossRef]
- Zhang, Y.; Rajagopalan, N. Once an outsider, always an outsider? CEO origin, strategic change, and firm performance. Strateg. Manag. J. 2010, 31, 334–346. [Google Scholar] [CrossRef]
- Philippe, D.; Durand, R. The impact of norm-conforming behaviors on firm reputation. Strateg. Manag. J. 2011, 32, 969–993. [Google Scholar] [CrossRef]
- Aiken, L.S.; West, S.G. Multiple regression: Testing and interpreting interactions—Institute for social and economic research (ISER). J. Oper. Res. Soc. 1991, 45, 119–120. [Google Scholar]
- March, J.G.; Simon, H.A. Organizations; Wiley: New York, NY, USA, 1958. [Google Scholar]
- Dearborn, D.C.; Simon, H.A. Selective perception: A note on the departmental identifications of executives. Sociometry 1958, 21, 140–144. [Google Scholar] [CrossRef]
Figure 1.
Moderating Effect of Ownership.

Figure 2.
Moderating Effect of Firm Size.


Table 1.
Sample of money dimension
| Dictionary | Dimension | Amount | Sample |
|---|---|---|---|
| SC-LIWC2007 | Money | 116 | sales, expenses, remuneration, promotion bonus, tax cost, salary income budget |
Table 2.
Variable assignment explanation.
| Category | Variable | Code | Meaning |
|---|---|---|---|
| Dependent Variable | R&D investment | R&D Intensity | R&D investment/Corporate total assets × 100% |
| Independent Variable | TMT’s attention to financial goals | Money | Key word frequency/Text number × 100% |
| Control Variable | Profitability | ROA | Return on total assets (%) |
| Sales growth | Sales Growth | Growth rate of sales income (%) | |
| The Cash flow of the operating activities | CFO | Operating cash net flow/Corporate total assets | |
| The proportion of the first large shareholders | CR1 | The proportion of the first large shareholder (from CSMAR) | |
| The scale of the independent directors | Board Independence | Number of independent directors/Total number of directors | |
| Firm age | Firm Age | Sample year—Year of establishment | |
| Slack resource | Slack Resource | Cash flow/Corporate total assets | |
| Moderating Variable | Ownership | Ownership | If the enterprise is a state-owned enterprise or the actual controller is a government, the value assigned is 1; otherwise, the value assigned is 0 |
| Firm size | Firm Size | Natural logarithm of corporate total assets |
Table 3.
Means, standard deviations, and correlations.
| Variables | M | SD | 1 | 2 | 3 | 4 | 5 | 6 | 7 | 8 | 9 | 10 | |
|---|---|---|---|---|---|---|---|---|---|---|---|---|---|
| 1 | ROA | 0.031 | 0.065 | ||||||||||
| 2 | Sales Growth | 0.167 | 0.640 | 0.191 ** | |||||||||
| 3 | CFO | 0.036 | 0.074 | 0.355 ** | 0.049 * | ||||||||
| 4 | CR1 | 0.358 | 0.152 | 0.114 ** | −0.009 | 0.113 ** | |||||||
| 5 | Board Independence | 0.365 | 0.049 | −0.009 | 0.023 | −0.018 | 0.017 | ||||||
| 6 | Firm Age | 15.350 | 4.120 | −0.068 ** | 0.010 | −0.010 | −0.238 ** | −0.051 * | |||||
| 7 | Slack Resource | 0.009 | 0.083 | 0.205 ** | 0.119 ** | 0.221 ** | 0.011 | 0.017 | −0.031 | ||||
| 8 | Ownership | 0.550 | 0.497 | −0.109 ** | −0.059 ** | −0.041 * | 0.274 ** | 0.017 | −0.004 | −0.034 | |||
| 9 | Firm Size | 9.616 | 0.551 | 0.129 ** | −0.011 | 0.155 ** | 0.363 ** | −0.029 | −0.103 ** | 0.021 | 0.201 ** | ||
| 10 | Money | 0.084 | 0.012 | −0.043 * | 0.084 ** | −0.072 ** | −0.169 ** | 0.042 * | 0.151 ** | −0.013 | −0.129 ** | −0.247 ** | |
| 11 | Intensity | 1.414 | 1.449 | 0.188 ** | −0.015 | 0.146 ** | 0.054 ** | −0.009 | −0.077 ** | 0.031 | 0.004 | 0.085 ** | −0.184 ** |
Note: *** p < 0.001, ** p < 0.01, * p < 0.05.
Table 4.
Results of regression analysis.
| Variables | Model 1 | Model 2 | Model 3 | Model 4 | Model 5 | Model 6 |
|---|---|---|---|---|---|---|
| ROA | 0.707 *** | 0.723 *** | 0.660 *** | 0.632 *** | 0.682 *** | 0.646 *** |
| −0.214 | −0.211 | −0.192 | −0.192 | −0.191 | −0.192 | |
| Sales Growth | −0.044 * | −0.036 * | −0.043 ** | −0.036 * | −0.040 ** | −0.035 * |
| −0.017 | −0.017 | −0.016 | −0.016 | −0.015 | −0.016 | |
| CFO | 0.737 *** | 0.720 *** | 0.677 *** | 0.610 *** | 0.675 *** | 0.607 *** |
| −0.162 | −0.163 | −0.153 | −0.156 | −0.151 | −0.155 | |
| CR1 | 0.069 | −0.01 | −0.452 ** | −0.449 ** | −0.457 *** | −0.455 *** |
| −0.134 | −0.139 | −0.145 | −0.142 | −0.143 | −0.141 | |
| Board Independence | 0.098 | 0.071 | −0.02 | −0.003 | 0.002 | −0.005 |
| −0.26 | −0.263 | −0.255 | −0.259 | −0.253 | −0.257 | |
| Firm Age | −0.001 | −0.001 | −0.008 | −0.006 | −0.007 | −0.005 |
| −0.005 | −0.005 | −0.005 | −0.005 | −0.005 | −0.005 | |
| Slack Resource | −0.017 | −0.026 | −0.094 | −0.072 | −0.091 | −0.071 |
| −0.111 | −0.111 | −0.107 | −0.106 | −0.106 | −0.106 | |
| Money | −6.371 *** | −4.432 *** | −4.258 *** | −3.854 *** | −4.075 *** | |
| −1.165 | −1.158 | −1.137 | −1.129 | (1.106)) | ||
| Ownership | −0.039 | −0.037 | −0.047 | 0.407 *** | ||
| −0.044 | −0.044 | −0.044 | −0.038 | |||
| Firm Size | 0.420 *** | 0.405 *** | 0.408 *** | −0.005 | ||
| −40 | −0.039 | −0.038 | −1.106 | |||
| Money * Ownership | 13.071 *** | 11.424 *** | ||||
| −2.255 | −2.366 | |||||
| Money * Firm size | 6.508 *** | 3.737 * | ||||
| −1.661 | −1.678 | |||||
| Industry sectors | Controlled | Controlled | Controlled | Controlled | Controlled | Controlled |
| Wald Chi2 | 39.83 *** | 69.68 *** | 195.85 *** | 233.10 *** | 221.02 *** | 245.44 *** |
Note: Standard errors are in parentheses (significance levels: *** p < 0.001, ** p < 0.01, * p < 0.05, two-tailed tests).
© 2018 by the authors. Licensee MDPI, Basel, Switzerland. This article is an open access article distributed under the terms and conditions of the Creative Commons Attribution (CC BY) license (http://creativecommons.org/licenses/by/4.0/).
Share and Cite
MDPI and ACS Style
Chen, S.; Xu, K.; Nguyen, L.T.; Yu, G. TMT’s Attention towards Financial Goals and Innovation Investment: Evidence from China. Sustainability 2018, 10, 4236. https://0-doi-org.brum.beds.ac.uk/10.3390/su10114236
AMA Style
Chen S, Xu K, Nguyen LT, Yu G. TMT’s Attention towards Financial Goals and Innovation Investment: Evidence from China. Sustainability. 2018; 10(11):4236. https://0-doi-org.brum.beds.ac.uk/10.3390/su10114236
Chicago/Turabian StyleChen, Shouming, Kaidi Xu, Luu Thi Nguyen, and Guangsheng Yu. 2018. "TMT’s Attention towards Financial Goals and Innovation Investment: Evidence from China" Sustainability 10, no. 11: 4236. https://0-doi-org.brum.beds.ac.uk/10.3390/su10114236
Note that from the first issue of 2016, this journal uses article numbers instead of page numbers. See further details here.