A Multi-Modal Route Choice Model with Ridesharing and Public Transit

1
School of Economics and Management, Beijing Jiaotong University, Beijing 100044, China
2
School of Economics and Management, Beihang University, Beijing 100191, China
*
Author to whom correspondence should be addressed.
Sustainability 2018, 10(11), 4275; https://0-doi-org.brum.beds.ac.uk/10.3390/su10114275
Submission received: 19 October 2018
/
Revised: 11 November 2018
/
Accepted: 15 November 2018
/
Published: 19 November 2018
(This article belongs to the Special Issue New Governance Model and Strategy to Improve a Sustainable Transport System)
Abstract
:With the extensive use of smart-phone applications and online payment systems, more travelers choose to participate in ridesharing activities. In this paper, a multi-modal route choice model is proposed by incorporating ridesharing and public transit in a single-origin-destination (OD)-pair network. Due to the presence of ridesharing, travelers not only choose routes (including main road and side road), but also decide travel modes (including solo driver, ridesharing driver, ridesharing passenger, and transit passenger) to minimize travelers’ generalized travel cost (not their actual travel cost due to the existence of car capacity constraints). The proposed model is expressed as an equivalent complementarity problem. Finally, the impacts of key factors on ridesharing behavior in numerical examples are discussed. The equilibrium results show that passengers’ rewards and toll charge of solo drivers on main road significantly affect the travelers’ route and mode choice behavior, and an increase of passengers’ rewards (toll) motivates (forces) more travelers to take environmentally friendly travel modes.
1. Introduction
With the economic development in big cities and the explosion of population, the number of vehicles has been increasing rapidly, and thus traffic congestion has been a severe problem that is faced by travelers in metropolis every day [1,2,3,4]. Recently, ridesharing is a hot topic and regarded as an effective way to reduce traffic congestion on roads and raise road network efficiency without new network infrastructures [5,6]. It is believed that the emergence of ridesharing activities is conducive to sustainable development of the cities and future cities with wisdom [7,8]. With the extensive use of global position system, smart-phone applications, and online payment systems, there exist lots of digital platforms for matching drivers with riders, such as, Didi Chuxing in China, Uber and Lyft in USA, the existence of ridesharing activities has successfully influenced individual daily travel behavior, especially in big cities.
During the past few years, the majority of ridesharing studies have focused on the ridesharing matching problems. Teodorović and Dell’Orco [9,10] developed the bee colony optimization metaheuristic that is capable of solving deterministic combinatorial problems for the ride-matching problem. Agatz et al. [11] proposed optimization-based approaches to minimize the total system-wide vehicle miles and their individual travel costs. Ghoseiri et al. [12], Wang et al. [13], and Najmi et al. [14] presented dynamic rideshare matching optimization models to identify suitable matches between passengers and drivers. Stiglic et al. [15] introduced meeting points in a ride-sharing system, which could substantially improve the percentage of matched riders, the percentage of matched participants, and the mileage savings. Masoud and Jayakrishnan [16,17] developed a decomposition algorithm and a dynamic programing algorithm to solve the Peer-to-Peer ride-matching problem, respectively. Jiang et al. [18] proposed an online greedy-matching algorithm to solve the ridesharing problem in order to propose matches between drivers and passengers. Hou et al. [19] presented a ridesharing matching problem on how to choose the best routes for ridesharing vehicles to maximize the average loading ratio of the entire system.
Recently, there is a small but growing body of studies with respect to ridesharing activities to explain travel behavior within the transportation domain. Some researchers have conducted empirical studies [8,11,20,21,22,23,24,25,26,27,28]; some researchers have studied travelers’ route choice and mode decision making process when ridesharing activities are incorporated into the morning commute problem [29,30,31] and the traffic assignment problem [32,33,34,35,36,37]. As for empirical studies, for instance, Morency [8] used travel data from four large-scale origin-destination (OD) surveys to study the evolution of the ridesharing market in the Greater Montreal Area, and found that commuters were at one time more inclined (or forced) to share car seats and then less people chose to share rides with others (because travelers wanted more freedom to travel as they wish with the rapid urban development and economic growth); Caulfield [20] conducted a logistic regression analysis to examine the characteristics of the individuals that rode shares in Dublin, and found that females and those in couples were most likely to rideshare; Erdoğan et al. [21] studied the demand for ridesharing in a university campus context by using a commuter survey data, developed ordered probit models to investigate interest in ridesharing, and found that taste heterogeneity significantly affected propensity to rideshare; Lee et al. [25] conducted a self-reported online survey among Uber users in Hong Kong, used the structural equation modeling technique to analyze the empirical results, and found that perceived risks, perceived benefits, trust in the platform, and perceived platform qualities significantly influenced users’ intention to participate in Uber; Stiglic et al. [26] used an extensive computational study to investigate the potential benefits as well as synergies of the seamless integration of ride-sharing and public transit, and found that such a system could significantly enhance mobility and increase the use of public transport. These abovementioned studies have also investigated the impacts of ridesharing activities on traffic congestion and further discussed what should and could be done to motivate travelers to choose more environmentally friendly travel modes in the existing transportation network.
The traffic assignment problem has gained popularity worldwide among researchers to develop models that appropriately explain the decision-making process that is faced by commuters everyday choosing route from origin to destination [38,39,40,41,42,43,44,45]. Given the network topology, OD travel demands, and link performance, the classical traffic assignment model aims to determine travelers’ path choices having the minimum path travel cost [46]. At a user equilibrium (UE) state, no traveler can improve his or her path travel cost by unilaterally changing his or her path. The advent of a ridesharing program provides travelers more travel modes (i.e., sharing a ride as a driver, sharing a ride as a rider) and makes the traffic assignment model add car capacity constraints, the goal of the traffic assignment model with ridesharing is to determine travelers’ path and mode choices to minimize their generalized path travel cost (not their actual path travel cost on account of the car capacity constraints). At a ridesharing user equilibrium (RUE) state, no traveler can improve his or her generalized travel cost by either unilaterally changing his or her routes or travel modes [32,33,35,36].
In a general transportation network, a ridesharing scheme was integrated into the static traffic assignment model with elastic travel demands [32] and with inelastic travel demands [35,36], assuming that ridesharing drivers can only pick up riders with the same origin-destination (OD) pair; Xu et al. [33] relaxed the same-OD-pair assumption, formulated the ridesharing user equilibrium with fixed travel demands as a mixed complementarity problem, and assumed that a passenger can be picked up by a driver and then dropped off at an intermediate node to be picked up again by different drivers. However, the aforesaid traffic assignment studies ignore the public transit mode (i.e., transit passenger).
In a single-corridor transportation network, Wang et al. [37] investigated the impacts of appropriate cost-sharing strategies on the success of ridesharing programs when considering the public transit, modeled the mode choices of heterogeneous travelers with different values of time, and studied the interactions between travelers’ mode choices and the attractiveness of ridesharing. But, in the above-mentioned study, the travel time of four travel modes (including solo driver, ridesharing driver and rider, and transit user) is fixed, and route choices are ignored.
Therefore, this paper proposes a multi-modal route choice model integrating ridesharing and public transit into a single-OD-pair network to study the impacts of ridesharing activities on the traffic assignment problem. In the proposed model, travelers not only choose routes (including main road and side road), but also decide transportation modes (including solo driver, ridesharing driver, ridesharing passenger, and public transit passenger) to minimize travelers’ generalized travel cost (not their actual travel cost thanks to the existence of car capacity constraints). Then, we formulate an equivalent complementarity problem of the proposed model solved by the routine “Mixed Complementarity Problem (MCP)” of the solver “PATH” in General Algebraic Modeling System (GAMS) [47].
In order to encourage travelers to join in ridesharing and public transit modes, the proposed model assumes that both ridesharing drivers and passengers (including ridesharing passengers and public transit passengers) receive extra rewards. Ridesharing vehicles could use the main road freely while single-occupancy vehicles using the main road are charged a toll. We analyze the impacts of key parameters (e.g., rewards, toll, car capacity, bus capacity, privacy cost) on equilibrium results in the numerical examples. The numerical results show that rewards and toll are effective measures to motivate travelers to participate in green commuting and thus reduce traffic congestion.
The remainder of the paper is organized, as follows. The next section formulates two traffic assignment models in road networks with a single OD pair. Section 3 illustrates the numerical results and discusses what strategies could guide more travelers to choose environmentally friendly travel modes. The last section concludes this study.
2. Model Description
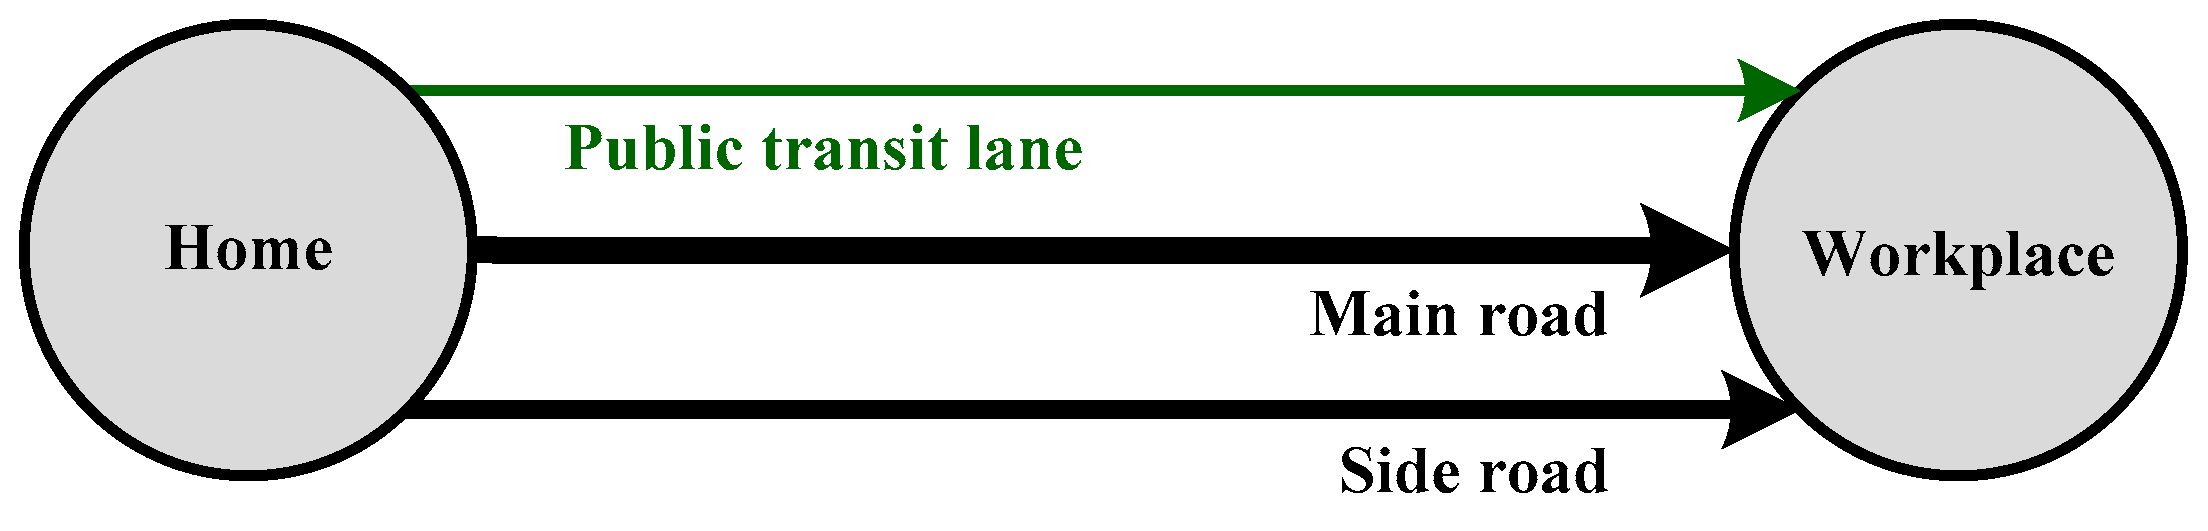
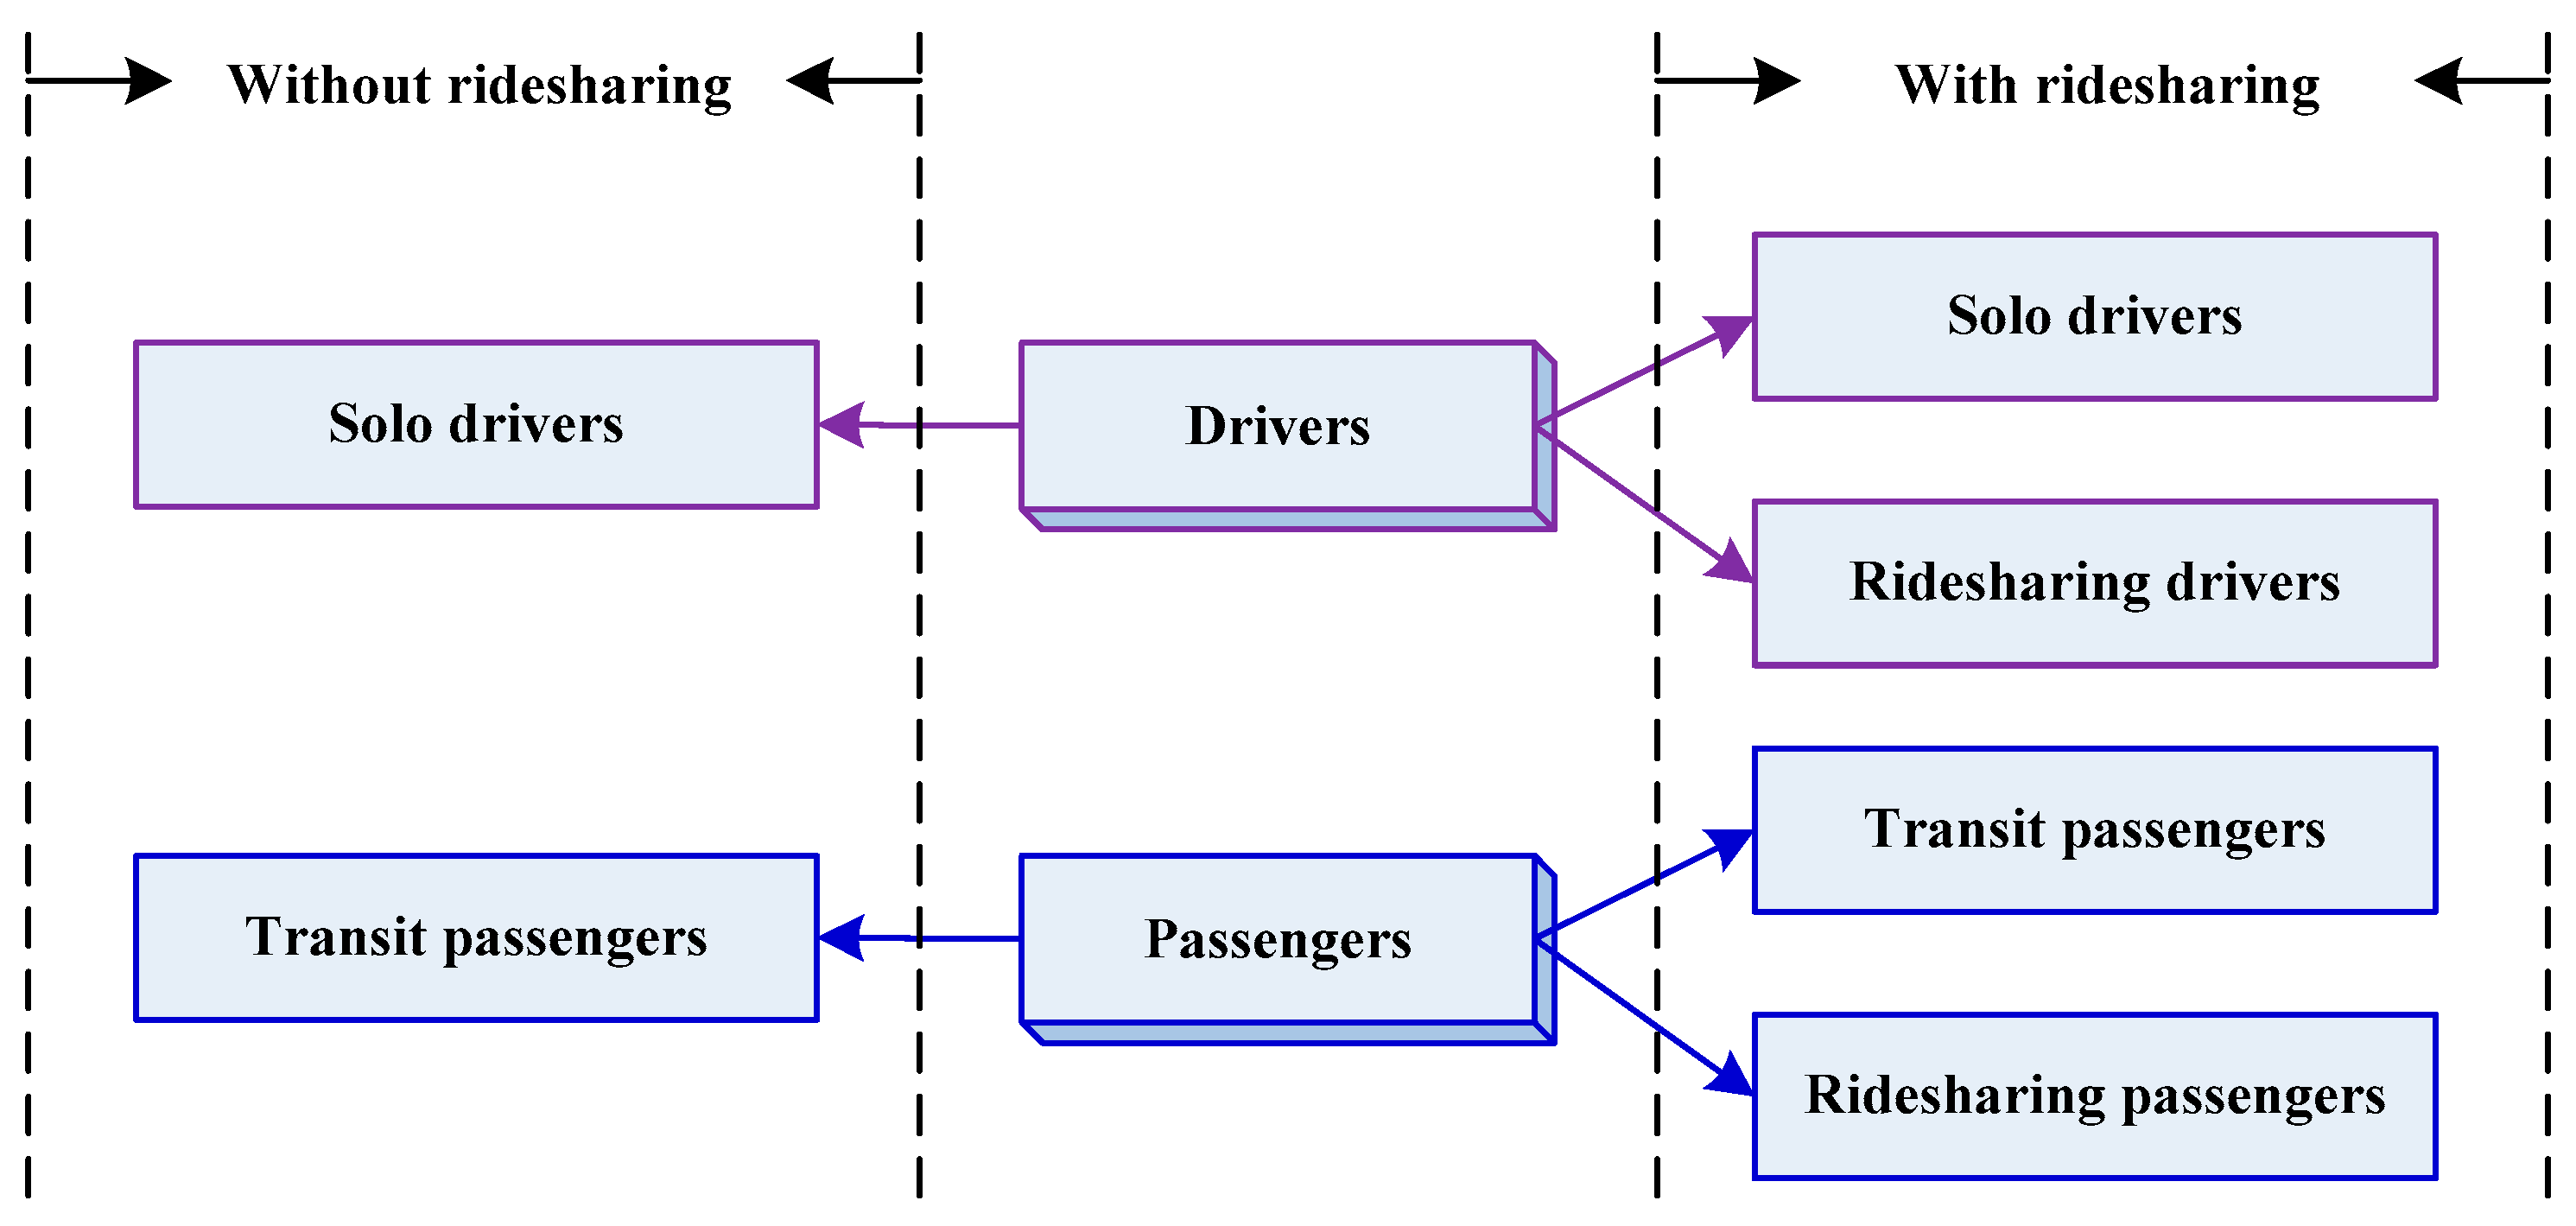
Consider a network with a public transit lane and two roads (including main road and side road) as shown in Figure 1. There are travelers who have to commute from home to workplace by car (using the main road or the side road) or public transit (using the public transit lane). We assume that all travelers who are rational, not only choose routes, but also decide travel modes due to ridesharing activities. The mode splits of travelers without and with a ridesharing scheme are given in Figure 2.
Given the OD travel demand, link performance, and cost functions, our work aims to derive user equilibrium traffic assignment models to determine travelers’ mode and route choices. In the following, we will develop traffic assignment models without and with ridesharing in Section 2.1 and Section 2.2, respectively.
Before introducing the traffic assignment models, this paper assumes that:
- (1)
- The travel demand (i.e., the total number of travelers) is fixed.
- (2)
- Travelers are divided into two groups: solo drivers and transit passengers in the absence of a ridesharing scheme; while commuters are divided into four groups: solo drivers, ridesharing drivers, ridesharing passengers, and transit passengers in the presence of a ridesharing program.
- (3)
- The capacity of a car (bus) is limited and predetermined. The car (bus) capacity is the maximum number of seats for passengers on a car (bus).
The following notations are adopted throughout this paper.
| main road | |
| side road | |
| the total number of commuters | |
| the number of solo drivers on road, | |
| the number of transit passengers using the special lane for the public transit | |
| the number of ridesharing drivers on road, | |
| the number of ridesharing passengers on road, | |
| the total number of vehicles on road, | |
| the vector of flows | |
| the travel time of drivers on road, | |
| the average travel time of public transit users | |
| the average waiting time of ridesharing drivers | |
| the average waiting time of ridesharing passengers | |
| the value of time of all travelers | |
| the cost of driving a car | |
| the cost of privacy | |
| the toll charge of solo drivers on road, | |
| the public transit fare | |
| the ridesharing fee | |
| capacity of a bus, i.e., the maximum number of seats for passengers on a public transit bus | |
| capacity of a car, i.e., the maximum number of seats for passengers on a car | |
| in-bus crowding cost coefficient | |
| crowding penalty coefficient | |
| driving cost coefficient | |
| passengers’ rewards for participating in green commuting | |
| drivers’ rewards for participating in green commuting | |
| the multipliers for car capacity constraints | |
| the travel cost of solo drivers on road, | |
| the travel cost of transit passengers | |
| the travel cost of ridesharing drivers on road, | |
| the travel cost of ridesharing passengers on road, | |
| the generalized travel cost of solo drivers on road, | |
| the generalized travel cost of transit passengers | |
| the generalized travel cost of ridesharing drivers on road, | |
| the generalized travel cost of ridesharing passengers on road, | |
| the minimum travel cost of all travelers | |
| the minimum generalized travel cost of all travelers |
2.1. Traffic Assignment Model without Ridesharing
In this part, we formulate a classical traffic assignment model when ridesharing activities are not considered. In the absence of a ridesharing scheme, a given number of travelers who can choose to be solo drivers (driving alone) or transit passengers (taking public transit), must commute to work.
In the classical traffic assignment model, , , and are decision variables and assumed to be nonnegative. Thus, the total number of travelers is equal to the summation of three types of flows (i.e., flow conservation), which is shown by
Let be the nonnegative vector of flows , , and for all three type travelers. Then, the feasible solution set of the studied problem is . It is obvious that is a closed, convex set.
The travel time function on road is given by
where is the number of cars on road. It is assumed that and are constant in this study, , and . In other words, the private cars on main road are faster than that using side road when there is the same number of vehicles on these two roads. For simplicity, we also assume that is constant in this study.
For a traveler, the travel cost of being a solo driver is computed by
the travel cost of being a public transit passenger is given by
In Equation (3a), the first, second, and third terms on the right-hand side are the travel time cost, the cost of driving a car (including fuel cost, road tolls, and parking fees), and the toll using road, respectively. In Equation (3b), the first, second, third, and fourth terms on the right-hand side represent the travel time cost, the bus fare, the cost of bus crowdedness whose definition is similar to the definition of in-vehicle crowding cost [48], and passengers’ rewards for participating in green commuting (i.e., public transit), separately. In order to encourage travelers to share rides or take public transit, we assume that . That is, the solo driver must pay extra cost for using the main road.
At a UE state, no traveler can improve his or her travel cost by unilaterally changing his or her path or mode choice. Mathematically,
In above, is the minimum travel cost of all travelers. That is, at a UE state, the travel cost of all utilized paths, which are the paths with positive traffic flows, must be less than or equal to that of all unused paths.
2.2. Traffic Assignment Model with Ridesharing
In the classical traffic assignment model, travelers only can choose to be solo drivers or transit users. Note that the car capacity constraints are added when a ridesharing scheme is incorporated into the classical traffic assignment model. The traffic assignment problem with a ridesharing scheme becomes more complicated because commuters simultaneously choose the roads and travel modes among four roles: solo driver, transit passenger, ridesharing driver, and ridesharing passenger.
In the presence of a ridesharing scheme, all travelers, who can choose to be drivers (including solo drivers and ridesharing drivers on main road or side road), or passengers (including public transit passengers and ridesharing passengers), must go to work from home to workplace.
Now, , , , , , , and are decision variables, which are assumed to be nonnegative. The total number of vehicles , influencing the travel time on road, is equal to . Thus, the travel time on road can be obtained, i.e., . Then, we also have the flow conservation, which is given by
Let denote the nonnegative vector of flows , , , , , , and for all seven type travelers. The feasible solution set in this subsection is . It is also apparent that is a closed, convex set.
Travelers experience different travel costs because of different roads and travel modes. In the following, we will define the travel costs of all kinds of travelers.
Solo drivers’ travel cost, consisting of three terms: the travel time cost, the cost of driving a car, and the toll using road, is formulated, as follows:
Here, we assume that (solo divers have to pay more money when using the main road) to encourage travelers to participate in green commuting.
Transit passengers’ travel cost, consisting of four terms: the travel time cost, the bus fare, the cost of bus crowdedness, and passengers’ rewards for encouraging travelers to participate in green commuting, is obtained, as follows:
Ridesharing drivers’ travel cost, consisting of six terms: the travel time cost, the waiting time cost, the cost of driving a car, the cost of privacy, the ridesharing revenue, and drivers’ ridesharing rewards, can be defined by
It is intuitive that and . That is, the cost of driving a ridesharing car is more expensive than that of driving a single-occupancy car, and the ridesharing fee is higher than the bus fare.
Ridesharing passengers’ travel cost, consisting of five terms: the travel time cost, the waiting time cost, the cost of privacy, the ridesharing fee, and passengers’ ridesharing rewards, can be given by
Due to the existence of ridesharing activities, the car capacity constraints (side constraints) are added to distinguish the ridesharing paradigm (i.e., RUE traffic assignment model) from the classical UE traffic assignment model. The car capacity constraints are:
Inequalities (7a,b) make sure that ridesharing drivers must share rides with at least one passenger (otherwise, the driver is a solo driver) and at most passengers, respectively.
At a RUE state, travelers choose roads and modes with the minimum generalized travel costs instead of ones with the minimum actual path travel costs (due to the existence of car capacity constraints) according to Larsson and Patriksson [49]. Then, and are introduced to represent the multipliers for car capacity constraints in Inequalities (7a,b), respectively. Then, the generalized travel costs of all seven type travelers are formulated, as follows:
Here, and can be regarded as compensations for the limited ridesharing capacity. is positive only when Inequality (7a) is binding, and is positive only when Inequality (7b) is binding.
Therefore, the resultant equilibrium traffic flows can be calculated by
In above, is the minimum generalized travel cost of all travelers. It is noted that the generalized travel cost of drivers (including solo drivers and ridesharing drivers) and passengers (including transit passengers and ridesharing passengers) should be same at the RUE state. In other words, the generalized travel cost of all utilized paths (i.e., paths with positive traffic flows) must be no more than that of all unused paths.
Further, our proposed RUE model (9) can be equivalently formulated as a mixed complementarity problem, which can be formulated, as follows:
where is the orthogonal sign denoting that the inner product of two vectors is zero. Equations (10a,b) represent the ridesharing user equilibrium constraints. Equations (10c,d) mean the car capacity constraints. Equation (10e) is the flow conservation.
Referring to Xu et al. [33], we can prove the existence of the RUE solution. The uniqueness of RUE is non-trivial due to the existence of side constraints (7a,b). In general, the multipliers for side constraints and the minimum generalized travel cost are not unique, according to Larsson and Patriksson [49].
3. Numerical Examples
In this section, several numerical examples are presented to demonstrate the insightful results about the equilibrium ridesharing behavior of the proposed model. Here, we use the routine “MCP” of the solver “PATH” in GAMS to solve the proposed model [47].
Unless otherwise stated, the following parameters that were used in the proposed model are set as follows: , , , , , , , , , , , , , , , , , , .
Before showing the equilibrium results, we define the total number of vehicles in the network (indicated by ), and the ratio of travelers participating in green commuting (indicated by ), i.e.,
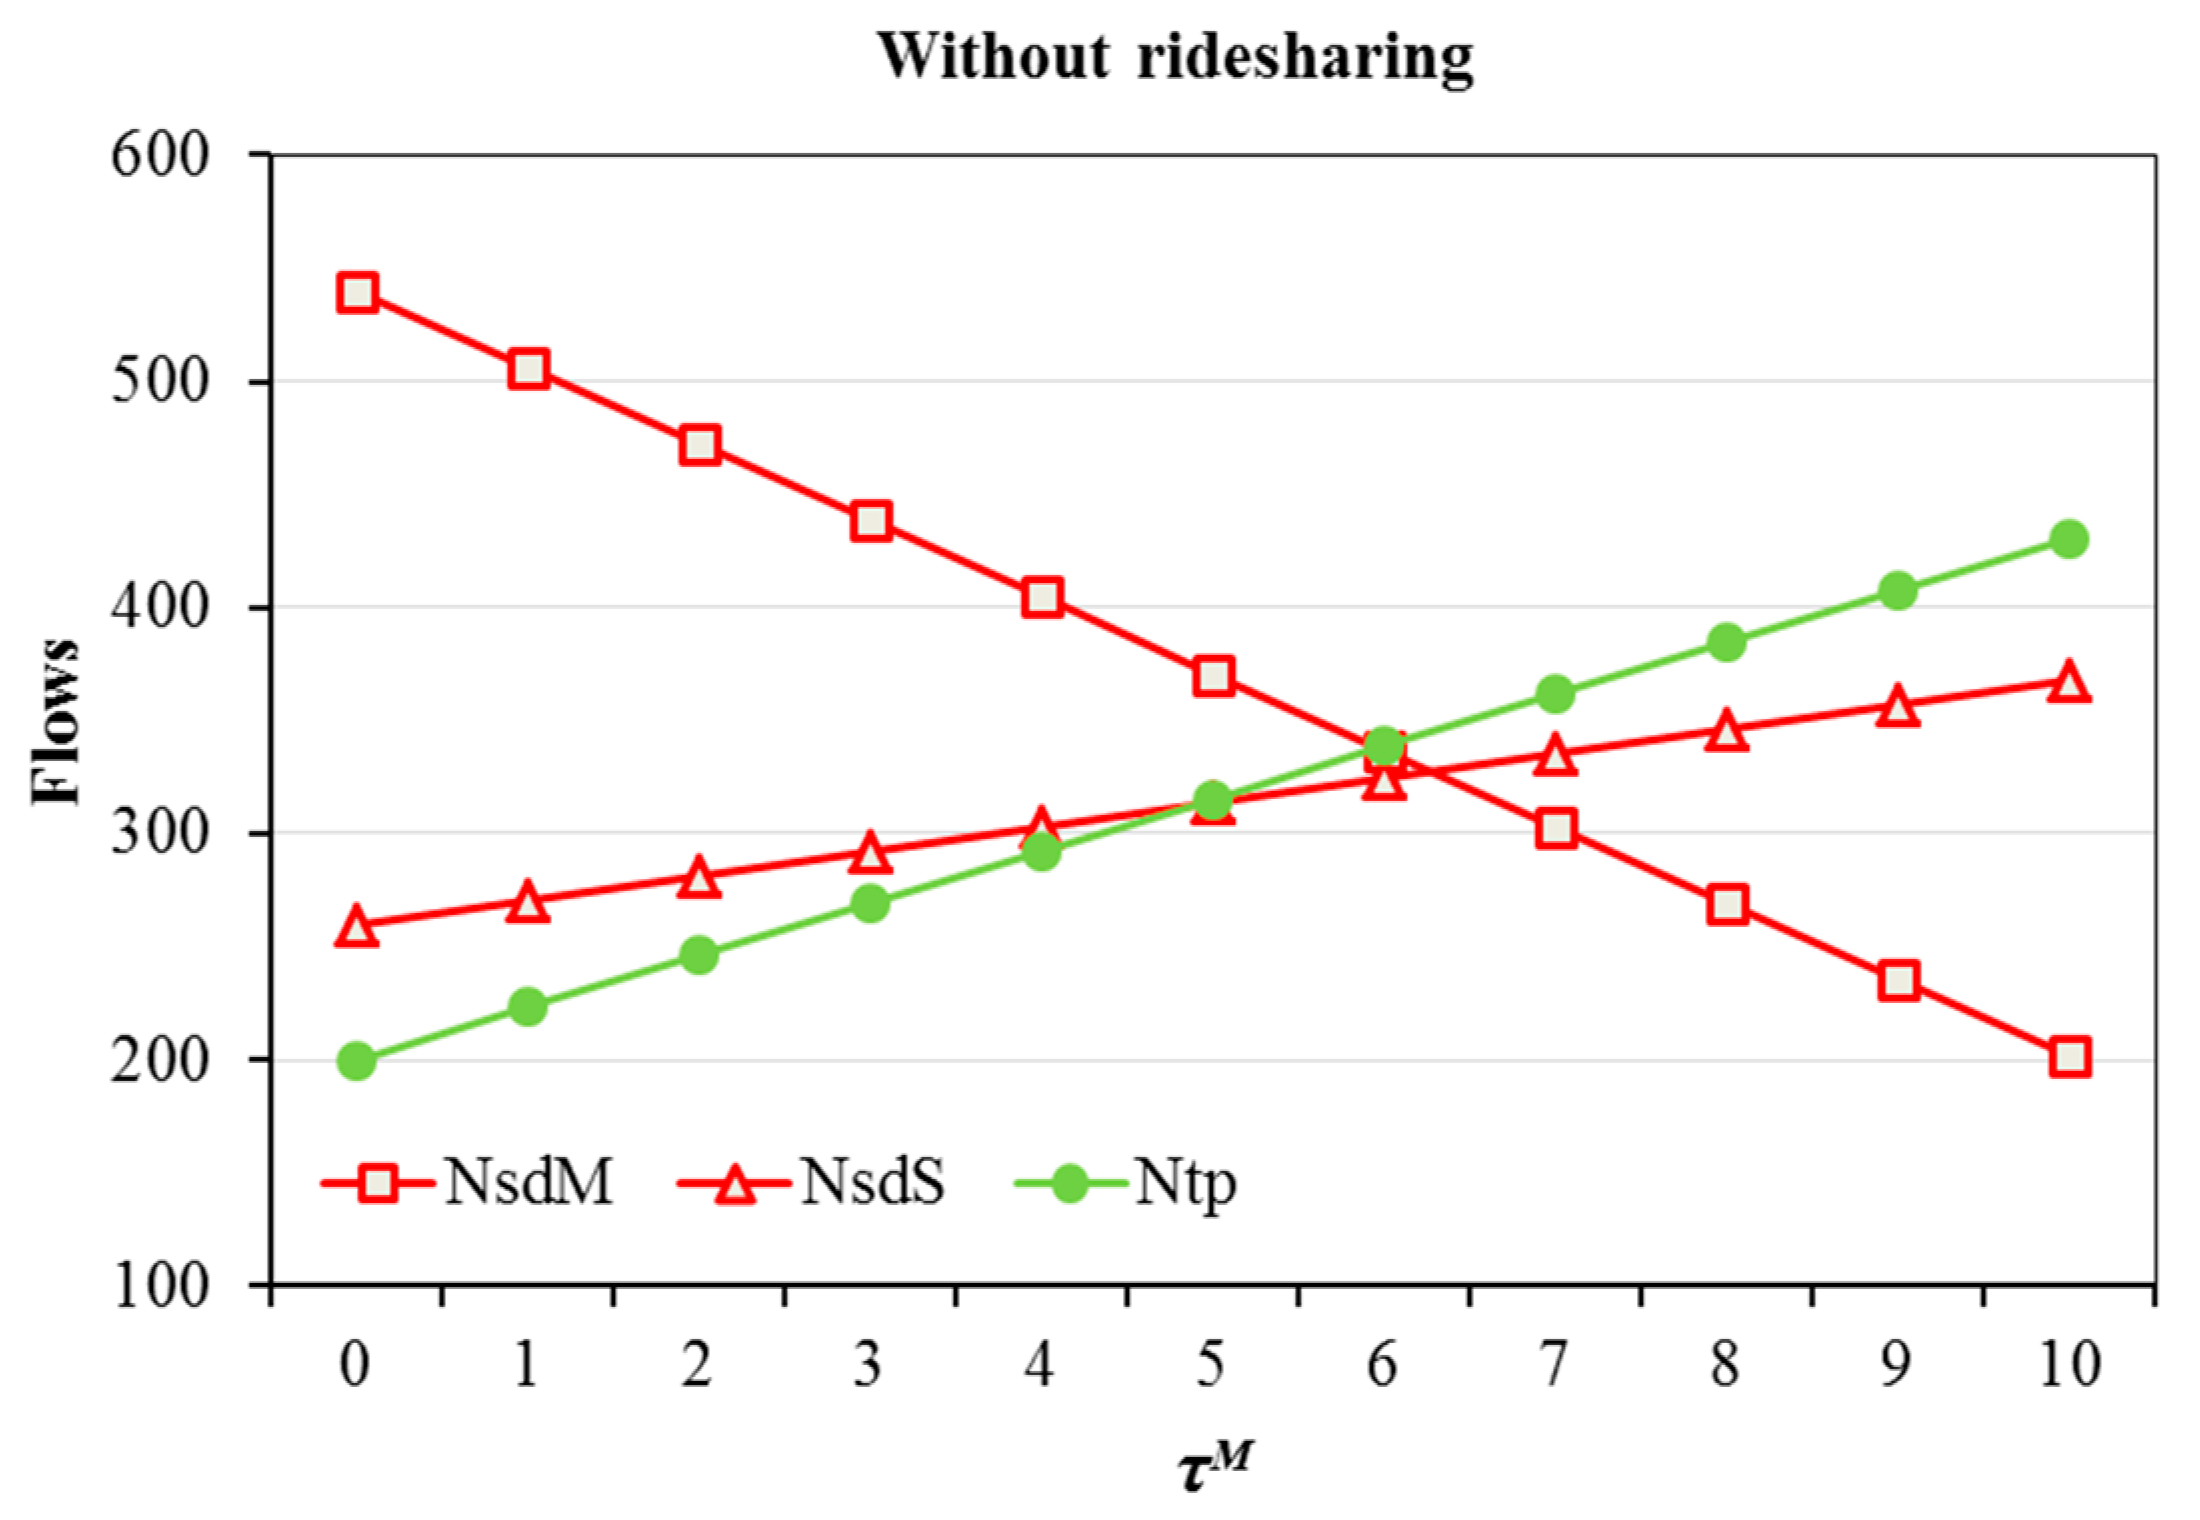
In the absence of ridesharing, we discuss the impacts of passengers’ rewards , toll charge of solo drivers on main road , bus capacity , value of time , and travel demand on the equilibrium ridesharing behavior in Figure 3 and Figure 4, and Table 1.
Three observations can be obtained from Figure 3 and Figure 4, and Table 1. Firstly, the ratio of travelers participating in green commuting (equal to the transit passenger flow divided by the travel demand ) increases with passengers’ rewards , toll charge of solo drivers on main road , and bus capacity . These results are expected, because the designs of these three parameters stimulate or force travelers to take public transit, and thus the total number of car in the network decreases. Secondly, the ratio of travelers taking green commuting modes increases with the total number of travelers and value of time . In line with the expectation, the network becomes more congested as the travel demand increases, and the total cost of travelers increases with their value of time. Thirdly, the performance of incentives () surpasses that of penalty strategies (), and the performances of incentives and penalty strategies are superior to a direct increase of bus capacity.
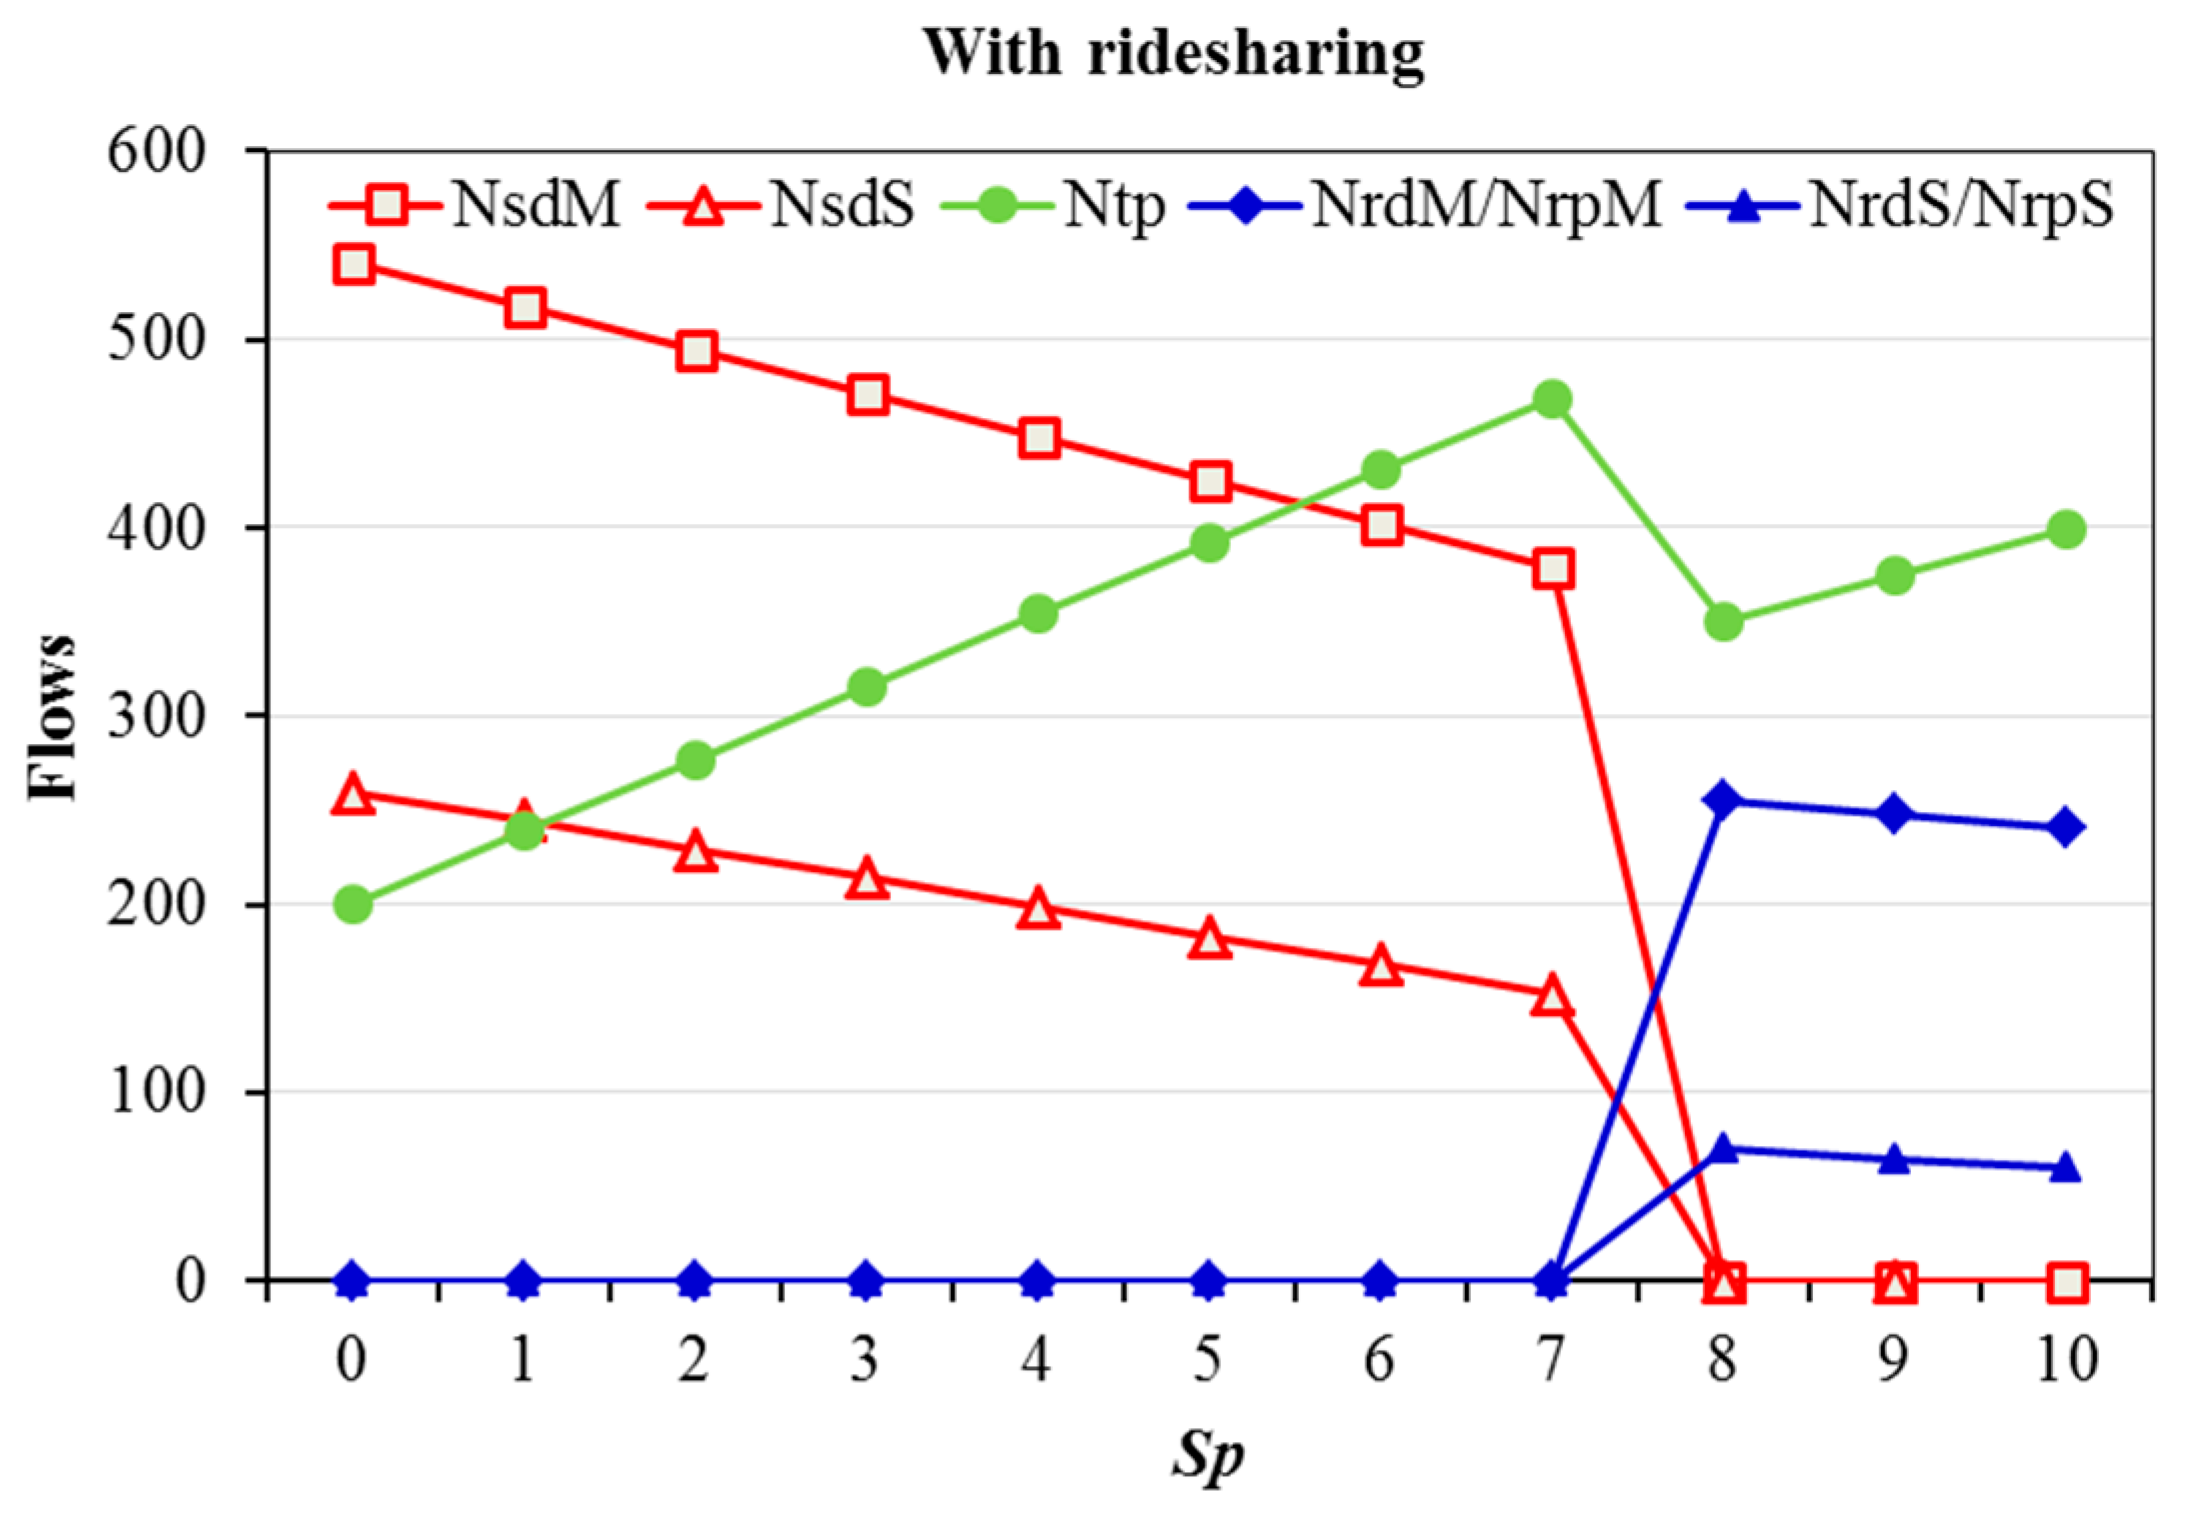
In the presence of ridesharing, we explore the impacts of drivers’ rewards , passengers’ rewards , privacy cost , toll , bus capacity , car capacity , value of time , and travel demand on the equilibrium ridesharing behavior in Figure 5, Figure 6, Figure 7 and Figure 8, and Table 2 and Table 3.
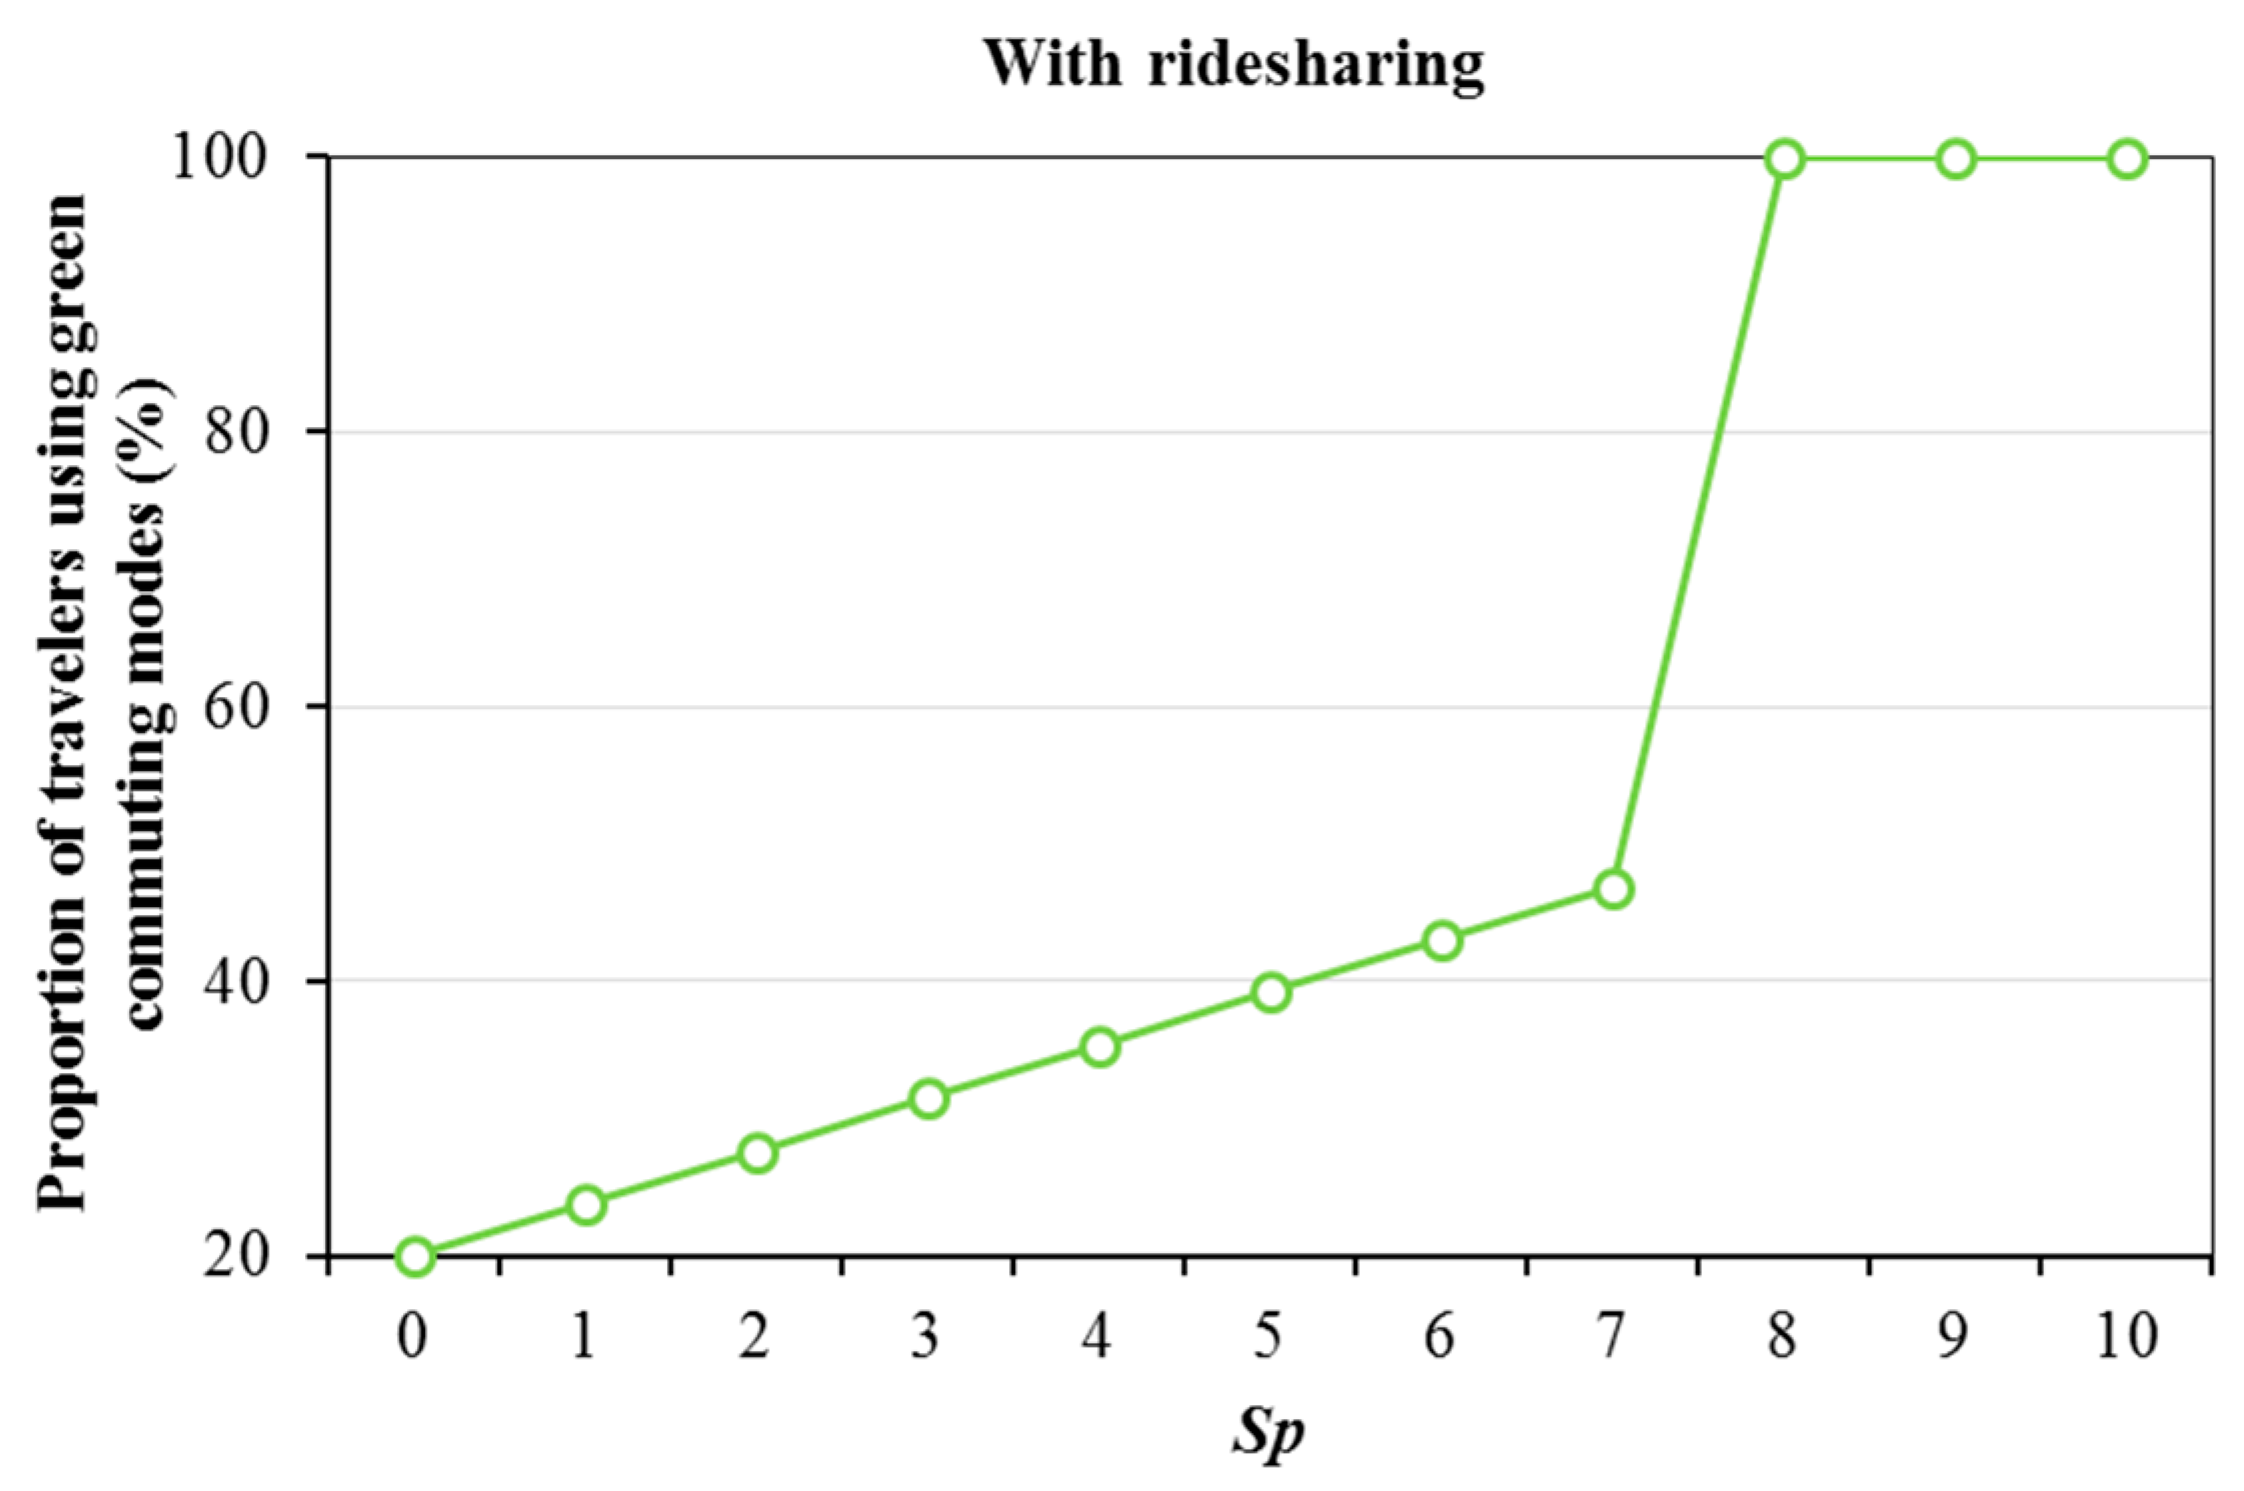
From Figure 5 and Figure 6, we can observe that (1) more travelers choose the green commuting modes (including public transit mode and ridesharing modes) when passengers’ rewards increases; (2) the number of solo drivers decreases with , the number of transit passengers increases with when , the number of transit passengers increases with when ; (3) ridesharing modes (solo-driving mode) start to have (no) market share when , and thus the number of transit passengers falls slightly; and, (4) no traveler chooses the solo-driving mode (that is, all travelers take environmentally friendly travel modes) when .
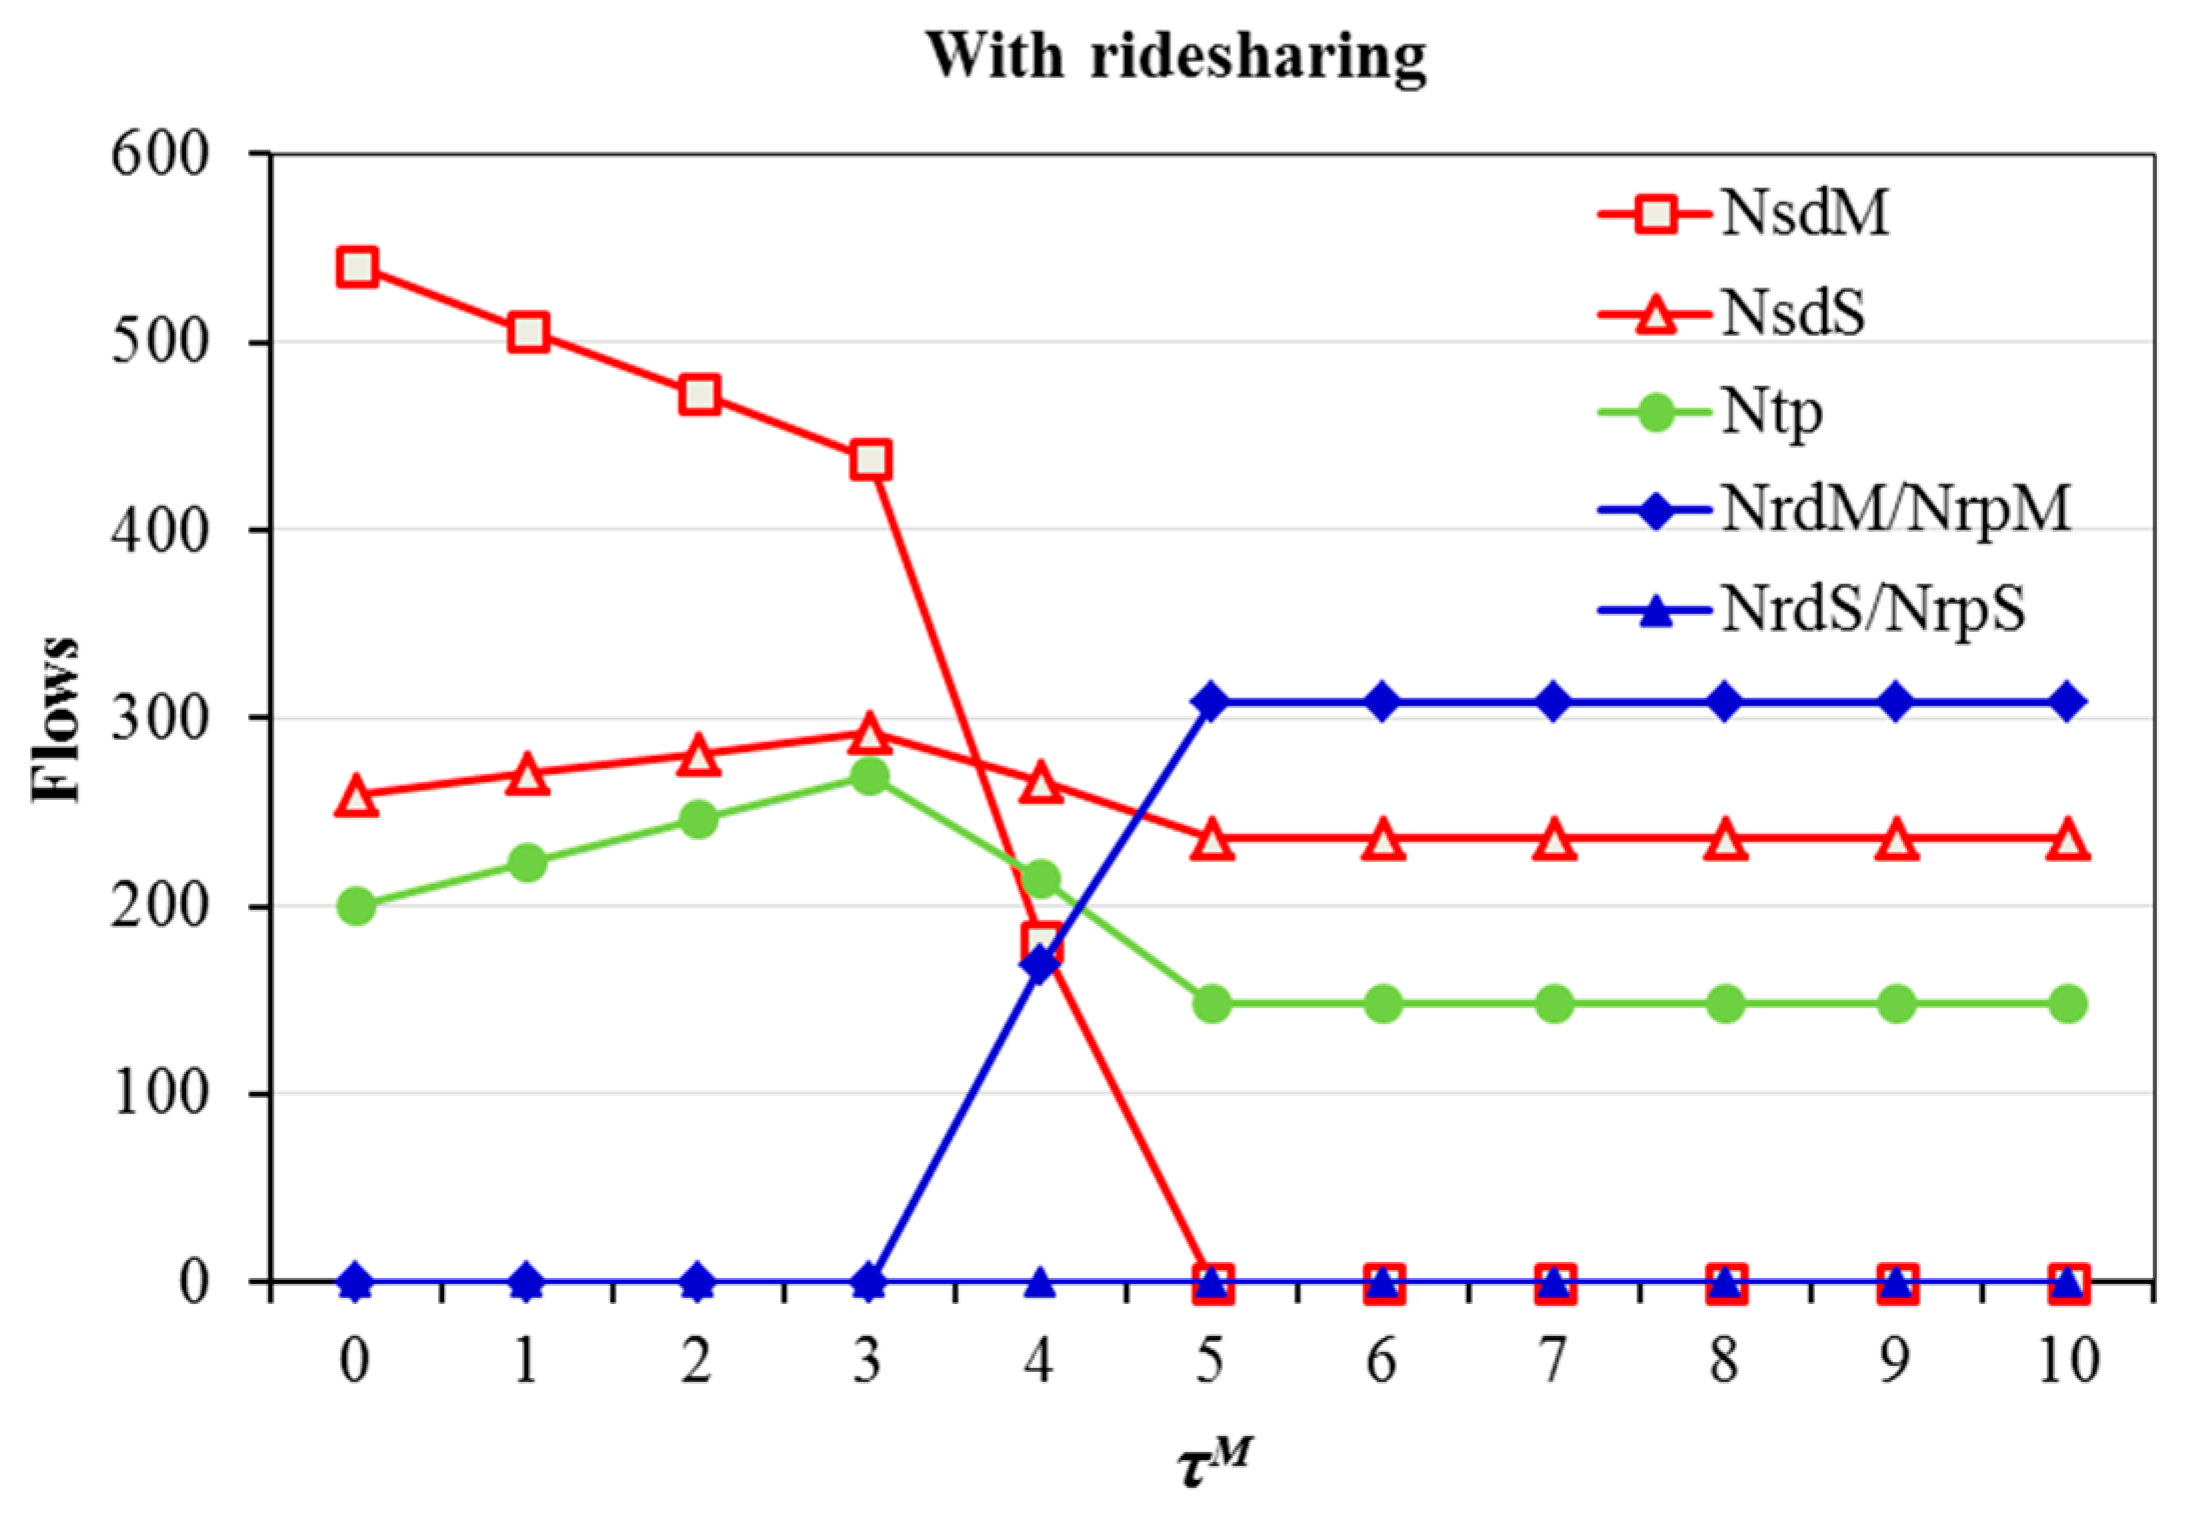
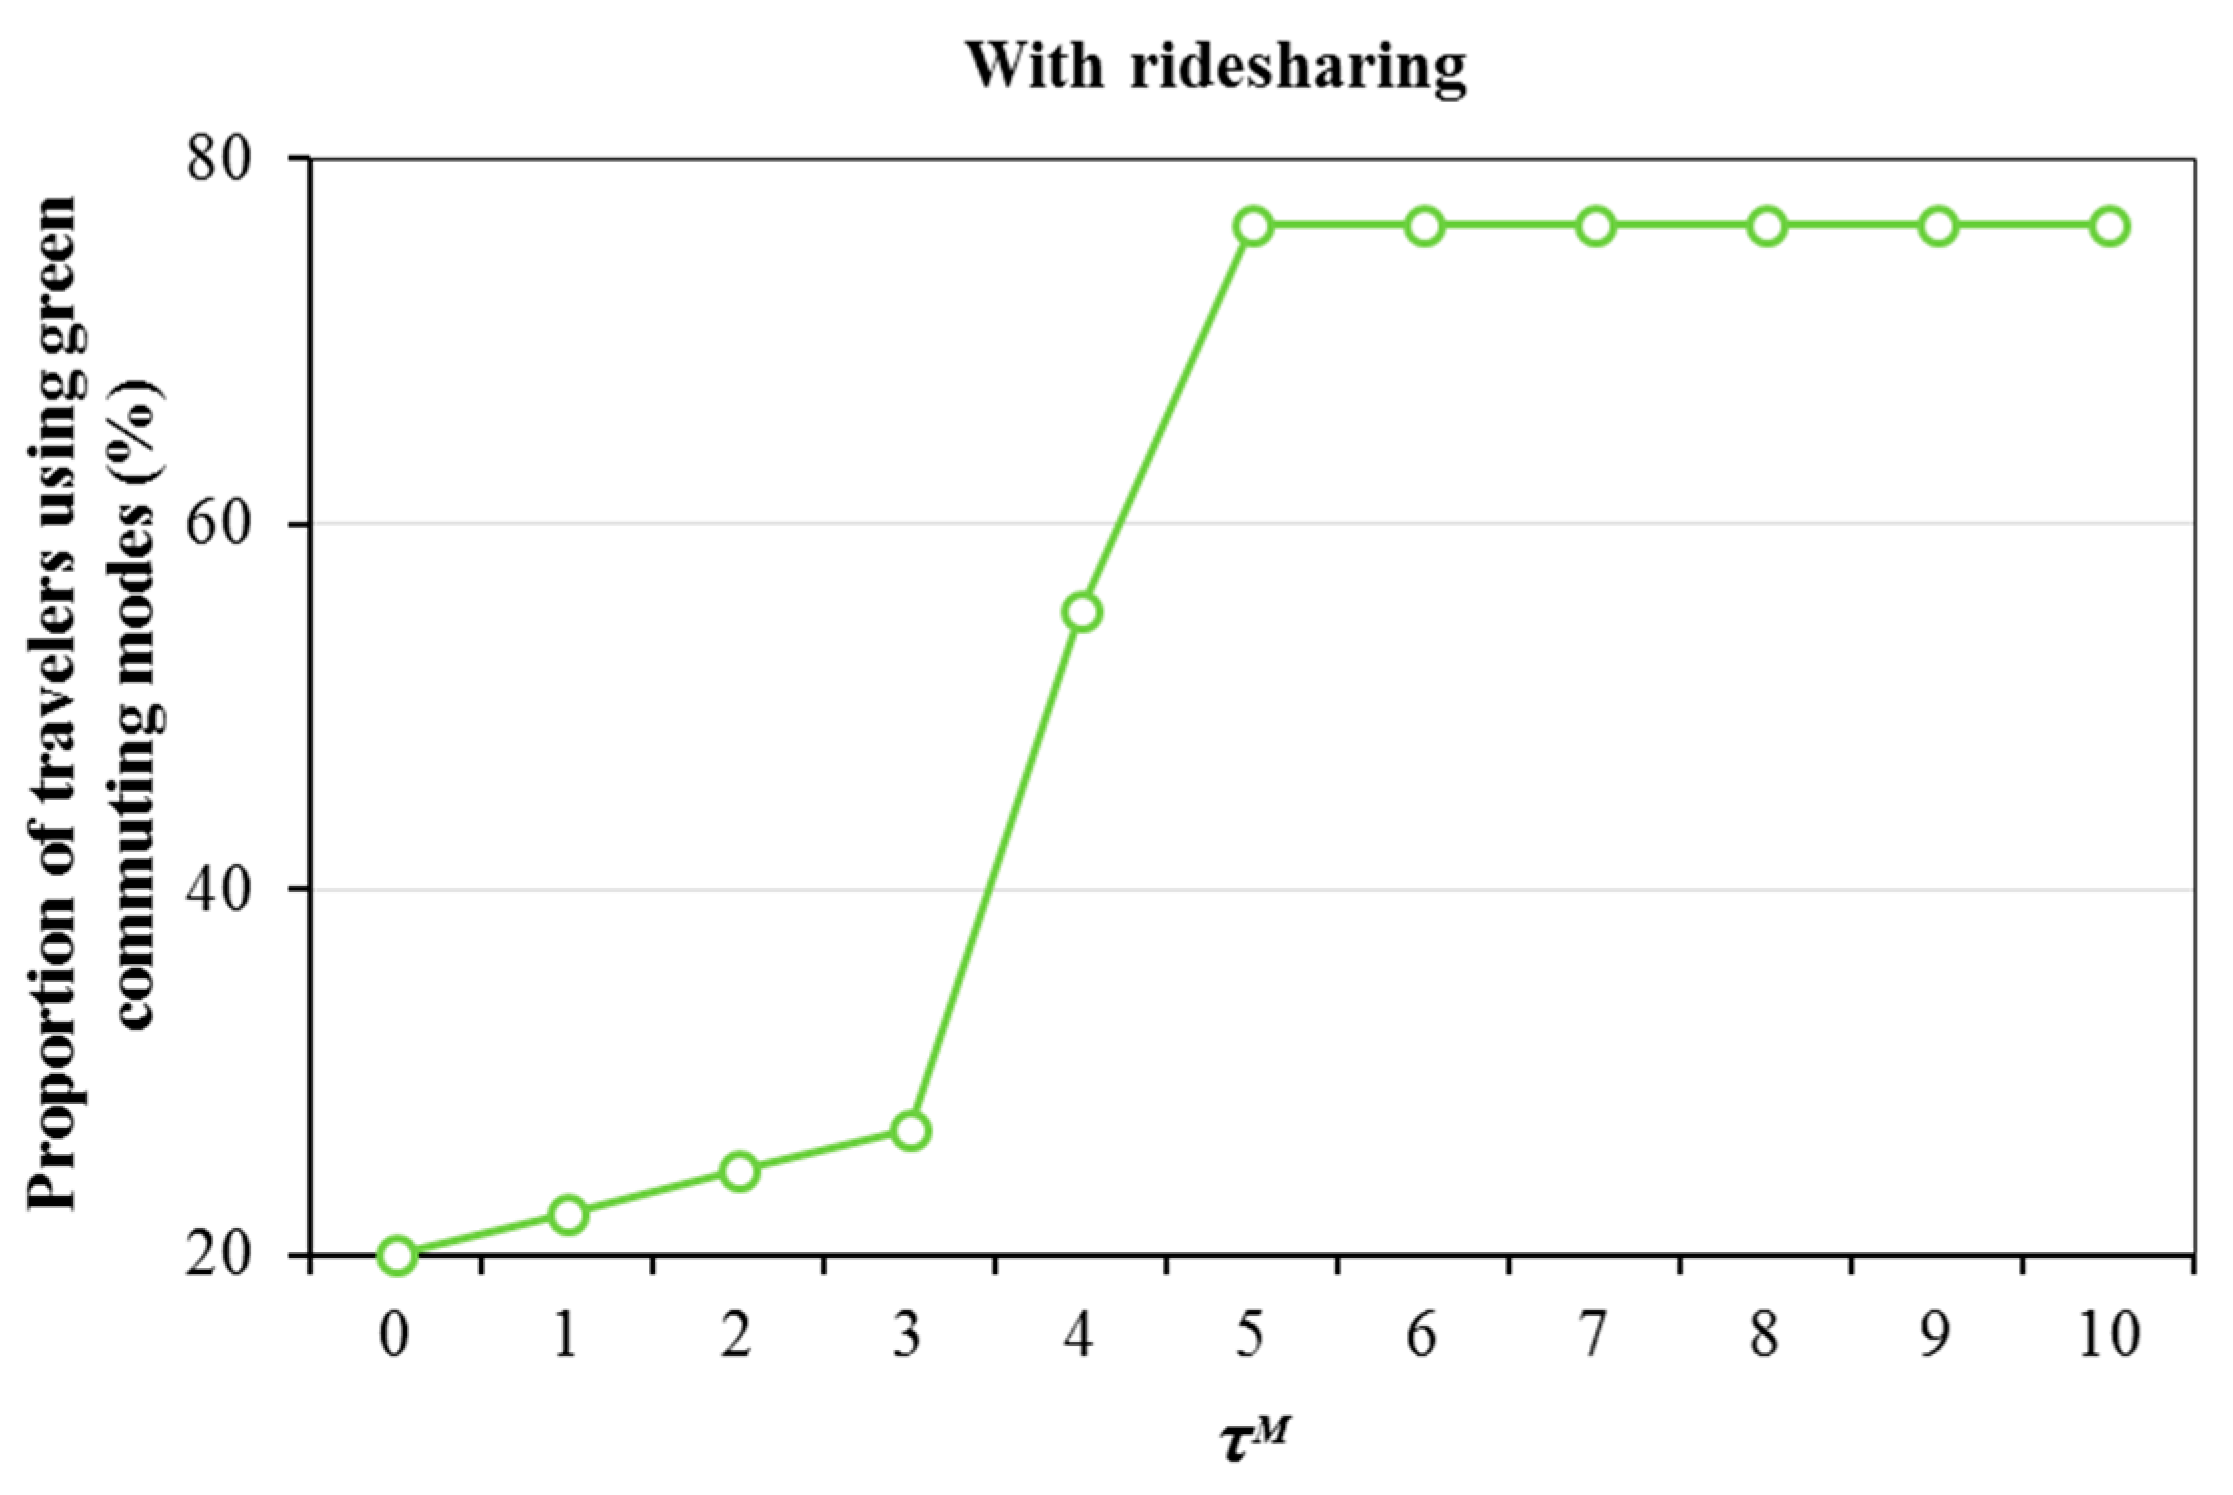
It can be seen from Figure 7 and Figure 8 that (1) more solo drivers are forced to transfer to be transit passengers, ridesharing drivers, and ridesharing passengers as toll charge increases; (2) the number of transit passengers increases with when , decreases with due to the presence of ridesharing modes when ; (3) ridesharing modes start to have market share, i.e., all four modes have market share when ; and, (4) some travelers choose to be solo drivers while using the side road , some travelers share rides using the main road , others take public transit when .
From Table 2, we can see that the effect of parameters , , and on the equilibrium results with ridesharing is same as that without ridesharing. From Table 3, we can obtain that (1) the equilibrium results when () is same as that when (); (2) ridesharing modes start to have market share only when (); and, (3) the car capacity can significantly influence the ridesharing activities, and thus the total number of vehicles in the network decreases with .
Overall, we can conclude that (1) compared with other parameters, passengers’ rewards and toll charge of solo drivers on main road could significantly affect travelers’ route and mode choice behavior in the absence and presence of a ridesharing scheme, respectively; (2) incents ( forces) more people to take green commuting modes, and thus less cars in the network; (3) the increase of car capacity incents more travelers to share rides, the performance of car capacity increase is better than that of bus capacity increase; and, (4) compared with the case without ridesharing, the case with ridesharing makes more commuters choose environmentally friendly travel modes when all of the parameters are same.
4. Conclusions
In this paper, we have proposed a traffic assignment models integrating ridesharing and public transit into a single-OD-pair network. In the proposed model, all travelers tend to minimize the generalized travel cost (not the actual travel cost thanks to the car capacity constraints) when deciding their roads (including the main road and the side road) and travel modes among solo driver, transit passenger, ridesharing driver, and ridesharing passenger. Then, the proposed model can be equivalently formulated as a mixed complementarity problem. Numerical examples have discussed the impacts of key parameters (including drivers’ rewards, passengers’ rewards, privacy cost, toll charge of solo drivers on main road, bus capacity, car capacity, value of time, and travel demand) on ridesharing behavior. With the help of numerical results, it can be concluded that both passengers’ rewards and toll charge of solo drivers on main road significantly impact travelers’ ridesharing behavior.
Many further works are worthy of exploring based on the proposed model. The proposed model does not consider departure time choice; we extend to formulate dynamic traffic assignment models with ridesharing becoming more attractive in the past few years. It would be interesting to extend the proposed model to the case of multi-user classes, i.e., letting all travelers be differentiated by values of time or ridesharing preferences of travelers, and then investigating the resultant equilibrium flow pattern. In addition, the design of traffic policies and the effect of traffic policies on the ridesharing behavior are also expected. These issues will be addressed in future research.
Author Contributions
All authors contributed extensively to the study presented in this paper. M.L. formulated the proposed model, conducted the numerical examples, analyzed the numerical results, and wrote this paper. Both G.W.H. and H.J.H. provided research support, guidance, and advice throughout the study. All authors have read and approved the final version of this manuscript.
Funding
This research was supported by the Fundamental Funds for Humanities and Social Sciences of Beijing Jiaotong University (No. 2018RCW003) and the National Natural Science Foundation of China (No. 71831001). The APC was funded by the National Natural Science Foundation of China (No. 71831001).
Acknowledgments
All authors thank the editor and the anonymous reviewers for their constructive comments and suggestions for improving the quality of this paper.
Conflicts of Interest
The authors declare no conflict of interest.
References
- De Palma, A.; Kilani, M.; Lindsey, R. Congestion pricing on a road network: A study using the dynamic equilibrium simulator metropolis. Transp. Res. Part A Policy Pract. 2005, 39, 588–611. [Google Scholar] [CrossRef]
- Armah, F.A.; Yawson, D.O.; Pappoe, A.A. A systems dynamics approach to explore traffic congestion and air pollution link in the city of Accra, Ghana. Sustainability 2010, 2, 252–265. [Google Scholar] [CrossRef]
- Harriet, T.; Poku, K.; Emmanuel, A.K. An assessment of traffic congestion and its effect on productivity in urban Ghana. Int. J. Bus. Soc. Sci. 2013, 4, 225–234. [Google Scholar]
- Wang, Y.; Peng, Z.; Wang, K.; Song, X.; Yao, B.; Feng, T. Research on urban road congestion pricing strategy considering carbon dioxide emissions. Sustainability 2015, 7, 10534–10553. [Google Scholar] [CrossRef]
- Agatz, N.; Erera, A.; Savelsbergh, M.; Wang, X. Optimization for dynamic ride-sharing: A review. Eur. J. Oper. Res. 2012, 223, 295–303. [Google Scholar] [CrossRef]
- Furuhata, M.; Dessouky, M.; Ordóñez, F.; Brunet, M.E.; Wang, X.; Koenig, S. Ridesharing: The state-of-the-art and future directions. Transp. Rese. Part B Methodol. 2013, 57, 28–46. [Google Scholar] [CrossRef]
- Litman, T.; Burwell, D. Issues in sustainable transportation. Int. J. Glob. Environ. Issues 2006, 6, 331–347. [Google Scholar] [CrossRef]
- Morency, C. The ambivalence of ridesharing. Transportation 2007, 34, 239–253. [Google Scholar] [CrossRef]
- Teodorović, D.; Dell’Orco, M. Bee colony optimization—A cooperative learning approach to complex transportation problems. In Proceedings of the 16th Mini-EURO Conference on Advanced OR and AI Methods in Transportation, Poznan, Poland, 13–16 September 2005; pp. 51–60. [Google Scholar]
- Teodorović, D.; Dell’Orco, M. Mitigating traffic congestion: Solving the ride-matching problem by bee colony optimization. Transp. Plan. Technol. 2008, 31, 135–152. [Google Scholar] [CrossRef]
- Agatz, N.; Erera, A.L.; Savelsbergh, M.W.; Wang, X. Dynamic ride-sharing: A simulation study in metro Atlanta. Procedia-Soc. Behav. Sci. 2011, 17, 532–550. [Google Scholar] [CrossRef]
- Ghoseiri, K.; Haghani, A.E.; Hamedi, M.; Center, M.A.U.T. Real-Time Rideshare Matching Problem; Mid-Atlantic Universities Transportation Center: Berkeley, UK, 2011. [Google Scholar]
- Wang, X.; Agatz, N.; Erera, A. Stable matching for dynamic ride-sharing systems. Transp. Sci. 2017. [Google Scholar] [CrossRef]
- Najmi, A.; Rey, D.; Rashidi, T.H. Novel dynamic formulations for real-time ride-sharing systems. Transp. Res. Part E Log. Transp. Rev. 2017, 108, 122–140. [Google Scholar] [CrossRef]
- Stiglic, M.; Agatz, N.; Savelsbergh, M.; Gradisar, M. The benefits of meeting points in ride-sharing systems. Transp. Res. Part B Methodol. 2015, 82, 36–53. [Google Scholar] [CrossRef] [Green Version]
- Masoud, N.; Jayakrishnan, R. A decomposition algorithm to solve the multi-hop Peer-to-Peer ride-matching problem. Transp. Res. Part B Methodol. 2017, 99, 1–29. [Google Scholar] [CrossRef] [Green Version]
- Masoud, N.; Jayakrishnan, R. A real-time algorithm to solve the Peer-to-Peer ride-matching problem in a flexible ridesharing system. Transp. Res. Part B Methodol. 2017, 106, 218–236. [Google Scholar] [CrossRef]
- Jiang, W.; Dominguez, C.R.; Zhang, P.; Shen, M.; Zhang, L. Large-scale nationwide ridesharing system: A case study of Chunyun. Int. J. Transp. Sci. Technol. 2018, 7, 45–59. [Google Scholar] [CrossRef]
- Hou, L.; Li, D.; Zhang, D. Ride-matching and routing optimisation: Models and a large neighbourhood search heuristic. Transp. Res. Part E Log. Transp. Rev. 2018, 118, 143–162. [Google Scholar] [CrossRef]
- Caulfield, B. Estimating the environmental benefits of ride-sharing: A case study of Dublin. Transp. Res. Part D Transp. Environ. 2009, 14, 527–531. [Google Scholar] [CrossRef] [Green Version]
- Erdoğan, S.; Cirillo, C.; Tremblay, J.M. Ridesharing as a green commute alternative: A campus case study. Int. J. Sustain. Transp. 2015, 9, 377–388. [Google Scholar] [CrossRef]
- Ganapathy, V. Urban mobility in the era of sharing economy: An empirical study of smartphone app based ridesourcing services. J. Glob. Econ. 2017, 13, 268–289. [Google Scholar]
- Amirkiaee, S.Y.; Evangelopoulos, N. Why do people rideshare? An experimental study. Transp. Res. Part F Traffic Psychol. Behav. 2018, 55, 9–24. [Google Scholar] [CrossRef]
- Dong, Y.; Wang, S.; Li, L.; Zhang, Z. An empirical study on travel patterns of internet based ride-sharing. Transp. Res. Part C Emerg. Technol. 2018, 86, 1–22. [Google Scholar] [CrossRef]
- Lee, Z.W.; Chan, T.K.; Balaji, M.S.; Chong, A.Y.L. Why people participate in the sharing economy: An empirical investigation of Uber. Internet Res. 2018, 28, 829–850. [Google Scholar] [CrossRef]
- Stiglic, M.; Agatz, N.; Savelsbergh, M.; Gradisar, M. Enhancing urban mobility: Integrating ride-sharing and public transit. Comput. Oper. Res. 2018, 90, 12–21. [Google Scholar] [CrossRef] [Green Version]
- Wang, Y.; Wang, S.; Wang, J.; Wei, J.; Wang, C. An empirical study of consumers’ intention to use ride-sharing services: Using an extended technology acceptance model. Transportation 2018, 1–19. [Google Scholar] [CrossRef]
- Zhang, Y.; Zhang, Y. Examining the relationship between household vehicle ownership and ridesharing behaviors in the united states. Sustainability 2018, 10, 2720. [Google Scholar] [CrossRef]
- Xiao, L.L.; Liu, T.L.; Huang, H.J. On the morning commute problem with carpooling behavior under parking space constraint. Transp. Res. Part B Methodol. 2016, 91, 383–407. [Google Scholar] [CrossRef]
- Liu, Y.; Li, Y. Pricing scheme design of ridesharing program in morning commute problem. Transp. Res. Part C Emerg. Technol. 2017, 79, 156–177. [Google Scholar] [CrossRef]
- Ma, R.; Zhang, H.M. The morning commute problem with ridesharing and dynamic parking charges. Transp. Res. Part B Methodol. 2017, 106, 345–374. [Google Scholar] [CrossRef]
- Xu, H.; Ordóñez, F.; Dessouky, M. A traffic assignment model for a ridesharing transportation market. J. Adv. Transp. 2015, 49, 793–816. [Google Scholar] [CrossRef]
- Xu, H.; Pang, J.S.; Ordóñez, F.; Dessouky, M. Complementarity models for traffic equilibrium with ridesharing. Transp. Res. Part B Methodol. 2015, 81, 161–182. [Google Scholar] [CrossRef]
- Bahat, O.; Bekhor, S. Incorporating ridesharing in the static traffic assignment model. Netw. Spat. Econ. 2016, 96, 1–25. [Google Scholar] [CrossRef]
- Di, X.; Liu, H.X.; Ban, X.; Yang, H. Ridesharing user equilibrium and its implications for high-occupancy toll lane pricing. Transp. Res. Record J. Transp. Res. Board 2017, 2667, 39–50. [Google Scholar] [CrossRef]
- Di, X.; Ma, R.; Liu, H.X.; Ban, X. Network design for ridesharing user equilibrium. Transp. Res. Part B Methodol. 2018, 112, 230–255. [Google Scholar] [CrossRef]
- Wang, X.L.; Yang, H.; Zhu, D.L. Driver-rider cost-sharing strategies and equilibria in a ridesharing program. Transp. Sci. 2018. [Google Scholar] [CrossRef]
- LeBlanc, L.J.; Morlok, E.K.; Pierskalla, W.P. An efficient approach to solving the road network equilibrium traffic assignment problem. Transp. Res. 1975, 9, 309–318. [Google Scholar] [CrossRef]
- Lawphongpanich, S.; Hearn, D.W. Simplical decomposition of the asymmetric traffic assignment problem. Transp. Res. Part B Methodol. 1984, 18, 123–133. [Google Scholar] [CrossRef]
- Larsson, T.; Patriksson, M. Simplicial decomposition with disaggregated representation for the traffic assignment problem. Transp. Sci. 1992, 26, 4–17. [Google Scholar] [CrossRef]
- Ziliaskopoulos, A.K. A linear programming model for the single destination system optimum dynamic traffic assignment problem. Transp. Sci. 2000, 34, 37–49. [Google Scholar] [CrossRef]
- Dial, R.B. A path-based user-equilibrium traffic assignment algorithm that obviates path storage and enumeration. Transp. Res. Part B Methodol. 2006, 40, 917–936. [Google Scholar] [CrossRef]
- Nie, Y.M. A class of bush-based algorithms for the traffic assignment problem. Transp. Res. Part B Methodol. 2010, 44, 73–89. [Google Scholar] [CrossRef]
- Fukushima, M. A modified Frank-Wolfe algorithm for solving the traffic assignment problem. Transp. Res. Part B Methodol. 1984, 18, 169–177. [Google Scholar] [CrossRef]
- Xu, S.; Jiang, W.; Deng, X.; Shou, Y. A modified physarum-inspired model for the user equilibrium traffic assignment problem. Appl. Math. Model. 2018, 55, 340–353. [Google Scholar] [CrossRef]
- Wardrop, J.G. Some theoretical aspects of road traffic research. Proc. Inst. Civil Eng. 1952, 1 Pt II, 325–378. [Google Scholar] [CrossRef]
- Brook, A.; Kendrick, D.; Meeraus, A. Gams, a user’s guide. ACM Signum Newslett. 1988, 23, 10–11. [Google Scholar] [CrossRef]
- Qin, F. Investigating the in-vehicle crowding cost functions for public transit modes. Math. Probl. Eng. 2014, 2014, 1–13. [Google Scholar] [CrossRef]
- Larsson, T.; Patriksson, M. Side constrained traffic equilibrium models—Analysis, computation and applications. Transp. Res. Part B Methodol. 1999, 33, 233–264. [Google Scholar] [CrossRef]
Figure 1.
The sample network.

Figure 2.
Mode splits of commuters.

Figure 3.
Equilibrium traffic flows against without ridesharing.

Figure 4.
Equilibrium traffic flows against without ridesharing.

Figure 5.
Equilibrium traffic flows against with ridesharing.

Figure 6.
Ratio of travelers participating in green commuting against with ridesharing.

Figure 7.
Equilibrium traffic flows against with ridesharing.

Figure 8.
Ratio of travelers participating in green commuting against with ridesharing.


Table 1.
The effect of parameters , , and on the equilibrium results without ridesharing.
| 540 | 863.08 | 1186.15 | 513.75 | 495.79 | 511.58 | 496.80 | |
| 260 | 475.38 | 690.77 | 242.50 | 230.53 | 241.05 | 231.20 | |
| 200 | 661.54 | 1123.08 | 243.75 | 273.68 | 247.37 | 272.00 | |
| 0.2 | 0.331 | 0.374 | 0.244 | 0.274 | 0.247 | 0.272 |
Table 2.
The effect of parameters , , and on the equilibrium results with ridesharing.
| 540 | 863.08 | 1186.15 | 513.75 | 495.79 | 511.58 | 496.8 | |
| 260 | 475.39 | 690.77 | 242.50 | 230.53 | 241.05 | 231.20 | |
| 200 | 661.54 | 1123.08 | 243.75 | 273.68 | 247.37 | 272.00 | |
| 0 | 0 | 0 | 0 | 0 | 0 | 0 | |
| 0 | 0 | 0 | 0 | 0 | 0 | 0 | |
| 0.2 | 0.331 | 0.374 | 0.244 | 0.274 | 0.247 | 0.272 |
Table 3.
The effect of parameters , , and on the equilibrium results with ridesharing.
| 540 | 540 | 0 | 0 | 540 | 0 | 0 | |
| 260 | 260 | 0 | 0 | 260 | 0 | 0 | |
| 200 | 200 | 0 | 0 | 200 | 0 | 0 | |
| 0 | 0 | 360 | 360 | 0 | 270.64 | 221.18 | |
| 0 | 0 | 360 | 360 | 0 | 541.29 | 663.53 | |
| 0 | 0 | 140 | 140 | 0 | 62.69 | 28.82 | |
| 0 | 0 | 140 | 140 | 0 | 125.38 | 86.47 | |
| 800 | 800 | 500 | 500 | 800 | 333.33 | 250.00 | |
| 0.2 | 0.2 | 1 | 1 | 0.2 | 1 | 1 |
© 2018 by the authors. Licensee MDPI, Basel, Switzerland. This article is an open access article distributed under the terms and conditions of the Creative Commons Attribution (CC BY) license (http://creativecommons.org/licenses/by/4.0/).
Share and Cite
MDPI and ACS Style
Li, M.; Hua, G.; Huang, H. A Multi-Modal Route Choice Model with Ridesharing and Public Transit. Sustainability 2018, 10, 4275. https://0-doi-org.brum.beds.ac.uk/10.3390/su10114275
AMA Style
Li M, Hua G, Huang H. A Multi-Modal Route Choice Model with Ridesharing and Public Transit. Sustainability. 2018; 10(11):4275. https://0-doi-org.brum.beds.ac.uk/10.3390/su10114275
Chicago/Turabian StyleLi, Meng, Guowei Hua, and Haijun Huang. 2018. "A Multi-Modal Route Choice Model with Ridesharing and Public Transit" Sustainability 10, no. 11: 4275. https://0-doi-org.brum.beds.ac.uk/10.3390/su10114275
Note that from the first issue of 2016, this journal uses article numbers instead of page numbers. See further details here.