Investigating the Effects of the Built Environment on PM2.5 and PM10: A Case Study of Seoul Metropolitan City, South Korea


Department of Urban Planning, Keimyung University, Daegu 42601, Korea
*
Author to whom correspondence should be addressed.
Sustainability 2018, 10(12), 4552; https://0-doi-org.brum.beds.ac.uk/10.3390/su10124552
Submission received: 5 October 2018
/
Revised: 26 November 2018
/
Accepted: 29 November 2018
/
Published: 2 December 2018
(This article belongs to the Collection Sustainable Built Environment)
Abstract
:Air pollution has a major impact on human health and quality of life; therefore, its determinants should be studied to promote effective management and reduction. Here, we examined the influence of the built environment on air pollution by analyzing the relationship between the built environment and particulate matter (i.e., PM2.5 and PM10). Air pollution data collected in Seoul in 2014 were spatially mapped using geographic information system tools, and PM2.5 and PM10 concentrations were determined in individual neighborhoods using an interpolation method. PM2.5 and PM10 failed to show spatial autocorrelation; therefore, we analyzed the associations between PM fractions and built environment characteristics using an ordinary least squares regression model. PM2.5 and PM10 exhibited some differences in spatial distributions, suggesting that the built environment has different effects on these fractions. For instance, high PM10 concentrations were associated with neighborhoods with more bus routes, bus stops, and river areas. Meanwhile, both PM2.5 and PM10 were more likely to be high in areas with more commercial areas and multi-family housing, but low in areas with more main roads, more single-family housing, and high average gross commercial floor area. This study is expected to contribute to establishing policies and strategies to promote sustainability in Seoul, Korea.
1. Introduction
Korea, particularly its capital Seoul, has experienced substantial economic growth; however, such development has also had adverse effects on the environment, including a rise in air pollution [1]. Air pollution is recognized as a serious problem in metropolitan cities in Korea and worldwide. According to the World Health Organization (WHO), about 4.2 million people die annually from air pollution-related diseases. Moreover, approximately 91% of the world’s population lives in areas with air pollutant levels that exceed the WHO standards [2]. Increased exposure to higher concentrations of air pollutants has a detrimental effect on health and can trigger respiratory, cardiovascular, and lung diseases [3,4]. Therefore, it is necessary to identify the influence of the built environment on air pollution to build safe neighborhoods that are protected from air pollution.
Dust can be classified into total suspended particles and particulate matter (PM) fractions based on particle size, such as PM10 (<10 μm in diameter) and PM2.5 (<2.5 μm in diameter). Prolonged exposure to high levels of PM may increase the risk of diabetes and respiratory disease [5,6]. Meanwhile, exposure to PM2.5 is associated with heart and respiratory diseases [7], and the WHO has designated PM2.5 as a Group 1 carcinogen [8].
According to the Organisation for Economic Co-operation and Development (OECD) statistics, the average PM2.5 level in Korea was 32 μg/m3 in 2015, more than three times the WHO standard of 10 μg/m3, representing the worst PM2.5 level among the OECD countries [9]. Many studies within a wide array of fields, such as public health, environment, urban planning, transportation, and medicine, have investigated both PM10 and PM2.5 with the aim of investigating air pollution problems [10,11,12,13]. However, in Korea, because PM2.5 has only been measured and managed since 2013, there is relatively little research on PM2.5 compared to PM10 [14,15].
From the studies on PM, the association of PM with the built environment is of interest. However, there is controversy regarding the relationship between land use and PM concentrations. For instance, some studies have demonstrated a positive relationship between PM2.5 and residential area [11,16,17], while others have found lower PM concentrations in residential areas [18,19,20]. In particular, Chen et al. [21] and Rivera et al. [22] showed that PM10 was high in residential areas and especially high in high-density residential areas. Commercial areas have also been shown to have a positive relationship with PM levels [10,18,19,20]. For instance, in a study on air pollution around roads, the number of commercial facilities (e.g., restaurants) had a greater influence on PM2.5 than the general presence of commercial land use [23]. Meanwhile, most studies have found high PM10 and PM2.5 concentrations in industrial areas [12,13,16,17,18,20,21,23,24,25]. Finally, many studies have found lower PM10 and PM2.5 levels in green areas [10,19,26,27]. However, McCarty and Kaza [28] found high PM10 levels in green areas and Weichenthal et al. [20] showed the same result for PM2.5. Other studies have assessed the association of PM with other land use variables (e.g., river area [11,20,23,24] and urbanization area [25]). These findings showed that PM2.5 and PM10 have a dependency on the typology of measurement site but not the metal content [29]. Built environment attributes related to transportation are also associated with PM concentration. Traffic volume on roads was found to have a significant effect on PM [16,23,27,30]. Regarding vehicle type, truck density and truck route length were found to be positively correlated with PM2.5 [20,31,32]. Moreover, Rivera et al. [22] showed that PM2.5 was higher in regions with more vehicles and motorcycles. In addition, road type has been found to affect PM. Liu et al. [24] found that PM2.5 levels were positively associated with highway intensity in Shanghai, China. Several studies have revealed a positive association between road length and PM [11,12,16,17,21]. In a study of intersections in Toronto, Canada, Weichenthal et al. [10] revealed a positive relationship between intersections and PM2.5. By contrast, Hankey and Marshall [16] found a negative correlation between intersections and PM2.5 in Minneapolis, USA. In addition, road width [13,18], bus route length [10,16], and the number of bus stops [16] have been examined as determinants of PM.
Development density has also been studied as a determinant of PM [11,13,18,30]. Weichenthal et al. [18] found a positive relationship between average building height and PM2.5. Meanwhile, Wolf et al. [11] showed that PM2.5 levels were higher in areas with more buildings. In addition, Tang et al. [13] found high PM10 levels in areas with high building volumes. Oh and Chung [30] further divided the number of buildings into residential areas, commercial areas, and industrial areas to study the impact of development density on PM10 by land type. The number of buildings in residential and commercial areas had positive relationships with PM10; however, the number of buildings in industrial areas had a negative relationship. Meanwhile, Oh and Chung [30] examined the relationship between PM10 and gross building floor area of individual residential, commercial, and industrial areas. The gross residential and commercial floor areas were positively associated with PM10, while the gross industrial floor area was negatively associated.
Although many studies have examined the relationship between PM and the built environment, the results show dependency on the spatiotemporal characteristics unique to each study; therefore, continuous research on the relationship between the built environment and PM is needed. Moreover, there is little research on PM2.5 specific to Korea. Therefore, we investigated the association between PM and the built environment in neighborhoods in Seoul, Korea. We classified PM into PM2.5 and PM10 to further investigate the differences in the effects of the built environment (e.g., land use, transportation, housing, and urban development density) on these two fractions of PM. This study will help contribute to the development of eco-friendly environmental policies and interventions to support sustainability in Seoul.
2. Materials and Methods
2.1. Study Area
This study was conducted using air quality monitoring data from Seoul collected in 2014. Seoul is the capital city of the Republic of Korea and is the center of politics, economy, culture, and transportation in Korea. The total area of Seoul is 605.21 km2. Seoul has a population of about 9.8 million, with 25 autonomous districts and 424 neighborhood-level administrative units. The total area of Seoul comprises 20% residential area, 30% green area, 13% residential and commercial mixed-use area, and 6% commercial and official area.
2.2. Data
2.2.1. Air Pollution
This study used air quality monitoring data from 2014 provided by the Korea Environment Corporation (KECO) [33]. These data included six types of air pollutants measured and collected at 40 monitoring stations, including 25 municipal air monitoring stations located in each of Seoul’s autonomous districts and 15 main road air monitoring stations (Figure 1). This study focused on PM2.5 and PM10 among the six air pollutants to examine the differences in the effects of the built environment on PM2.5 and PM10. The 40 air pollution monitoring stations were geocoded and displayed on a geographic information system (GIS) map for considering the spatial attributes of the air pollutants. The concentrations of PM2.5 and PM10 collected from the 40 monitoring stations were converted into a GIS-compatible database.
2.2.2. Land Use
2.2.3. Transportation
Transportation-related data were provided from the Korea Transportation Database (KTDB), the road name address guidance system, and the Korea Local Information Research & Development Institute (KLID) [36]. These transportation data were based on GIS maps, and include spatial coordinate information, bus routes, bus stops, subway station, road type, and road length.
2.2.4. Housing Type and Development Density
The characteristics of housing type were obtained from data on building use from the road name address guidance system, as well as the transportation data [36]. These data include the number of ground floors, underground floors, and spatial coordinate information for individual buildings, such as single-family housing, multi-family housing, sports facilities, business facilities, etc. In this study, we extracted housing data related to single-family and multi-family housing to identify the effects of neighborhood development density in residential areas on PM2.5 and PM10.
In addition, we examined the differences in the influence of urban development density in residential and commercial areas. Development density was obtained from the National Spatial Data Infrastructure Portal, which provides an OPEN API service [37]. These data include information on the building structure, land area, height, coverage ratio, and building area (e.g., gross floor area and floor area ratio). Using these data, we measured the average of gross floor area in residential and commercial areas by neighborhood.
2.3. Measurement of Variables
2.3.1. Spatial Unit of Analysis
We set the neighborhood-level administrative unit (dong, in Korean) as the spatial unit of analysis to identify the characteristics of the built environment related to PM2.5 and PM10 at the neighborhood level. We analyzed the overall characteristics of air pollution in Seoul by measuring PM2.5 and PM10 at the neighborhood level, rather than analyzing only the built environment around the 40 air pollution monitoring stations. The accuracy of analyses can be improved by using the smallest unit of administration as a spatial unit. Therefore, we expected our analysis to offer an accurate description of the current status of PM pollution in Seoul to help establish efficient air pollution reduction policies and strategies at the neighborhood level.
2.3.2. Dependent Variables
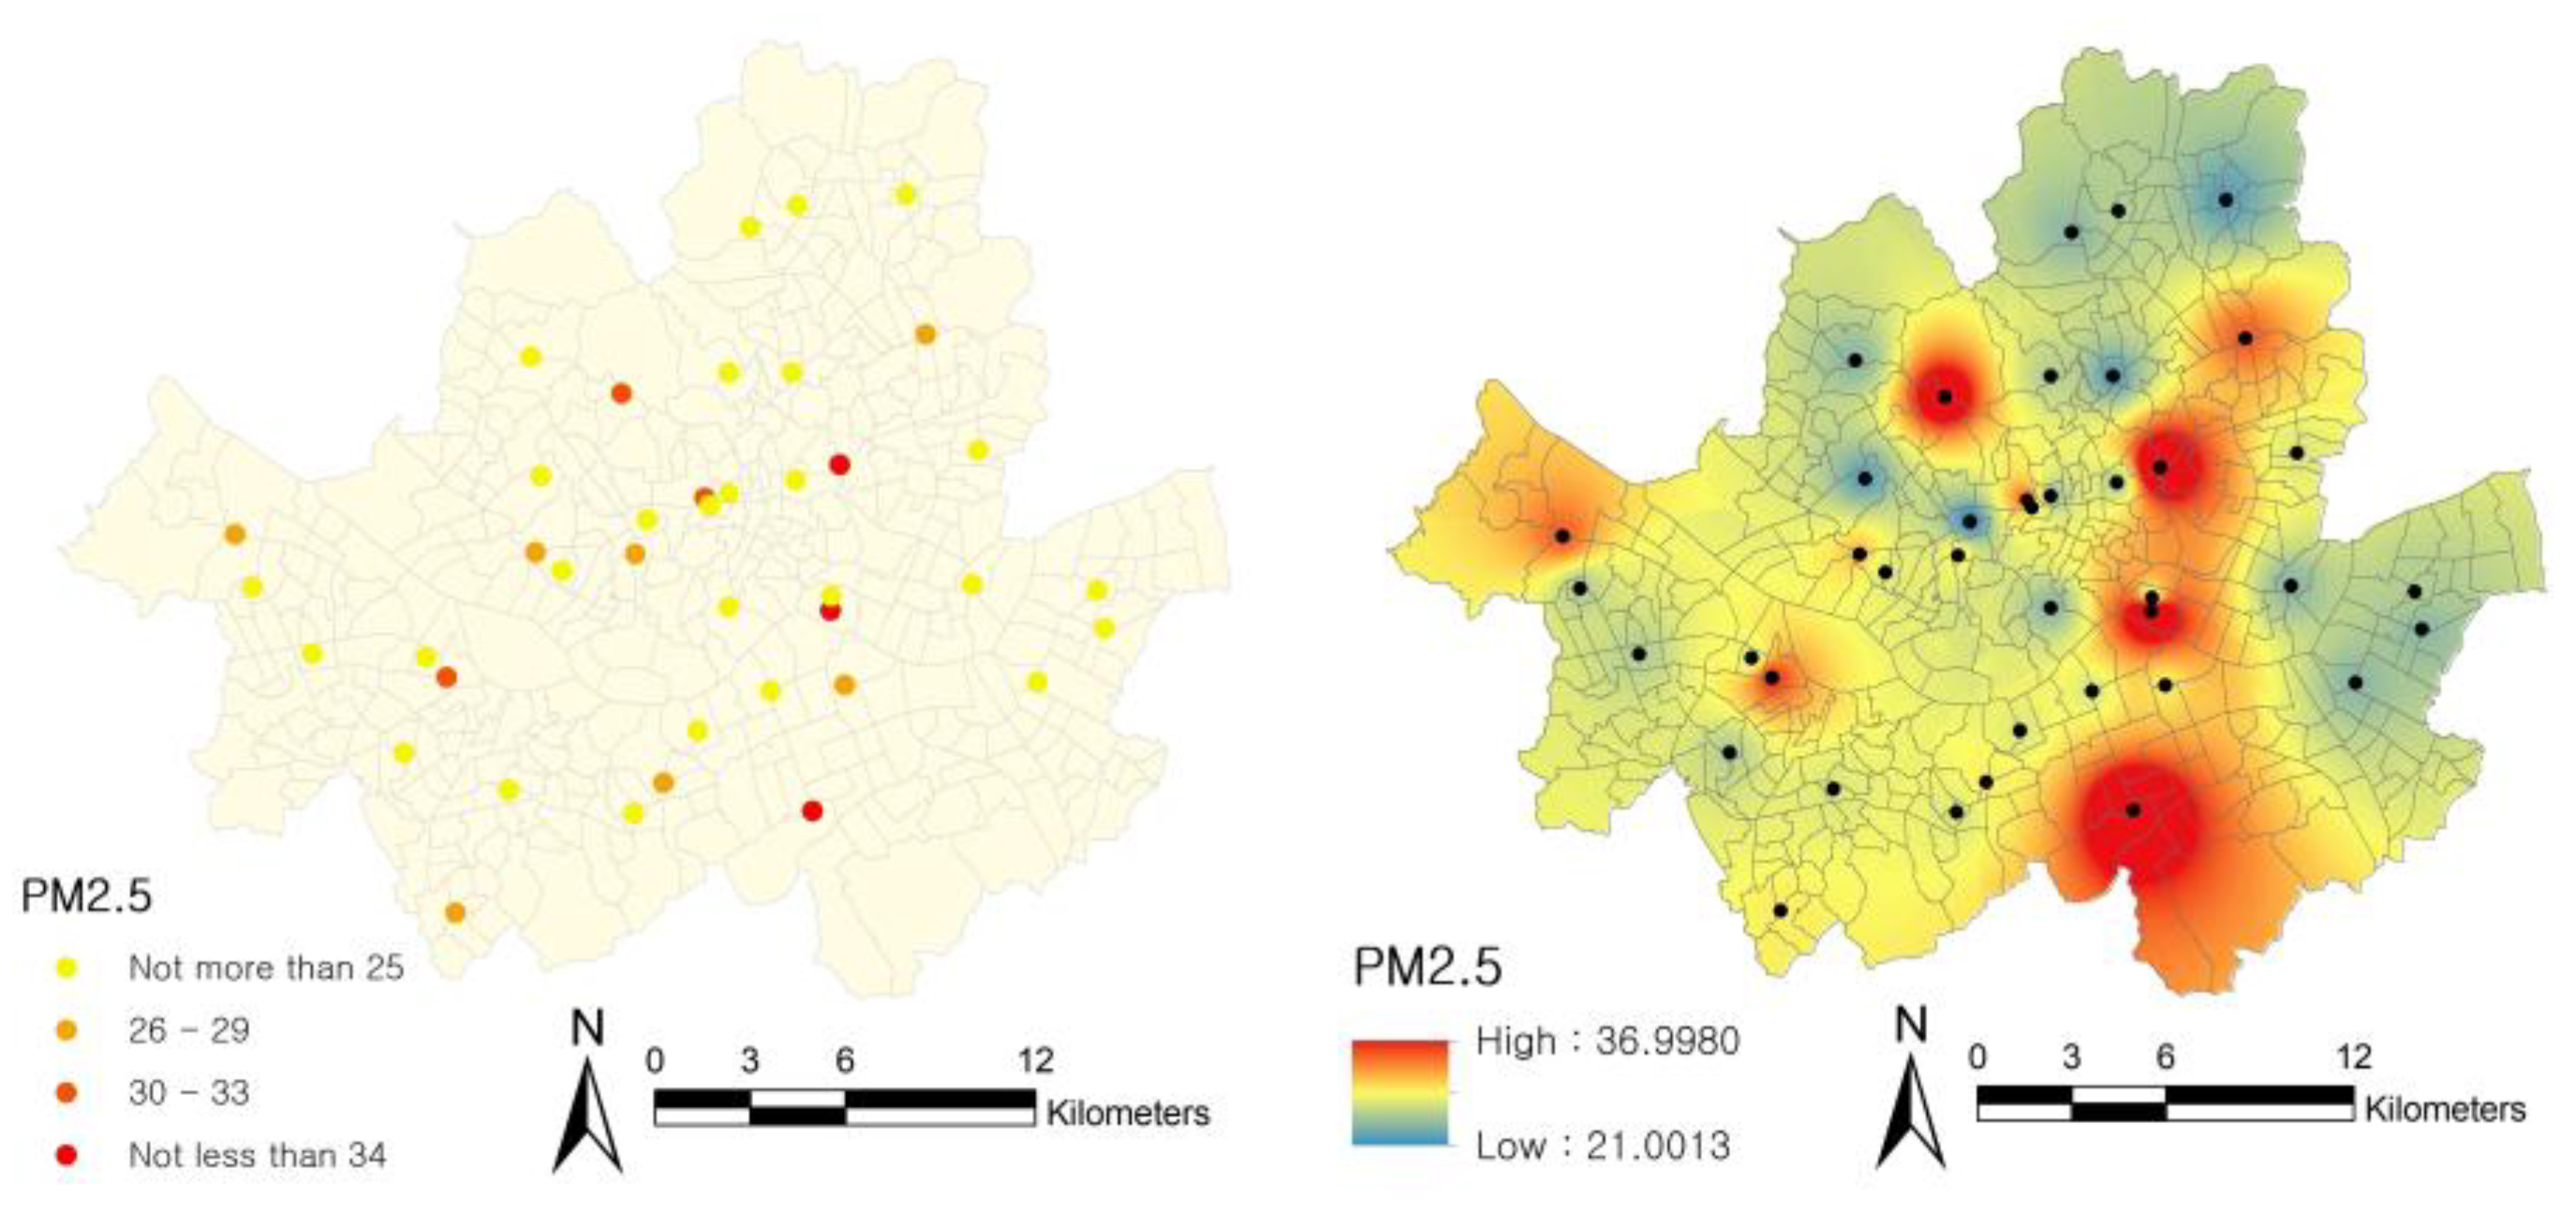
The PM2.5 and PM10 concentrations at the neighborhood level were used as the dependent variables. PM2.5 and PM10 concentrations, which were geocoded and built into the geodatabase, were determined using the inverse distance weighted (IDW) interpolation method for GIS. The size of the raster used in the IDW interpolation method was 25 m × 25 m, representing the smallest area used in previous studies [38]. Finally, the PM2.5 and PM10 values from the IDW interpolation method were determined at the neighborhood level through the GIS zonal statistics tool.
Figure 2 and Figure 3 show the processes used to determine the PM2.5 and PM10 concentrations at the neighborhood level. PM2.5 and PM10 at the neighborhood level in Seoul were in the range of 21–37 µg/m3 and 43–62 µg/m3, respectively. In Korea, the air-quality standard for PM2.5 is an annual average of 15 µg/m3; therefore, the PM2.5 concentrations in all neighborhoods in Seoul exceeded the standard, indicative of potentially detrimental atmospheric conditions in Seoul. Meanwhile, the annual air-quality standard of PM10 is 50 µg/m3; therefore, only some neighborhoods in Seoul had PM10 concentrations of concern. Moreover, the GIS maps in Figure 2 and Figure 3 showed markedly different spatial distributions of PM2.5 and PM10. This suggests that the neighborhood-level built environment may have had different effects on PM2.5 and PM10; therefore, it was necessary to examine the differences between the effects of the built environment on PM2.5 and PM10.
2.3.3. Independent Variables
The independent variables were classified into four categories: land use, transportation, housing, and development density. Regarding the characteristics of land use, the proportions of commercial area, industrial area, green area, and river area were considered as features of the built environment. The land-use mix index, a measure differentiating between single or mixed use in a neighborhood, was also set as a variable where the index value ranged from 0 (single use) to 1 (perfectly mixed use) [39].
For the transportation attributes, the number of bus routes per hectare, number of bus stops per hectare, proportion of neighborhood streets, proportion of main roads, number of intersections per hectare, and presence of subway stations (dummy) were included in the analysis. In relevance to development density, this study considered the difference in residential density according to the type of housing and the distinction between residential density and commercial density. Development density can be represented as the factor for the degree of land use. High development density may significantly increase the consumption of energy and the operations of urban facilities. The number of single-family houses per hectare and the number of multi-family houses per hectare were included in the model to examine the degree of development density by housing type in residential areas. In addition, the average gross floor area of residential areas and the average gross floor area of commercial areas were measured to distinguish the differences in development density between residential and commercial areas. Finally, all variables were reported in terms of density, proportion, and average to minimize analysis errors caused by differences in neighborhood area.
3. Results and Discussion
3.1. Spatial Autocorrelation Analysis
Air pollutants naturally have spatial attributes, given the transport of dust in the atmosphere; therefore, it was necessary to assess the spatial autocorrelation of the PM fractions using Moran’s I test. Spatial autocorrelation is defined as a measure of spatial similarity between nearby observations. Spatially, parameters that are nearby have a similar tendency as parameters that are far away. If spatial autocorrelation is found, it should be analyzed using a spatial econometrics model that can control for spatial autocorrelation. If spatial autocorrelation does not appear, it is appropriate to employ the ordinary least squares (OLS) regression model.
Table 1 shows the Moran’s I test results for PM2.5 and PM10 using ArcGIS. PM2.5 (Moran’s I = −0.22, p = 0.18) and PM10 (Moran’s I = −0.21, p = 0.22) failed to show spatial autocorrelation, indicating that they were influenced more by the neighborhood-level built environment than by each other. Therefore, this study used the OLS regression model, as described previously [10,24,40].
3.2. Descriptive Statistics of Variables
Table 2 shows the descriptive statistics of variables considered in this study. The neighborhood mean of annual average concentrations of PM2.5 and PM10 were 26 µg/m3 and 48 µg/m3, respectively. Among the built environment characteristics, land-use-related attributes (e.g., commercial, industrial, green, and river areas) showed large variations among neighborhoods. The mean land-use mix index was 0.21, indicative of relatively low levels of mixed land use in neighborhoods in Seoul. Regarding the transportation attributes, the average densities of bus routes and bus stops were 0.3 counts/ha and 0.2 counts/ha, respectively, and about 50% of the neighborhoods in Seoul had at least one subway station. Meanwhile, there was an average of 0.21 intersections/ha in the neighborhoods. In terms of roads, 57% were neighborhood streets and 25% were main roads. Residential areas had an average of 8.73 single-family houses/ha and 3.28 multi-family houses/ha. The average gross floor area in residential areas and commercial areas were 4714 m2 and 2903 m2, respectively. These results revealed a relatively low degree of urban development in commercial areas compared to residential areas, despite the presence of commercial land use.
3.3. Regression Analysis
Table 3 shows the results of the regression models. The adjusted R2 values of PM2.5 and PM10 were 10.7% and 13.1%, respectively, indicating that the PM10 model was slightly more explanatory than the PM2.5 model. However, the adjusted R2 values of both models were relatively low so that the models did not seem to explain very much of this variability. This could suggest the limitation of the variables considered in this model that does not effectively take into account the direct pollutant sources of PM2.5 and PM10. For more precise and effective pollution management and measurement, it also suggests that it is necessary to build more air monitoring stations in addition to the existing 40 monitoring stations. Overall, the PM2.5 and PM10 results were similar, although some built environment characteristics had different effects on PM2.5 and PM10. This suggests that it may be necessary to consider individual PM fractions to support more efficient targeted air pollution reductions, rather than general, comprehensive air pollution reduction plans.
Among the land-use characteristics, the proportion of commercial area had a significant effect in both the PM2.5 and PM10 models. However, interestingly, both PM2.5 and PM10 were likely to be lower in neighborhoods with a greater proportion of commercial area. These results are inconsistent with a previous study [18] but may represent the unique characteristics of land use in Seoul, Korea. In Seoul, even when land use is zoned as commercial land, the actual level of development of commercial land tends to be low. However, when considering urban development density characteristics indicative of the actual degree of development density, the average gross floor area of commercial areas showed a positive correlation with both PM2.5 and PM10 concentrations. Therefore, it may be necessary to consider inconsistencies between the development status of land use and typical land use [10,30].
The PM2.5 and PM10 models failed to show a statistical significance with the industrial area, in contrast to the findings of previous literature [12,13,16,17,18,20,21,23,24,25]. This finding may be related to urban policies that led to the reduction in air pollution through factory relocations or changes that were made to factories in existing industrial areas located in the city center, such as by their replacement with eco-friendly commercial complexes and residential complexes. Green areas also failed to yield statistically significant associations with PM2.5 or PM10 in agreement with literature [26,27,28,29]. Interestingly, higher PM10 concentrations were associated with neighborhoods with more river areas, although the significance of this relationship was low. This counterintuitive result may be due to the fact that the main traffic corridors within Seoul are located along the north and south banks of the Han River. Finally, the land-use mix index was not significantly associated with PM2.5 or PM10.
Of the transportation attributes, the proportion of neighborhood streets was not significantly associated with PM2.5 or PM10. However, the proportion of main roads, which tend to have high traffic volumes, showed a strong positive relationship with both PM2.5 and PM10, similar to previous studies [12,16,17,21]. The presence of subway stations in a neighborhood, which is considered to reflect the association between PM and subways as a form of public transportation that helps mitigate road traffic, showed no significant association with PM2.5 or PM10. Finally, no significant relationship between PM2.5 or PM10 and the number of intersections was found, which was considered to represent the influence of air pollution due to idling vehicles in the city center. This is in contrast to the positive correlation shown in previous studies [10,16]. Interestingly, bus-related variables showed different results for PM2.5 and PM10. The densities of bus routes and bus stations were positively associated with higher levels of PM10 but showed no association with PM2.5. This is consistent with the literature [10,16] and suggests that pollutants emitted by buses may be associated more with PM10 than PM2.5. The distinction observed for bus-related factors in PM2.5 and PM10 could suggest that buses have a larger emission in the coarse fraction (2.5 μm < particles < 10 μm in diameter). This is compatible with a larger contribution of non-exhaust emissions of buses compared to cars [41].
Regarding housing type and urban development density, higher PM2.5 and PM10 concentrations tended to be associated with neighborhoods with higher average gross commercial floor area, similar to previous research [30]. However, PM2.5 or PM10 was not associated with the average gross residential floor area, unlike previous studies [16,22] that showed higher PM2.5 levels in high-density residential areas. Regardless, the more detailed built environmental characteristics of residential areas showed interesting findings. Contrary to the results of Rivera’s study [22], lower PM2.5 and PM10 levels were associated with neighborhoods with more multi-family houses, whereas both PM2.5 and PM10 tended to be higher in areas with more single-family houses. This distinction between multi-family and single-family housing may be due to the Korean-specific housing characteristic where community complexes of high-rise multi-family housing, which is a typical type of multi-family housing in Korea, tend to be well-organized and include parks and green areas.
4. Conclusions
Air pollution has a major impact on human health and quality of life, necessitating the identification of the determinants of air pollutants to support air pollution reductions. The purpose of this study was to examine the effects of the built environment on urban air pollution in Seoul, Korea, with a focus on the distinction between the effects on PM2.5 and PM10 as the most serious atmospheric pollutants in Korea.
The PM2.5 and PM10 models showed similar associations with many of the investigated neighborhood-level built environment characteristics. For example, PM2.5 and PM10 tended to be low in neighborhoods with greater proportions of commercial areas and multi-family housing. By contrast, neighborhoods with greater proportions of main roads, single-family housing, and higher average gross residential floor area were associated with higher PM2.5 and PM10 concentrations. However, clear discrepancies between PM2.5 and PM10 were also observed. For instance, bus-related features (e.g., bus stops and bus routes) and the proportion of river area were associated only with higher PM10 levels.
These findings suggest the need to establish targeted policies and strategies that acknowledge the differences between PM2.5 and PM10. In particular, for urban sustainability in Seoul, efficient planning and management of the built environment—such as land use, transportation, housing, and development density considered in this study—is needed beyond the management of direct air pollutant sources. Finally, the results of this study highlight the need for additional research to obtain more detailed data, especially time series data of air pollution and built environments, to inform policy interventions and provide specific policy recommendations.
Author Contributions
S.-H.P. conceived and designed the research and wrote the paper. D.-W.K. collected and analyzed the data.
Funding
This research received no external funding.
Acknowledgments
This work was supported by the National Research Foundation of Korea (NRF) (No. NRF-2018R1D1A1B07050844).
Conflicts of Interest
The authors declare no conflict of interest.
References
- Kim, H.J.; Jun, M.J. Analysis on Relationship between Urban Development Characteristics and Air Pollution level. J. Korea Plan. Assoc. 2014, 49, 151–167. [Google Scholar] [CrossRef]
- World Health Organization (WHO). Available online: http://www.who.int/airpollution/ambient/en/ (accessed on 22 August 2018).[Green Version]
- Bell, M.L.; Dominici, F. Effect Modification by Community Characteristics on the Short-Term Effects of Ozone Exposure and Mortality in 98 US Communities. Am. J. Epidemiol. 2008, 167, 986–997. [Google Scholar] [CrossRef] [PubMed]
- Lin, S.; Liu, X.; Le, L.H.; Hwang, S.A. Chronic Exposure to Ambient Ozone and Asthma Hospital Admissions among Children. Environ. Health Perspect. 2008, 116, 1725–1730. [Google Scholar] [CrossRef] [PubMed] [Green Version]
- Kramer, U.; Herder, C.; Sugiri, D.; Strassburger, K.; Schikowski, T.; Ranft, U.; Rathmann, W. Traffic-Related Air Pollution and Incident Type 2 Diabetes: Results from the SALIA Cohort Study. Environ. Health Perspect. 2010, 118, 1273–1279. [Google Scholar] [CrossRef] [PubMed] [Green Version]
- Puett, R.C.; Hart, J.E.; Schwartz, J.; Hu, F.B.; Liese, A.D.; Laden, F. Are Particulate Matter Exposures Associated with Risk of Type 2 Diabetes? Environ. Health Perspect. 2011, 119, 384–389. [Google Scholar] [CrossRef] [PubMed] [Green Version]
- Hong, Y.C.; Lee, J.T.; Kim, H.; Ha, E.H.; Schwartz, J.; Christiani, D.C. Effects of Air Pollutants on Acute Stroke Mortality. Environ. Health Perspect. 2002, 110, 187–191. [Google Scholar] [CrossRef] [PubMed]
- International Agency for Research on Center (IARC). Available online: https://www.iarc.fr/en/media-centre/iarcnews/pdf/pr221_E.pdf (accessed on 23 August 2018).
- Organisation for Economic Co-Operation and Development (OECD). Available online: http://www.oecd.org/officialdocuments/publicdisplaydocumentpdf/?cote=ENV/EPOC/WPEI (accessed on 19 August 2018).
- Weichenthal, S.; Van Ryswyk, K.; Goldstein, A.; Shekarrizfard, M.; Hatzopoulou, M. Characterizing the Spatial Distribution of Ambient Ultrafine Particles in Toronto, Canada: A Land use Regression Model. Environ. Pollut. 2016, 208, 241–248. [Google Scholar] [CrossRef]
- Wolf, K.; Cyrys, J.; Harciníková, T.; Gu, J.; Kusch, T.; Hampel, R.; Schneider, A.; Peters, A. Land use Regression Modeling of Ultrafine Particles, Ozone, Nitrogen Oxides and Markers of Particulate Matter Pollution in Augsburg, Germany. Sci. Total Environ. 2017, 579, 1531–1540. [Google Scholar] [CrossRef]
- Ho, C.; Chan, C.; Cho, C.; Lin, H.; Lee, J.; Wu, C. Land use Regression Modeling with Vertical Distribution Measurements for Fine Particulate Matter and Elements in an Urban Area. Atmos. Environ. 2015, 104, 256–263. [Google Scholar] [CrossRef]
- Tang, R.; Blangiardo, M.; Gulliver, J. Using Building Heights and Street Configuration to Enhance Intraurban PM10, NOx, and NO2 Land use Regression Models. Environ. Sci. Technol. 2013, 47, 11643–11650. [Google Scholar] [CrossRef]
- Kim, Y.K. An Analysis of Traffic Flows and Land-Use on Urban Air Pollution Concentrations Using Geographic Information System. Korea Transp. Inst. 2017, 24, 67–81. [Google Scholar] [CrossRef]
- Oh, I.B.; Bang, J.H.; Kim, S.T.; Kim, E.H.; Hwang, M.K.; Kim, Y.H. Spatial Distribution of Air Pollution in the Ulsan Metropolitan Region. J. Korea Soc. Atmos. Environ. 2016, 32, 394–407. [Google Scholar] [CrossRef] [Green Version]
- Hankey, S.; Marshall, J.D. Land use Regression Models of on-Road Particulate Air Pollution (Particle Number, Black Carbon, PM2.5, Particle Size) using Mobile Monitoring. Environ. Sci. Technol. 2015, 49, 9194–9202. [Google Scholar] [CrossRef]
- Sabaliauskas, K.; Jeong, C.; Yao, X.; Reali, C.; Sun, T.; Evans, G.J. Development of a Land-use Regression Model for Ultrafine Particles in Toronto, Canada. Atmos. Environ. 2015, 110, 84–92. [Google Scholar] [CrossRef]
- Weichenthal, S.; Farrell, W.; Goldberg, M.; Joseph, L.; Hatzopoulou, M. Characterizing the Impact of Traffic and the Built Environment on Near-Road Ultrafine Particle and Black Carbon Concentrations. Environ. Res. 2014, 132, 305–310. [Google Scholar] [CrossRef] [PubMed]
- Hong, J.S.; Kim, H.Y.; Lee, S.J. An Analysis of the Effects of Urban Characteristics on NO2 Concentrations in Seoul. Seoul Inst. 2007, 8, 117–130. [Google Scholar]
- Weichenthal, S.; Van Ryswyk, K.; Kulka, R.; Sun, L.; Wallace, L.; Joseph, L. In-Vehicle Exposures to Particulate Air Pollution in Canadian Metropolitan Areas: The Urban Transportation Exposure Study. Environ. Sci. Technol. 2015, 49, 597–605. [Google Scholar] [CrossRef]
- Chen, L.; Bai, Z.; Kong, S.; Han, B.; You, Y.; Ding, X.; Du, S.; Liu, A. A Land use Regression for Predicting NO2 and PM10 Concentrations in Different Seasons in Tianjin Region, China. J. Environ. Sci. 2010, 22, 1364–1373. [Google Scholar] [CrossRef]
- Rivera, M.; Basagaña, X.; Aguilera, I.; Agis, D.; Bouso, L.; Foraster, M.; Medina-Ramón, M.; Pey, J.; Künzli, N.; Hoek, G. Spatial Distribution of Ultrafine Particles in Urban Settings: A Land use Regression Model. Atmos. Environ. 2012, 54, 657–666. [Google Scholar] [CrossRef]
- Farrell, W.; Weichenthal, S.; Goldberg, M.; Valois, M.; Shekarrizfard, M.; Hatzopoulou, M. Near Roadway Air Pollution Across a Spatially Extensive Road and Cycling Network. Environ. Pollut. 2016, 212, 498–507. [Google Scholar] [CrossRef]
- Liu, C.; Henderson, B.H.; Wang, D.; Yang, X.; Peng, Z. A Land use Regression Application into Assessing Spatial Variation of Intra-Urban Fine Particulate Matter (PM2.5) and Nitrogen Dioxide (NO2) Concentrations in City of Shanghai, China. Sci. Total Environ. 2016, 565, 607–615. [Google Scholar] [CrossRef] [PubMed]
- Rodríguez, M.C.; Dupont-Courtade, L.; Oueslati, W. Air Pollution and Urban Structure Linkages: Evidence from European Cities. Renew. Sustain. Energy Rev. 2016, 53, 1–9. [Google Scholar] [CrossRef]
- Cho, H.; Choi, M.J. Effects of Compact Urban Development on Air Pollution: Empirical Evidence from Korea. Sustainability 2014, 6, 5968–5982. [Google Scholar] [CrossRef] [Green Version]
- Hoek, G.; Beelen, R.; Kos, G.; Dijkema, M.; Zee, S.C.; Fischer, P.H.; Brunekreef, B. Land use Regression Model for Ultrafine Particles in Amsterdam. Environ. Sci. Technol. 2010, 45, 622–628. [Google Scholar] [CrossRef] [PubMed]
- McCarty, J.; Kaza, N. Urban Form and Air Quality in the United States. Landsc. Urban Plan. 2015, 139, 168–179. [Google Scholar] [CrossRef]
- Contini, D.; Cesari, D.; Donateo, A.; Chirizzi, D.; Belosi, F. Characterization of PM10 and PM2. 5 and their metals content in different typologies of sites in South-Eastern Italy. Atmosphere 2014, 5, 435–453. [Google Scholar] [CrossRef]
- Oh, K.S.; Chung, H.B. The Influence of Urban Development Density on Air Pollution. J. Korea Plan. Assoc. 2007, 42, 197–210. [Google Scholar]
- Clougherty, J.E.; Kheirbek, I.; Eisl, H.M.; Ross, Z.; Pezeshki, G.; Gorczynski, J.E.; Johnson, S.; Markowitz, S.; Kass, D.; Matte, T. Intra-Urban Spatial Variability in Wintertime Street-Level Concentrations of Multiple Combustion-Related Air Pollutants: The New York City Community Air Survey (NYCCAS). J. Exp. Sci. Environ. Epidemiol. 2013, 23, 232–240. [Google Scholar] [CrossRef]
- Abernethy, R.C.; Allen, R.W.; McKendry, I.G.; Brauer, M. A Land use Regression Model for Ultrafine Particles in Vancouver, Canada. Environ. Sci. Technol. 2013, 47, 5217–5225. [Google Scholar] [CrossRef]
- Air Korea. Available online: http://www.airkorea.or.kr/last_amb_hour_data (accessed on 27 July 2018).
- National Geographic Information Institute. Available online: http://www.ngii.go.kr/kor/main/main.do?rbsIdx=1 (accessed on 30 July 2018).
- Seoul Open Data Plaza. Available online: http://data.seoul.go.kr/search/newSearch.jsp (accessed on 30 July 2018).
- Korea Local Information Research & Development Institute. Available online: http://www.juso.go.kr/addrlink/main.do (accessed on 3 August 2018).
- National Spatial Data Infrastructure Portal. Available online: http://www.nsdi.go.kr/lxportal/?menuno=2679 (accessed on 5 August 2018).
- Wu, H.; Reis, S.; Lin, C.; Heal, M.R. Effect of Monitoring Network Design on Land use Regression Models for Estimating Residential NO2 Concentration. Atmos. Environ. 2017, 149, 24–33. [Google Scholar] [CrossRef]
- Rajamani, J.; Bhat, C.; Handy, S.; Knaap, G.; Song, Y. Assessing Impact of Urban Form Measures on Nonwork Trip Mode Choice After Controlling for Demographic and Level-of-Service Effects. Transp. Res. Rec. J. Transp. Res. Board 2003, 1831, 158–165. [Google Scholar] [CrossRef] [Green Version]
- Habermann, M.; Billger, M.; Haeger-Eugensson, M. Land use Regression as Method to Model Air Pollution. Previous Results for Gothenburg/Sweden. Procedia Eng. 2015, 115, 21–28. [Google Scholar] [CrossRef]
- Nagpure, A.S.; Gurjar, B.R.; Kumar, V.; Kumar, P. Estimation of exhaust and non-exhaust gaseous, particulate matter and air toxics emissions from on-road vehicles in Delhi. Atmos. Environ. 2016, 127, 118–124. [Google Scholar] [CrossRef]
Figure 1.
Air monitoring stations in Seoul.

Figure 2.
Spatial distribution of particulate matter (PM2.5) in Seoul.

Figure 3.
Spatial distribution of PM10 in Seoul.


Table 1.
Moran’s I test for spatial autocorrelation.
| Air Pollutants | Moran’s I | p-Value |
|---|---|---|
| PM2.5 | −0.224 | 0.181 |
| PM10 | −0.210 | 0.220 |
Table 2.
Descriptive statistics of variables.
| Variables | Definition (Measures of Neighborhood) | Unit | Mean | Std. Deviation | |
|---|---|---|---|---|---|
| Particulate matter | PM2.5 | Annual average concentration of PM2.5 | µg/m3 | 25.54 | 1.54 |
| PM10 | Annual average concentration of PM10 | µg/m3 | 48.44 | 2.16 | |
| Land use | Commercial area | Proportion of commercial area | % | 5.25 | 13.18 |
| Industrial area | Proportion of industrial area | % | 3.70 | 13.34 | |
| Green area | Proportion of green area | % | 19.99 | 24.82 | |
| Water area | Proportion of water area | % | 4.65 | 10.10 | |
| Mixed use | Land-use mix index | 0 ≤ × ≤ 1 | 0.21 | 0.18 | |
| Transportation | Bus route | Number of bus routes per hectare | counts/ha | 0.30 | 0.26 |
| Bus stop | Number of bus stops per hectare | counts/ha | 0.23 | 0.13 | |
| Intersection | Number of intersections per hectare | counts/ha | 0.21 | 0.12 | |
| Neighborhood road | Proportion of neighborhood roads | % | 57.21 | 17.46 | |
| Main road | Proportion of main roads | % | 25.11 | 15.41 | |
| Subway station | Presence of subway station (0 = no presence, 1 = presence) | dummy | 0.50 | 0.50 | |
| Housing type | Single-family housing | Number of single-family houses per hectare | counts/ha | 8.78 | 7.60 |
| Multi-family housing | Number of multi-family houses per hectare | counts/ha | 3.28 | 2.55 | |
| Development density | Gross commercial floor area | Average gross floor area of commercial areas | Avg. (m2) | 2903.64 | 21,370.91 |
| Gross residential floor area | Average gross floor area of residential areas | Avg. (m2) | 4714.19 | 54,272.23 | |
Table 3.
Results of the regression models.
| PM2.5 | PM10 | ||||
|---|---|---|---|---|---|
| Variable | β | t-Value | β | t-Value | |
| Constant | 25.094 | 28.126*** | 46.992 | 38.192 *** | |
| Land use | Commercial area | −0.025 | −3.055 *** | −0.033 | −2.936 *** |
| Industrial area | 0.003 | 0.427 | 0 | −0.027 | |
| Green area | −0.007 | −1.212 | 0.009 | 1.204 | |
| Water area | 0.002 | 0.264 | 0.022 | 1.908 * | |
| Mixed use | 0.206 | 0.376 | 0.072 | 0.095 | |
| Transportation | Bus route | −0.128 | −0.372 | 1.249 | 2.628 *** |
| Bus stop | −0.184 | −0.277 | 1.563 | 1.705 * | |
| Intersection a | 0.014 | 0.104 | 0.244 | 1.349 | |
| Neighborhood road | 0.007 | 0.904 | 0.003 | 0.315 | |
| Main road | 0.025 | 3.104 *** | 0.032 | 2.890 *** | |
| Subway station (dummy) | −0.037 | −0.238 | 0.193 | 0.895 | |
| Housing type | Single-family | 0.18 | 2.875 *** | 0.162 | 1.876 * |
| housing a | |||||
| Multi-family | −0.583 | −4.793 *** | −0.344 | −2.052 ** | |
| housing a | |||||
| Development | Gross commercial | 0.089 | 3.868 *** | 0.12 | 3.769 *** |
| density | floor area a | ||||
| Gross residential | −0.052 | −0.645 | −0.075 | −0.674 | |
| floor area a | |||||
| F | 4.395 *** | 5.237 *** | |||
| R-Square | 0.139 | 0.161 | |||
| Adj. R-Square | 0.107 | 0.131 | |||
* p < 0.1, ** p < 0.05, *** p < 0.01, a, log transformation.
© 2018 by the authors. Licensee MDPI, Basel, Switzerland. This article is an open access article distributed under the terms and conditions of the Creative Commons Attribution (CC BY) license (http://creativecommons.org/licenses/by/4.0/).
Share and Cite
MDPI and ACS Style
Park, S.-H.; Ko, D.-W. Investigating the Effects of the Built Environment on PM2.5 and PM10: A Case Study of Seoul Metropolitan City, South Korea. Sustainability 2018, 10, 4552. https://0-doi-org.brum.beds.ac.uk/10.3390/su10124552
AMA Style
Park S-H, Ko D-W. Investigating the Effects of the Built Environment on PM2.5 and PM10: A Case Study of Seoul Metropolitan City, South Korea. Sustainability. 2018; 10(12):4552. https://0-doi-org.brum.beds.ac.uk/10.3390/su10124552
Chicago/Turabian StylePark, Seung-Hoon, and Dong-Won Ko. 2018. "Investigating the Effects of the Built Environment on PM2.5 and PM10: A Case Study of Seoul Metropolitan City, South Korea" Sustainability 10, no. 12: 4552. https://0-doi-org.brum.beds.ac.uk/10.3390/su10124552
Note that from the first issue of 2016, this journal uses article numbers instead of page numbers. See further details here.