Consumer Preferences for Superfood Ingredients—the Case of Bread in Germany

Department of Agricultural Economics and Rural Development, Marketing for Food and Agricultural Products, Georg-August-Universität Göttingen; 37073 Göttingen, Germany
*
Author to whom correspondence should be addressed.
Sustainability 2018, 10(12), 4667; https://0-doi-org.brum.beds.ac.uk/10.3390/su10124667
Submission received: 19 October 2018
/
Revised: 25 November 2018
/
Accepted: 4 December 2018
/
Published: 7 December 2018
(This article belongs to the Special Issue Marketing of Sustainable Food and Drink)
Abstract
:Although there is no legal definition of the word ‘superfood’, in recent years exotic foods and ingredients have become popular in German food retailers. The aim of the study was to determine consumer preferences for superfood ingredients in different types of bread; to accomplish this, a choice experiment was set up with a representative sample of 503 German consumers. Respondents had to choose between products with varying attributes such as type of bread, superfood ingredient, nutritional information, production method, durability, and price. The results indicate that consumers value bread that serves a functional purpose through superfood ingredients such as linseed or chia. Using latent class segmentation, the respondents were divided into four segments, of which three groups valued bread with superfood ingredients. All in all, the type of bread is the most important factor when choosing a bread. Further market research could take into account different types of superfoods (processed/unprocessed), as well as regional deviations in Germany and the EU member states to analyze differences regarding the market potential of staple foods such as bread that serve a functional purpose through superfood ingredients.
1. Introduction
With the increase of life-expectancy and changing eating habits in the 1980s, the concept of ‘functional food’ first arose when referring to products with healthy components, altered products, fortified products, enriched products, and enhanced commodities. Although multiple countries adopted the criteria, scope, and regulatory framework, no unique, or universally accepted, definition of ‘functional foods’ exists [1]. Diplock et al. (1999, p. 6) define food as functional, “if it is satisfactorily demonstrated to affect beneficially one or more target functions in the body, beyond adequate nutritional effects, in a way that is relevant to either an improved state of health and well-being and/or reduction of risk of disease. A functional food can be a natural food, a food to which a component has been added, or a food from which a component has been removed by technological or biotechnological means” [2]. Functional foods are thus chosen by consumers for their potential health benefits [3]. Normally, consumers intend to buy healthy products but do not like to change their eating habits; therefore, marketers have been riding the wave of increasing health interest and have recognized the considerable potential of adding functional ingredients to regular products [4]. Within the last few years, there has been soaring interest in so-called ‘superfoods’ among consumers in western countries. The Oxford English Dictionary defines superfood as food that is “considered especially nutritious or otherwise beneficial to health and well-being” (OED, 2018) [5]. Examples are exotic foods like chia, quinoa, amaranth, avocado, and goji berries, but also domestic foods such as linseed or kale. Superfoods usually contain high amounts of particular nutrients like antioxidants, vitamins, and minerals; however, it has not been scientifically proven that superfoods are healthier than the equivalent alternatives [6]. However, even perceived health benefits are a strong motivation for consumers to seek functional foods as they perceive them to be healthier than regular foods [7]. Adding superfood ingredients to a staple food such as bread could thus create additional value for consumers through a perceived functional health benefit and could thus provide market opportunities for food manufacturers in a competitive retail setting.
Nowadays, exotic food products are an inherent part of product lines in supermarkets. The market of new and innovative functional food products has considerably increased during the last decade. Previous research has demonstrated that consumers in Central and Northern European countries are more interested in functional foods than consumers in Mediterranean countries. The most important countries in the functional food market are Germany, France, the United Kingdom and the Netherlands [2]. The value of the global market for functional foods was $168 billion in 2013, yet more than $300 billion is expected in 2020. As a result, several food companies have invested in the development of new functional products for this growing market segment [8].
In their literature review, Kaur and Singh (2017) identify four categories which affect consumer behavior towards functional food: (1) personal factors, (2) psychological factors, (3) cultural and social factors, and (4) factors relating to the functional food product [1]. Socio-demographic factors such as high income and high education are positively associated with consumer preferences for functional food and purchase decisions [1]. However, the results varied depending on the age and gender of the consumer. Bimbo et al. (2017) [9] determined, in the field of dairy products, that women and the elderly are more willing to try functional food. Furthermore, neophobia has been negatively associated with functional food acceptance [1]. The most important psychological factors towards functional food consumption are health motivation and perceived product benefits [7,8]. Consumers’ perception of the healthiness of food is influenced by its type, the processing of raw materials, origin, production date, conservation method, packaging, and use of additives [4]. Additionally, cultural values like traditions and eating habits influence the purchase of functional foods. Moreover, the consumption of superfoods is often an expression of social distinction and is more prevalent among higher socioeconomic groups [6].
The aim of the study is to provide empirical evidence on the influence of intrinsic product characteristics on consumer preferences for bread enriched with superfood ingredients in Germany. Therefore, a hypothetical choice experiment using visual stimuli was conducted online to simulate a shopping situation in which consumers have to decide between different product alternatives. New food products are continuously being launched, and so consumers have more options to decide between different product alternatives [10]. Consumers, however, react differently to intrinsic and extrinsic product characteristics and ignoring this fact might cancel out interesting findings when looking at the preferences of the average consumer choice only [11]. Thus, the importance of superfood ingredients for different consumer groups will be studied in a latent class choice analysis. The identified segments will be further described using a modified version of the food-related lifestyle [12] scale. The intention is to identify and profile consumer segments with interest in bakery products enriched with superfood ingredients that serve a perceived health benefit. Apart from that, the results may affect product management strategies for healthy food components and superfood labeling strategies.
The article will be structured as follows: the next section describes the materials and methods used within the study. The results of the choice experiment and latent class segmentation will be presented in the third section. In the discussion, the results will be critically examined. Finally, the findings will be summarized in the conclusion and further implications for marketing, product development, and future research fields will be noted.
2. Materials and Methods
2.1. Consumer Preferences for Enriched Breads and the Market for Bread in Germany
The product selected for this study was bread. Bread is a well-known food product and is available in a multitude of German food retailers. In the field of functional food, several choice analyses with enriched yoghurt, juice, eggs, and bread were conducted in recent years, during which consumer attitudes for functional ingredients and health claims were examined. Bitzios, Fraser, and Haddock-Fraser (2011) [13] analyzed the functional ingredient inulin in varying types of bread; this was used to define appropriate product concepts for the choice experiment. Regarding functional ingredients, Bitzios et al. [13] differentiated between two options: (1) a component with potential nutritional benefits or (2) the absence thereof. In the presented study, the part-worth utilities of several superfood ingredients that in the view of the consumer could serve a functional purpose—such as chia, quinoa, or amaranth—are considered in more detail.
Germany is famous for its bread culture, with 3238 different types of bread registered in the German “Brotregister”. The annual consumption per capita amounted to 58.9 kg in 2017. The bakery industry’s annual sales amounted to $14.48 billion in 2017 [14,15,16]. Occupying 28.7% of the total bread consumption, brown bread is preferred in Germany, followed by bread for toasting with 21.4% and seeded bread and cornbread with 15.5% [14,15,16]. Due to structural changes in the agriculture and food industry, a bottleneck in the bakery industry is apparent; about 66.9% of total annual sales were generated by 4.8% of bakeries, and just 7.8% of total annual sales were obtained by 62.9% of bakery companies. However, with continuous premium product launches and manufacturing upgrades, medium-sized bakeries have attempted to defend their market position. Furthermore, snack products face increasing interest due to changing eating habits [14,15,16].
2.2. Data Collection and Survey Design
In June 2018, the sample data was collected in cooperation with a professional consumer panel provider who recruited and incentivized the participants. The company recruited participants via e-mail by sending a link to the online survey to registered panelists. Participation in the survey was voluntary and respondents could exit the survey at any time without facing negative consequences. To closely resemble the German population, sampling quotas for age and gender were set. Respondents aged between 18–69 years were invited by the panel company to answer the survey; furthermore, participants were screened to ensure that only adults between 18–69 years were allowed to join the survey. In total, 517 respondents took part in the survey. With a soft-launch of 50 participants, the questionnaire was tested before the full data collection took place. The data of the 505 respondents who completed the survey were successfully used for further data analysis; 12 respondents were disqualified due to incomplete answers or speed settings during data collection.
The survey consists of three sections. In the first section, respondents answered socio-demographic questions concerning age, gender and income, etc. Participants were also asked for their preferred place of purchase and the frequency of their bread consumption. Two choice experiments followed. First, respondents had to choose their preferred bread out of four different bread types with alternated characters and a no-choice option. Afterwards, respondents had to decide in a similar fashion between product alternatives but had to indicate which bread they assumed to be the healthiest. The results of this paper are based on data from the first experiment only. In the third section, respondents had to state their level of agreement with different attitudes that capture psychographic characteristics of food consumption on a five-point scale ranging from fully agree (1) to fully disagree (5). Further details on these measures are given in Section 2.4.
2.3. Design of the Discrete Choice Experiment
To identify consumer preferences for different types of bread with superfood ingredients that serve a functional purpose, a discrete choice experiment was designed and conducted using Sawtooth Software (version 9.5.2).
In recent decades, discrete choice experiments (DCE) have become popular in marketing research to study how consumers trade-off between different favored product characteristics. For bread, Bitzios, Fraser, and Haddock-Fraser (2011) [13] for example used a DCE to explore how a functional ingredient affects consumer preferences. DCEs are well grounded in theory of choice behavior and random utility theory [17]. In a hypothetical discrete choice experiment, the respondents are asked to choose a product from a comparable set of alternatives. Each alternative is a profile of different combinations of product characteristics. In a survey, the consumer repeats this choice task for a limited number of choice sets [17].
Functional food can be defined with different product attributes, such as the ingredients, functional component, price, naturalness, healthy properties, or innovativeness [1]. In the present choice experiment, 10 attributes were used to describe the different bread types and study consumer preferences for superfood ingredients that serve a functional purpose. The selection of possible attributes is based on the study of Bitzios, Fraser, and Haddock-Fraser (2011) [13], from which the bread type, method of production, functional ingredient, and price attributes were adopted. To simulate a realistic purchase situation in terms of available bread varieties, price ranges, and nutritional values, further research in local supermarkets was carried out prior to the study. Therefore, different types of bread and bread with and without superfood ingredients were bought to determine the respective nutritional values and the price range at which these breads are offered. This information then guided the choice of attribute levels and the design of the hypothetical choice task. Amaranth, chia, linseed, and quinoa were found to be the most popular superfood ingredients in the store-check and thus included as levels for the attribute superfood ingredients. Finally, the durability of bread attribute is a further factor potentially influencing consumers’ purchase decisions. The attributes and levels used in the choice experiment are listed in Table 1.
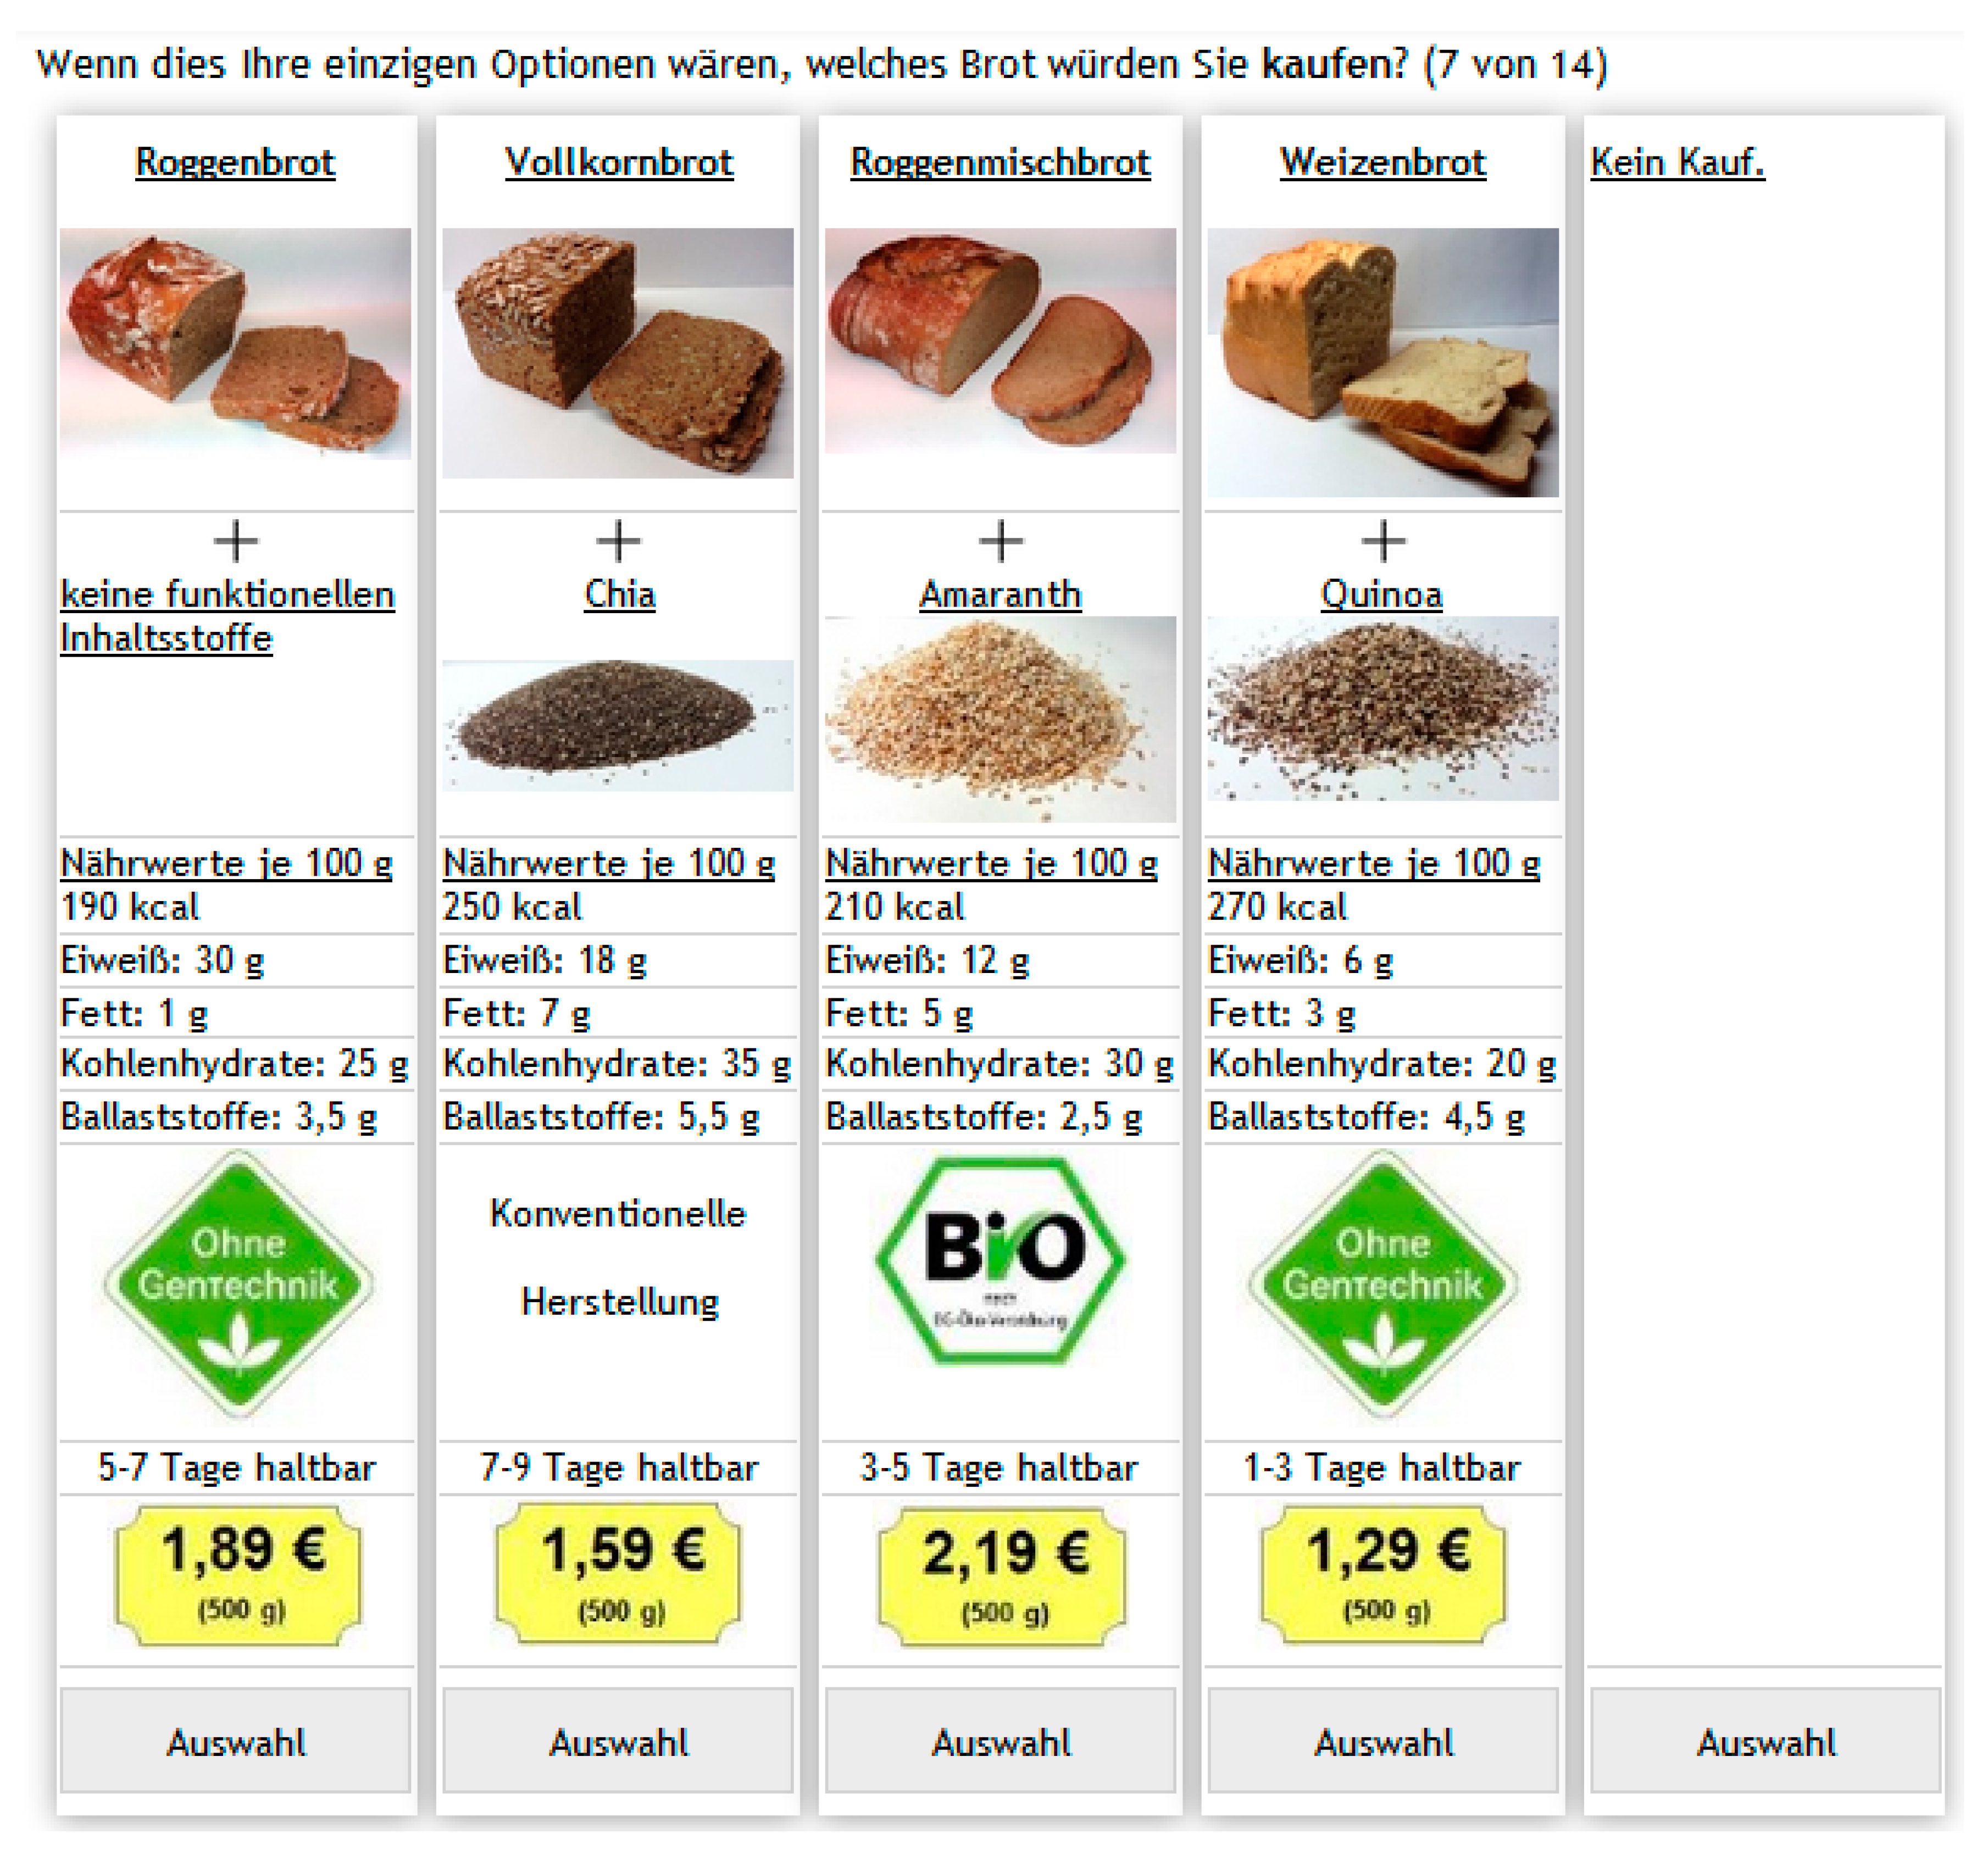
The choice experiment asked respondents to choose between four product alternatives. Respondents should indicate the product alternative that they would actually intend to buy. Moreover, a no choice-option was included in each choice set to allow respondents to refuse to purchase any bread. The combination of attribute levels for each product profile and choice set was generated by an experimental design. Because using the full-choice design of all possible combinations of attribute levels was not empirically feasible, Sawtooth Software was used to identify a reduced design that approximates maximum D-efficiency [18]. Sawtooth Software’s shortcut scheme was used to sample subsets of the full-choice design. The resulting designs are nearly orthogonal, because a unique randomized design is generated for each respondent [18]. Overall, the choice experiment contains 14 choice tasks with two fixed choice sets per respondent. Pictures were used to demonstrate the information in a simple and concise manner; Figure 1 shows an example of a choice set.
2.4. Statistical Methods: Hierarchical Bayes Model, Latent Class Choice Analysis, and Segment Profiling
First, socio-demographic data and responses to the attitudinal questions were analyzed using SPSS 25.0. This was followed by the analysis of the discrete choice experiment in Sawtooth Software 9.5.2. To identify consumers’ average preferences in terms of type of bread, functional ingredients, calorific value, protein content, fat content, carbohydrates, dietary fiber, production method, durability and price, the Hierarchical Bayes model was used. Hierarchical Bayes estimates individual utilities by using a Monte Carlo Markov Chain algorithm [19]; due to this, the Hierarchical Bayes model generates additional insights and develops more accurate market simulators. The majority of studies use this model to efficiently analyze discrete choice data [20,21].
Additionally, to account for consumer heterogeneity and identify relevant consumer segments, latent class analysis was used. Latent class analysis (LCA) became popular in the mid-1990s as a tool to provide more insight into the structure of respondent preferences than an aggregate logit model. Based on respondents’ choices in the choice experiment, latent class choice analysis divides consumer into segments with similar preferences. This is based on the individual part-worth utilities derived from the attribute levels used in the choice experiment [22]. Compared to traditional cluster analysis that is unable to incorporate this information in the segmentation, both DeSarbo et al. (1995), and Moore, Gray-Lee, and Louviere (1998) [23,24] obtained better results with LCA in the field of choice experiments. In agricultural and food market research, the LCA has been established as a widely used method concerning choice experiments; for example, in a recent study Liu, Yan, and Zhou (2017) [25] analyzed consumer choices and motives for eco-labeled products in China. Furthermore, Wang et al. (2017) [26] used a latent class logit model to investigate U.S. consumer preferences for attributes of fresh market strawberries. Regarding the health benefits of foods, Segovia and Palma (2015) [27] used an LCA to segment participants by their willingness to pay for vegetable attributes, including production technique, origin, taste, and health benefits.
The identified latent consumer groups were then further profiled with regard to their socio-demographic and psychographic characteristics. Based on a literature review and the pre-test with the sample group, 41 questionnaire items were compiled and used in the present study to capture respondents’ attitudes towards food. Items were adopted directly from Gunarathne et al. (2017) [28] who have adjusted the food-related lifestyle scale of Brunsø, Grunert, and Bredahl (1996) [12] for the German food culture. The food-related lifestyle instrument was introduced by Brunsø, Grunert, and Bredahl (1996) [12] to characterize consumers by how they employ food and eating to obtain life values. To capture eating and nutrition behavior in the present survey, items developed by Gunarathne et al. (2017) [28] were included to assess respondents’ preferences for eating in company or for novelty products, their pleasure derived from food, interest in culinary events, passion for cooking, and their cooking skills. Due to the fact that the present study examines consumer preferences for functional food ingredients with potential consumer health benefits, further items were used based on the research of Argo and White (2012) [29]; Haws and Winterich (2013) [30]; Koschate-Fischer, Stefan, and Hoyer (2012) [31]; and Vroegrij, Gijsbrechts, and Campo (2013) [32], all of which are listed in the Marketing Scales Handbook [33]. To obtain a comprehensive insight into eating habits, items measuring the eating control behavior, and health consciousness were added. Eating control behavior can be described as how much a person consciously attempts to control his or her food intake; the scale was first used by Argo and White in 2012 and contains six five-point items [29]. Secondly, the health consciousness item was used, “to measure a personality trait having to do with the amount of attention given to one’s health and to monitoring any changes” [30]. In 2013, Haws and Winterich used this scale with seven five-point items. To analyze how much a person uses a product because of both its positive social value and to satisfy their expectations of others, three items by Koschate-Fischer, Stefan, and Hoyer (2012) [31] were included to measure the prestige of consuming superfoods. Their scale used seven response categories; but for the present case, three five-point Likert-type items were used to obtain an equally spaced scale when compared to the other items. Finally, shopping orientation (price vs. quality) was measured based on Vroegrijk, Gijsbrechts, and Campo (2013) using nine, five-point Likert-type items. In particular, this scale measures consumer preferences for low prices rather than preferences for high quality groceries [32]. An overview of all items used is given in Table 6.
3. Results
3.1. Sample Description
Firstly, the collected data was analyzed by socio-demographic patterns, as shown in Table 2. In total, 503 respondents over 18 years old were considered. Comprising 50.3% of all respondents, slightly more female respondents than male respondents (49.7%) participated in the survey. The average age of the respondents was 44.8 years. Most respondents (20.7%) live in the Northrhine-Westphalia federal state. The majority live in a household of two persons and receive a net monthly household income of 1000–1999 €. Approximately 40.6% of respondents had completed vocational training, and one-third qualified for university entrance. When comparing the socio-demographic characteristics of the questionnaire to the German population, it is apparent that respondents with a higher educational level are overrepresented in the sample. For all other variables, their share of the sample largely compares to their frequency in the German population.
3.2. Results of the Hierarchical Bayes Model
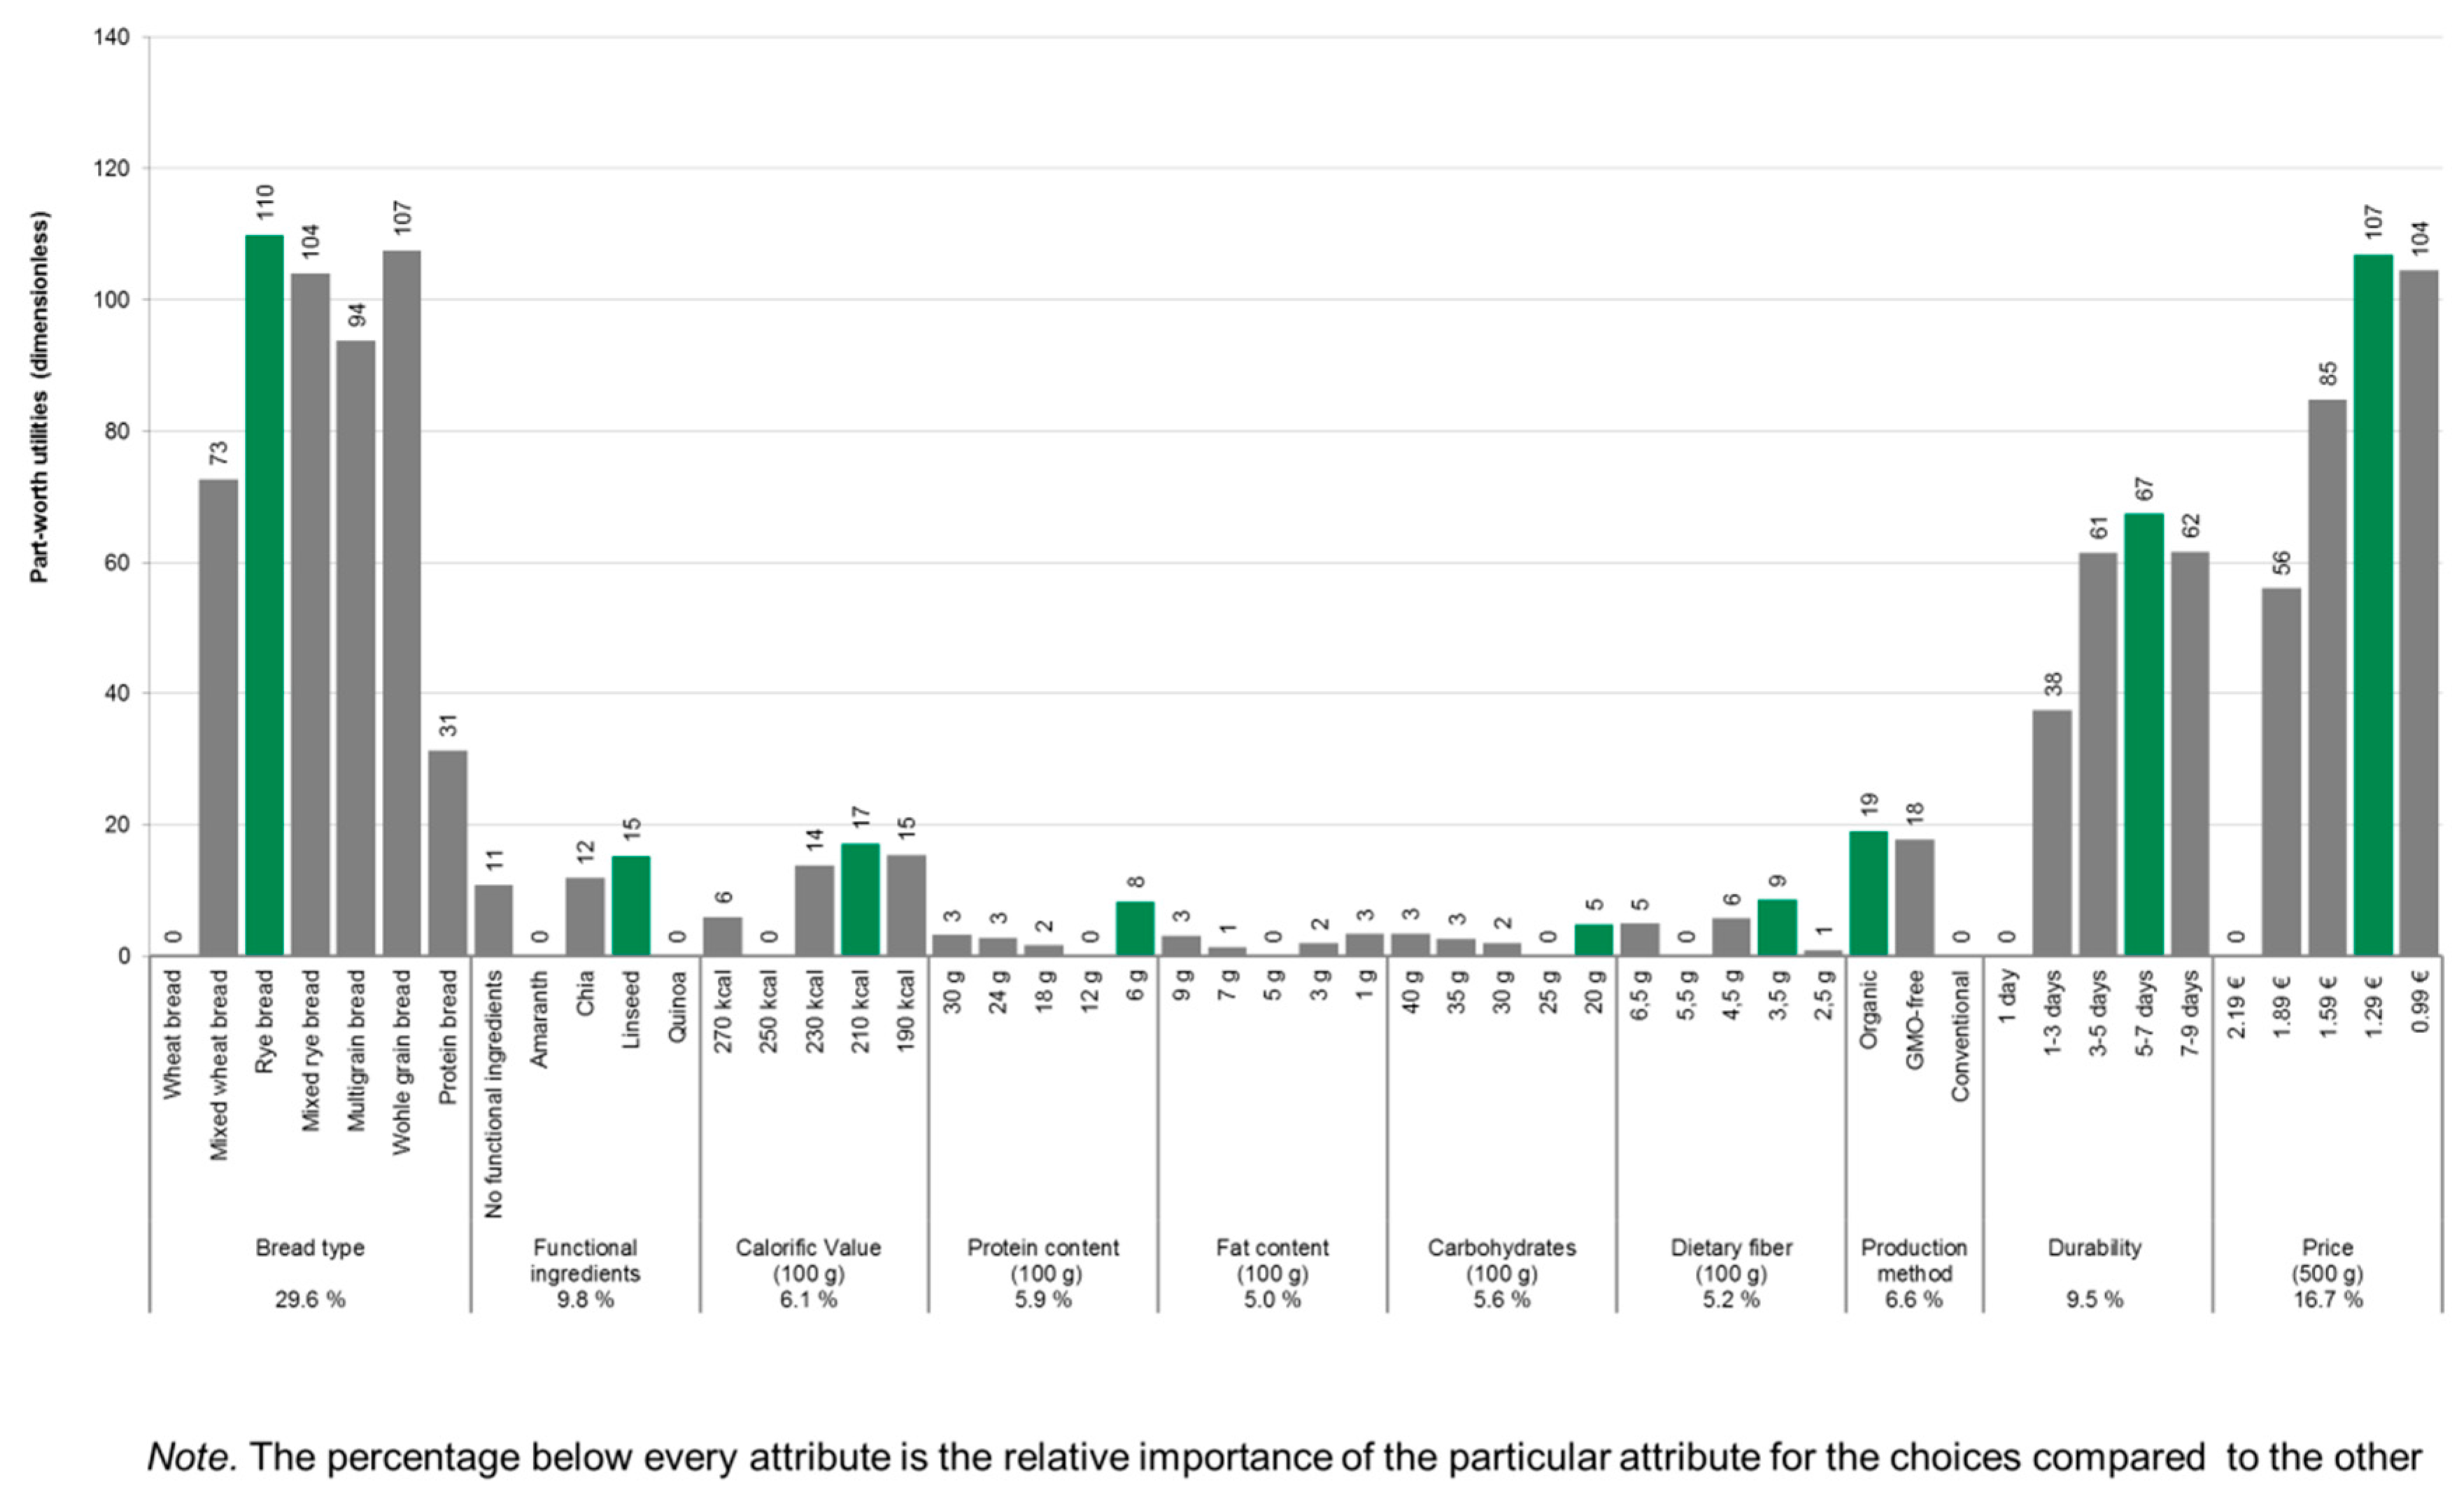
To identify consumers’ average preferences in terms of type of bread, functional ingredients, calorific value, protein content, fat content, carbohydrates, dietary fiber, production method, durability and price, the Hierarchical Bayes model was used. The columns in the Figure 2 illustrate the estimated part-worth utilities for each level in the relevant attribute group; a higher part-worth utility represents greater benefit for the consumer. This, in turn, indicates a greater likelihood of purchasing the chosen product. The lowest part-worth was set to zero in each attribute group; this was implemented to achieve better comparability of the level effects.
Overall, the average respondent prefers rye bread with linseed. In terms of the nutrient items, a calorific value of 210 kcal, a protein content of 6 g, a fat content of either 1 g or 9 g, carbohydrates of 20 g and dietary fiber of 3.5 g are favored. Organically produced bread gains the highest part-worth utility among GMO-free and conventionally produced bread. Furthermore, consumers favor a long durability of 5–7 days. The highest part-worth utility gains a price of 1.29 €. In view of the 10 different attributes, the highest part-worth utilities can be found for the bread type, the durability and the price; however, part-worth utilities for the functional ingredients are not as high as expected. With a part-worth utility of 15 for linseed and 12 for chia, their difference to rye bread’s part-worth utility of 110 is high. On the other hand, comparing functional ingredients with the production method, organically produced bread (19) is important to the consumer, in addition to such functional ingredients as linseed (15). Based on the results, chia and linseed are more valued by the average consumer than other exotic functional ingredients like amaranth and quinoa. Nutrient values like calorific value, protein and fat content, carbohydrates, and dietary fiber obtained the lowest part-worth utilities.
3.3. Results of the LCA
In the literature, it is not clear which is the best criterion for deciding how many segments should be defined. The consistent Akaike information criterion (CAIC) is the most widely used when deciding the number of reasonable segments; this was proposed by Bozdogan in 1987 and is closely related to log likelihood. Smaller values of the CAIC are preferred [17]. Furthermore, the Bayesian information criterion (BIC) and the Akaike information criterion (AIC) are common tools; Nylund et al. (2007) [34] concluded that the BIC and CAIC are appropriate instruments to determine the number of segments. However, in every statistical analysis the practical aspect of the group sizes should be carefully considered by the researcher.
In Table 3, the aforementioned criteria are listed up to a five-group solution. The CAIC and BIC decrease until the four-group solution. These four classes may indicate an inflection point because CAIC and BIC begin to increase again for the five-group solution. The practical implication of a four-group solution was assumed successfully and was chosen for further analysis.
The results of the LCA for the four-group solution are presented in Table 4. Here, the respondents are divided into segments with similar utilities based on their choices in the choice experiment [22]. At the end of the table, the relative importance gives an idea of the overall influence of each attribute in the particular segment.
Participants in Group 1 are named ‘traditional consumers’, and account for 12.7% of the respondents. This group prefers mixed wheat bread and mixed rye bread. As they have the highest part-worth utility for the ‘no functional ingredients’ label, it could be assumed that they are not interested in any exotic superfood ingredients. In the field of nutrient values, traditional consumers prefer a low calorific value and a high fat content. Even though it is a well-known fact that dietary fiber has positive effects on digestion and could prevent cardiac infarction and diabetic risks, traditional consumers do not much care for high dietary fiber content. Moreover, this group places the lowest part-worth utility on organic production. For GMO-free bread, part-worth utilities are consistently higher; this shows that these consumers prefer to buy GMO-free bread rather than organic bread. Of the five levels of durability, the participants in this group prefer the longest durability of 7–9 days.
Respondents in Group 2 (35.1%) are ‘quality-oriented consumers’, which is the largest group among the segments. The name ‘quality-oriented’ was chosen because of the relative importance of bread type, production method, and durability are higher compared to the other three segments. Quality-oriented consumers like to buy a mixed rye bread with linseed. Based on their almost identical part-worth utilities for the ‘no functional ingredients’ and ‘linseed’ labels, this segment is interested in superfood ingredients, but they are not an essential factor in their purchases. Furthermore, this group prefers a low fat and high protein content. The utility of organic production in this segment is 33 times higher than the utility for organic production of traditional consumers. In contrast to all other segments, this group shows the highest relative importance for the production method, so it seems that quality-oriented consumers tend to buy organic or GMO-free bread. Lastly, this group prefers durability up to five days. Similarly to price-conscious consumers, the relative importance of durability is 17.91%.
Group 3, or ‘health-conscious consumers’, account for 28.0% of the sample and, of the four segments, place the highest importance on bread type (58.05%). It is worth mentioning that the part-worth utilities for wholegrain bread (580) are the highest among the four groups, indicating that this group is interested in consuming healthy products. Aside from wholegrain bread, health-conscious consumers possess high part-worth utilities for multigrain bread and protein bread. Furthermore, this segment likely prefers wholegrain bread with superfood ingredients, as per their negative part-worth utilities for the ‘no functional ingredients’ label. The highest part-worth utilities for this group can be found for the superfood ingredients chia and amaranth. Interestingly, for health-conscious consumers the relative importance of durability is only 6.10% and seems to be less important than in all other segments. Based on the lowest relative importance for price (6.46%) among all groups, this segment appears to place little importance on price. Overall, health-conscious consumers are strongly interested in the bread type and will likely be attracted by health-labeled bread with a high price.
The last segment, ‘price-conscious consumers’, contains 24.2% of the respondents. It is characterized by the highest relative importance for price (54.67%) over all segments. Apart from the price attribute, participants in this group are aware of a product’s durability, with a relative importance of 15.28%. In addition, price-conscious consumers show higher part-worth utilities for superfood ingredients such as chia and linseed than health-conscious consumers. Lastly, for the production method this segment achieved the lowest relative importance (2.33%) of all five groups. Due to their increased price-consciousness and likelihood of seeking superfood ingredients, this segment could be attracted by special offers in supermarkets.
3.4. Results of Sociodemographic Variables for Estimated Segments
At the beginning of the questionnaire, respondents were asked about several socio-demographic variables like gender, age, income and education. Table 5 shows the results of the sociodemographic parameters in the four estimated segments of the LCA. It is remarkable that traditional consumers comprise 1.66 times more male consumers than female consumers. The difference in the segment of price-conscious consumers is slightly lower, with 1.3 more males than females. In the group of health-conscious consumers, female respondents play a dominant role, with nearly twice as many women as men. The gender ratio for quality-oriented consumers is balanced. Moreover, both quality-oriented consumers and health-conscious consumers show a higher educational level due to a greater number of Bachelor’s and Master’s degrees. Furthermore, quality-oriented consumers earn the highest income, followed by health-conscious consumers.
3.5. Results of the Purchase Location for Estimated Segments
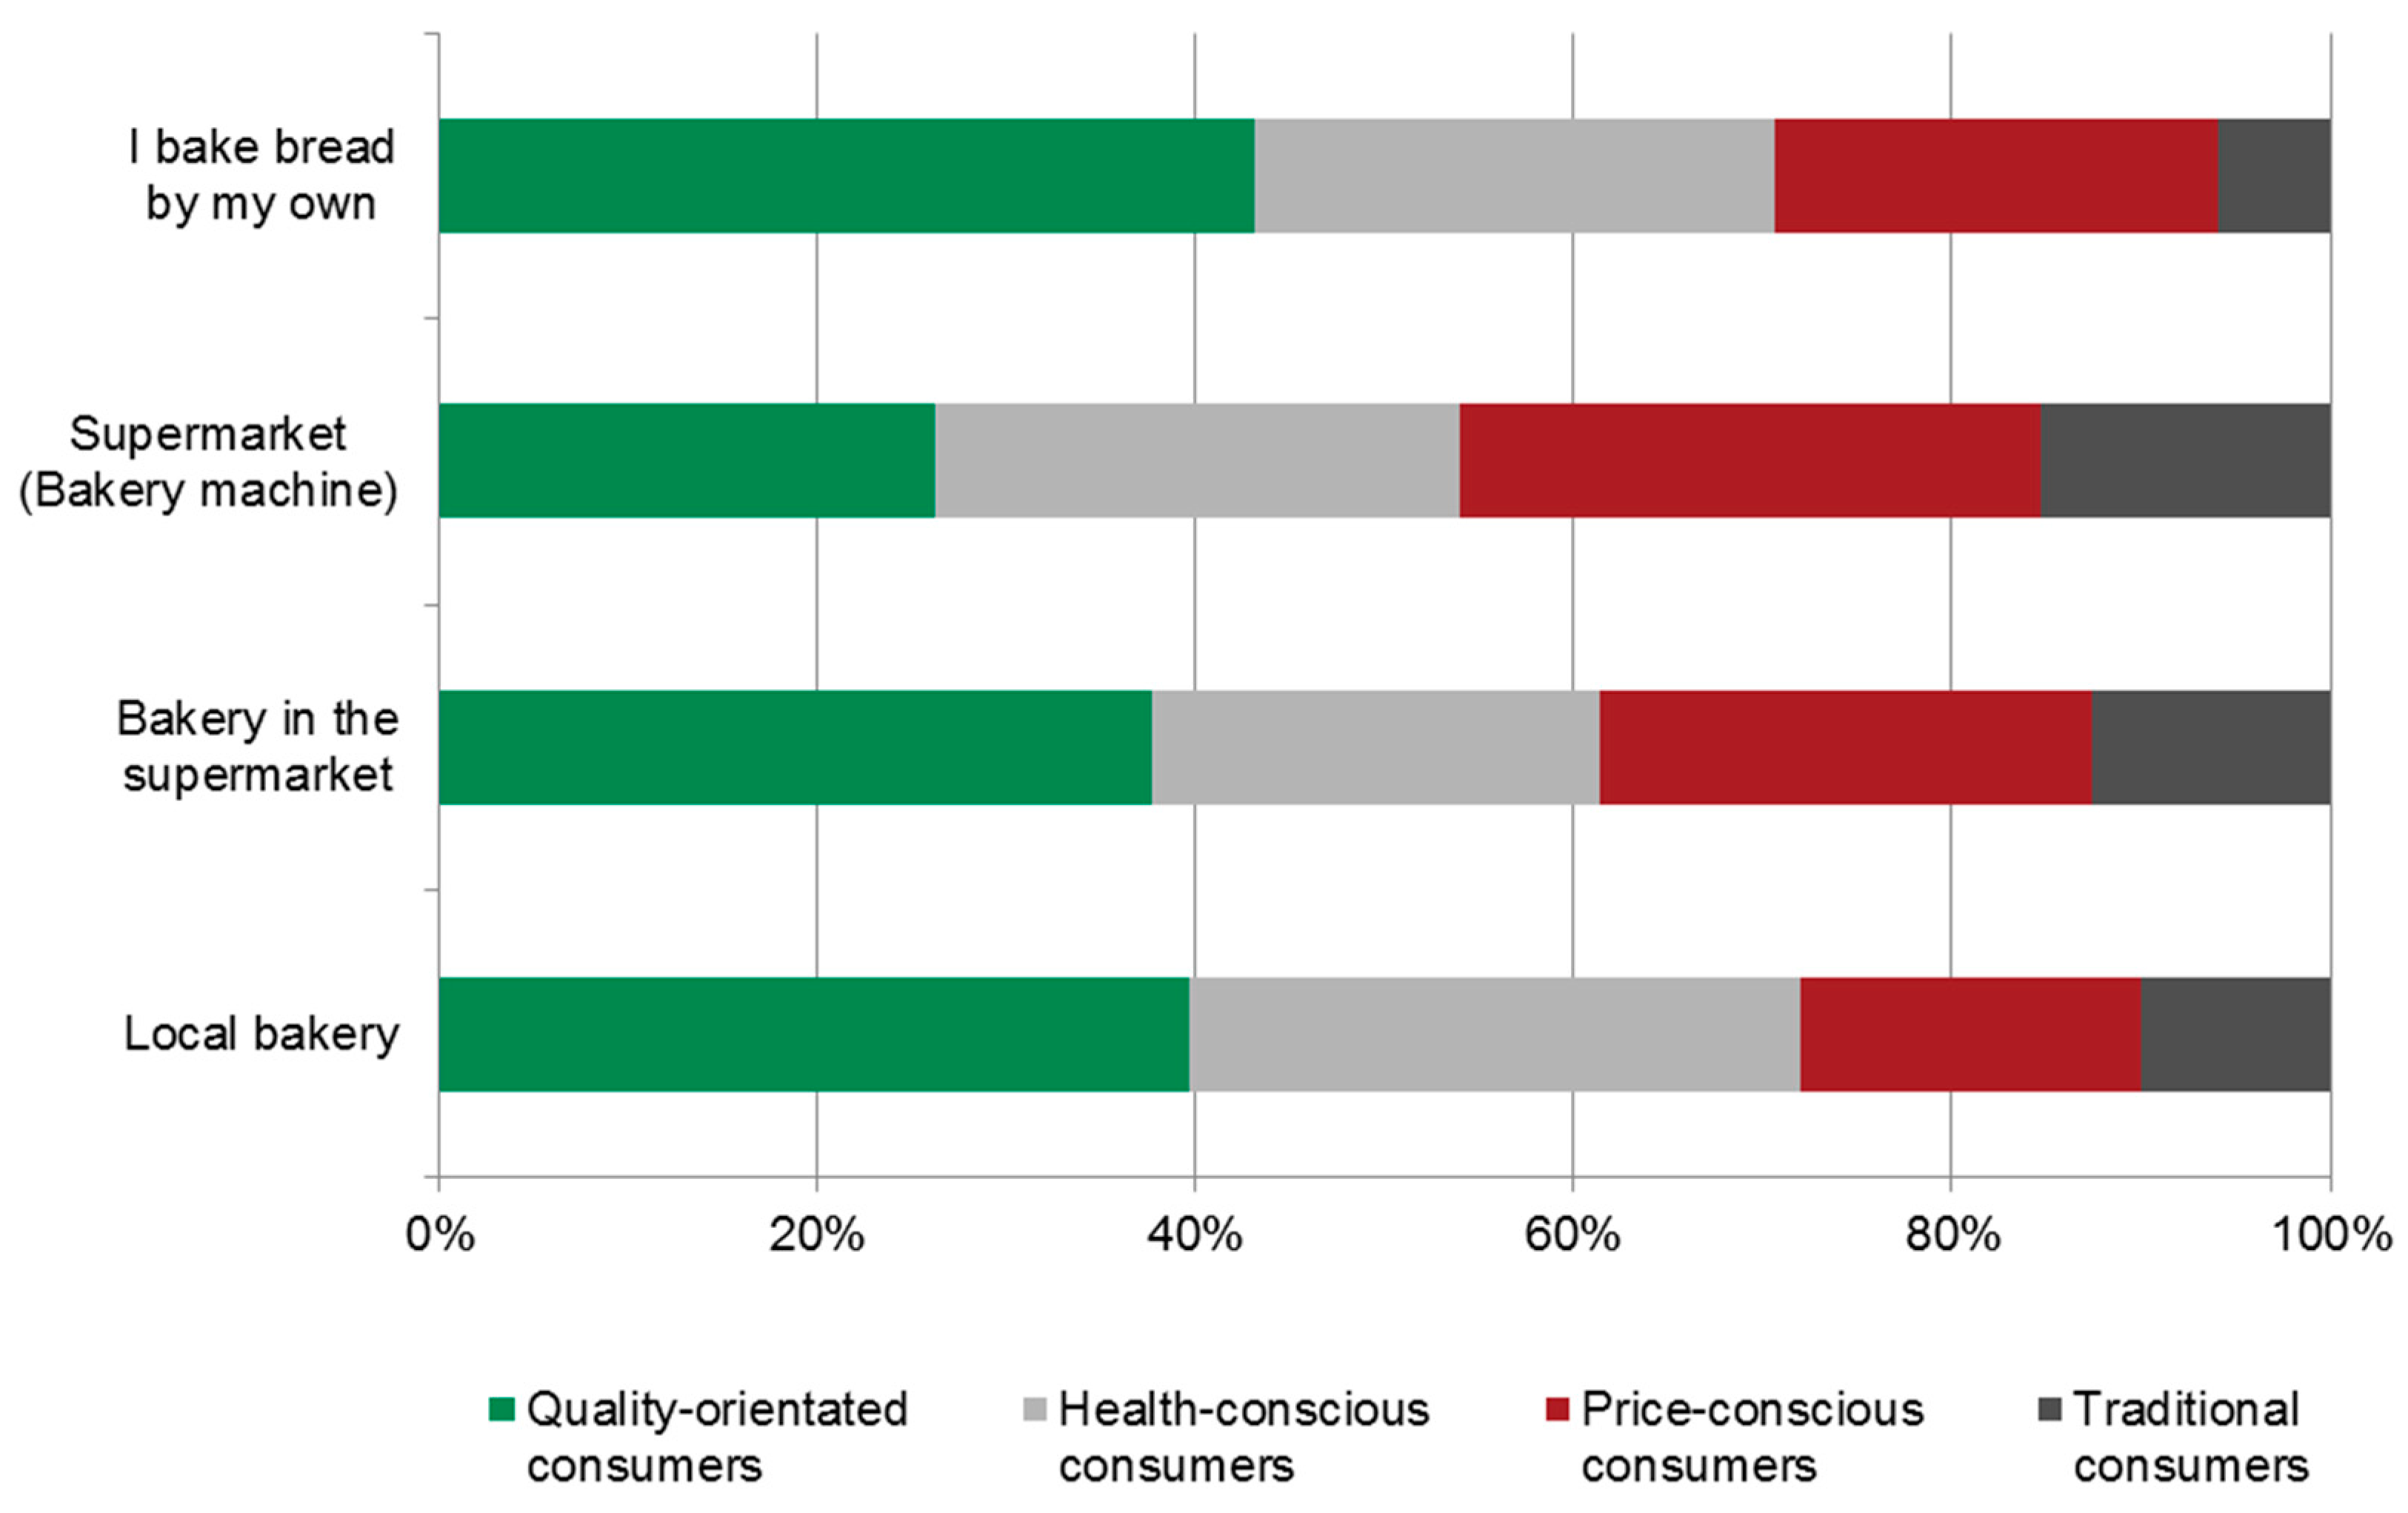
After the sociodemographic characterization, respondents stated their preferred place to purchase bread. Their options were: ‘local bakery’, ‘bakery in the supermarket’, ‘supermarket (bakery machine)’ and ‘I bake bread myself’. Figure 3 presents the preferred purchase location for the estimated consumer segments of the LCA. Quality-oriented consumers prefer to bake bread themselves or buy it in a local bakery; their least-preferred purchase location is the bakery machine in the supermarket. Furthermore, the same findings can be applied to health-conscious consumers. Both groups are aware of healthiness and quality attributes like freshness, handmade-production or naturalness of bread, and therefore are less likely to buy bread in supermarkets.
Price-conscious consumers selected the bakery machine in the supermarket as their favored purchase location. Due to their distinctive price awareness, local bakeries are less frequented by this group. Finally, traditional consumers represent the smallest group. Figure 3 clearly shows that a traditional consumer would first buy bread in the supermarket (bakery machine), followed by the bakery in the supermarket. It is notable that the percentage of consumers choosing ‘local bakery’ and ‘I bake bread myself’ are significantly low for this segment.
3.6. Results of the Factor Analysis for Food-Related Lifestyle Items
A principal component factor analysis with varimax rotation was performed in SPSS using all items measuring respondents’ attitudes towards food as specified in Section 2.4 and shown in Table 6; the Kaiser–Meyer–Olkin (KMO) criterion and the Bartlett test for sphericity (BTS) were used to validate the approach. Values of the KMO lie between 0 and 1 and are acceptable over 0.5 [35]. In this study, the KMO value was 0.936; this is classified as “marvelous” by Kaiser. The BTS verifies the null hypothesis if the sample belongs to a basic population with uncorrelated variables. Here, the BTS was significant, so the null hypothesis can be declined and a factor analysis is possible.
Table 6 shows the results of the factor analysis, including the food-related lifestyle items, as well as the other items used to describe different segments.
In Table 6, the extracted factors and their arithmetic mean, standard deviation and factor loadings are presented for each item, including: ‘passion for cooking’, ‘controlling eating behavior’, ‘quality aspects’, ‘health-consciousness’, ‘novelty preferences’, ‘prestige of consuming superfoods’, ‘price consciousness’, ‘eating in company’, ‘subjective knowledge and cooking skills’, ‘attending culinary events’, ‘pleasure and interest’, and ‘financial aspects’. The Cronbach’s Alpha criterion was utilized to measure internal consistency. To guarantee an exact measurement factor loadings need to have the same direction, and so the items ‘I only buy and eat foods that are familiar to me’ and ‘When buying groceries, I actually do not pay much attention to price’ were recoded. In the existing factor analysis, Cronbach’s Alpha values were located from 0.279 to 0.940. As recommended by Nunally (1978) [36] and Homburg and Giering (1997) [37], values should not fall below 0.6; in our study, only the factor price consciousness (0.279) fell below this.
Subsequently, the identified four consumer segments will be described using the extracted factors of Table 6. The results, mean values and standard deviation are presented in Table 7.
The traditional consumers had the lowest mean values for passion for cooking, health-consciousness, novelty preferences, prestige of consuming superfoods, eating in company, attending culinary events, pleasure and interest, and financial aspects factors. Compared to the other segments, traditional consumers do not enjoy preparing meals by themselves. Moreover, they are not interested in new exotic ingredients. It is logical to assume, therefore, that traditional consumers place a low value on prestige and creating good impressions by consuming superfoods. Moreover, this segment is not interested in enjoying food with others. Unexpectedly, however, traditional consumers have considerable knowledge about food; for example, they are able to make a meal out of all the available ingredients they have at home. Finally, from a financial perspective traditional consumers do not have any problems affording the groceries they intend to buy.
Quality-oriented consumers showed the highest mean values for quality aspects, prestige of consuming superfoods, eating in company, subjective knowledge and cooking skills. Participants in this group have good knowledge about the preparation of meals. Furthermore, they enjoy having food with others. Due to the fact that they like to eat in company, here the consuming of superfoods is a manner of prestige. The lowest mean value for these consumers is price consciousness, as this group does not much care for the price of bread. Next to traditional consumers, they also have no difficulties in meeting their financial budget.
Health-conscious consumers can be characterized by the highest mean values for passion for cooking, controlling eating behavior, health-consciousness, novelty preferences, pleasure and interest, and financial aspects. For this group, cooking is a hobby in which they invest a significant amount of time, and good food and drink plays a major role in their life. Moreover, they like to try new foods and prepare unusual meals with exotic ingredients. On the other hand, they are aware of their eating habits and frequently reflect on their health. Surprisingly, from a financial aspect health-conscious consumers have to take care in managing their household budget and how much they spend on groceries.
For price-conscious consumers, unsurprisingly, price is the deciding factor when buying a product: they search for the lowest possible price. Additionally, this group of participants demonstrated the highest mean value for the financial aspects factor. Taking care of their monthly income could be the reason for the price-consciousness found in this group. When compared with the other segments, price-conscious consumers have the lowest mean value for quality aspects. They rate quality aspects like organic, fresh, regional, or handmade products as less important when purchasing. However, price-conscious consumers are, next to health-conscious consumers, the only group with positive mean scores for the novelty preferences factor. This implies that they might be attracted by special offers with new ingredients. Furthermore, they, after health-conscious consumers, are passionate about cooking, but they do not enjoy food with all their senses, as health-conscious consumers and quality-oriented consumers do.
4. Discussion
In previous research, Bitzios, Fraser, and Haddock-Fraser (2011) and Bruschi, Teuber, and Dolgopolova (2015) realized that sometimes the base product is given more importance than the functional ingredient [1,38]. Respondents typically select bread based on its type [1]. The same effect can be observed in our study; part-worth utilities for distinct types of bread are greater than for superfood ingredients or the production method. Moreover, Bech-Larsen and Grunert (2003) emphasized, in their choice study with base products of yoghurt, orange, and juice, that the perceived healthiness of functional food is more dependent on the nutritional qualities of the base product than on the health claim [4]. This supports the findings in our study: a high quality base bread is needed. Additionally, Ares et al. (2010) demonstrated a higher purchase intention for functional yoghurts over regular ones, even though they did not promote any health claim [10].
Kraus, Annunziata, and Vecchio (2017) [39] determined the reliability of sociodemographic factors by measuring the purchase intention of functional foods; their findings are similar to our choice experiment. For women, functional food ingredients are significantly more important than for men, this was clearly seen when, in our study, nearly twice as many health-conscious consumers were women. Furthermore, those with university education “attach the greatest importance to naturalness, nutritional value, food safety, and quality guarantee” [39], which is true for both quality-oriented consumers and health-conscious consumers.
In the discrete choice experiment, with the exception of traditional consumers, all respondents were willing to buy bread with superfood ingredients. Based on the results of the LCA, consumers can be divided into four different groups: (1) traditional consumers (12.7%), (2) quality-oriented consumers (35.1%), (3) health-conscious consumers (28.0%), and (4) price-conscious consumers (24.2%). Traditional consumers intend to buy mixed wheat bread or mixed rye bread, and they are aware of products with a long durability and a low price. Their preferred purchase location is the bakery machine in the supermarket. As they do not prefer bread with any superfood ingredients or are not aware about the healthy properties of bread, a possible method to attract their attention could be to promote packaged sliced bread that is ready for them to take home. Even if they prefer a low price, they are not price conscious because of their financial situation. A higher price could be possible if the durability of the bread is improved. All in all, convenient and highly durable bread with an appropriate price is a fitting product for traditional consumers. Furthermore, this group has the potential to extend their knowledge about food, and some of this group could develop into quality-oriented consumers.
Quality-oriented consumers pay attention to regional, traditional, fresh, natural, or organically produced bread. Contrary to traditional consumers, they are open-minded towards superfood ingredients. Despite this, superfood ingredients are not the only way they would like to make a good impression and satisfy the expectations of others. Bread that contains essential quality attributes, such as being low in fat and high in protein with medium durability at any price, could be a suitable product for this group. Interestingly, this group would pay a higher price for higher quality, so there is the possibility to promote quality label strategies for bread to increase sales in this segment, particularly for organic or GMO-free bread. Moreover, as this segment is knowledgeable about groceries and possesses cooking skills, another labeling strategy might be to invest in, for example, the field of non-industrial bread processing. This may be an interesting opportunity to promote in-house production, particularly in bakeries.
Health-conscious consumers like to buy groceries that have a positive effect on their health and well-being. Because of this, they are passionate about cooking and interested in exotic, unfamiliar products; this combination promotes the healthy benefits of exotic ingredients in common bread. Cooking is their hobby, and so health-conscious consumers like to try new recipes. There might be the opportunity for marketing strategies to create a ‘story’ about superfoods as functional ingredients to attract these consumers. For example, this segment prefers chia and amaranth. It is well-known that these grains are from South America and have been cultivated in the Andean region for thousands of years by natives. The benefits of the exotic ingredients can support the purchase intention of this group.
Finally, price-conscious consumers are aware about cheap offers due to their limited financial budget for groceries. A possible way to increase sales in this segment is short-term offers with low prices. Price-conscious consumers are interested in superfood ingredients, even if they do not care about its healthy functions or the prestige of consuming superfoods. Contrary to traditional consumers, they would pay attention to cheap offers that contain a special ingredient.
To summarize the findings of the discrete choice experiment, two main product strategies for bread with superfood ingredients could be carried out. On the one hand, well-known types of bread are needed at a price that the majority of consumers can afford. On the other hand, exclusive products with certain superfood ingredients that attract consumer attention have to be placed in the market. A possible way might be to offer base products without any exotic ingredients or health potential at an appropriate price to appeal to both traditional consumers and price-conscious consumers. Then, building on a high-quality base product, different quality attributes and superfoods as functional ingredients can be added to create new types of bread for consumers that prefer an exclusive product with special ingredients.
There are also limitations that can be addressed in this experiment. First, the analysis has only focused on bread with superfood ingredients. Further research could investigate whether the results vary when compared to alternative products with superfoods. For example, choice experiments in the field of unprocessed products like different types of grains or fruits (exotic fruits and regional fruits) may be another research area for functional foods. According to Annunziata and Vecchio (2013), consumers in Central and Northern European countries are more interested in functional foods than consumers in Mediterranean countries [3]; thus it would be interesting to explore the differences in the preferences for superfoods of various EU countries. Besides, there might even be different consumer bread type preferences within the regions in Germany. A deeper analysis of the preferred type of bread in North and South Germany is a further research field. Last but not least, the size of the sample (503 respondents) was quite large, but for better representativeness in market segmentation regarding preferences for superfood ingredients, a greater number of respondents is always desirable.
5. Conclusions
Nowadays, German consumers can choose among a huge variety of bread types, all of which have different ingredients. There is increasing demand for functional foods and superfoods with perceived health benefits. This offers promotion opportunities for food manufacturers in a competitive market. Against this background, the current study analyzed consumer preferences for different types of bread enhanced with superfood ingredients in the German market. The results of the quantitative analysis showed the importance of the base product, as the highest part-worth utilities were reported for rye bread, followed by wholegrain bread and mixed rye bread. Purchase is strongly affected by the type of bread; by taking this into account and offering different types of bread, according to the preferences of the various consumer segments, bakeries are able to enlarge their consumer base. In the field of superfood ingredients that serve a potential functional benefit, customers prefer linseed and chia. Additionally, amaranth and quinoa are rather popular as superfood ingredients. Yet, their influence on the purchasing decision remained small when compared to the importance of the bread type. Furthermore, four different consumer segments were examined in the study: traditional consumers, quality-oriented consumers, health-conscious consumers, and price conscious consumers. Interestingly, only the traditional consumer segment refused to buy bread with any superfood ingredients. In all other segments, there is a willingness to buy or interest in exotic ingredients. Quality-oriented consumers and health-conscious consumers have, compared to the other segments, a high potential for new, innovative and healthy products.
The practical implications of this experiment are presented as follows: The findings indicate quality-oriented (35.1%) and health-conscious (28.0%) consumers represent more than half of the respondents. For food manufacturers and bakeries, this clearly demonstrates potential for product differentiation and marketing strategies promoting high quality, exclusive, exotic, and healthy products. Consumers often do not like to change their eating habits; therefore, an effective strategy could be to integrate the healthy properties of certain ingredients into existing products [4]. For traditional consumers and price-conscious consumers (36.9%), the remaining groups, an optimal price-performance ratio is needed. Regarding the structure of a possible product, a portfolio of bread types for traditional and price-conscious consumers could serve as a base product. Further superfood ingredients or quality attributes could be added to some types of bread to obtain a product solution for quality-oriented and health-conscious consumers. Finally, further research needs to be conducted on other superfood products (processed/unprocessed) and also for different consumer groups, such as in North and South Germany or in different European regions.
Author Contributions
Conceptualization and research design by S.G.H.M. and A.K.; Methodology and research design by S.G.H.M.; Validation of the data by A.K. and S.G.H.M.; Formal Analysis by S.G.H.M.; Writing-original draft preparation by A.K., S.G.H.M. and B.G.; Writing-review & editing of the manuscript by S.G.H.M. and B.G.; Visualization by A.K. and S.G.H.M.; Supervision of the research project by S.G.H.M.; Project administration by S.G.H.M.
Funding
This research received no external funding.
Conflicts of Interest
The authors declare no conflict of interest.
References
- Kaur, N.; Singh, D.P. Deciphering the consumer behaviour facets of functional foods: A literature review. Appetite 2017, 112, 167–187. [Google Scholar] [CrossRef] [PubMed]
- Diplock, A.; Aggett, P.J.; Ashwell, M.; Bornet, F.; Fern, E.B.; Roberfroid, M.B. Scientific concepts of functional foods in Europe consensus document. Br. J. Nutr. 1999, 81, 1–27. [Google Scholar] [CrossRef]
- Annunziata, A.; Vecchio, R. Consumer perception of functional foods: A conjoint analysis with probiotics. Food Qual. Prefer. 2013, 28, 348–355. [Google Scholar] [CrossRef]
- Bech-Larsen, T.; Grunert, K.G. The perceived healthiness of functional foods. Appetite 2003, 40, 9–14. [Google Scholar] [CrossRef]
- Oxford English Dictionary. Superfood. Available online: http://www.oed.com/view/Entry/194186?redirectedFrom=superfood#eid69476470 (accessed on 23 November 2018).
- Groeniger, J.O.; van Lenthe, F.J.; Beenackers, M.A.; Kamphuis, C.B. Does social distinction contribute to socioeconomic inequalities in diet: The case of ‘superfoods’ consumption. Int. J. Behav. Nutr. Phys. Act. 2017, 14, 40. [Google Scholar] [CrossRef] [PubMed]
- Vassallo, M.; Saba, A.; Arvola, A.; Dean, M.; Messina, F.; Winkelmann, M.; Claupein, E.; Lähteenmäki, L.; Shepherd, R. Willingness to use functional breads. Applying the Health Belief Model across four European countries. Appetite 2009, 52, 452–460. [Google Scholar] [CrossRef] [PubMed]
- Santeramo, F.G.; Carlucci, D.; De Devitiis, B.; Seccia, A.; Stasi, A.; Viscecchia, R.; Nardone, G. Emerging trends in European food, diets and food industry. Food Res. Int. 2018, 104, 39–47. [Google Scholar] [CrossRef] [PubMed] [Green Version]
- Bimbo, F.; Bonanno, A.; Nocella, G.; Viscecchia, R.; Nardone, G.; Devitiis, B.; Carlucci, D. Consumers’ acceptance and preferences for nutrition-modified and functional dairy products: A systematic review. Appetite 2017, 113, 141–154. [Google Scholar] [CrossRef] [PubMed]
- Ares, G.; Giménez, A.; Deliza, R. Influence of three non-sensory factors on consumer choice of functional yogurts over regular ones. Food Qual. Prefer. 2010, 21, 361–367. [Google Scholar] [CrossRef]
- Teuber, R.; Dolgopolova, I.; Nordström, J. Some like it organic, some like it purple and some like it ancient: Consumer preferences and WTP for value-added attributes in whole grain bread. Food Qual. Prefer. 2016, 52, 244–254. [Google Scholar] [CrossRef]
- Brunsø, K.; Grunert, K.G.; Bredahl, L. An analysis of national and cross-national consumer segments using the food-related lifestyle instrument in Denmark, France, Germany and Great Britain. MAPP Work. Paper 1996, 35, 1–51. [Google Scholar]
- Bitzios, M.; Fraser, I.; Haddock-Fraser, J. Functional ingredients and food choice: Results from a dual-mode study employing means-end-chain analysis and a choice experiment. Food Policy 2011, 36, 715–725. [Google Scholar] [CrossRef]
- Zentralverband des Deutschen Bäckerhandwerks, e. V. Brotkorb der Deutschen 2017. Available online: https://www.baeckerhandwerk.de/baeckerhandwerk/zahlen-fakten/brotverbrauch-und-brotkorb-der-deutschen/ (accessed on 14 June 2018).
- Zentralverband des Deutschen Bäckerhandwerks e., V. Wirtschaftsfaktor Bäckerhandwerk. Available online: https://www.baeckerhandwerk.de/baeckerhandwerk/zahlen-fakten/ (accessed on 9 August 2018).
- Zentralverband des Deutschen Bäckerhandwerks e., V. Umsatzentwicklung und-Verteilung. Available online: https://www.baeckerhandwerk.de/baeckerhandwerk/zahlen-fakten/umsatzentwicklung-und-verteilung/ (accessed on 9 August 2018).
- Louviere, J.J.; Flynn, T.N.; Carson, R.T. Discrete choice experiments are not conjoint analysis. J. Choice Model. 2010, 3, 57–72. [Google Scholar] [CrossRef]
- Johnson, F.R.; Lancsar, E.; Marshall, D.; Kilambi, V.; Mühlbacher, A.; Regier, D.A.; Bresnahan, B.W.; Kanninen, B.; Bridges, J.F.P. Constructing Experimental Designs for Discrete-Choice-Experiments: Report of the ISPOR Conjoint Analysis Experimental Design Good Research Practice Task Force. Value Health 2013, 16, 3–13. [Google Scholar] [CrossRef] [PubMed]
- Sawtooth Software, I. HB-Reg v4 for Hierarchical Bayes Regression. Available online: https://www.sawtoothsoftware.com/download/techpap/hbreg.pdf (accessed on 9 August 2018).
- Sawtooth Software, I. The CBC System for Choice-Based Conjoint Analysis: Version 9. 2017. Available online: https://www.sawtoothsoftware.com/download/techpap/cbctech.pdf (accessed on 9 August 2018).
- Sawtooth Software, I. The CBC System for Choice-Based Conjoint Analysis: Version 9. 2017. Available online: https://www.sawtoothsoftware.com/download/techpap/cbctech.pdf (accessed on 9 August 2018).
- Sawtooth Software, I. The CBC Latent Class Technical Paper (Version 3). 2004. Available online: https://www.sawtoothsoftware.com/download/techpap/lctech.pdf (accessed on 9 August 2018).
- Desarbo, W.S.; Ramaswamy, V.; Cohen, S.H. Market segmentation with choice-based conjoint analysis. Mark. Lett. 1995, 6, 137–147. [Google Scholar] [CrossRef]
- Moore, W.L.; Gray-Lee, J.; Louviere, J.J. A cross-validity comparison of conjoint analysis and choice models at different levels of aggregation. Mark. Lett. 1998, 9, 195–207. [Google Scholar] [CrossRef]
- Liu, Q.; Yan, Z.; Zhou, J. Consumer choices and motives for eco-labeled products in China: An empirical analysis based on the choice experiment. Sustainability 2017, 9, 331. [Google Scholar] [CrossRef]
- Wang, J.; Yue, C.; Gallardo, K.; McCracken, V.; Luby, J.; McFerson, J. What consumers are looking for in strawberries: Implications from market segmentation analysis. Agribusiness 2017, 33, 56–69. [Google Scholar] [CrossRef]
- Segovia, M.S.; Palma, M.A. Buying your way into a healthier lifestyle: A latent class analysis of healthy food purchases. Appl. Econ. 2015, 48, 1965–1977. [Google Scholar] [CrossRef]
- Gunarathne, A.; Hemmerling, S.; Krestel, N.; Zühlsdorf, A.; Spiller, A. Segmenting Foodies in Germany: Actionable Insights for Agro-Food Marketers. 2017. Available online: http://ageconsearch.umn.edu/record/261422/files/Hitihamy%20Mudiyanselage%20A%20et%20al%20%282017%29%20Segmenting%20Foodies%20in%20Germany%20.pdf (accessed on 14 June 2018).
- Argo, J.; White, K. When do consumers eat more? The role of appearance self-esteem and food packaging cues. J. Mark. 2012, 76, 67–80. [Google Scholar] [CrossRef]
- Haws, K.L.; Page Winterich, K. When value trumps health in a supersized world. J. Mark. 2013, 77, 48–64. [Google Scholar] [CrossRef]
- Koschate-Fischer, N.; Stefan, I.V.; Hoyer, W.D. Willingness to pay for cause-related marketing: The impact of donation amount and moderating effects. J. Mark. Res. 2012, 49, 910–927. [Google Scholar] [CrossRef]
- Vroegrijk, M.; Gijsbrechts, E.; Campo, K. Close Encounter with the Hard Discounter: A Multiple-Store Shopping Perspective on the Impact of Local Hard-Discounter Entry. J. Mark. Res. 2013, 50, 606–626. [Google Scholar] [CrossRef]
- Bruner, G.C. Marketing Scales Handbook: Multi-Item Measures for Consumer Insight Research; GCBII Productions, LLC.: Fort Worth, TX, USA, 2016. [Google Scholar]
- Nylund, K.L.; Asparouhov, T.; Muthén, B.O. Deciding on number of classes in latent class analysis and growth mixture modeling: A Monte Carlos simulation study. Struct. Equ. Model. 2007, 14, 535–569. [Google Scholar] [CrossRef]
- Kaiser, H.F. An index of factorial simplicity. Psychometrika 1974, 39, 31–36. [Google Scholar] [CrossRef]
- Nunnally, J.C. Psychometric Theory, 2nd ed.; McGraw-Hill Book Company: New York, NY, USA, 1978. [Google Scholar]
- Homburg, C.; Giering, A. Konzeptualisierung und Operationalisierung komplexer Konstrukte. Ein Leitfaden für die Marketingforschung [Conceptualization and operationalization of complex constructs. A guide to marketing research]. Mark. ZFP 1996, 18, 5–24. [Google Scholar]
- Bruschi, V.; Teuber, R.; Dolgopolova, I. Acceptance and willingness to pay for health-enhancing bakery products—Empirical evidence for young urban Russian consumers. Food Qual. Prefer. 2015, 46, 79–91. [Google Scholar] [CrossRef]
- Kraus, A.; Annunziata, A.; Vecchio, R. Sociodemographic factors differentiating the consumer and the motivations for functional food consumption. J. Am. Coll. Nutr. 2017, 36, 116–126. [Google Scholar] [CrossRef]
Figure 1.
Example choice set in the choice experiment.

Figure 2.
Resulting part-worth utilities for purchase of bread (N = 503).

Figure 3.
Respondents’ preferred purchase location.


Table 1.
Attributes and Levels Used in the Conjoint Analysis.
| Attributes | Levels |
|---|---|
| Bread type | Wheat bread, Mixed wheat bread, Rye bread, Mixed rye bread, Multigrain bread, Whole grain bread, Protein bread |
| Superfood ingredients | None, Amaranth, Chia, Linseed, Quinoa |
| Calorific value per 100 g | 190 kcal, 210 kcal, 230 kcal, 250 kcal, 270 kcal |
| Protein content per 100 g | 6 g, 12 g, 18 g, 24 g, 30 g |
| Fat content per 100 g | 1 g, 3 g, 5 g, 7 g, 9 g |
| Carbohydrates per 100 g | 20 g, 25 g, 30 g, 35 g, 40 g |
| Dietary fiber per 100 g | 2.5 g, 3.5 g, 4.5 g, 5.5 g, 6.5 g |
| Production method | Conventional, GMO-free, Organic |
| Durability | 1 day, 1–3 days, 3–5 days, 5–7 days, 7–9 days |
| Price per 500 g | 0.99 €, 1.29 €, 1.59 €, 1.89 €, 2.19 € |
Table 2.
Summary of the Socio-demographic Analysis (N = 503).
| Variables | Description | Frequency Sample | Share (%) Sample | Share (%) Germany * |
|---|---|---|---|---|
| Gender | Male | 250 | 49.7 | 49.3 |
| Female | 253 | 50.3 | 50.7 | |
| Age | 18–29 | 102 | 20.3 | 17.0 |
| 30–39 | 85 | 16.9 | 14.7 | |
| 40–49 | 101 | 20.1 | 16.7 | |
| 50–59 | 124 | 24.7 | 18.9 | |
| 60–69 | 91 | 18.1 | 32.7 | |
| Federal states | Baden Wuerttemberg | 59 | 11.7 | 13.1 |
| Bavaria | 56 | 11.1 | 15.3 | |
| Berlin | 28 | 5.6 | 4.4 | |
| Brandenburg | 17 | 3.4 | 3.1 | |
| Bremen | 2 | 0.4 | 0.8 | |
| Hamburg | 21 | 4.2 | 2.1 | |
| Hesse | 38 | 7.6 | 7.5 | |
| Mecklenburg-West Pomerania | 7 | 1.4 | 2.0 | |
| Lower Saxony | 50 | 9.9 | 9.8 | |
| North Rhine-Westphalia | 104 | 20.7 | 21.7 | |
| Rhineland-Palatinate | 32 | 6.4 | 5.0 | |
| Saarland | 8 | 1.6 | 1.2 | |
| Saxony | 38 | 7.6 | 5.1 | |
| Saxony-Anhalt | 14 | 2.8 | 2.9 | |
| Schleswig Holstein | 15 | 3.0 | 3.3 | |
| Thuringia | 14 | 2.8 | 2.8 | |
| Household size | 1 | 125 | 24.9 | 41.4 |
| 2 | 199 | 39.6 | 34.2 | |
| 3 | 97 | 19.3 | 12.1 | |
| 4 | 62 | 12.3 | 9.0 | |
| >4 | 20 | 4.0 | 3.2 | |
| Education | No graduation | 5 | 1.0 | 25.8 |
| Graduation (vocational training) | 204 | 40.6 | 48.5 | |
| University entrance qualification | 152 | 30.2 | 8.6 | |
| Bachelor | 35 | 7.0 | 1.5 | |
| Master/diploma | 87 | 17.3 | 13.7 | |
| Doctor’s degree | 4 | 0.8 | 1.1 | |
| Other qualifications | 16 | 3.2 | 0.8 | |
| Net household Income in € | Less than 1000 | 84 | 16.7 | 6.4 |
| 1000–1999 | 164 | 32.6 | 26.7 | |
| 2000–2999 | 134 | 26.6 | 30.7 | |
| >3000 | 121 | 24.1 | 36.3 |
Note. * Source: Census Data in the version of 31 December 2015 (Federal Statistical Office, 2015), except for residential area (United Nations Department of Economic and Social Affairs, n.d.).
Table 3.
Model Selection for Latent Class Segmentation.
| No. of Latent Classes | Log-Likelihood | AIC | CAIC | BIC | Average Max. Membership Probability |
|---|---|---|---|---|---|
| 2 | −7793.61 | 15,753.22 | 16,392.78 | 16,309.78 | 0.99 |
| 3 | −7296.52 | 14,843.04 | 15,806.23 | 15,681.23 | 0.97 |
| 4 | −7100.04 | 14,534.07 | 15,820.89 | 15,653.89 | 0.97 |
| 5 | −6954.64 | 14,327.29 | 15,937.74 | 15,728.74 | 0.97 |
Table 4.
Part-Worth Utilities for the Different Consumer Groups (Purchase, N = 503).
| Attribute | Levels | Group 1: Traditional Consumers (12.7%) | Group 2: Quality- Oriented Consumers (35.1%) | Group 3: Health- Conscious Consumers (28.0%) | Group 4: Price- Conscious Consumers (24.2%) |
|---|---|---|---|---|---|
| Bread type | Wheat bread | 0 | 0 | 0 | 0 |
| Mixed wheat bread | 146 | 225 | 46 | 49 | |
| Rye bread | 54 | 149 | 366 | 103 | |
| Mixed rye bread | 113 | 254 | 260 | 105 | |
| Multigrain bread | −3 | 101 | 392 | 97 | |
| Whole grain bread | −93 | −98 | 580 | 102 | |
| Protein bread | 28 | −161 | 386 | 27 | |
| Functional ingredients | None | 208 | 43 | −35 | −37 |
| Amaranth | 58 | −26 | 7 | −13 | |
| Chia | 77 | −23 | 18 | 34 | |
| Linseed | 53 | 47 | 5 | 20 | |
| Quinoa | 0 | 0 | 0 | 0 | |
| Calorific value per 100 g | 270 kcal | 43 | −19 | 4 | −2 |
| 250 kcal | 0 | 0 | 0 | 0 | |
| 230 kcal | 45 | −9 | 33 | −3 | |
| 210 kcal | 57 | −6 | 19 | −1 | |
| 190 kcal | 65 | −11 | 28 | 20 | |
| Protein content per 100 g | 30 g protein | −12 | 14 | −8 | 16 |
| 24 g protein | −27 | 36 | −30 | 16 | |
| 18 g protein | 42 | 11 | −50 | 13 | |
| 12 g protein | 0 | 0 | 0 | 0 | |
| 6 g protein | 17 | 4 | 3 | 10 | |
| Fat content per 100 g | 9 g fat | 52 | 17 | 18 | −11 |
| 7 g fat | 12 | 17 | −8 | −4 | |
| 5 g fat | 0 | 0 | 0 | 0 | |
| 3 g fat | −10 | −6 | 28 | −9 | |
| 1 g fat | 20 | 24 | −8 | −2 | |
| Carbohydrates per 100 g | 40 g carbohydrates | −10 | 50 | 16 | 31 |
| 35 g carbohydrates | 2 | 9 | 14 | 31 | |
| 30 g carbohydrates | −14 | −4 | 40 | 0 | |
| 25 g carbohydrates | 0 | 0 | 0 | 0 | |
| 20 g carbohydrates | 6 | 71 | −6 | 14 | |
| Dietary fiber per 100 g | 6.5 g dietary fiber | −1 | −2 | −17 | −14 |
| 5.5 g dietary fiber | 0 | 0 | 0 | 0 | |
| 4.5 g dietary fiber | −8 | 6 | −8 | −14 | |
| 3.5 g dietary fiber | −24 | 27 | 20 | −20 | |
| 2.5 g dietary fiber | −52 | −7 | −19 | −8 | |
| Production method | Organic | 2 | 66 | 33 | 23 |
| GMO-free | 14 | 61 | 24 | 20 | |
| Conventional | 0 | 0 | 0 | 0 | |
| Durability | 1 day | 0 | 0 | 0 | 0 |
| 1–3 days | 35 | 94 | 37 | 79 | |
| 3–5 days | 58 | 179 | 41 | 140 | |
| 5–7 days | 67 | 149 | 61 | 153 | |
| 7–9 days | 95 | 148 | 42 | 144 | |
| Price per 500 g | 2.19 € | 0 | 0 | 0 | 0 |
| 1.89 € | 54 | 54 | 32 | 276 | |
| 1.59 € | 89 | 43 | 48 | 385 | |
| 1.29 € | 151 | −19 | 65 | 468 | |
| 0.99 € | 161 | −13 | 20 | 546 | |
| Relative importance (%) | |||||
| Bread type | 23.89 | 41.54 | 58.05 | 10.55 | |
| Functional ingredients | 20.83 | 7.35 | 5.33 | 7.12 | |
| Calorific value per 100 g | 6.47 | 1.88 | 3.25 | 2.29 | |
| Protein content per 100 g | 6.86 | 3.58 | 5.28 | 1.56 | |
| Fat content per 100 g | 6.16 | 3.02 | 3.63 | 1.14 | |
| Carbohydrates per 100 g | 2.00 | 7.53 | 4.62 | 3.12 | |
| Dietary fiber per 100 g | 5.24 | 3.34 | 3.93 | 1.94 | |
| Production method | 2.99 | 6.59 | 3.36 | 2.33 | |
| Durability | 9.56 | 17.91 | 6.10 | 15.28 | |
| Price per 500 g | 16.01 | 7.27 | 6.46 | 54.67 | |
Table 5.
Frequency Distribution of Sociodemographic Attributes for Latent Class Segments (N = 503).
| Sociodemographic Attributes | Group Membership | ||||
|---|---|---|---|---|---|
| Traditional Consumers | Quality-Oriented Consumers | Health-Conscious Consumers | Price-Conscious Consumers | ||
| Gender | Male | 40 | 91 | 49 | 70 |
| Female | 24 | 82 | 93 | 54 | |
| Education | No graduation | 1 | 0 | 2 | 2 |
| Graduation (vocational training) | 29 | 82 | 49 | 44 | |
| General qualification for university entrance | 15 | 46 | 43 | 48 | |
| Bachelor | 3 | 13 | 10 | 9 | |
| Master/Diploma | 14 | 25 | 32 | 16 | |
| Doctor’s degree | 1 | 1 | 1 | 1 | |
| Other qualifications | 1 | 6 | 5 | 4 | |
| Net household income in € | Less than 1000 | 12 | 25 | 18 | 29 |
| 1000–1999 | 18 | 49 | 54 | 43 | |
| 2000–2999 | 19 | 57 | 32 | 26 | |
| >3000 | 15 | 42 | 38 | 26 | |
Table 6.
Results of the Factor Analysis (N = 503).
| Factors and the Corresponding Variables | Mean | SD | Factor Loading |
|---|---|---|---|
| Passion for cooking [28] (Cronbach’s alpha: 0.934) | |||
| I have a passion for cooking. | 3.20 | 1.261 | 0.843 |
| Cooking is my hobby. | 3.55 | 1.230 | 0.838 |
| Cooking brings me joy. | 3.48 | 1.152 | 0.831 |
| I invest a lot of time for cooking. | 3.24 | 1.151 | 0.756 |
| Cooking is a process of self-realization. | 3.17 | 1.168 | 0.722 |
| I am proud to prepare own meals and self-invested recipes. | 3.35 | 1.204 | 0.628 |
| Eating control behavior [29] (Cronbach’s alpha: 0.940) | |||
| I often try to regulate how much I eat. | 3.19 | 1.133 | 0.889 |
| I am constantly controlling how much I eat. | 2.95 | 1.214 | 0.883 |
| I am constantly monitoring how much I eat. | 2.84 | 1.237 | 0.860 |
| I often consciously eat less than I want. | 2.99 | 1.208 | 0.857 |
| I often try to control my portion sizes when eating. | 3.25 | 1.137 | 0.824 |
| I often try to control how much I eat. | 3.36 | 1.137 | 0.788 |
| Quality aspects [28] (Cronbach’s alpha: 0.876) | |||
| I like to buy foods that have hand-crafted production. | 3.72 | 0.943 | 0.755 |
| I prefer to buy food from my region. | 3.92 | 0.960 | 0.707 |
| I prefer to buy foods that were traditionally made. | 3.68 | 0.930 | 0.703 |
| I would like to pay more money for animal welfare approved meat and eggs. | 3.77 | 1.137 | 0.630 |
| For me the naturalness of the food is an important factor. | 3.84 | 0.937 | 0.629 |
| I prefer food with a trustworthy character (for example organic, Fairtrade, animal welfare) to foods without a label. | 3.53 | 1.084 | 0.626 |
| I prefer fresh products over canned products. | 4.17 | 0.911 | 0.559 |
| I am willing to pay a higher price for products of good quality. | 3.49 | 1.105 | 0.533 |
| Health consciousness [30] (Cronbach’s alpha: 0.897) | |||
| I’m usually aware of my health. | 3.79 | 0.789 | 0.830 |
| I’m alert to changes in my health. | 3.74 | 0.938 | 0.800 |
| I’m aware of the state of my health as I go through the day. | 3.80 | 0.848 | 0.796 |
| I’m generally attentive to my inner feelings about my health. | 3.62 | 0.963 | 0.656 |
| I’m constantly examining my health. | 3.29 | 1.073 | 0.655 |
| I’m very self-conscious about my health. | 3.35 | 0.971 | 0.586 |
| I reflect about my health a lot. | 3.57 | 0.994 | 0.503 |
| Novelty preferences [28] (Cronbach’s alpha: 0.815) | |||
| I love to try recipes from foreign countries. | 3.58 | 1.160 | 0.747 |
| I only buy and eat foods that are familiar to me. | 3.18 | 1.135 | 0.732 |
| I like to try new foods that I have never tasted before | 3.64 | 1.103 | 0.699 |
| I buy and like to eat exotic foods. | 3.27 | 1.158 | 0.649 |
| I like to try new recipes. | 3.78 | 1.099 | 0.591 |
| I look for various ways to prepare unusual meals. | 3.19 | 1.157 | 0.567 |
| Recipes and articles from magazines from other cooking traditions make me experiment in the kitchen. | 3.34 | 1.187 | 0.534 |
| Prestige of consuming superfoods [31] (Cronbach’s alpha: 0.868) | |||
| By consuming superfoods I am valued by others. | 2.05 | 1.104 | 0.754 |
| By consuming superfoods I satisfy the expectations of others. | 2.19 | 1.152 | 0.721 |
| By consuming superfoods I make a good impression. | 2.52 | 1.110 | 0.707 |
| Price consciousness [32] (Cronbach’s alpha: 0.279) | |||
| Price plays an important role in my choice of products. | 3.44 | 0.964 | 0.858 |
| Price is the deciding factor when I buy a product. | 3.17 | 1.007 | 0.844 |
| I usually strive for the lowest possible price. | 3.06 | 1.127 | 0.694 |
| When buying groceries, I actually do not pay much attention to price. | 3.37 | 1.097 | 0.586 |
| Eating in company [28] (Cronbach’s alpha: 0.821) | |||
| Dinning with friends is an important part of my social life | 2.99 | 1.253 | 0.738 |
| When I serve a dinner to friends, the most important thing is that we are together. | 3.83 | 1.096 | 0.662 |
| The food taste is much better when I eat in good company. | 3.71 | 1.148 | 0.660 |
| We often get together with friends to enjoy an easy-to-cook casual dinner | 2.53 | 1.190 | 0.620 |
| Going out for dinner is a regular part of our eating habits | 2.83 | 1.218 | 0.554 |
| Subjective knowledge and cooking skills [28] (Cronbach’s alpha: 0.873) | |||
| I do not need recipes because I know by experience what combination of ingredients resulting in a delicious dish. | 3.31 | 1.108 | 0.816 |
| I like to prepare dishes without a prescription and use my creativity. | 3.48 | 1.144 | 0.803 |
| I am flexible and can make a meal out of all possible ingredients that I have at home. | 3.67 | 1.127 | 0.744 |
| Attending culinary events [28] | |||
| I like to visit food fairs. | 2.37 | 1.243 | 0.618 |
| Pleasure and interest [28] (Cronbach’s alpha: 0.806) | |||
| When I eat, I enjoy food very much. | 4.19 | 0.784 | 0.709 |
| For me eating is a matter that incorporates all senses of feeling, smell, taste, and sight. | 4.12 | 0.825 | 0.679 |
| Good drinks and food play a major role in my life. | 4.09 | 0.878 | 0.672 |
| Financial aspects [32] (Cronbach’s alpha: 0.887) | |||
| From a financial perspective, it is often difficult for me to make ends meet. | 2.73 | 1.261 | 0.871 |
| My household budget is always tight. | 3.11 | 1.180 | 0.803 |
Note: Scale from 1 ‘strongly disagree’ to 5 ‘strongly agree’. N = 502.
Table 7.
Profiling the Latent Consumer Segments. Values Represent Mean Factor Scores (SD) of the Extracted Factors for Each Group (N = 503).
Table 7.
Profiling the Latent Consumer Segments. Values Represent Mean Factor Scores (SD) of the Extracted Factors for Each Group (N = 503).
| Factors | Sample Groups | |||
|---|---|---|---|---|
| Traditional Consumers (N = 64) | Quality-Oriented Consumers (N = 173) | Health-Conscious Consumers (N = 142) | Price-Conscious Consumers (N = 123) | |
| Passion for cooking | −0.631 (1.060) a | 0.063 (0.967) b | 0.133 (0.937) b | 0.087 (0.978) b |
| Eating control behavior | −0.160 (1.058) a | −0.191 (0.991) a | 0.271 (0.944) b | 0.040 (0.980) a,b |
| Quality aspects | −0.122 (1.195) a,b | 0.124 (0.959) b | 0.115 (0.851) b | −0.243 (1.064) a |
| Health consciousness | −0.235 (1.245) a | −0.045 (0.990) a,b | 0.174 (0.932) b | −0.016 (0.924) a,b |
| Novelty preferences | −0.500 (0.985) a | −0.045 (1.024) b | 0.170 (0.890) b | 0.127 (1.014) b |
| Prestige of consuming superfoods | −0.292 (0.845) a | 0.159 (1.059) b | 0.078 (1.030) b | −0.162 (0.904) a,b |
| Price consciousness | −0.185 (1.008) a | −0.192 (0.941) a | −0.074 (0.913) a | 0.452 (1.042) b |
| Eating in company | −0.262 (0.997) a | 0.053 (0.994) a | 0.010 (0.994) a | 0.050 (1.008) a |
| Subjective knowledge and cooking skills | 0.127 (1.040) a | 0.044 (1.081) a | −0.084 (0.872) a | −0.031 (1.000) a |
| Attending culinary events | −0.093 (0.893) a | 0.006 (1.045) a | −0.009 (0.976) a | 0.050 (1.023) a |
| Pleasure and interest | −0.146 (1.255) a | 0.035 (0.937) a | 0.048 (0.976) a | −0.030 (0.969) a |
| Financial aspects | −0.261 (1.015) a | −0.004 (0.976) a,b | 0.035 (0.953) a,b | 0.102 (1.065) b |
Note: Items were assessed by means of Likert scales (1 = totally disagree; 5 = totally agree). Superscripts stand for significant mean differences at the 0.05 level based on Scheffe’s post-doc and Tukey testing.
© 2018 by the authors. Licensee MDPI, Basel, Switzerland. This article is an open access article distributed under the terms and conditions of the Creative Commons Attribution (CC BY) license (http://creativecommons.org/licenses/by/4.0/).
Share and Cite
MDPI and ACS Style
Meyerding, S.G.H.; Kürzdörfer, A.; Gassler, B. Consumer Preferences for Superfood Ingredients—the Case of Bread in Germany. Sustainability 2018, 10, 4667. https://0-doi-org.brum.beds.ac.uk/10.3390/su10124667
AMA Style
Meyerding SGH, Kürzdörfer A, Gassler B. Consumer Preferences for Superfood Ingredients—the Case of Bread in Germany. Sustainability. 2018; 10(12):4667. https://0-doi-org.brum.beds.ac.uk/10.3390/su10124667
Chicago/Turabian StyleMeyerding, Stephan G.H., Annemone Kürzdörfer, and Birgit Gassler. 2018. "Consumer Preferences for Superfood Ingredients—the Case of Bread in Germany" Sustainability 10, no. 12: 4667. https://0-doi-org.brum.beds.ac.uk/10.3390/su10124667
Note that from the first issue of 2016, this journal uses article numbers instead of page numbers. See further details here.