The ALARP Principle in the Cost-Benefit Analysis for the Acceptability of Investment Risk
by
 , ,
, ,
Antonio Nesticò
1,* ,
,
Shuquan He
2 ,
,
Gianluigi De Mare
1,
Renato Benintendi
3 and
Gabriella Maselli
1 1
Department of Civil Engineering, University of Salerno, 84084 Fisciano, Salerno, Italy
2
School of Economics, Shanghai University, Shanghai 200444, China
3
Megaris Ltd., Reading RG2 9FL, UK
*
Author to whom correspondence should be addressed.
Sustainability 2018, 10(12), 4668; https://0-doi-org.brum.beds.ac.uk/10.3390/su10124668
Submission received: 30 October 2018
/
Revised: 29 November 2018
/
Accepted: 5 December 2018
/
Published: 7 December 2018
(This article belongs to the Special Issue Real Estate Economics, Management and Investments)
Abstract
:The process of allocating financial resources is extremely complex—both because the selection of investments depends on multiple, and interrelated, variables, and constraints that limit the eligibility domain of the solutions, and because the feasibility of projects is influenced by risk factors. In this sense, it is essential to develop economic evaluations on a probabilistic basis. Nevertheless, for the civil engineering sector, the literature emphasizes the centrality of risk management, in order to establish interventions for risk mitigation. On the other hand, few methodologies are available to systematically compare ante and post mitigation design risk, along with the verification of the economic convenience of these actions. The aim of the paper is to demonstrate how these limits can be at least partially overcome by integrating, in the traditional Cost-Benefit Analysis schemes, the As Low as Reasonably Practicable (ALARP) logic. According to it, the risk is tolerable only if it is impossible to reduce it further or if the costs to mitigate it are disproportionate to the benefits obtainable. The research outlines the phases of an innovative protocol for managing investment risks. On the basis of a case study dealing with a project for the recovery and transformation of an ancient medieval village into a widespread-hotel, the novelty of the model consists of the characterization of acceptability and tolerability thresholds of the investment risk, as well as its ability to guarantee the triangular balance between risks, costs and benefits deriving from mitigation options.
1. Introduction
For over 30 years, Risk Assessment and Management has been a stand-alone scientific discipline, and several attempts have been made to establish widely accepted definitions of key terms and concepts related to the field of risk [1,2,3,4,5,6,7,8,9,10,11,12,13]. In this respect, it is important to clarify the concept of risk first. The Society for Risk Analysis (SRA) gives both qualitative definitions of risk and risk metrics [14,15].
In terms of purely qualitative definitions, risk is defined as the possibility of an unfortunate event; the potential occurrence of negative consequences arising from an incident; the set of consequences deriving from an activity and associated uncertainties or, moreover, the deviation from a reference value and the corresponding uncertainty measures.
With regard to risk metrics, the risk R can be defined as a combination of the probability of an occurring event and the severity of the consequences arising from it.
where si indicates the i-th scenario, pi is the probability that the i-th scenario takes place and ci expresses the consequence of the i-th scenario, with i = 1, 2, 3, ..., N.
R = f (si, pi, ci),
The following mathematical relationship is also valid:
being C’ consequences of the event, Q the likelihood of C’ (typically probability) where Q is expressed in probabilistic terms, and K the cognitive background connected to C’ and to Q.
R = f (C’, Q, K),
The risk can also be measured according to the expected consequences, i.e., in terms of losses and/or damage, for example:
- Number of expected fatalities in a specific time interval (Potential Loss of Life (PPL), that is the expected number of fatalities in a period of one year; or Fatal Accidental Rate, (FAR) which represents the expected number of fatalities per 100 million hours of exposure);
- Product of the probability P that the risky event occurs, by the probability of exposure to the risk and expected damage D
- Expected disutility.
Finally, a further possibility is to express the risk R as a probability distribution related to the damage.
This last definition was shared by different Authors, according to which there is a risk when the occurrence of an event can be measured on a probabilistic basis; on the contrary, there is uncertainty when there are no significant data on the frequency of the phenomenon investigated [16,17,18].
Knight F.H. focusing on the measurability of uncertainties, distinguishes between measurable uncertainties, properly defined risks, and unmeasurable uncertainties, which represent the true uncertainties: «It will appear that a measurable uncertainty, or “risk” proper, as we shall use the term, is so far different from an unmeasurable one that it is not in effect an uncertainty at all. We shall accordingly restrict the term “uncertainty” to cases of the non-quantitative type. It is this “true” uncertainty, and not risk, as has been argued, which forms the basis of a valid theory of profit and accounts for the divergence between actual and theoretical competition» [19]. According to this interpretation, the consequences arising from risky events can have both negative and positive characters, thus configuring possible losses, but also opportunities that result in a higher value [20].
Those described are widely shared concepts in fields of application that are also very different: From finance to security engineering, from health to transport sector, as well as in the supply chain management [21]. Nonetheless, the risk assessment and management process are essential to express judgments of economic convenience on investment initiatives. This is especially true for civil engineering projects, where the risk components are not only of an economic nature, but also of an environmental, social and cultural character [22].
Based on this premise, the aim of the paper is to define a risk management protocol in the economic evaluation of investments in the civil field. Specifically, the novelty of the model is related to the acceptability of the project risk, both as to the initiative as proposed by the investor, and to the project possibly modified providing for it mitigation actions to reduce the risk. Basically, it is important to measure the residual risk of the investment after having identified the mitigation interventions, through criteria that are methodologically robust and easily repeatable.
How to pursue the objectives of the study? Using the As Low as Reasonably Practicable (ALARP) logic in the Cost-Benefit Analysis (CBA) schemes.
Risk analysis that is the Cost-Benefit Analysis carried out in probabilistic terms, assigns a probability distribution to each of the critical variables of the project, defined in a precise range of values around the best estimate, used as the base case. From these basic assumptions, it therefore estimates the probability distribution of the Internal Return Rate (IRR) or net present value (NPV) of the investment. Thus, on the one hand, from this type of analysis it is possible to read the risk of investment failure. On the other hand, the literature does not provide any objective criteria for determining whether the investment risk calculated in this way is acceptable. The idea is to define two different thresholds: That of acceptability and that of tolerability of investment risk. The former represents the probability of failure that the investor is willing to broadly accept; the latter defines the probability of bankruptcy that the investor considers tolerable because the costs to increase the probability of success are excessive compared to the benefits obtainable. As described in Section 3, these thresholds are widely used to assess the acceptability and tolerability of the risk of potential loss of human life in the nuclear, energy and oil and gas sectors [23,24,25,26]. The novelty of the research is therefore that of transferring the concept of the acceptability of investment risk to evaluate the financial profitability of civil engineering projects.
The paper is structured as follows. The first part describes the steps necessary for managing the risk associated with a project initiative (Section 2) and analyses the ALARP logic (Section 3). In the second part, contained in Section 4, a protocol to manage the investment risk is defined, highlighting how the ALARP principle can be integrated into the logical schema of Cost-Benefit Analysis (CBA). By introducing the thresholds of acceptability and tolerability of the risk of bankruptcy. In other words, the literature has so far only suggested identifying the risk components of the project and studying the probability distribution of the economic performance indicator. Instead, with the present work we want to define if the risk of failure, before and after possible mitigation interventions, is acceptable or at least tolerable for the investor. Hence the definition of the two thresholds must be established both according to the specific investment sector and according to the geographical and socio-economic context in which the project falls. In the third part, Section 5, the protocol is validated via a case study. It’s about a project of an ancient village in the province of Salerno (Italy) with the purpose to increase the touristic attraction. The application to the case study shows how the model makes it possible to express a judgment on the economic suitability of a project in probabilistic terms, taking into account the acceptability and tolerability of the risk of the decision makers. In the final part (Section 6), the results obtained are analyzed and scenarios for future research are presented also in light of the relevant political implications. In particular, the construction of a dataset in order to define specific thresholds of acceptability and tolerability of risk on a statistical basis can represent the next step of the research.
2. Risk Management Process in the Economic Evaluation of Projects
The logical-operative process of risk management is divided into successive and strictly interdependent phases [27,28,29,30,31,32,33], consisting of:
- Definition of the objectives of the risk management activity
- Identification of risks, which may influence the objectives already established in phase 1
- Risk analysis in order to study the causes and consequences deriving from the risky events
- Risk assessment, an activity necessary to define the actions aimed at managing the risk
- Risk mitigation, through specific mitigation strategies
- Assessment of the residual risk, i.e., the risk that remains despite the planned mitigation strategy.
The described process, which has already been mentioned above, is applied in very different fields, and is of paramount importance when it is necessary to evaluate the economic performance of civil engineering projects [34,35]. The rationale for this is that civil projects are characterized by profiles of complexity that arise from the multiple interrelations with the lived city, being of a nature that is not merely technical, but economic in a broad sense, thus covering the rates of financial, social, cultural and environmental risks that need to be assessed in order to conduct correct economic evaluations [36,37,38,39,40,41,42]. For this reason, it is critical to evaluate the project risk that, as S. Savvides (1994) states, «depends, on the one hand, on our ability to identify and understand the nature of uncertainty surrounding the key project variables and on the other, on having the tools and methodology to process its risk implications on the return of the project» [43]. In this sense, risk analysis or probabilistic simulation in the economic evaluation of projects is a methodology whereby the uncertainty encompassing the main variables projected in a forecasting model is processed in order to estimate the impact of risk on the expected results [43,44,45,46,47,48]
It should be noted that for major projects in civil works, the Guide to Cost-Benefit Analysis of Investment Projects 2014–2020 (European Commission, EC) requires the assessment of investment risks as a necessary condition for funding [49].
However, the European Commission, although provides precise indications for the analysis and for the risk assessment; however, does not provide any useful criteria to decide on its tolerability. On the contrary, the definition of threshold limits of risk acceptability is systematically provided in other areas, such as health and safety. In these areas, the risk-reduction principle is the ALARP (As Low as Reasonably Practicable), according to which a specific reduction measure must be implemented until costs are too disproportionate compared to the benefits that can be obtained. The concrete possibility of applying ALARP principle also for the risk analysis of civil engineering projects, therefore in sectors different from those where it is commonly adopted, is the subject of discussion in the following sections.
3. ALARP Logic in the Decision-Making
According to the ALARP principle, the risks in decision-making regarding safety and health must be reduced to levels as low as reasonably practicable, after which a further reduction in risk would be excessively expensive [50,51,52,53,54]. This principle, already explained in the Health and Safety Executive (HSE) regulations [47,48,49,50], can have applications of extreme importance in all cases where the primary objective is the triangular balancing between risks, costs to reduce them and potential benefits that can be achieved.
Figure 1 shows two different representations of the ALARP principle. The simplest one is shown in Figure 1a, where the risk increases along the vertical axis. Figure 1b, on the other hand, represents the “carrot” model defined by the HSE, which illustrates the obvious criterion according to which, the greater the residual risk, the greater the mitigation costs to make it tolerable [55,56,57,58]. In both cases, two horizontal lines delimit three risk regions: The bottom line represents the “broadly acceptable” threshold, up to which the risk does not need to be reduced; the upper one defines the “limit of tolerability” threshold that separates the risk tolerability zone from the unacceptability zone. Therefore, unlike the simpler model, shown in Figure 1a, the carrot representation considers the magnitude of the risk that can be read horizontally: In fact, as the magnitude increases, the costs necessary to bring the risk at least to the threshold of tolerability increase.
The ALARP principle implicitly recognizes that the “zero” risk is not a feasible option, so much so that within the “safety risk” the “broadly acceptable” threshold is often considered as a “safe level”. Similarly, the “limit of tolerability” threshold is not a catastrophe, but represents the beginning of an “unsafe” area.
Note how the absence of specific numerical values for the thresholds suggests the need to calibrate the model. For example, HSE recommends a “broadly acceptable” threshold of 10−6 deaths per year (one in a million) and a “tolerability limit” between 10−3 and 10−4 victims per year.
It should be noted that within ALARP the disproportion between costs and benefits obtained results in the estimate of the Implied Cost of Averting one Fatality (ICAF). This indicator, which represents the cost of an investment, is the ratio of the cost of the investment made and the expected decrease in the number of deaths because of the mitigation action:
Comparing the estimated ICAF for the proposed option with reference ICAF values, specific according to the sector in question, it is verified whether there is a disproportionate between the costs for risk mitigation and the advantages obtained. The risk is tolerable if it falls in the ALARP area, as additional costs to bring the risk to the acceptability threshold would be excessive [59,60,61].
Although mainly used in “safety risk”, it emerges that ALARP logic defines a general way of thinking, as well as a framework able to facilitate “risk communication” [61]. In this sense, it is believed that the ALARP principle integrated with traditional evaluation techniques, may allow the definition of an innovative approach to risk management that characterizes civil engineering projects, as explained in the following section.
4. CBA and ALARP Logic: A Protocol for the Economic Evaluation of Projects
If correctly used in the Cost-Benefit Analysis, the ALARP logic can be useful for the decision-making process, since it allows considering the qualitative and holistic components of the project within the CBA quantitative evaluation model [26]. In this way, by setting thresholds of acceptability and tolerability of risk in the implementation of CBA, a protocol can be characterized for the acceptance of residual risk in the economic evaluation of investment projects in the civil field. This protocol is explicit in the following logical-operational phases:
- Definition of the objectives of the risk management process. It is necessary to prevent the intervention failure and therefore to establish actions able to produce positive values of the economic performance indicators;
- Identification of the risk components of the project. This translates into the search for the sensitive variables of the system, i.e., those that are able to have a greater influence on the economic advantage of the investment;
- Risk analysis, which is explicit in
- Estimate of the probability distribution of risky variables (input);
- Generation of the cumulative frequency distribution of the performance indicator, in order to understand the effects of the project in stochastic terms (output);
- Risk assessment, by comparing the risk of project failure, which can be read from the cumulative frequency distribution of the output (for example the NPV or the IRR) estimated in step 3, and the broadly acceptable (Ta) and tolerability (Tt) thresholds as determined by the ALARP logic. Therefore, if the risk of failure Rf1 falls
- In the area below the acceptability threshold, then the intervention is possible;
- In the area above the tolerability threshold, then the risk is to be considered too high and therefore the investment should be avoided;
- In the central region, between the acceptability and the tolerability threshold, then the risk falls within the ALARP zone, i.e., it is tolerable provided that the costs of any further mitigation options are disproportionate to the achievable benefits;
- Definition of risk mitigation measures and estimates the new values of the economic performance indicators;
- Assessment of residual risk, to express an opinion on the acceptability of the risk that remains despite the mitigation measures undertaken. Taking into account the risk mitigation costs Cm, the risk of failure Rf2 following the mitigation intervention, then if
- Rf2 > Tt, then the risk Rf2 is still intolerable. This means that despite the hypothesized mitigation options, the risk of bankruptcy is still intolerable for the investor. Therefore, it is necessary to identify project changes, related to both the design phase and the investment management phase;
- Ta < Rf2 < Tt, then the risk Rf2 is tolerable as it is ALARP. This means that further interventions would entail excessive costs in relation to the induced mitigation effects;
- Rf2 < Ta, then the risk Rf2 is broadly acceptable to the investor for whom there is no need to plan further risk mitigation measures.
Table 1 shows, in detail, and also through illustrative representations, the various phases of the economic model of analysis. The protocol is tested on a case study as follows section.
5. The Case Study: Rehabilitation Project for an Ancient Village in Cilento, Italy
The protocol for the analysis and assessment of the risk summarized in Table 1 is applied to the recovery and transformation into a “country-hotel” of an ancient medieval village in the Province of Salerno (Italy). Located on the border between Campania and Basilicata, the village was abandoned after the earthquake of 1980 and the population moved to a new urban center. The project of redeveloping the country has as objectives both the conservation of its historical-architectural values and the revival of the economy through tourism activities.
The intervention in question has been chosen as representative of those interventions for the recovery and revitalization of the ancient abandoned villages. However, the definition of sensitive variables and risk mitigation interventions are strictly related to the specifics of the case study. In addition, the determination of the value to be attributed to the limits of acceptability and tolerability is a function of the specific sector of intervention and of the socio-economic characteristics of the area in which the project is located.
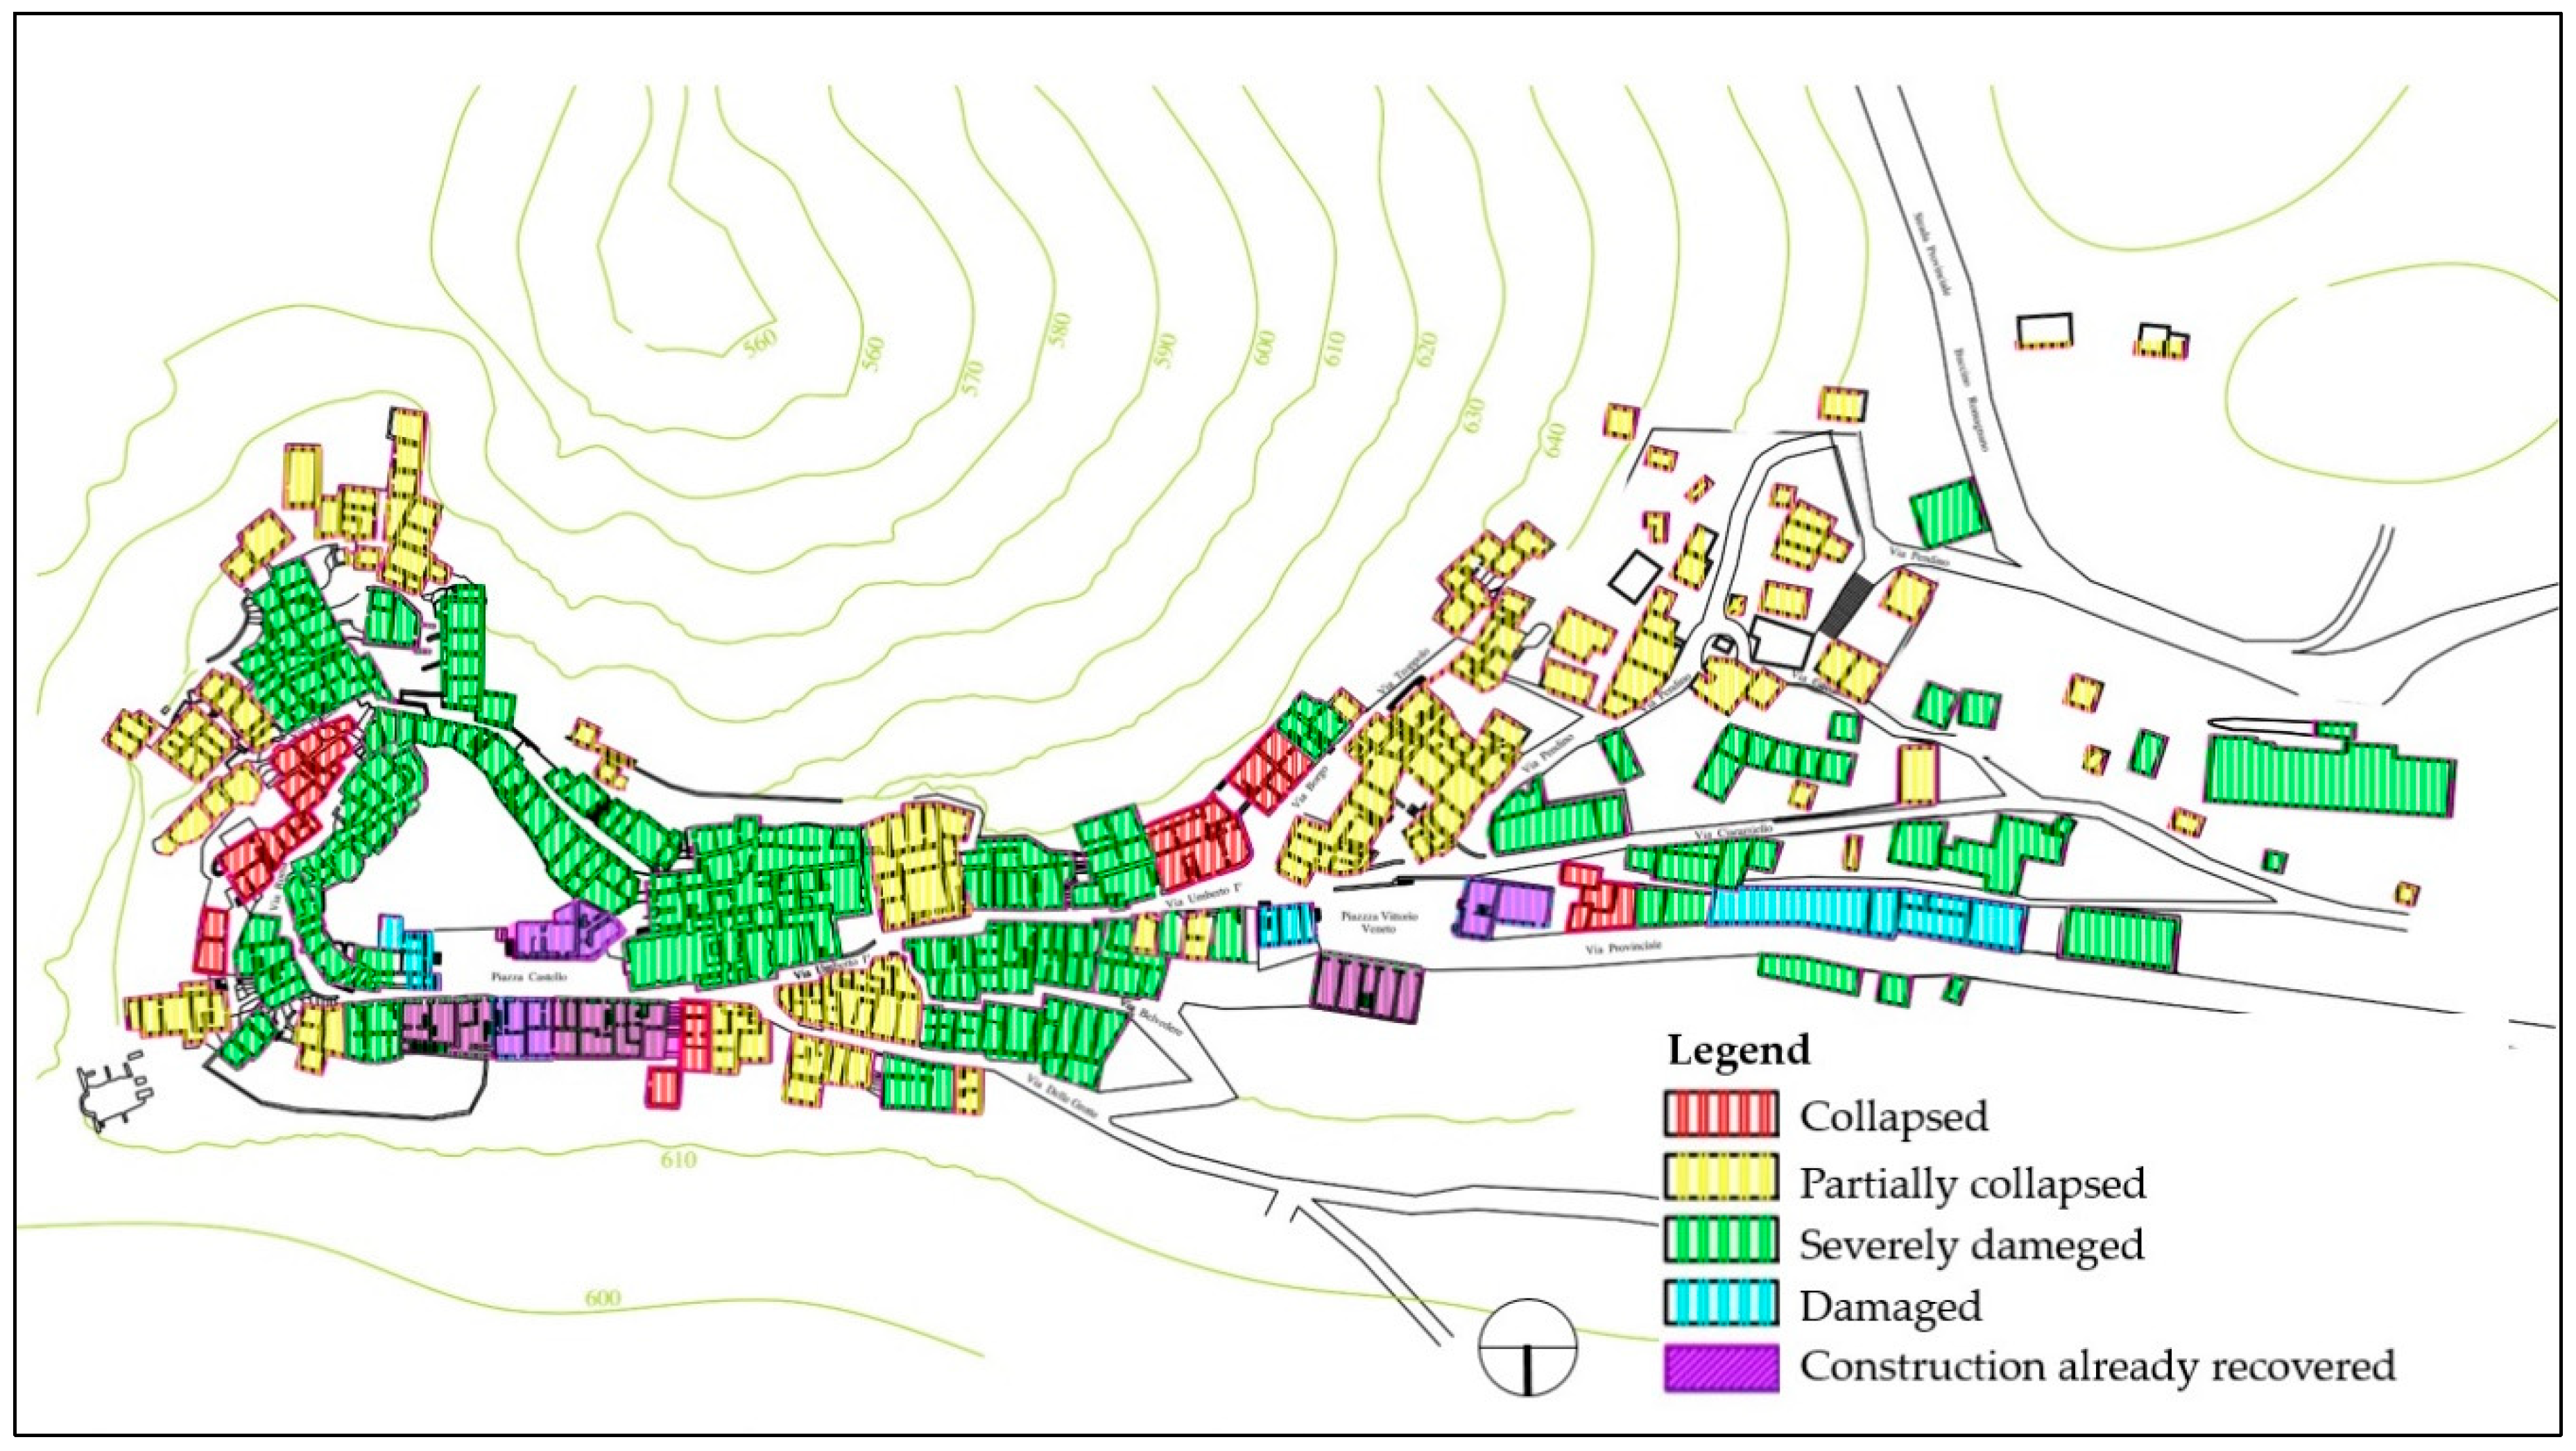
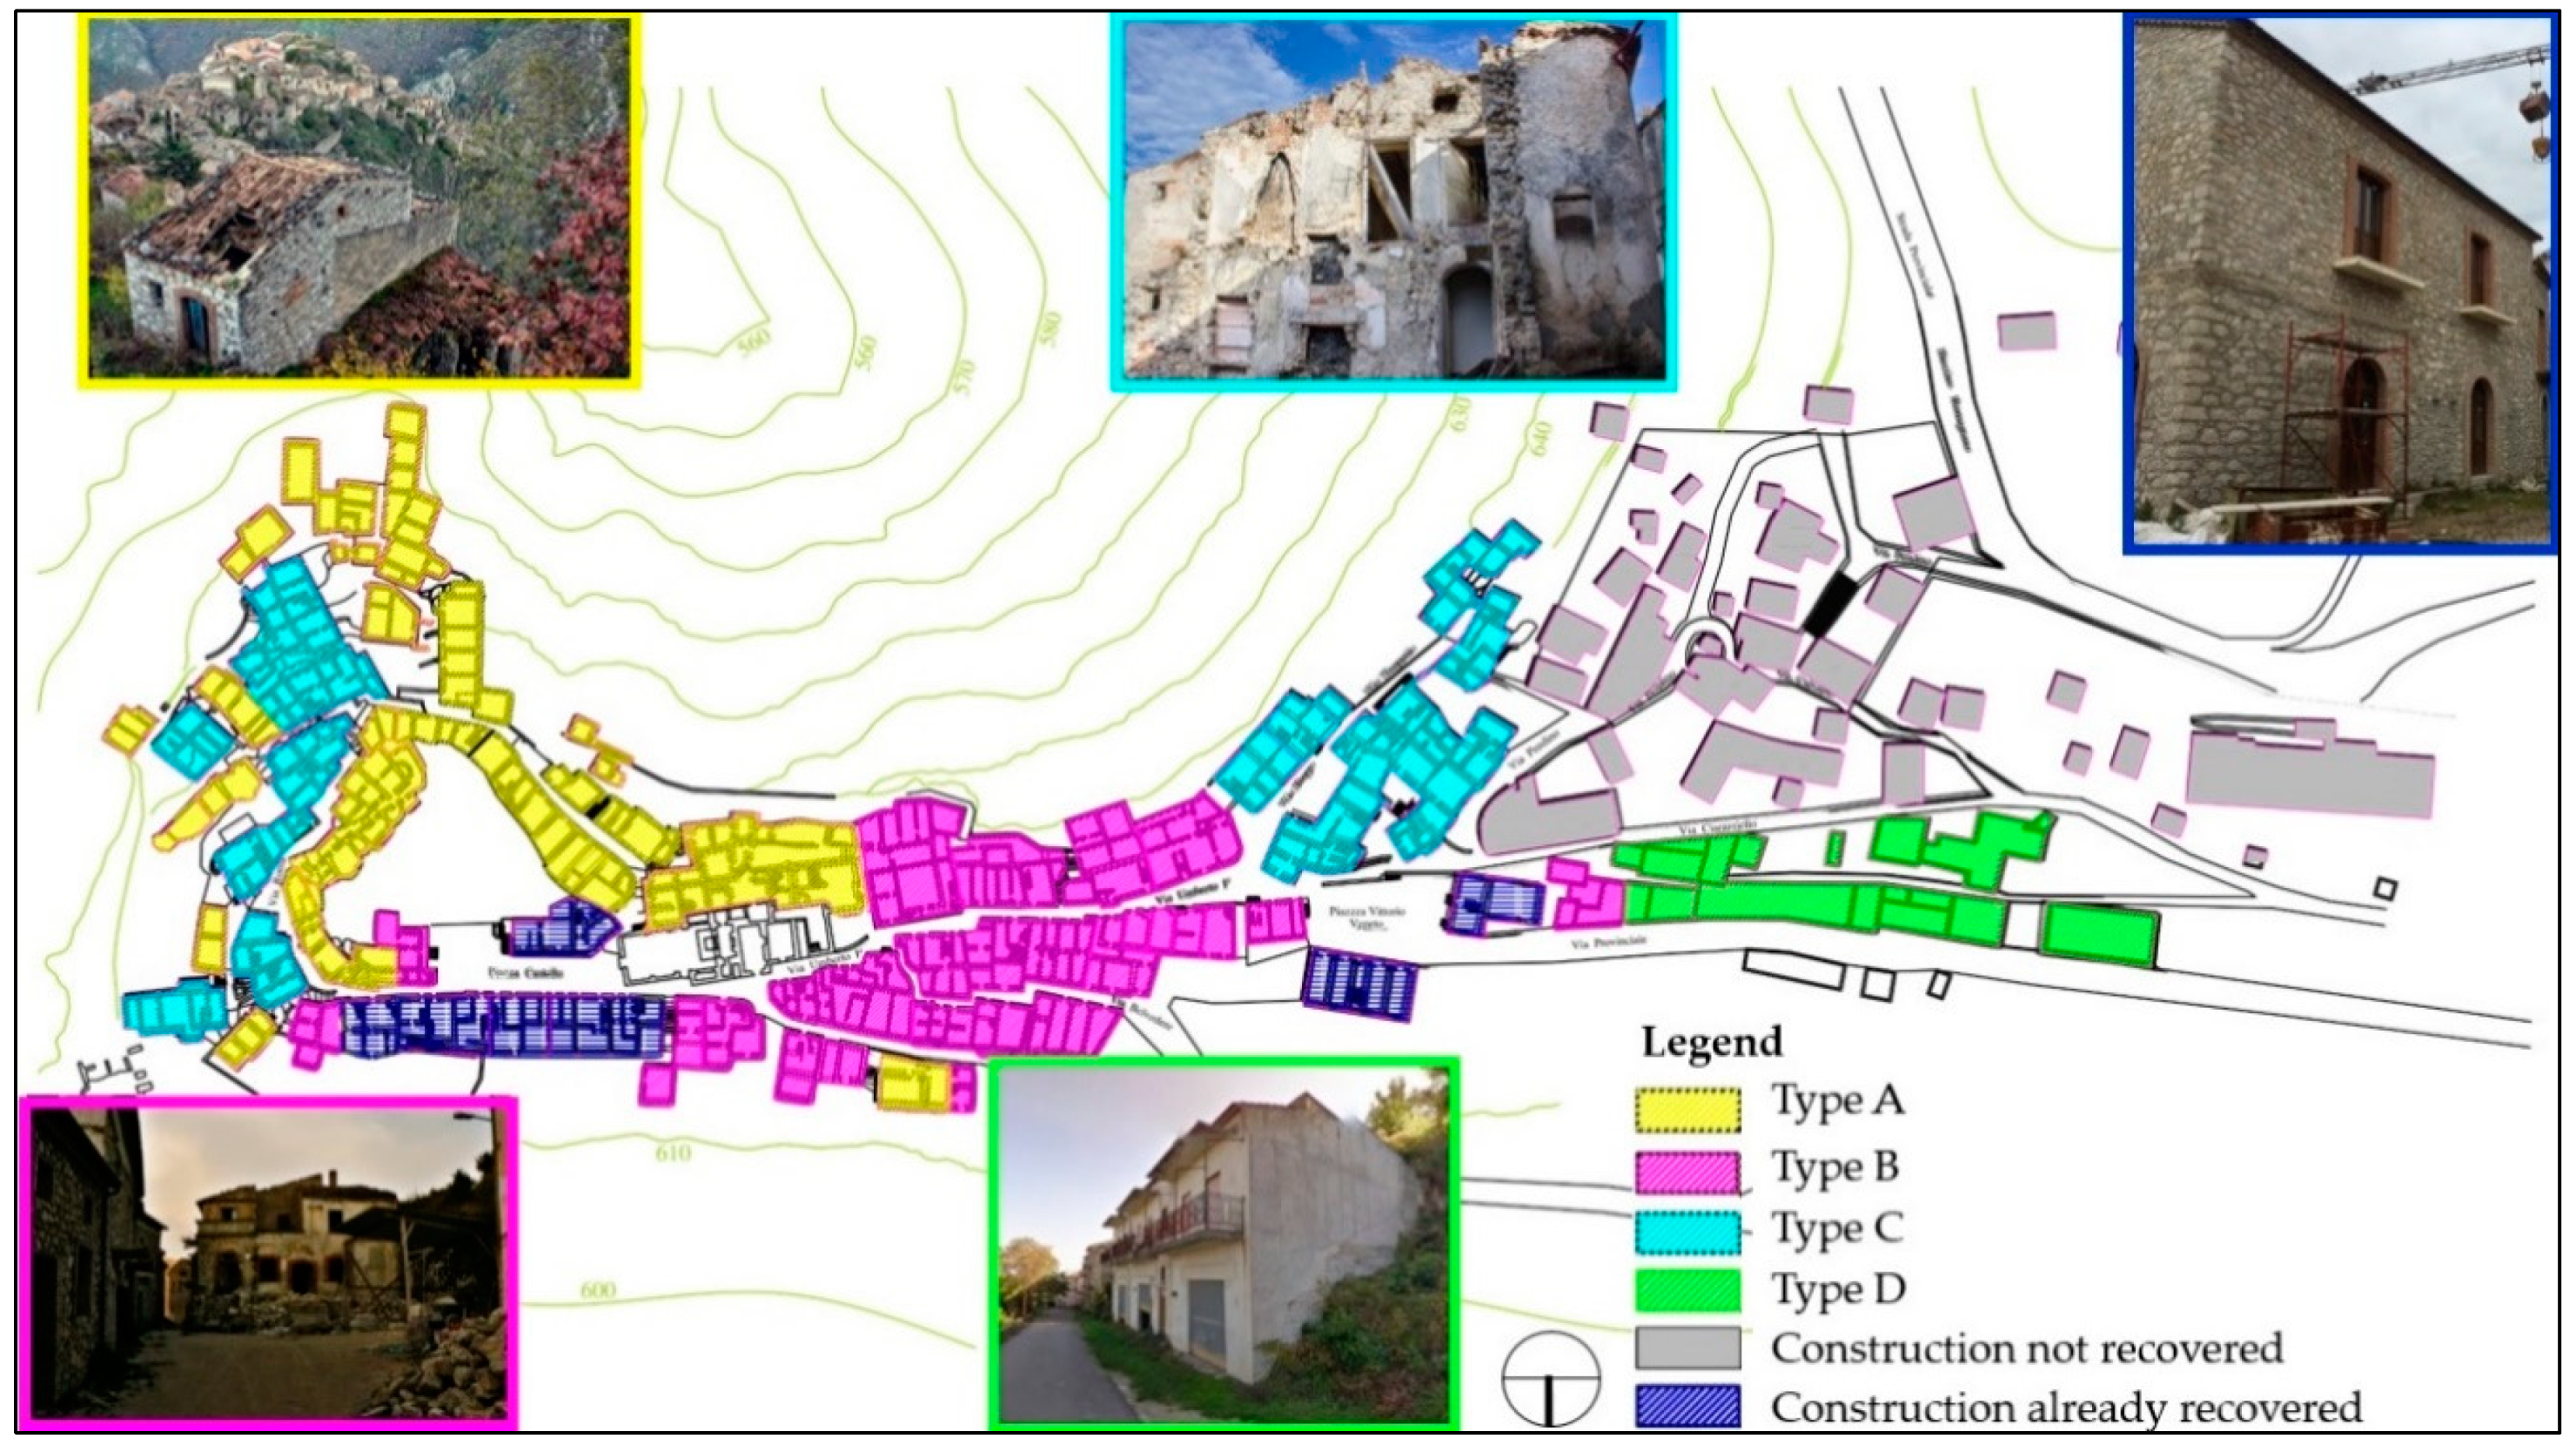
The analysis of the state of affairs shows that the building stock of the village is strongly degraded, with many residential units in a condition of ruin, as shown in Figure 2. The conservation degree and the typological characteristics of the buildings are detailed in Table 2 and Table 3 respectively. The building capital is classified according to four different levels of degradation, as also derives from Figure 3.
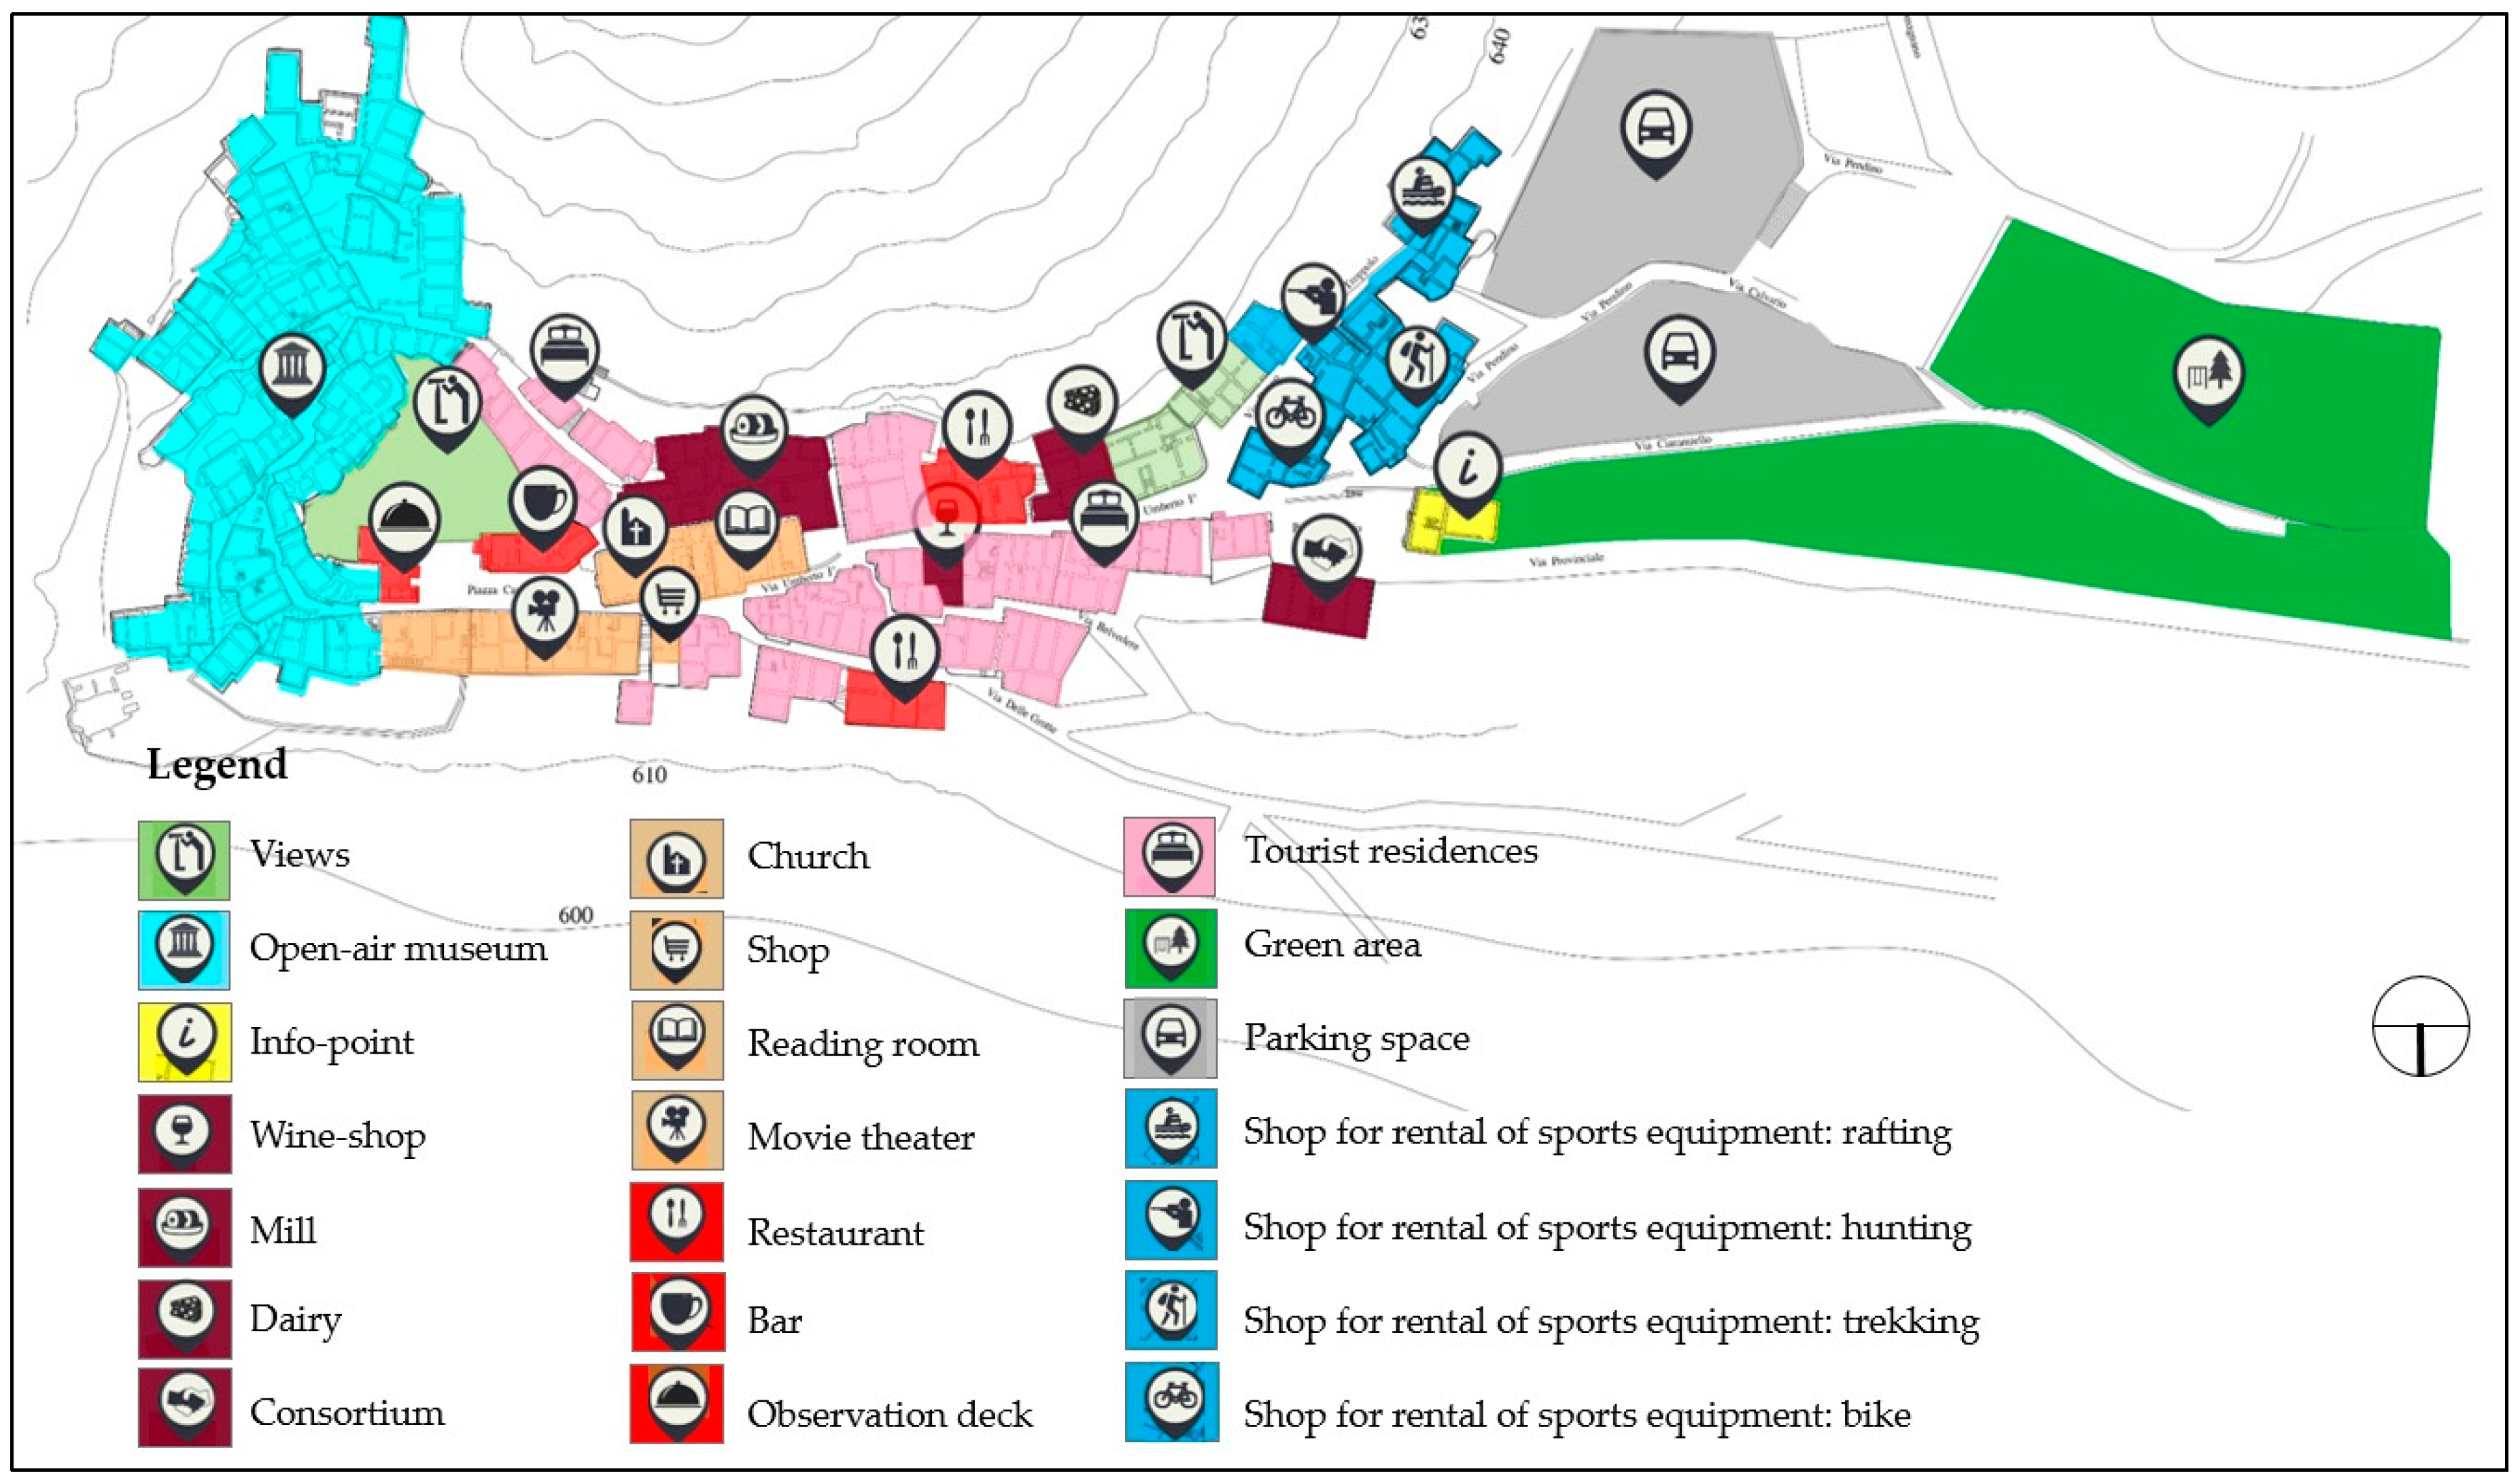
The investment project includes, in addition to the preliminary making safe of the entire area of the village, the construction of accommodation for tourists and works necessary to provide additional functions to that of widespread hospitality. The individual recovery actions provide for:
- Tourist residences for a total offer of 144 beds;
- An info-point and a consortium for the promotion of typical products;
- Three restaurants and a bar with an observation deck;
- Green area;
- Parking space;
- Spaces for the processing and marketing of typical local crafts (a mill, a dairy and a wine shop);
- A movie theatre, to be located in a building that has already been restored;
- A reading room;
- Shops and premises for the rental of equipment necessary to carry out sports and recreational activities on site.
Figure 4 shows the planimetric distribution of the single functional destinations. The area in celestial color constitutes a portion of the village that is preserved in the original conditions, with the aim of recreating a historical promenade in a real “open-air museum”.
The financial feasibility study of the synthetically described project is conducted. Following the six phases of the protocol summarized in Table 1, the analysis and evaluation of the investment risk are carried out.
5.1. Definition of the Objectives of the Risk Management Process
The preparation of the financial plan and the consequent estimate of the economic performance indicators are operations necessary to verify the achievement of the goal of the risk management process, that is to assess the effective financial feasibility of the investment. For the case study, Table 4 shows the main assumptions made based on the financial analysis and the values of the main parameters.
The analysis is therefore developed over a period of 25 years, a term deemed sufficient to assess the effects of the investment taking into account both the degree of stability of the scenarios (i.e., likelihood of the forecasts), and the importance of cash flows on the profitability of the project and the degree of risk inherent in the type of project.
Due to the nature of the intervention, the work is scheduled to be completed over two years (construction phase), with expenditure amounts for each year equal to about 50% of the total investment cost.
The valuation is carried out at constant prices, i.e., for any estimate the same prices are applied for the entire analysis period, specifically those for the evaluation reference year (2018).
Ordinary and extraordinary maintenance rates are introduced in the operating costs to ensure constant efficiency and capital value of the project’s works and plants, so that at the end of the analysis period a residual value of the works is not different from the investment cost.
As a discount rate for the cash flows discounting, the value of 4% is adopted according to the indications of the European Commission for the 2014–2020 programming period.
With regard to management, it is assumed that the widespread-hotel is entrusted to a company that manages exclusively the accommodation and that grants third parties the additional services provided.
To be able to produce the calculations related to the financial plan it is necessary to estimate:
- Costs of the project;
- Revenue of the project.
As regards costs, they are related to the implementation of the intervention and those for the management of the works to be carried out, namely investment costs and operating costs.
With specific reference to the project in question, investment costs include both those for the renovation of the village and those necessary for the inclusion of ancillary functions.
Operating costs include the management of functions, ordinary and extraordinary maintenance and financial amortization. In fact, it is expected to take a mortgage with a French amortization plan to cover 60% of investment costs. The annual interest rate is set at 6% and the duration of the plan is ten years. Table 5 summarizes the amounts relating to the individual cost items. In order to evaluate the investment costs, estimates have been drawn up on the basis of the prices provided by the Campania Region 2017 price List and the current price List for the conservation and restoration of the cultural and landscape works and heritage of Campania. Management costs, on the other hand, have been estimated by analyzing similar country-hotel financial statements for both the socio-economic properties of the place in which they are located and for technical-functional characteristics.
The project’s revenue is due to the re-entries deriving from the offer of tourist residences based on an average annual housing filling index (Ihf), estimated at just over 60%. In particular, the tourist flows in the village were analyzed on a seasonal basis. From this study it was possible to estimate the number of hotel guests, the number of lodgings occupied during the year and, therefore, the value of the index Ihf as the annual average of the housing filling.
The annual revenue, for 144 beds divided into 47 rooms of different capacities, is just over one million euro. For the remaining assets, on the other hand, profits deriving from lease rentals are considered, estimated at around € 200,000/year based on market surveys. Specifically, as for the operating costs, revenues were also estimated by analyzing financial statements of country-hotel with similar characteristics assumed as benchmarks.
Table 6 summarizes the results.
The financial plan of the investment is defined starting from the costs and profits respectively to be incurred and to be achieved during the evaluation period. From the plan so defined, it is possible to estimate the economic performance indicators:
- The Net Present Value (NPV) which represents the sum of the discounted Cash Flowswhere Bt and Ct are the benefits and costs generated by the project over time and r is the discount rate. If the NPV is sufficiently large, then the project is economically viable
- The Internal Rate of Return (IRR) understood as that value of the discount rate that cancels the NPV. If the IRR is greater than the discount rate used in discounting, then the project is economically viable.
Table 7 summarizes the values of the NPV and the IRR related to the project. The estimate is greater than zero, and the Internal Rate of Return is higher than the discount rate used, assumed equal to 4%.
5.2. Identification of the Risk Components of the Project
The risk variables of the project are identified through a sensitivity analysis, using which percentage changes to the values of the parameters from time to time taken into consideration are introduced in order to research the variables that most affect the investment performance.
The “critical” variables are the variable for which a variation of ± 1% of the value assumed in the base case gives rise to a variation of more than ± 1% of the value of the NPV. The elaborations allow for the identification of sensitive variables:
- The cost for the structural recovery of the village C1;
- The housing filling index Ihf.
Table 8 summarizes the terms of sensitivity analysis for critical variables.
5.3. Risk Analysis
The sensitivity analysis evaluates the effects on the NPV of the change in the value of a single uncertain variable at a time. However, to assess the real risk of failure associated with the investment, changes in the values of economic performance indicators deriving from the simultaneous change of several project variables must be identified. This can be done through quantitative risk analysis, which consists of:
- Estimate of the probability distribution associated with each of the identified critical variables;
- Random generation of the probability distribution of the economic performance indicator. In fact, from the cumulative probability distribution of the indicator it is possible to evaluate the project risk, verifying whether the cumulative probability for a given value of VAN or TIR is higher or lower than a reference value considered critical.
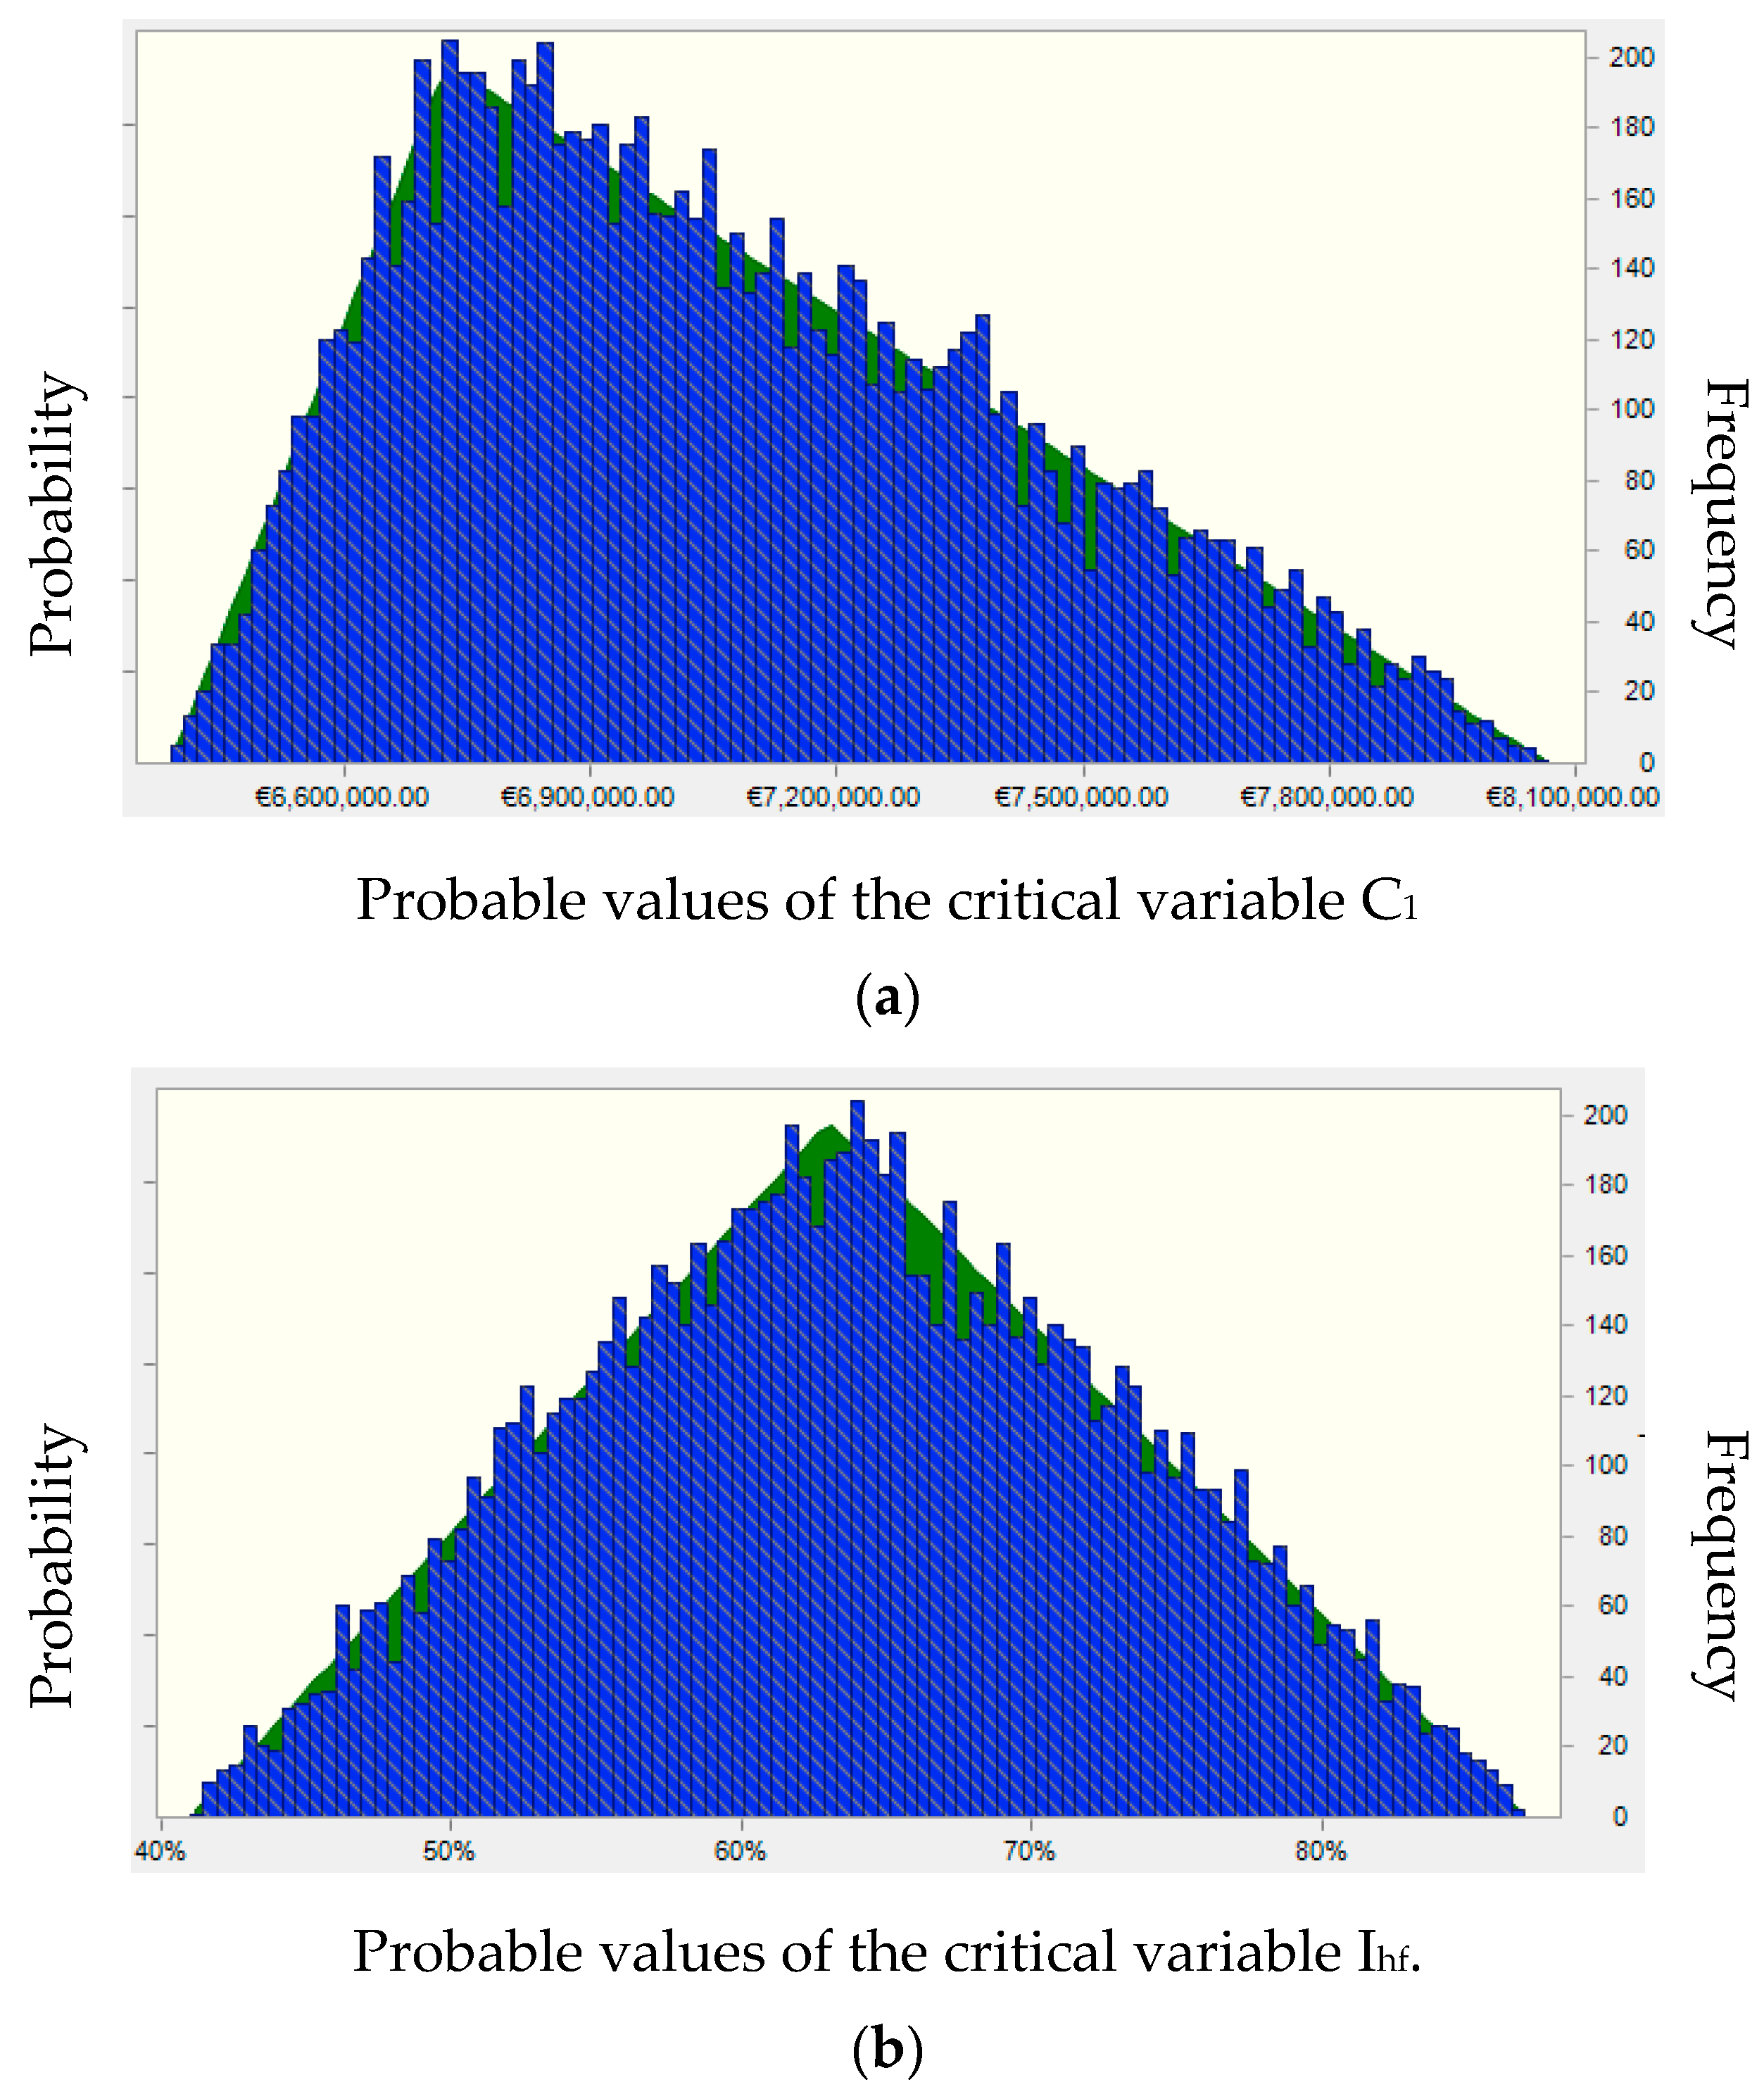
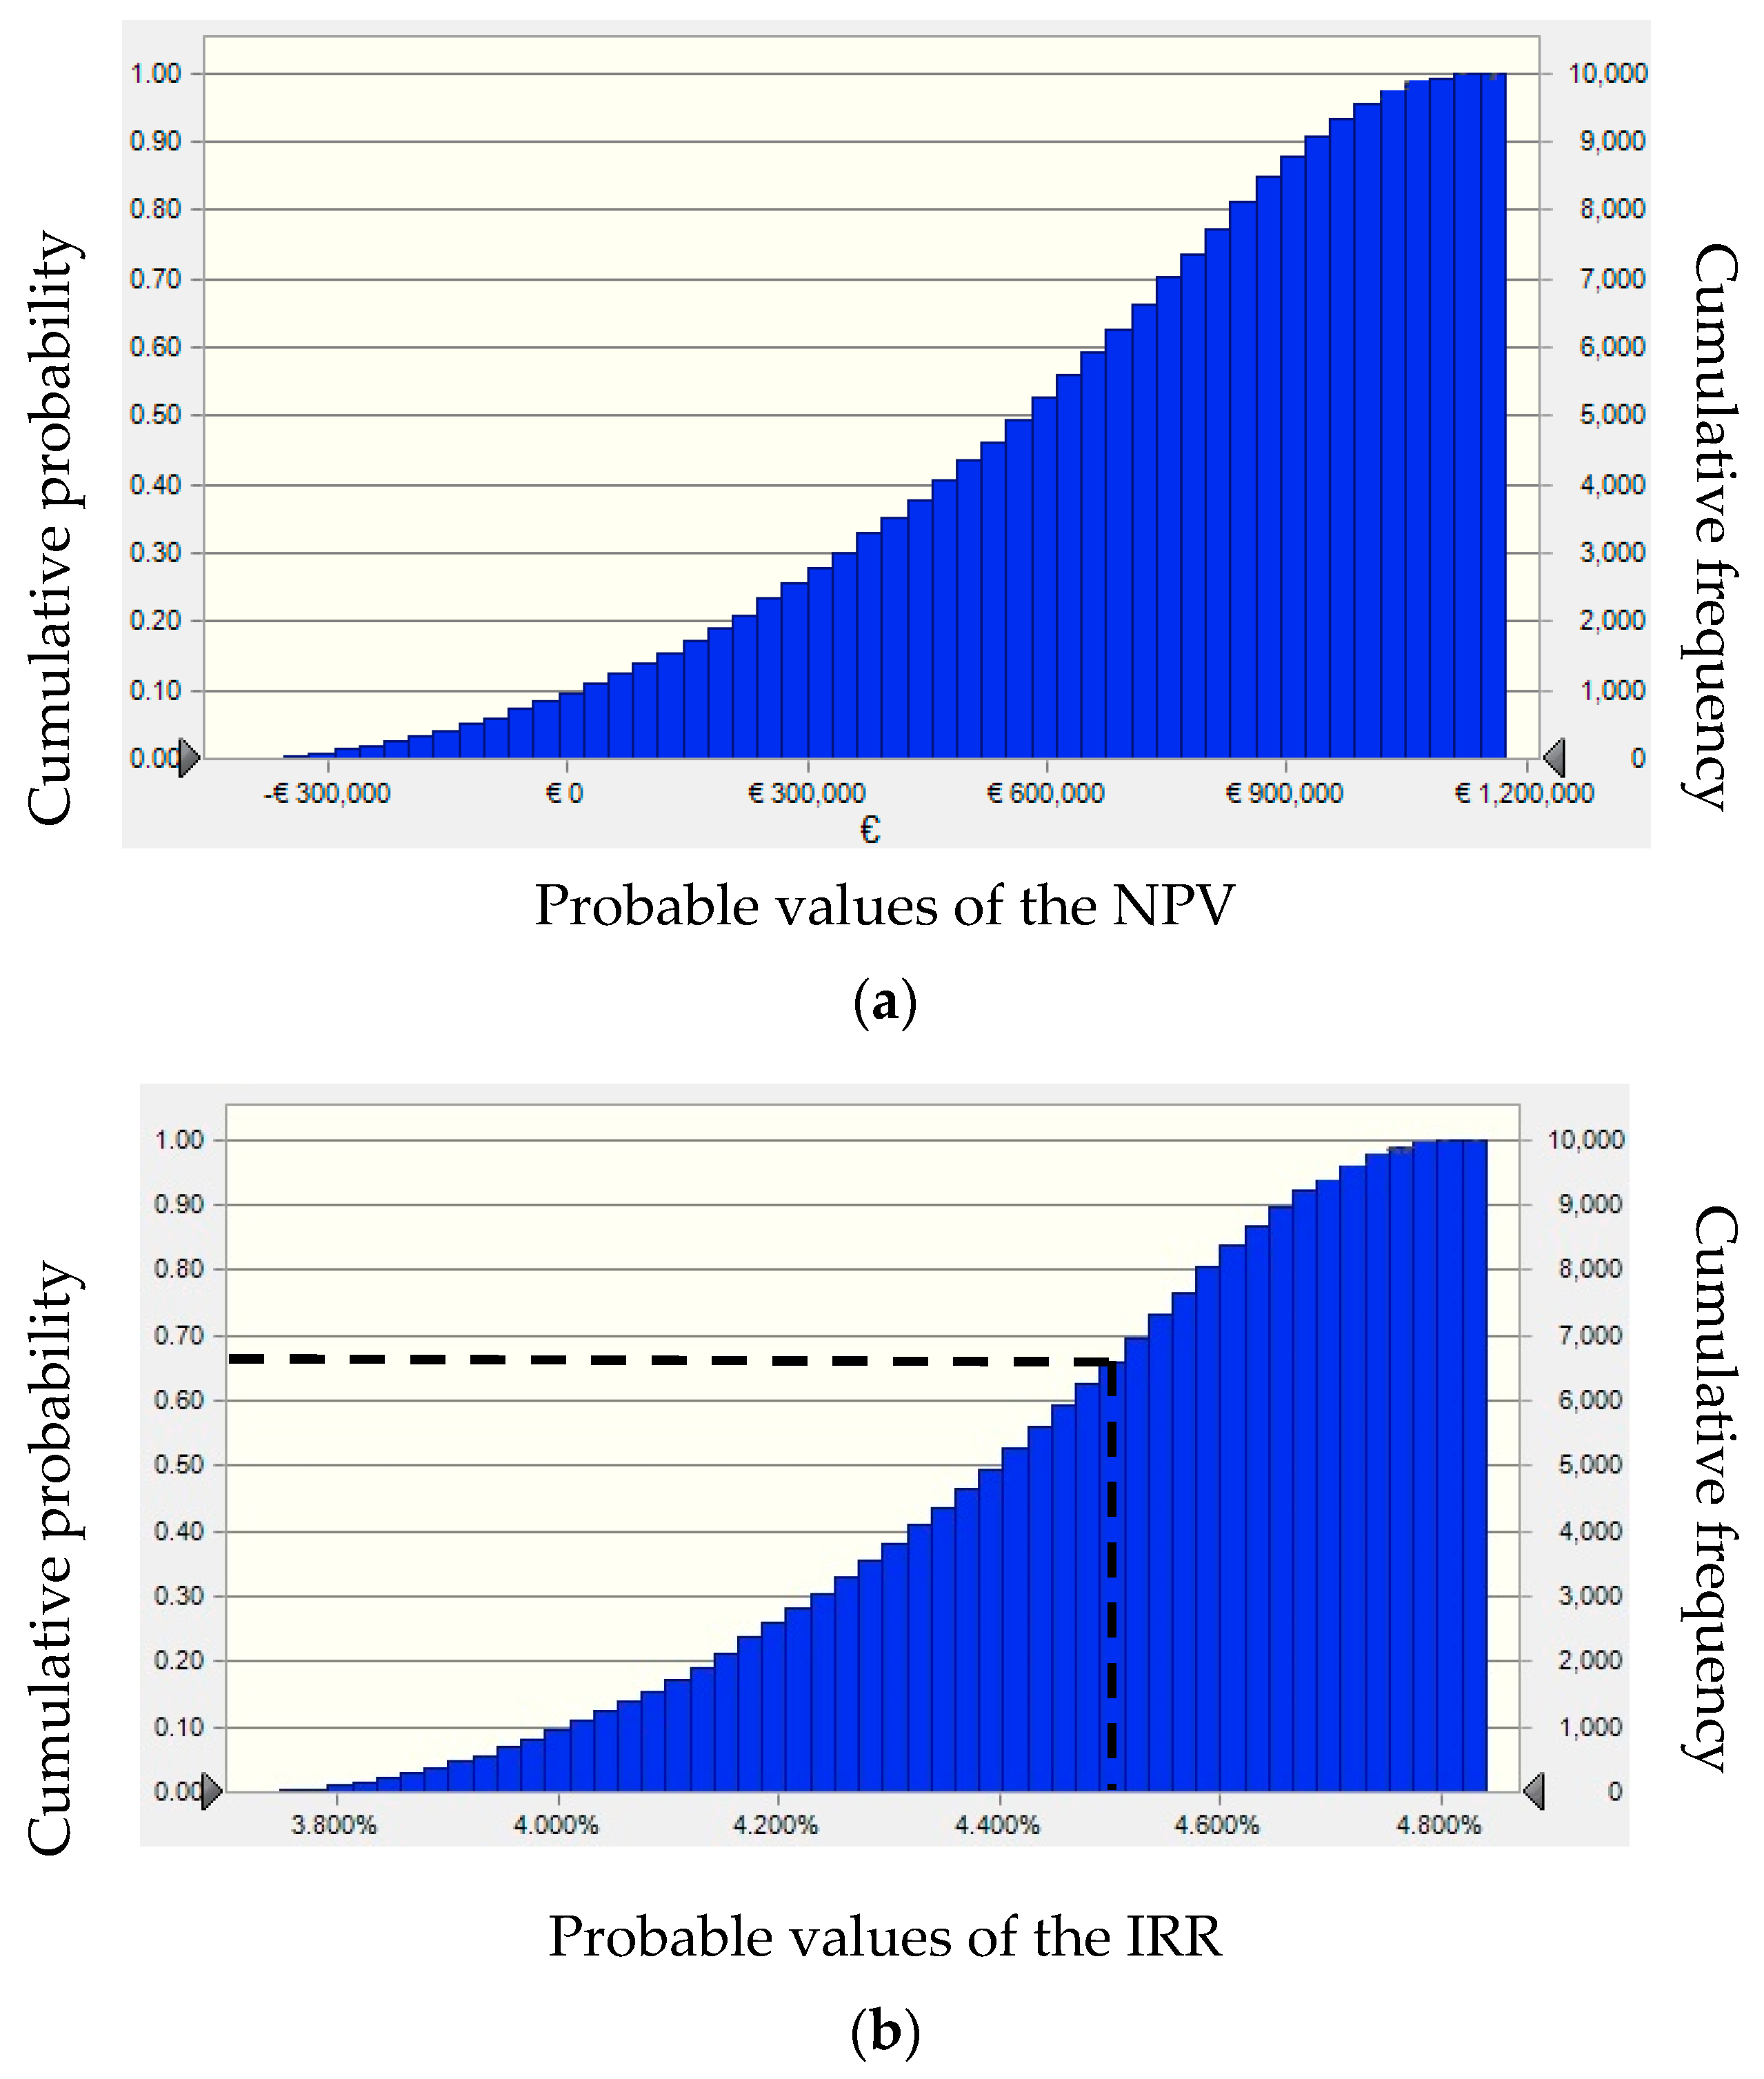
Table 9 summarizes the hypotheses assumed for the probability distribution of the critical variables detected in the case study. The distributions of the two variables are assumed triangular, since for both the average, minimum and maximum value of the critical variable can be estimated. The resulting probability distributions obtained are represented in Figure 5a,b. The results of the risk analysis are in the numerical values of Table 10, which summarizes the forecast values of the main static parameters relating to the Net Present Value (NPV) and the Internal Rate of Return (IRR). The same results are represented graphically in in Figure 6a,b that show the probability distributions of the NPV and the IRR.
The analysis, obtained based on 10,000 random extrapolations through the Montecarlo method shows that the probability of having a negative NPV is almost zero, while the maximum value that the indicator can take is about € 1,200,000. Assuming the minimum IRRmin value of the performance indicator able to satisfy the investor equal to 4.5%, the probability of having IRR ≤ 4.5% is 62%. This demonstrates the high risk of the investment to make and the consequent need to intervene through mitigation actions.
5.4. Risk Assesment
It is at this step that the ALARP principle is applicable to analyze the triangular balance between risks, mitigation costs and achievable benefits. This makes the decision making process more transparent.
Operationally, it is necessary first of all to set the two thresholds for investment risk, namely: (1) Broadly acceptable threshold, understood as the limit value of the probability of failure that the economic operator is willing to “accept broadly”; (2) tolerability threshold, which represents the limit value of the probability of failure that the investor tolerates only because additional mitigation measures would have disproportionate costs in relation to the benefits obtainable.
The values of the two thresholds depend on the investment sector, on the socio-economic characteristics of the area in which the project is to be carried out, but certainly also on the risk appetite of the economic operator who intends to take charge of the execution and management of the works. In the case study, judgments of experts and information from investors lead to the following values:
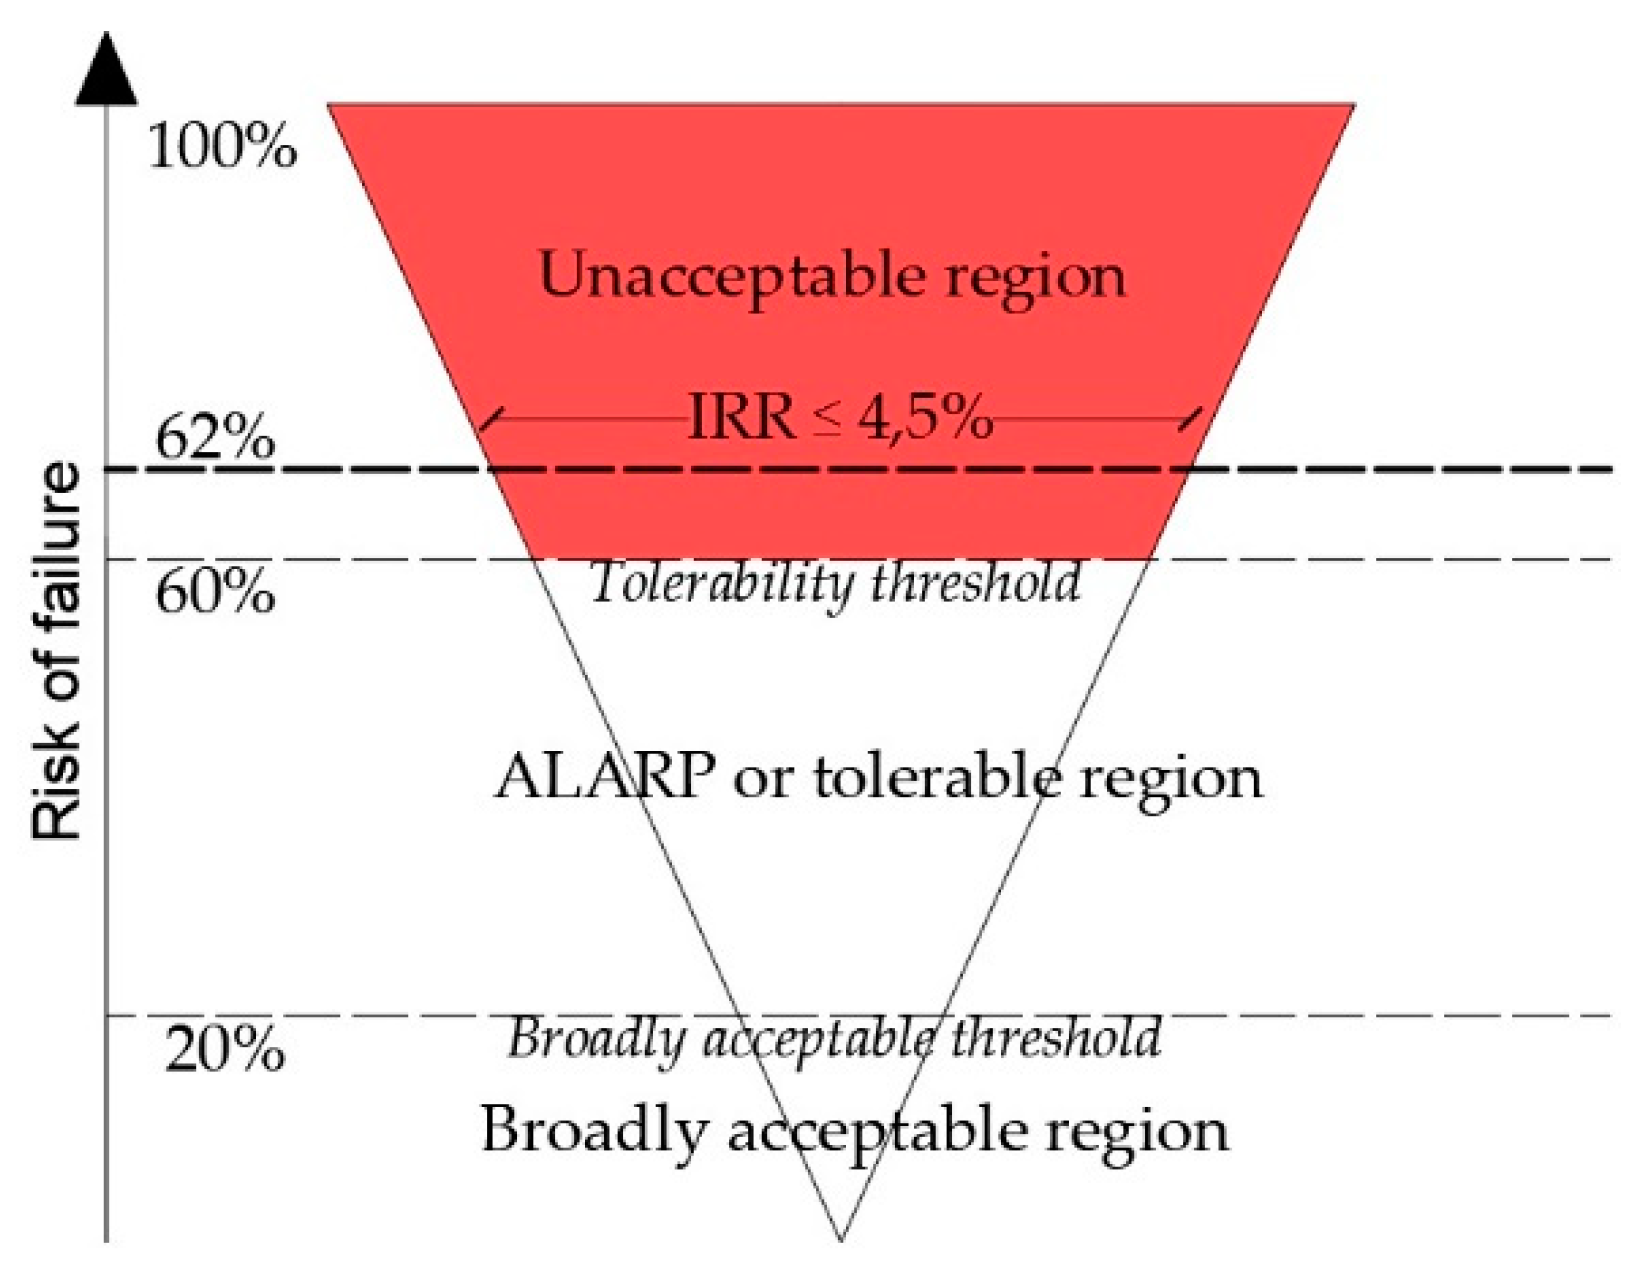
- Broadly acceptable threshold: 20%
- Tolerability threshold: 60%
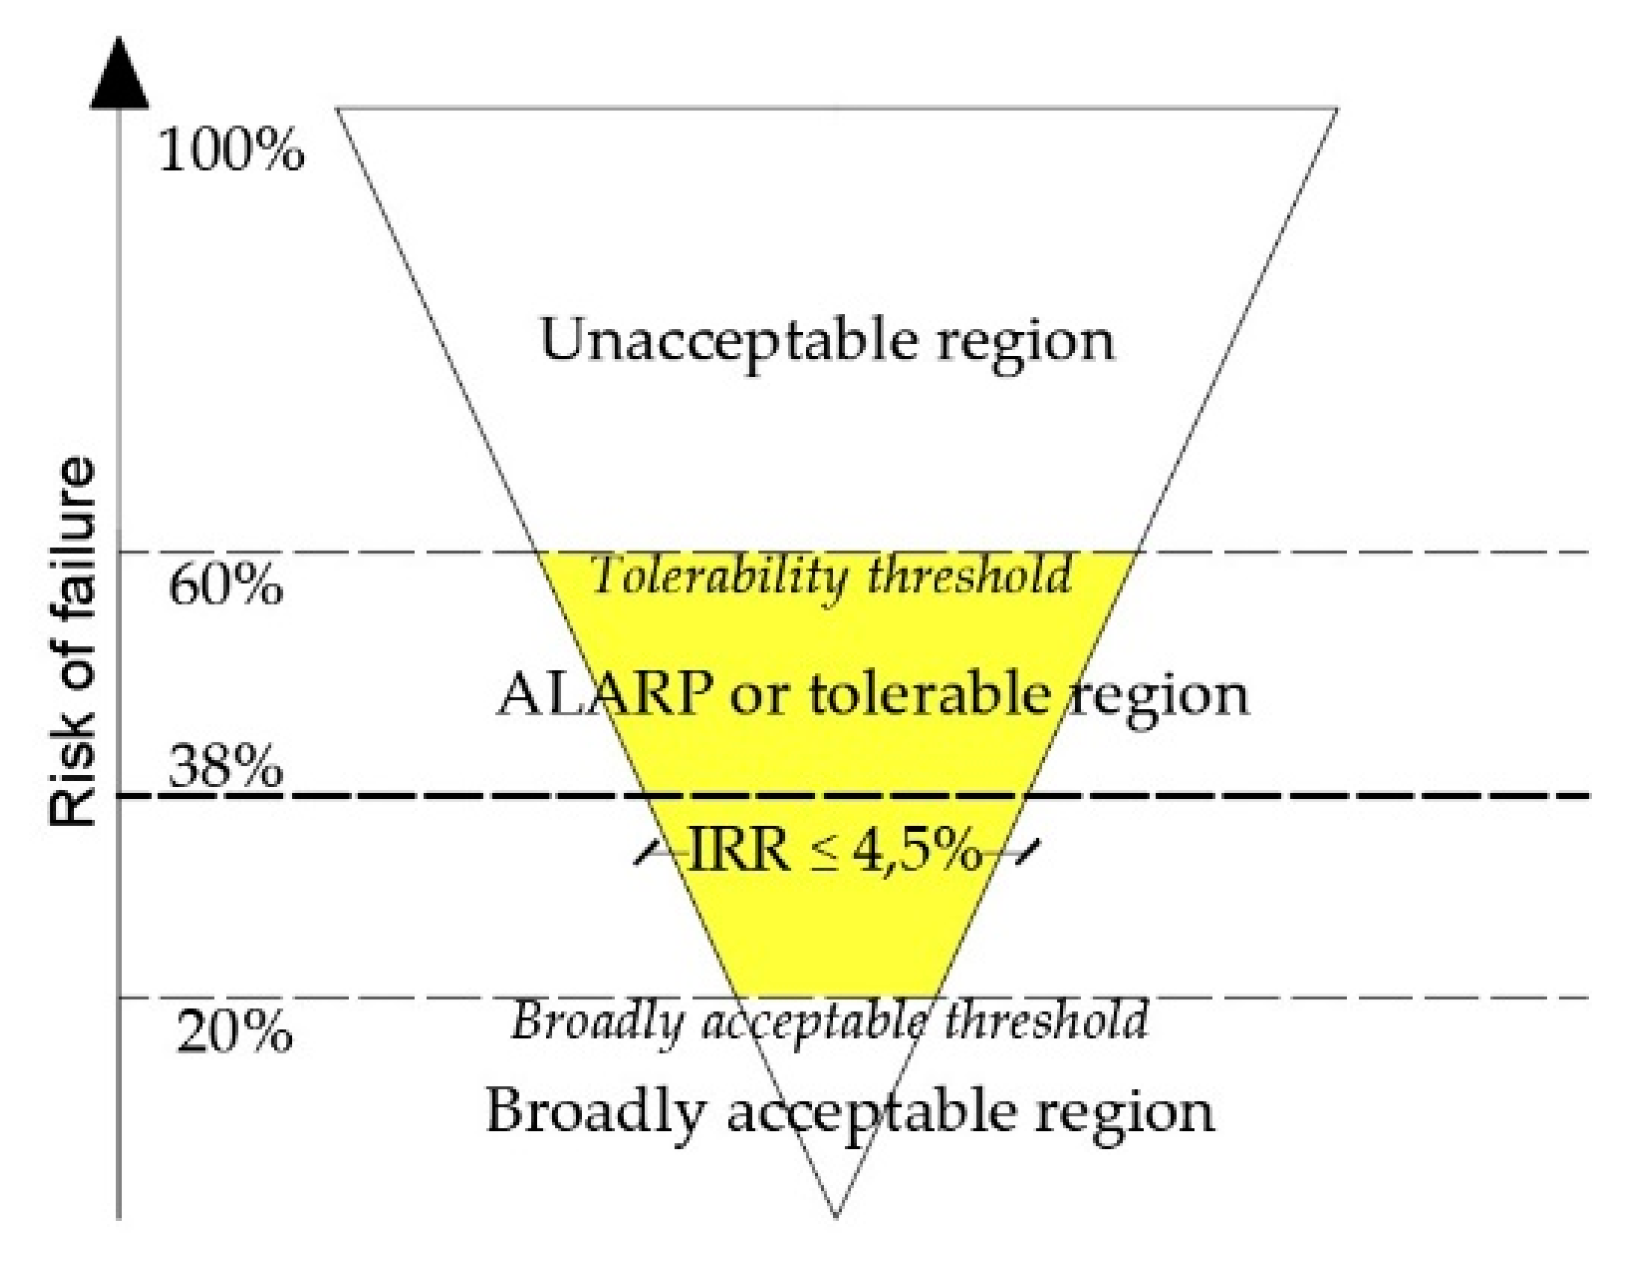
Depending on these values, there is an unacceptable risk level for the country-hotel project. In fact, the probability of failure, ie the probability for which IRR ≤ IRRlim = 4.5%, is 68%, that is higher than the tolerability threshold. This is shown in Figure 7 in which, taking up the ALARP logic described in Section 2, the three failure risk regions separated from the acceptability and tolerability threshold are represented. The inverted triangle shows the increase of the magnitude of the risk passing from the lower vertex to the upper base. Obviously the greater the risk, the higher the costs for its mitigation.
5.5. Definition of Risk Mitigation Interventions
Since the project risk is unacceptable to the investor, it is necessary to envisage mitigation measures able to increase the probability of success of the project initiative.
As a risk mitigation option, more investments in promotion and advertising are evaluated. These correspond to a relative increase in operating costs (see Table 11 result in a rise of visitor flows and, therefore, in the average housing filling index, which goes from 63% to 80%.
5.6. Assesment of the Resisual Risk
At this point, the ALARP principle requires the assessment of the residual risk, i.e., the one that remains despite the actions taken to mitigate it. To this end, the new probability distribution of the IRR is estimated, as a result of the change in both the costs of promotion and advertising, and the index of housing filling.
Table 12 contains the new hypotheses assumed for the probability distribution of the critical variable “housing fill index”. In fact, the risk mitigation intervention consisting of the increase in cost of promoting the diffused hotel has consequently led to an increase in the modal value of the Ihf. By studying the functional relationship between costs of promotion and increase in tourist turnout, the mode of the index Ihf has gone from 63% to 80% The relative probability distribution obtained is shown in Figure 8.
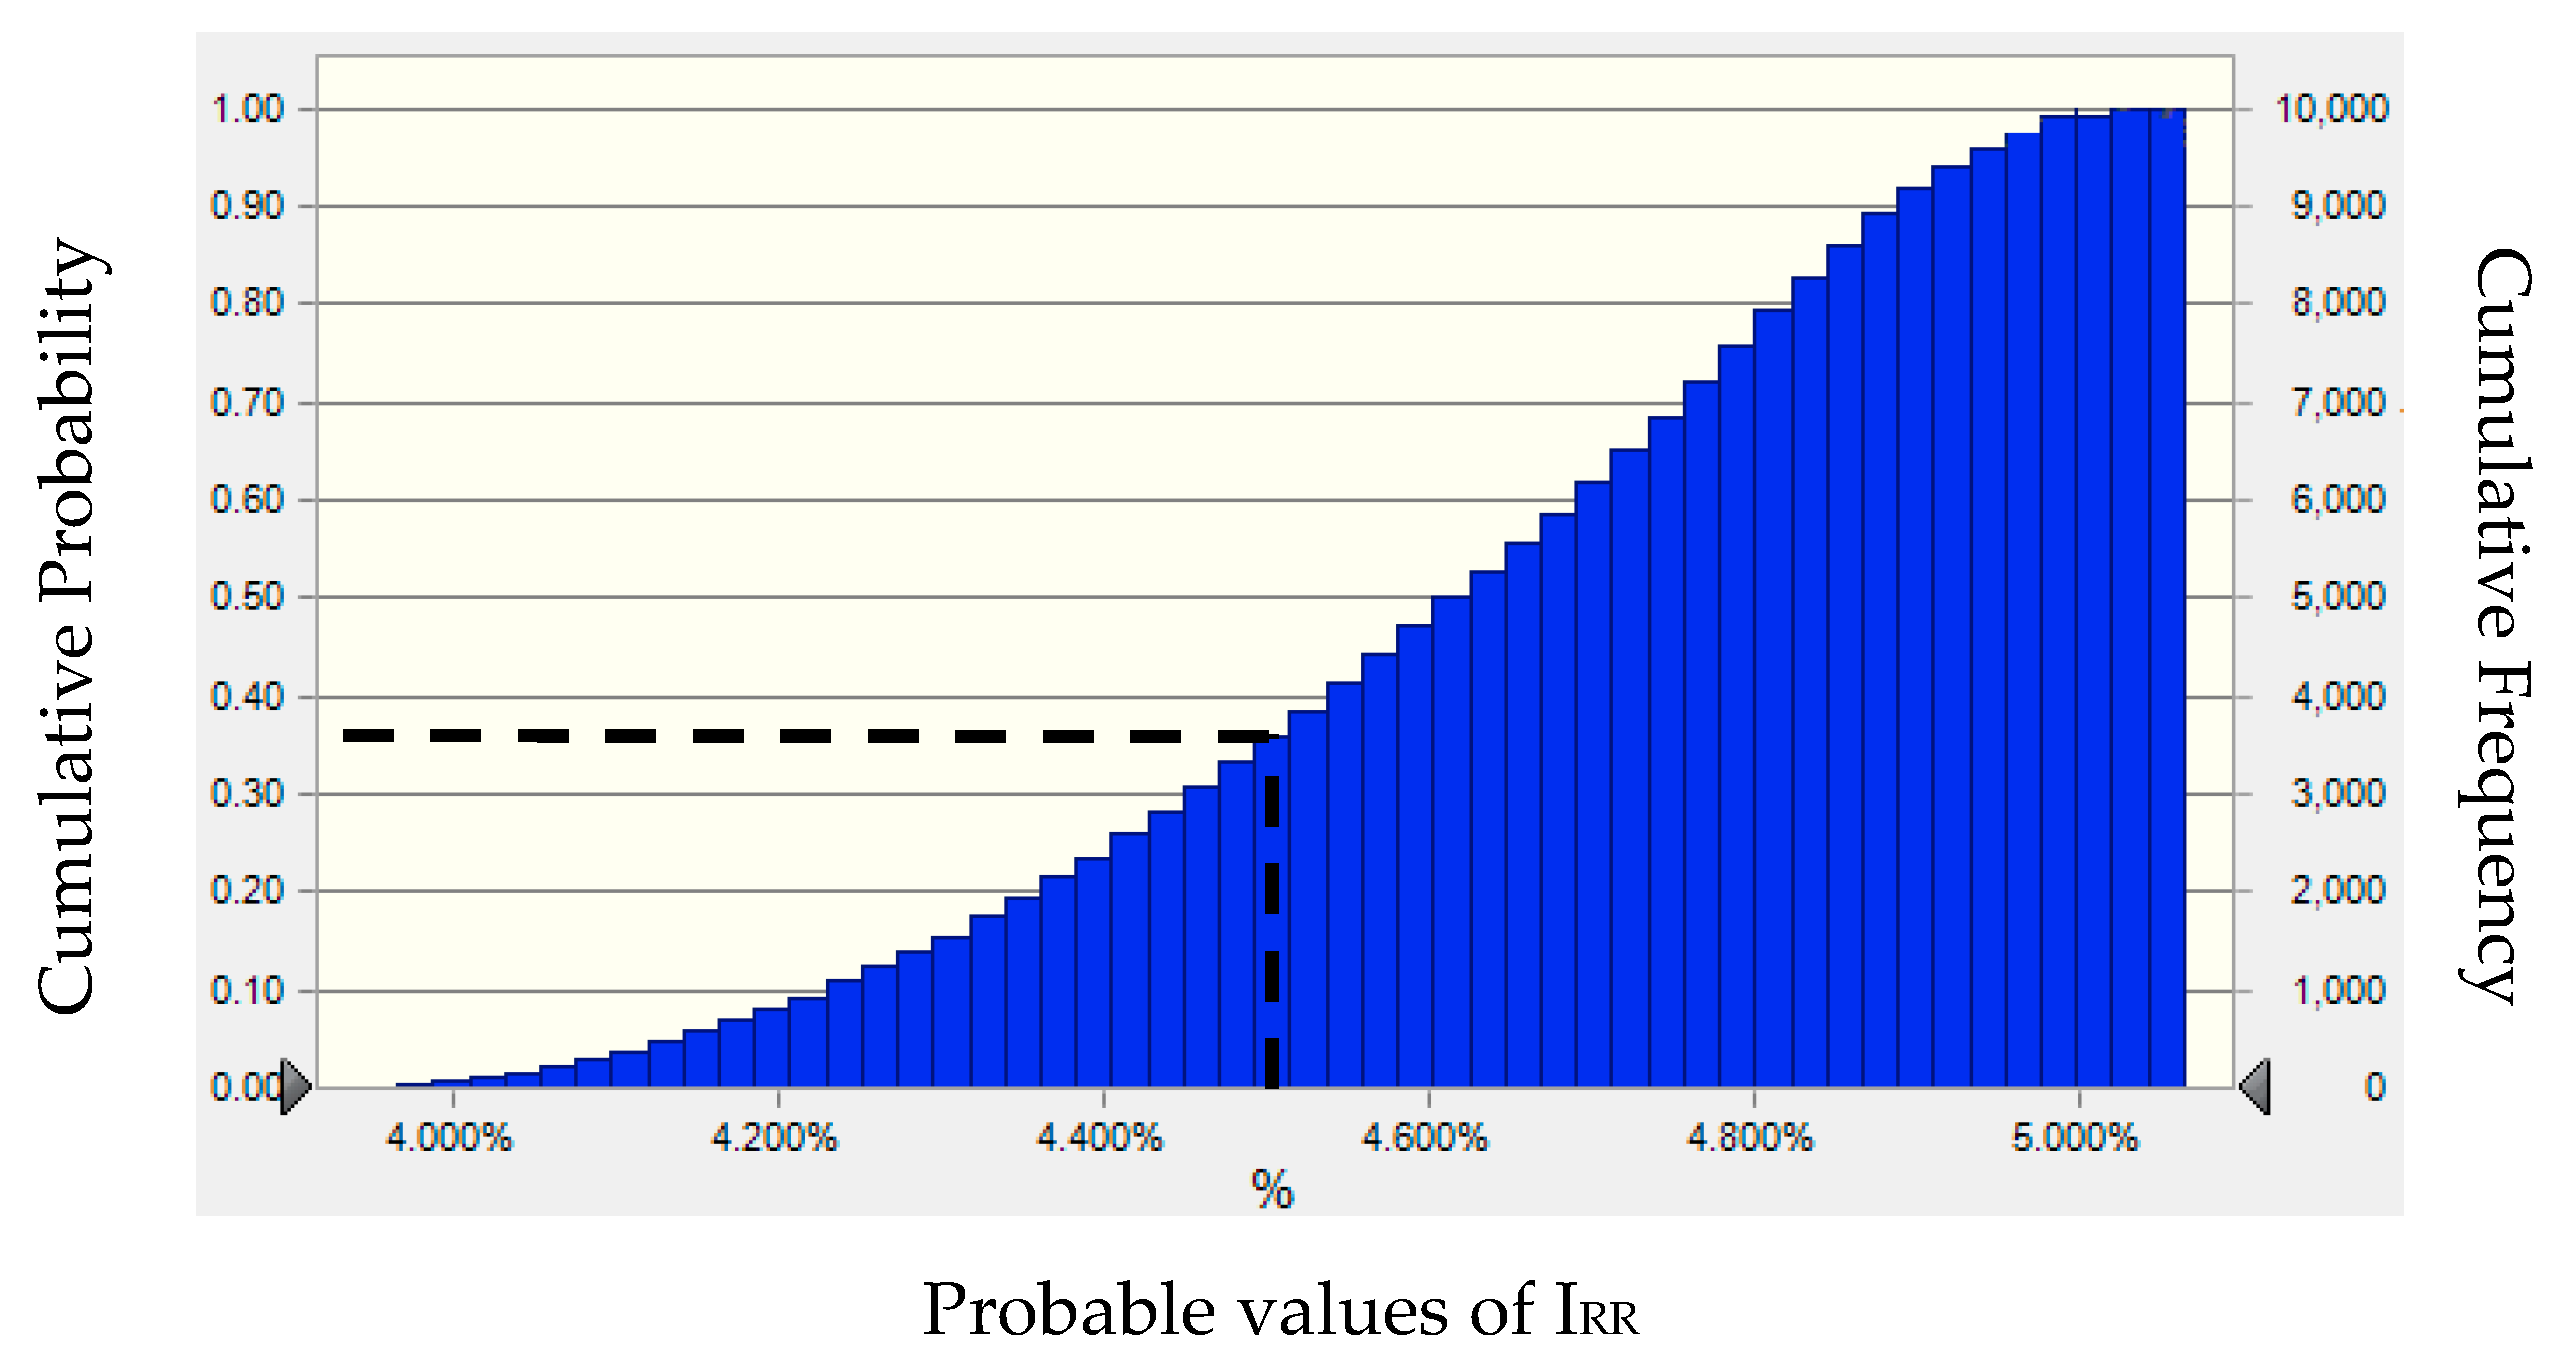
The results of the calculations are shown in Table 13 which summarizes the forecast values of the main static parameters relating to the Internal Rate of Return (IRR) post mitigation intervention. Figure 9 shows the new probability distribution of the IRR, which results in a significant reduction in the level of risk, which falls in the ALARP area after the mitigation intervention. In fact, the probability of failure, ie that for which IRR ≤ IRRlim = 4.5%, drops to 38%, as shown in Figure 10.
Subsequent calculations prove that further options for changing the structure of operating costs are not convenient, since they do not generate satisfactory increases in revenues. This means that the investment risk is tolerable as ALARP.
6. Discussion and Conclusive Remarks
To express a judgment of economic convenience on an investment project, it is essential to analyze and evaluate the risk components in probabilistic terms. This is requested to define actions useful to reduce the financial risk, also proposing changes to the intervention.
Both the reference literature and the current regulatory guidelines outline a risk management process that the phases of sensitivity analysis, qualitative risk analysis, risk probabilistic study, definition of mitigation actions. But for the civil engineering sector there are no specific indications to compare the levels of project risk before and after mitigation actions.
The idea of the paper is to integrate ALARP logic “As Low As Reasonably Practicable”, generally used in the evaluation of health and safety risks, in the methodological and procedural schemes of the Cost-Benefit Analysis as known and applied in the field civil, with the aim of introducing thresholds of acceptability and tolerability of the risk connected to the intervention. This attempt, in other words to use in the classic investment risk management procedures, the highly consolidated ALARP assessment approach in the industrial sector, leads to characterizing an investigation protocol that appears useful to improve the information panel on project profitability, with clear advantages for investors, who more consciously can decide on the implementation of the initiative.
The model of economic analysis is tested on the investment for the recovery and transformation of an ancient medieval village in the province of Salerno (Italy). The introduction of the acceptability and tolerability thresholds has, as a main advantage, the possibility of verifying in an objective and immediate manner the degree of riskiness of the intervention. Consequently, if the risk is unacceptable or ALARP it is necessary to plan or design and structural changes of the project or changes regarding the strict management phase. In other words, it is necessary to estimate the risk mitigation measures that will positively affect the economic performance indicator. In the case under consideration, the design constraints and the opportunity not to distort the planning guidelines, push to prefigure mitigation options regarding the strict management phase. Specifically, by increasing advertising and promotion costs, the probability of investment failure decreases, from 64%—already considered unacceptable to the investor—to 32%, the latter term considered tolerable. Further processing shows that other options for changing the structure of operating costs are not prospective, as they do not produce satisfactory increases in revenues. This means that the investment risk is tolerable as ALARP.
The case study shows, on one hand, that the joint use of the ALARP logic and the principles of the CBA in economic analyses in the civil field is concretely possible. On the other hand, the model outlined gives the risk analyst the opportunity to consistently evaluate the triangular balance between risks, costs and benefits, thus making the decision-making process more transparent and rational.
The novelty of the model concerns the use of the ALARP logic to evaluate the acceptability of investment risk, both the one related to the project as it was designed, and the one that still remains following the planned mitigation options. However, the research -highlights a substantial difference in the use of ALARP logic among industrial sectors, where it is generally necessary to limit the loss of human life risk, and the field of civil engineering. In fact, in the first case, the actions to mitigate the project risk and the consequent effect (for example the lower number of loss of life) are respectively independent and dependent variables according to a direct functional relationship. In fact, the disproportion in costs with respect to the achievable benefits is verified through the ICAF estimate as explained in Section 3. On the contrary, in the second case, to know the link between the input variables (for example, the management costs) and the levels of risk, we pass through the output variables (IRR), where inputs and outputs are interrelated. In other words, the level of investment risk and the disproportion between the costs incurred and the benefits obtainable by the mitigation measures depend directly on the economic performance indicator. For this reason, in the civil field, this makes difficult to construct risk acceptance and tolerability thresholds on a probabilistic basis.
However, the construction of a dataset able to summarize the risk appetite of the ordinary investor may be the next step of the research. Therefore, the goal is to build a dataset on the basis of average levels of profitability of investments classified both for categories of investment projects and for specific socio-economic characteristics of the area where the initiative is located. This will make it easier to predict the thresholds of acceptability and tolerability of risk in probabilistic terms, giving greater rigor to the basic logic of the protocol.
In conclusion, one aspect emerges clearly. Although actually it is mainly used in “safety risk”, ALARP logic defines a general way of thinking, as well as a framework able to facilitate “risk communication” [62]. In this sense, it is believed that the ALARP principle integrated with traditional evaluation techniques, can allow the assertion of an innovative approach for risk management of civil engineering projects.
Author Contributions
A.N., S.H., G.D.M., R.B. and G.M. have conceived, structured and written the article. A.N. and G.M. have implemented the software. S.H., G.D.M. and R.B. have validated the calculations. G.M. has deepened review and editing. A.N. has performed the supervision.
Funding
This research received no external funding.
Conflicts of Interest
The authors declare no conflict of interest.
References
- Henley, E.J.; Kumamoto, H. Reliability Engineering and Risk Assessment; Prentice Hall: London, UK, 1981. [Google Scholar]
- Covello, V.T.; Mumpower, J. Risk analysis and risk management: An historical perspective. Risk Anal. 1985, 5, 103–119. [Google Scholar] [CrossRef]
- Rechard, R.P. Historical relationship between performance assessment for radioactive waste disposal and other types of risk assessment. Risk Anal. 1999, 19, 763–807. [Google Scholar] [CrossRef] [PubMed]
- Rechard, R.P. Historical background on performance assessment for the waste isolation pilot plant. Reliabil. Eng. Syst. Saf. 2000, 69, 5–46. [Google Scholar] [CrossRef]
- Bedford, T.; Cooke, R. Probabilistic Risk Analysis; Cambridge University Press: Cambridge, UK, 2001. [Google Scholar]
- Thompson, K.M.; Deisler, P.H.; Schwing, R.C. Interdisciplinary vision: The first 25 years of the Society for Risk Analysis (SRA), 1980–2005. Risk Anal. 2005, 25, 1333–1386. [Google Scholar] [CrossRef] [PubMed]
- Zio, E. Reliability engineering: Old problems and new challenges. Reliabil. Eng. Syst. Saf. 2007, 94, 125–141. [Google Scholar] [CrossRef]
- Hale, A. Foundations of safety science: A postscript. Saf. Sci. 2014, 67, 64–69. [Google Scholar] [CrossRef]
- Hansson, S.O.; Aven, T. Is risk analysis scientific? Risk Anal. 2014, 34, 1173–1183. [Google Scholar] [CrossRef] [PubMed]
- Hollnagel, E. Is safety a subject for science? Saf. Sci. 2014, 67, 21–24. [Google Scholar] [CrossRef]
- Le Coze, J.C.; Pettersen, K.; Reiman, T. The foundations of safety science. Saf. Sci. 2014, 67, 1–5. [Google Scholar] [CrossRef]
- Aven, T.; Krohn, B.S. A new perspective on how to understand, assess and manage risk and the unforeseen. Reliabil. Eng. Syst. Saf. 2014, 121, 1–10. [Google Scholar] [CrossRef]
- Aven, T. Risk assessment and risk management: Review of recent advances on their foundation. Eur. J. Oper. Res. 2016, 253, 1–13. [Google Scholar] [CrossRef]
- SRA. Glossary Society for Risk Analysis, 2015. Available online: www.sra.com/resources (accessed on 10 October 2018).
- SRA. Foundations of Risk Analysis, 2015. Available online: www.sra.com/resources (accessed on 10 October 2018).
- Knight, F.H. Risk, Uncertainty and Profit; The London School of Economics and Political Science: London, UK, 1921. [Google Scholar]
- Spencer, M.H.; Siegelman, L. Managerial Economics; Homewood: Irwin, IL, USA, 1964. [Google Scholar]
- Saraceno, P. La Produzione Industriale; Libreria Universitaria: Venezia, Italy, 1970. [Google Scholar]
- Knight, F.H. Risk, Uncertainty and Profit; University Press: Chicago, IL, USA, 1971. [Google Scholar]
- Nesticò, A. Risk-Analysis Techniques for the Economic Evaluation of Investment Projects. In Integrated Evaluation for the Management of Contemporary Cities; Mondini, G., Fattinnanzi, E., Oppio, A., Bottero, M., Stanghellini, S., Eds.; Springer: Cham, Switzerland, 2018; pp. 617–629. [Google Scholar]
- Althaus, C.E. A Disciplinary Perspective on the Epistemological Status of Risk. Risk Anal. 2005, 25, 567–588. [Google Scholar] [CrossRef] [PubMed]
- De Mare, G.; Nesticò, A.; Benintendi, R.; Maselli, G. ALARP approach for risk assessment of civil engineering projects. In Computational Science and Its Applications—ICCSA 2018; Gervasi, O., Murgante, B., Misra, S., Stankova, E., Torre, C.M., Rocha, A.C., Taniar, D., Apduhan, B.O., Tarantino, E., Ryu, Y., Eds.; Springer International Publishing: Basel, Switzerland, 2018; pp. 75–86. [Google Scholar]
- French, S.; Bedford, T.; Atherton, E. Supporting ALARP decision making by cost benefit analysis and multi-attribute utility theory. J. Risk Res. 2007, 8, 207–223. [Google Scholar] [CrossRef]
- Aven, T.; Abrahamsen, E.B. On the use of cost-benefit analysis in ALARP processes. Int. J. Perform. Eng. 2007, 3, 345–353. [Google Scholar]
- Jones-Lee, M.; Aven, T. ALARP—What does it really mean? Reliabil. Eng. Syst. Saf. 2011, 96, 877–882. [Google Scholar] [CrossRef]
- Ale, B.J.M.; Hartford, D.N.D.; Slater, D. ALARP and CBA all in the same game. Saf. Sci. 2015, 76, 90–100. [Google Scholar] [CrossRef]
- Amelotti, L.; Valcalda, B. Il ciclo di vita della Gestione dei Progetti. Dall’approccio Tradizionale All’analisi dei Rischi; Guerini e Associati: Milano, Italy, 1998. [Google Scholar]
- Beretta, S. Valutazione dei Rischi e Controllo Interno; EGEA: Milano, Italy, 2004. [Google Scholar]
- Floreani, A. Enterprise Risk Management. I Rischi Aziendali e il Processo di Risk Management; I.S.U.—Università Cattolica: Milano, Italy, 2004. [Google Scholar]
- Zio, E. An Introduction to the Basics of Reliability and Risk Analysis; World Scientific Publishing: Singapore, 2007. [Google Scholar]
- Meyer, T.; Reniers, G. Engineering Risk Management; De Gruyter Graduate: Berlin, Germany, 2013. [Google Scholar]
- Dash Wu, D.; Olson, D.L. Computational simulation and risk analysis: An introduction of state of the art research. Math. Comput. Model. 2013, 58, 1581–1587. [Google Scholar]
- Aven, T. Risk Analysis, 2nd ed.; Wiley: Chichester, UK, 2015. [Google Scholar]
- Del Giudice, V.; Salvo, F.; De Paola, P. Resampling techniques for real estate appraisals: Testing the bootstrap approach. Sustainability 2018, 10, 3085. [Google Scholar] [CrossRef]
- Nesticò, A.; Moffa, R. Economic analysis and Operational Research tools for estimating productivity levels in off-site construction. Valori e Valutazioni 2018, 20, 107–126. [Google Scholar]
- Borghesi, A. La gestione dei Rischi di Azienda. Economia e Organizzazione, Teoria e Pratica; CEDAM: Padova, Italy, 1985. [Google Scholar]
- Bertelli, R.; Linguanti, E. Analisi Finanziaria e Gestione di Portafoglio. Valutazione del Rischio, Tecniche di Asset Allocation, Strumenti di Analisi Tecnica e Fondamentale; Franco Angeli: Milano, Italy, 2005. [Google Scholar]
- Bezzi, C. Cos’è la Valutazione: Un’introduzione ai Concetti, le Parole Chiave e i Problemi Metodologici; Franco Angeli: Milano, Italy, 2006. [Google Scholar]
- Barotta, P. Il Rischio. Aspetti Tecnici, Sociali, Etici; Armando Editore: Roma, Italy, 2012. [Google Scholar]
- Cox, L.A. Evaluating and Improving Risk Formulas for Allocating Limited Budgets to Expensive Risk-Reduction Opportunities. J. Risk Anal. 2012, 32, 1244–1252. [Google Scholar] [CrossRef] [PubMed]
- De Mare, G.; Granata, M.F.; Nesticò, A. Weak and Strong Compensation for the Prioritization of Public Investments: Multidimensional Analysis for Pools. Sustainability 2015, 7, 16022–16038. [Google Scholar] [CrossRef] [Green Version]
- Guarini, M.R.; Nesticò, A.; Morano, P.; Sica, F. A Multicriteria Economic Analysis Model for Urban Forestry Projects. In New Metropolitan Perspectives. ISHT 2018. Smart Innovation, Systems and Technologies; Calabrò, F., Della Spina, L., Bevilacqua, C., Eds.; Springer: New York, NY, USA, 2018; Volume 100, pp. 564–571. [Google Scholar]
- Savvides, S. Risk analysis in investment appraisal. Proj. Apprais. 1994, 9, 3–18. [Google Scholar] [CrossRef] [Green Version]
- Cameron, D.A. Risk analysis and investment appraisal in marketing. Long Range Plan. 1972, 5, 43–47. [Google Scholar] [CrossRef]
- Hertz, D.B. Risk analysis in capital investment. Harv. Bus. Rev. 1979, 57, 5. [Google Scholar]
- Hertz, D.B.; Thomas, H. Risk Analysis and Its Applications; John Wiley and Sons: New York, NY, USA, 1983. [Google Scholar]
- Hertz, D.B.; Thomas, H. Practical Risk Analysis; John Wiley and Sons: New York, NY, USA, 1984. [Google Scholar]
- Crowe, R.M.; Horn, R.C. The Meaning of Risk. J. Risk Insur. 1967, 34, 459–474. [Google Scholar] [CrossRef]
- European Commission, Directorate General for Regional and Urban Policy. Guide to Cost-Benefit Analysis of Investment Projects: Economic Appraisal Tool for Cohesion Policy 2014–2020; European Commission: Brussels, Belgium, 2008. [Google Scholar]
- Melchers, R. On the ALARP approach to risk management. Reliabil. Eng. Syst. Saf. 2001, 71, 201–208. [Google Scholar] [CrossRef]
- Bentintendi, R.; De Mare, G. Upgrade the ALARP Model as a Holistic Approach to Project Risk and Decision Management; Hydrocarbon Processing: Houston, TX, USA, 2017. [Google Scholar]
- Ale, B.J.M. Tolerable or acceptable, a comparison of risk regulation in the UK and in the Netherlands. Risk Anal. 2005, 25, 231–241. [Google Scholar] [CrossRef] [PubMed]
- Yasseri, S. The ALARP Argument; Safe Sight Technology: London, UK, 2013. Available online: http://www.hse.gov.uk/risk/theory/alarp1.htm (accessed on 3 October 2018).
- HSE. Reducing Risks, Protecting People: HSE’s Decision-Making; HSE Books: London, UK, 2001. [Google Scholar]
- HSE. 2014. Available online: http://www.hse.gov.uk/risk/theory/alarpglance.htm (accessed on 3 October 2018).
- HSE. Principles and Guidelines to Assist HSE in Its Judgements That Dutyholders have Reduced Risk as Low as Reasonably Practicable. 2014. Available online: http://www.hse.gov.uk/risk/theory/alarp1.htm (accessed on 3 October 2018).
- HSE. 2014. Available online: http://www.hse.gov.uk/risk/theory/alarpcba.htm (accessed on 3 October 2018).
- Button, K. Overview of Internalising the Social Costs of Transport; OECD ECMT Report; OECD: Washington, DC, USA, 1994. [Google Scholar]
- De Blaeij, A. The value of statistical life in road safety: A meta-analysis. Acc. Anal. Prev. 2003, 35, 973–986. [Google Scholar] [CrossRef]
- Viscusi, W.K.; Aldy, J. The value of a statistical life: A critical review of market estimates throughout the world. Risk Uncertain 2003, 27, 5–76. [Google Scholar] [CrossRef]
- Yasseri, S.; Menhennett, P. Costing for ALARP. In Proceedings of the International Conference on Offshore Mechanics and Arctic Engineering—OMAE, Halkidiki, Greece, 9–16 June 2005; Kellogg Brown and Root (KBR): Surrey, UK, 2005; Volume 2. [Google Scholar]
- Redmill, F. ALARP Explored; Computing Science, University of Newcastle upon Tyne: Newcastle upon Tyne, UK, 2010. [Google Scholar]
Figure 1.
(a) A simple representation of the As Low as Reasonably Practicable (ALARP) model; (b) The Health and Safety Executive (HSE)’s ALARP model.
Figure 1.
(a) A simple representation of the As Low as Reasonably Practicable (ALARP) model; (b) The Health and Safety Executive (HSE)’s ALARP model.
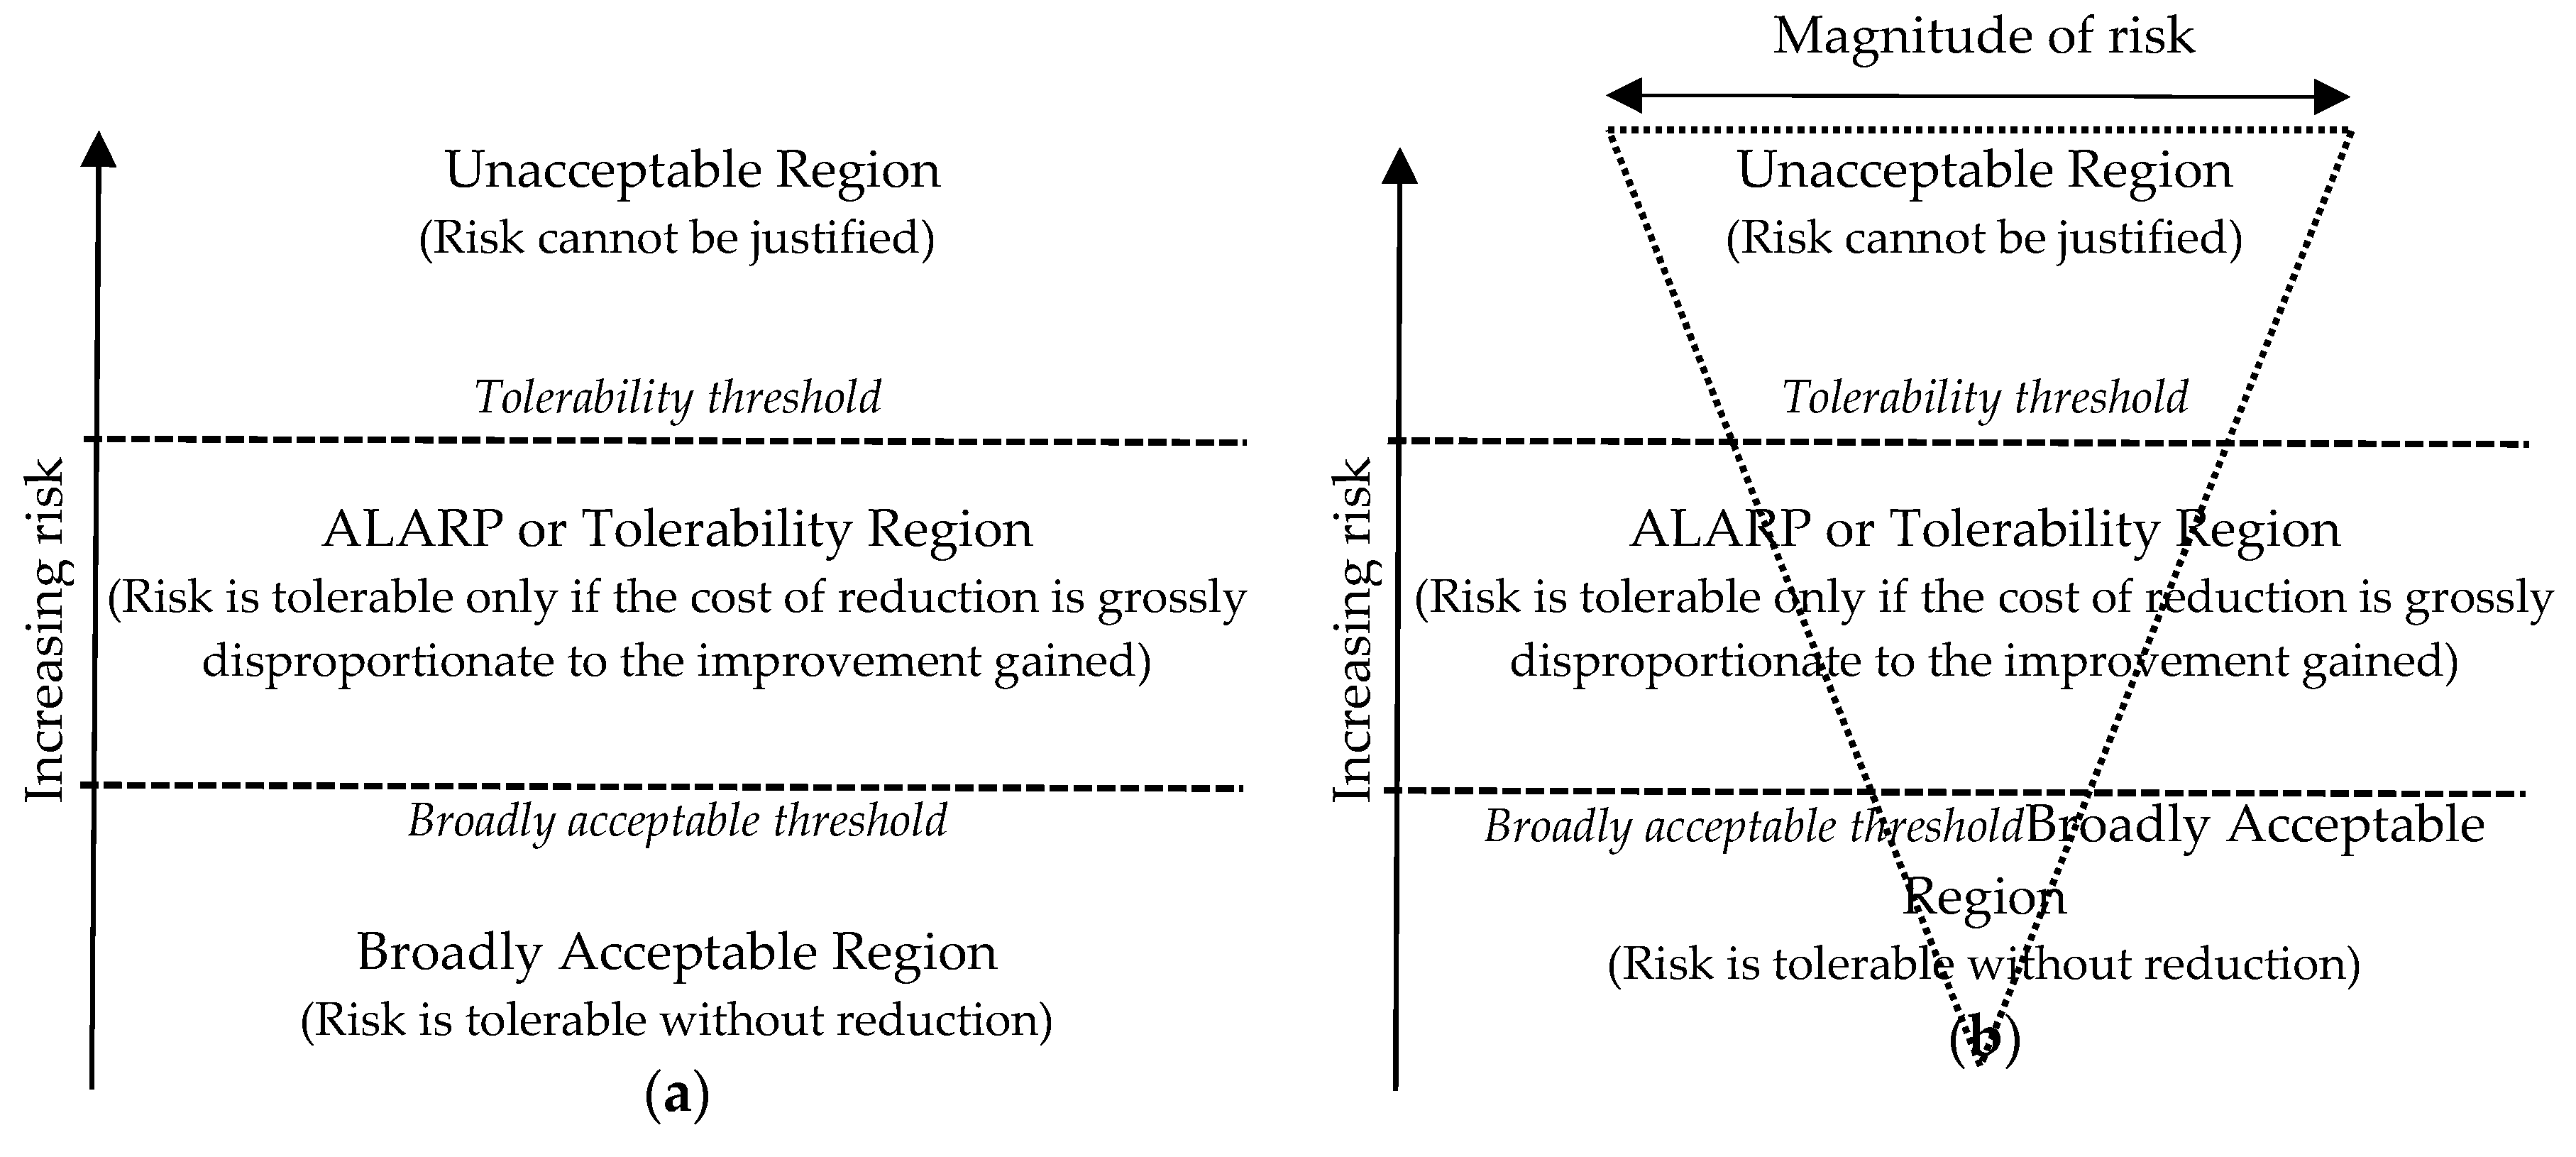
Figure 2.
Typological characteristics of the architectural heritage of the village.

Figure 3.
Degradation levels of the building heritage.

Figure 4.
Functional destinations, foreseen by the project of realization of the country-hotel.

Figure 5.
(a) Probability distribution of the critical variable C1; (b) Probability distribution of the critical variable Ihf.
Figure 5.
(a) Probability distribution of the critical variable C1; (b) Probability distribution of the critical variable Ihf.

Figure 6.
(a) Cumulative probability distribution of the NPV; (b) Cumulative probability distribution of IRR.
Figure 6.
(a) Cumulative probability distribution of the NPV; (b) Cumulative probability distribution of IRR.

Figure 7.
Broadly acceptable and tolerability thresholds for investment risk.

Figure 8.
New probability distribution of the critical variable Ihf.
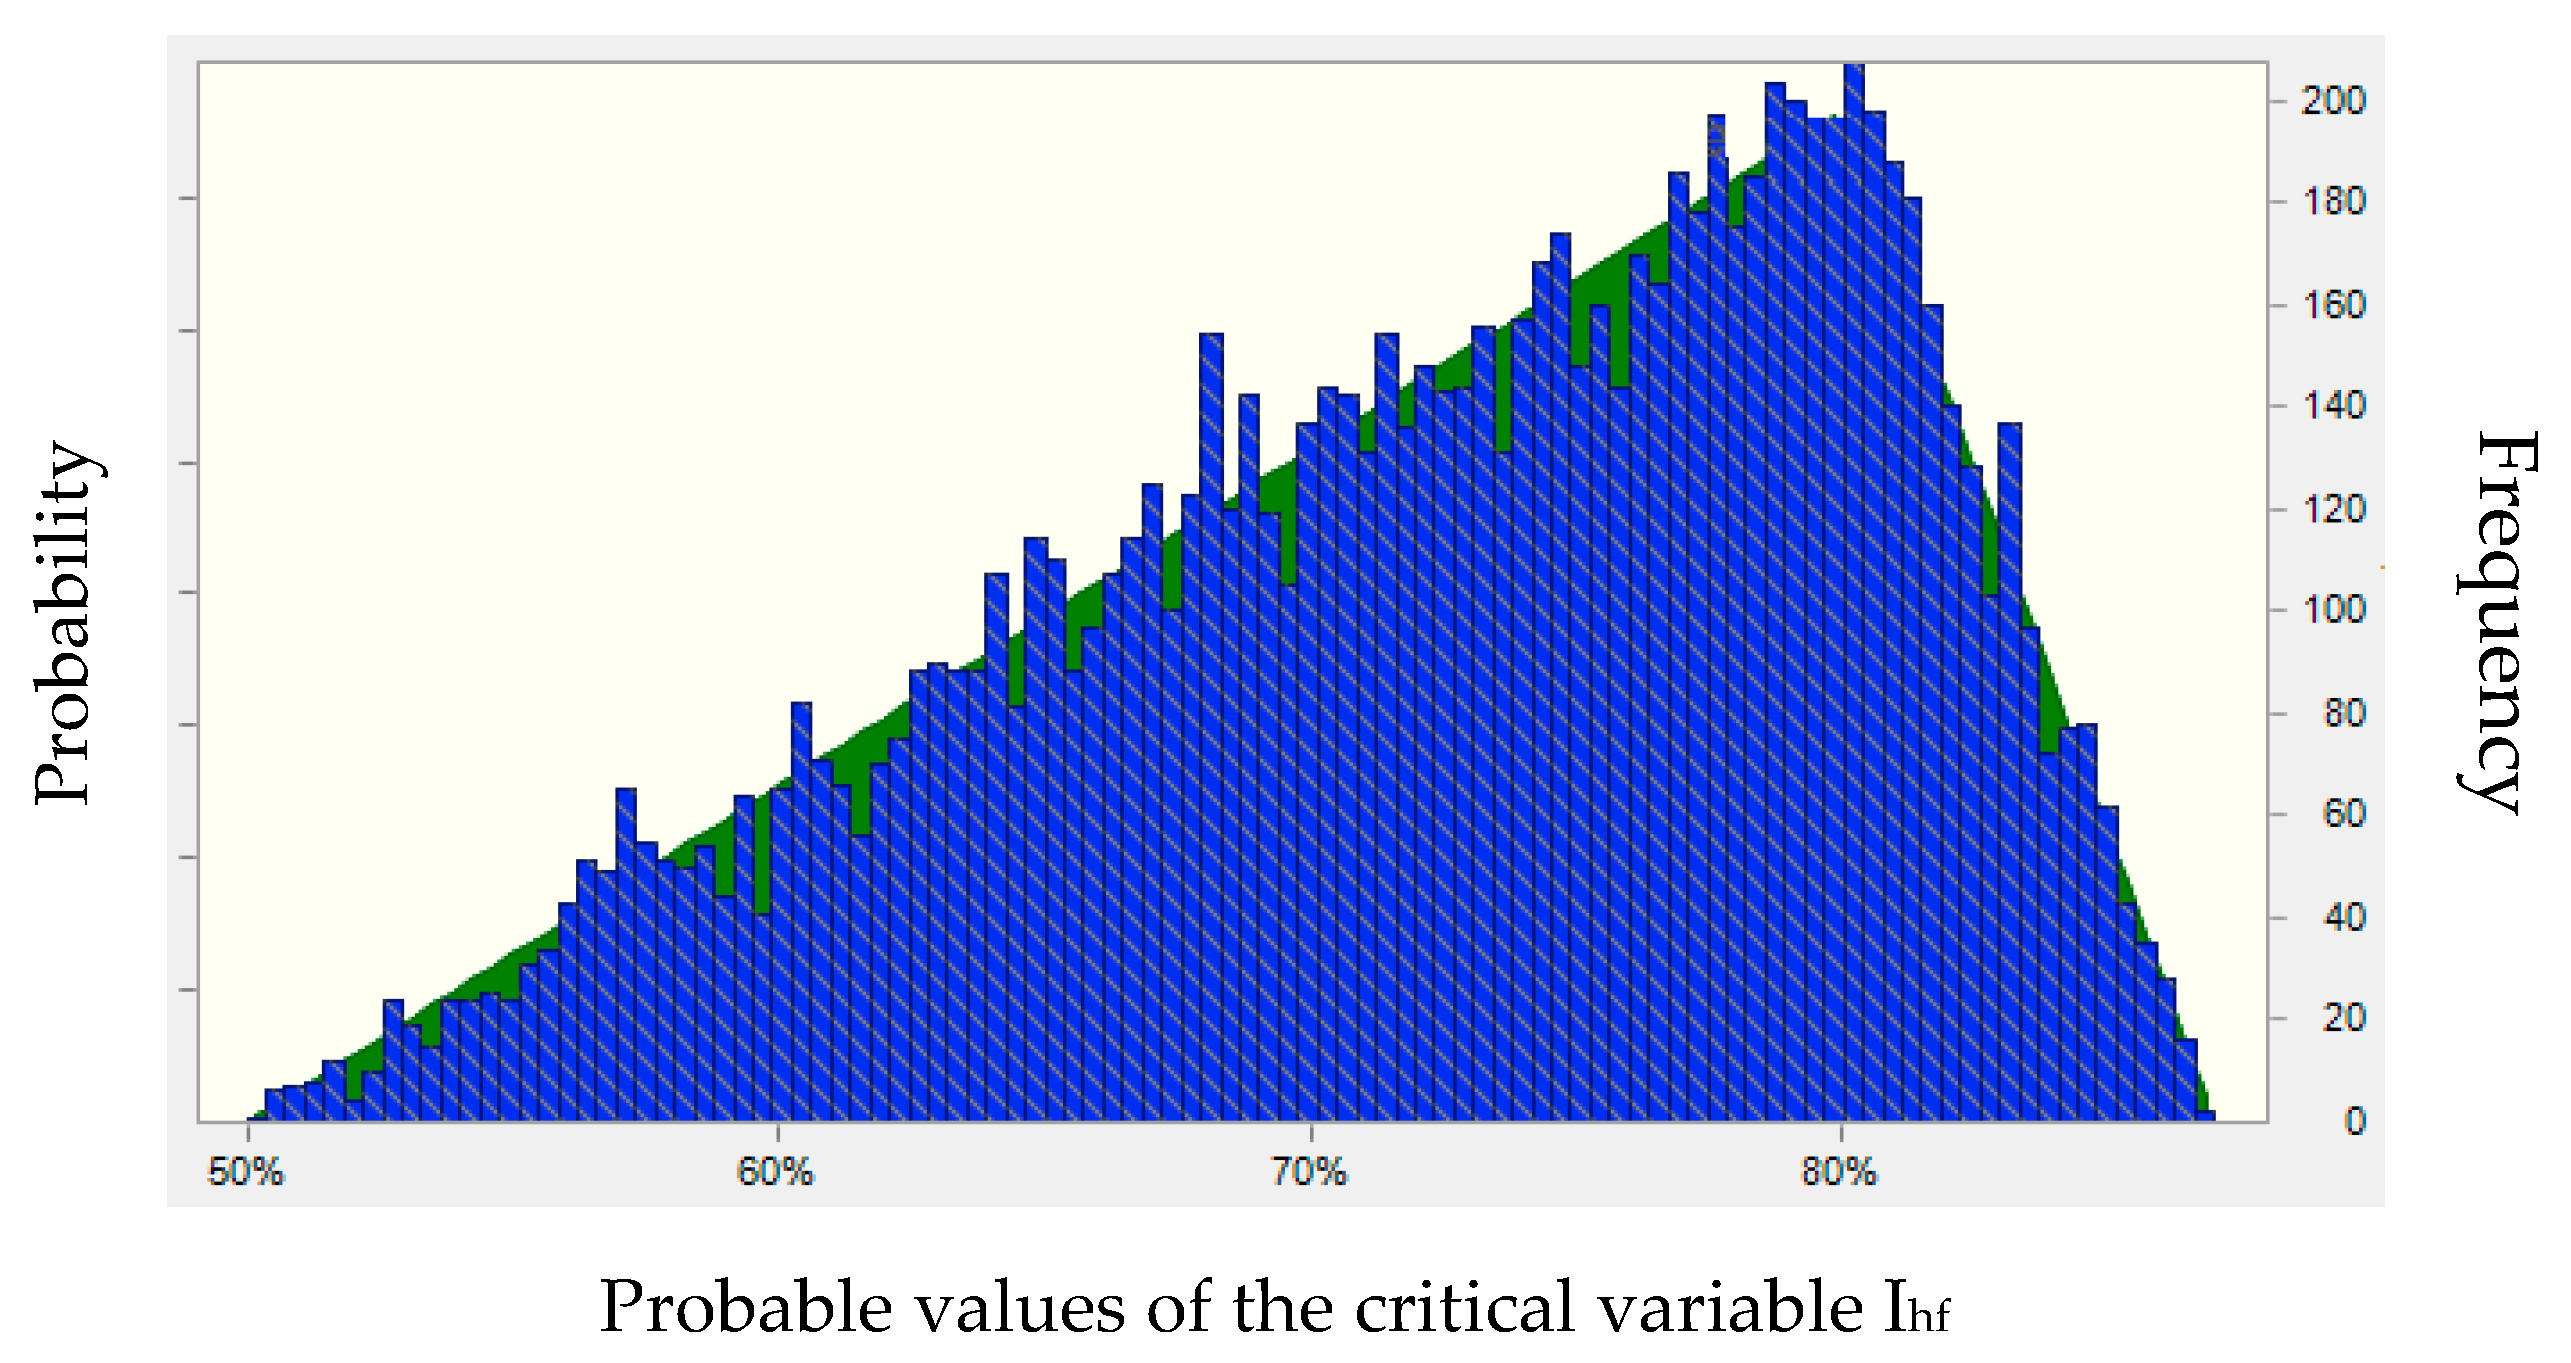
Figure 9.
New cumulative probability distribution of IRR.

Figure 10.
Broadly acceptable and tolerability thresholds for investment risk following the mitigation intervention.
Figure 10.
Broadly acceptable and tolerability thresholds for investment risk following the mitigation intervention.


Table 1.
Risk management protocol for the economic evaluation of civil works.
| 1. Definition of the objectives of the risk management process | Evaluation of the economic performance of the project. In terms of net present value (NPV): | |
| with Bt e Ct respectively benefits and costs generated by the project at time t; r discount rate | ||
| 2. Identification of the risk components of the project | Sensitivity analysis for the identification of critical variables (CV) A variable is critical if: ±1% variation of CV → % variation of NPV > 1% | |
| 3. Risk Analysis |
| |
| 4. Risk Assessment | Comparison Rf1 = risk of failure in the base scenario with the thresholds of acceptability (Ta) and tolerability (Tt), where Rf1 is given by the probability of having an NPV equal to 0 | |
 |
| |
| 5. Definition of risk mitigation measures | Choice of mitigation interventions
| |
| 6. Assessment of residual risk | Comparison Rf2 = risk of failure after mitigation interventions with the thresholds of acceptability (Ta) and tolerability (Tt), where Rf2 is given by the probability of having an NPV equal to 0 | |
 |
| |
Table 2.
Degradation levels of the building heritage and dimensional data.
| Degradation Level | Average Height of Building [m] | Total Area [m2] |
|---|---|---|
| Collapsed | 4 | 633 |
| Partially collapsed | 6 | 2188 |
| Severely damaged | 5 | 3340 |
| Damaged | 6 | 182 |
Table 3.
Typological characteristics of the architectural heritage of the village.
| Typological Characteristics | Total Area [m2] | Average Surface of Single Unit [m2] |
|---|---|---|
| A. Housing units composed of a single compartment | 3430 | 50 |
| B. Two-story housing units with internal stairs | 3400 | 50 on the floor |
| C. Aggregated housing units | 3070 | 80 on the floor |
| D. Buildings of the 70s | 1770 | 200 |
Table 4.
Main assumptions underlying the financial analysis.
| Evaluation reference year | 2018 |
| Analysis period | 25 years |
| Construction phase | 2 years |
| Price system | Currents in 2018, assumed as constants for the years of evaluation |
| Residual value of the works | 11,540,698 € |
| Discount rate | 4% |
Source: Authors’ assumptions and estimation.
Table 5.
Costs of the project.
| Investment Costs [€] | |
| 1. External road reconstruction | 238,318 |
| 2. Structural recovery of the village | 6,723,415 |
| 3. Museum area | 1,124,975 |
| 4. Green area | 635,348 |
| 5. Parking spaces | 628,656 |
| 6. Furniture and equipment for services | |
| 6.1. Trattoria 1 | 155,080 |
| 6.2. Trattoria 2 | 106,493 |
| 6.3. Restaurant | 87,191 |
| 6.4. Bar with terrace | 261,948 |
| 6.5. Rental of sports equipment | 108,139 |
| 6.6. Info point and consortium headquarters | 91,045 |
| 6.7. Shops | 7714 |
| 6.8. Mill | 87,592 |
| 6.9. Dairy | 228,712 |
| 6.10. Wine shop | 58,959 |
| 7. Country-hotel furniture and equipment | 366,953 |
| 8. Cultural activities | |
| 8.1. Retro cinema | 78,090 |
| 8.2. Reading room | 288,209 |
| 9. Urban furniture | 263,861 |
| Total investment cost | 11,540,698 |
| Management costs [€] | |
| 1. Country hotel | |
| 1.1. Cleaning (from the third year) | 62,040 |
| 1.2. Ordinary maintenance (from the third year) | 10,608 |
| 1.3. Info point (from the third year) | 67,608 |
| 2. Extraordinary maintenance (from the third year) | 109,152 |
| 3. Utilities (from the third year) | 65,800 |
| 4. Promotion | |
| third year | 10,000 |
| fourth year | 7500 |
| fifth year | 5000 |
| from the sixth year | 3000 |
| 5. Annual amortization rate of the loan | 945,876 |
Source: Authors’ estimation.
Table 6.
Revenue from the project in full operation (starting from the sixth year).
| Revenue [€] | |
|---|---|
| 1. Country hotel | 1,267,300 |
| 2. Museum area | 3600 |
| 3. Work activities | |
| 3.1. Trattoria 1 | 11,040 |
| 3.2. Trattoria 2 | 10,560 |
| 3.3. Restaurant | 10,200 |
| 3.4. Bar with terrace | 16,200 |
| 3.5. Rental of sports equipment | 16,800 |
| 3.6. Consortium headquarters | 7200 |
| 3.7. Shops | 4800 |
| 3.8. Mill | 30,000 |
| 3.9. Dairy | 27,600 |
| 3.10. Wine shop | 10,440 |
| 3.11. Retro cinema | 11,400 |
| 3.12. Reading room | 6000 |
Source: Authors’ estimation.
Table 7.
Estimation of the economic performance indicators of the project.
| NPV (€) | 848,041 |
| IRR (%) | 4.60% |
Table 8.
Sensitivity analysis of critical variables.
| Variation of the NPV, due to the variation of costs for the structural recovery of the village C1 | ||||
| NPVinitial | = € 848,041 | |||
| +1% C1 | NPV(+1% C1) | = € 784,242 | ΔNPV(+1% C1) | = +8% |
| −1% C1 | NPV(−1% C1) | = € 915,267 | ΔNPV(+1% C1) | = −8% |
| Variation of the NPV, due to the variation in the housing filling index Ihf | ||||
| NPVinitial | = € 848,041 | |||
| +1% Ihf | NPV(+1% Ihf) | = € 1,098,155 | ΔNPV(+1% Ihf) | = +29% |
| −1% Ihf | NPV(−1% Ihf) | = € 597,928 | ΔNPV(+1% Ihf) | = −29% |
Table 9.
Assumptions on probability distributions of critical variables C1 and Ihf.
| Statistics | Hypothesis Values | Triangular Distribution | Hypothesis Values | Triangular Distribution |
|---|---|---|---|---|
| C1 | Ihf | |||
| Number of random tests | 10,000 | --- | 10,000 | --- |
| Base case | € 6,723,415.00 | € 6,723,415.00 | 63% | 63% |
| Mean | € 7,062,600.99 | € 7,059,585.75 | 64% | 64% |
| Median | € 7,007,401.86 | € 7,005,032.75 | 64% | 64% |
| Mode | --- | € 6,723,415.00 | --- | 63% |
| Standard deviation | € 361,970.41 | € 363,105.91 | 9% | 9% |
| Variance | € 131,022,579.151.53 | € 131,845,902,014.82 | 1% | 1% |
| Shift | 0.4836 | 0.4761 | 0.0507 | 0.0426 |
| Kurtosis | 2.41 | 5.4 | 2.37 | 5.4 |
| Coeff. variation | 0.0513 | 0.0514 | 0.1486 | 0.1475 |
| Minimum | € 6,389,077.23 | € 6,387,244.25 | 41% | 41% |
| Maximum | € 8,066,176.23 | € 8,068,098.00 | 87% | 87% |
| Average standard error | € 3619.70 | --- | 0% | --- |
Table 10.
Analysis results for the NPV and the IRR.
| Statistic | Forecast Value | |
|---|---|---|
| NPV | IRR | |
| Number of random tests | 10,000 | 10,000 |
| Base case | € 856,697 | 4.60% |
| Mean | € 535,101 | 4.37% |
| Median | € 587,438 | 4.41% |
| Mode | --- | --- |
| Standard deviation | € 343,198 | 0.24% |
| Variance | € 117,785,120,446 | 0% |
| Shift | −0.4836 | −0.4162 |
| Kurtosis | 2.41 | 2.33 |
| Coeff. variation | 0.6414 | 0.0554 |
| Minimum | −€ 416,428 | 3.73% |
| Maximum | € 1,173,696 | 4.84% |
| Average standard error | € 3,432 | 0% |
| Number of random tests | 10,000 | 10,000 |
| Base case | € 856,697 | 4.60% |
Table 11.
Increase of the promotion costs of the widespread-hotel.
| Promotion Costs [€] | ||
|---|---|---|
| Initial | Post mitigation action | |
| third year | 10,000 | 50,000 |
| 4th year | 7500 | 37,500 |
| 5th year | 5000 | 25,000 |
| from the 6th year | 3000 | 15,000 |
Table 12.
New assumptions on probability distributions of critical variable Ihf following the mitigation intervention.
Table 12.
New assumptions on probability distributions of critical variable Ihf following the mitigation intervention.
| Statistics | Hypothesis Values | Triangular Distribution |
|---|---|---|
| Ihf | ||
| number of random tests | 10,000 | --- |
| Base case | 64% | 64% |
| Mean | 72% | 72% |
| Median | 74% | 74% |
| Mode | --- | 80% |
| Standard deviation | 8% | 8% |
| Variance | 1% | 1% |
| Shift | −0.4928 | −0.486 |
| Kurtosis | 2.41 | 5.4 |
| Coeff. variation | 0.1101 | 0.1109 |
| Minimum | 50% | 50% |
| Maximum | 87% | 87% |
| Average standard error | 0% | --- |
Table 13.
Analysis results for IRR following the mitigation intervention.
| Statistic | Forecast Value |
|---|---|
| IRR | |
| number of random tests | 10,000 |
| Base case | 4.82% |
| Mean | 4.60% |
| Median | 4.63% |
| Mode | --- |
| Standard deviation | 0.25% |
| Variance | 0.00% |
| Shift | −0.3997 |
| Kurtosis | 2.31 |
| Coeff. variation | 0.0534 |
| Minimum | 3.95% |
| Maximum | 5.07% |
| Average standard error | 0.00% |
© 2018 by the authors. Licensee MDPI, Basel, Switzerland. This article is an open access article distributed under the terms and conditions of the Creative Commons Attribution (CC BY) license (http://creativecommons.org/licenses/by/4.0/).
Share and Cite
MDPI and ACS Style
Nesticò, A.; He, S.; De Mare, G.; Benintendi, R.; Maselli, G. The ALARP Principle in the Cost-Benefit Analysis for the Acceptability of Investment Risk. Sustainability 2018, 10, 4668. https://0-doi-org.brum.beds.ac.uk/10.3390/su10124668
AMA Style
Nesticò A, He S, De Mare G, Benintendi R, Maselli G. The ALARP Principle in the Cost-Benefit Analysis for the Acceptability of Investment Risk. Sustainability. 2018; 10(12):4668. https://0-doi-org.brum.beds.ac.uk/10.3390/su10124668
Chicago/Turabian StyleNesticò, Antonio, Shuquan He, Gianluigi De Mare, Renato Benintendi, and Gabriella Maselli. 2018. "The ALARP Principle in the Cost-Benefit Analysis for the Acceptability of Investment Risk" Sustainability 10, no. 12: 4668. https://0-doi-org.brum.beds.ac.uk/10.3390/su10124668
Note that from the first issue of 2016, this journal uses article numbers instead of page numbers. See further details here.