Measuring the Benefits of the “One Belt, One Road” Initiative for Manufacturing Industries in China


1
Business School, Hubei University, Wuhan 430062, China
2
Department of Information Management, National Kaohsiung University of Science and Technology, 824 Kaohsiung, Taiwan
*
Author to whom correspondence should be addressed.
Sustainability 2018, 10(12), 4717; https://0-doi-org.brum.beds.ac.uk/10.3390/su10124717
Submission received: 8 October 2018
/
Revised: 3 December 2018
/
Accepted: 5 December 2018
/
Published: 11 December 2018
(This article belongs to the Special Issue Transition from China-Made to China-Innovation
)
Abstract
:China has shifted its focus from export-led growth to technology-driven growth. The “One Belt, One Road” initiative (OBOR) is aimed at promoting economic integration with the rest of the world that might boost China’s ability to upgrade its manufacturers. We evaluate the impact of the OBOR initiative on the manufacturing industries of China. In other words, we examine whether the greater openness entailed by the initiative has been a catalyst for upgrading China’s export portfolio. We demonstrate that the proposition has been such a catalyst formally and adduce some empirical support for the proposition by using a panel of the top 80 exporting countries in the world during the period from 2002–2017 to evaluate the impact of the economic integration brought by the OBOR in terms of upgrades to Chinese manufacturers. Meanwhile, when domestic R&D generates knowledge spillover, the benefits of greater openness become partly indeterminate, thus counterfactual analysis was adopted to preclude potential endogeneity. By relating the values of exports at the two-digit harmonized system level to data on sectors to conduct integration within global production networks, we find that the greater openness brought by the OBOR initiative has actively increased manufacturing complexity and facilitated industrial upgrading in China.
1. Introduction
This paper proposes to measure the impact of the “One Belt, One Road” (OBOR) initiative on the manufacturing complexity and upgrading of China. To examine whether the greater openness entailed by the initiative has been a catalyst for upgrading China’s export portfolio, we use information on the exports of 80 countries and Chinese manufacturing industries during the 2002–2017 period. We compile 2-digit Harmonized System classifications for different product categories and matching statistics for the corresponding sectors in China for a complete observation. By scrutinizing the relevance of the OBOR initiative to China’s industrial progress, we clarify that greater integration would boost a country’s ability to upgrade its industries and provide a new pillar for domestic economic growth.
We notice that one of the difficulties in fulfilling the aim of this study is proving that there is no endogenous relationship between the objects of study, that is, the greater openness and the upgrading of domestic manufacturing, since, as Helpman [1] points out: “not only technology affects trade, but also trade affects the evolution of technology”. As economics are driven by common factors, information on other countries not subject to the Chinese policy could be used to construct a counterfactual of China for comparing an experimental result of policy [2]. Specifically, this counterfactual method would be adopted for an evaluation of the “One Belt, One Road” policy.
China was an extremely poor country in 1979. However, General Secretary Deng Xiaoping promoted an opening and reform policy for modernization and industrialization that established the future prosperity of China at the end of the last century. After the country’s door had been opened, China specialized in the export of just a handful of primary products. Wealthy nations like the US facilitated trade with the still undeveloped China, which obtained substantial material benefits from these trade relationships due to the increased volume of capital entering its economy [3]. Learning from world industrial leaders, China underwent an amazing metamorphosis, from a country with a primarily agricultural economy to a giant exporter. Over the past 40 years, China has experienced faster growth than the world average, and its export competitiveness has been an important determinant of its effective integration into the rapidly globalizing world economy.
However, due to a shortage of innovation, China’s rapid annual GDP growth has slowed in recent years, from around 12% to 6.2–7.0%, leading the new administration to initiate the “One Belt, One Road” economic zone construction to promote trade and greater integration with the rest of the world, and thus, ease the recent period of relative economic stagnation. Because China’s economy was growing rapidly in the years prior to the greater openness entailed by this new policy, questions have been raised about the impacts of the “One Belt, One Road” initiative on the manufacturing complexity of China. As a matter of fact, since China began promoting its “One Belt, One Road” initiative aimed at deeper integration with the rest of the world in September 2013, China’s trading volume has been about 2012 billion US dollars [4], its GDP per capita has been 10,893.64 US dollars [4], and its manufacturing complexity as computed by the formula of Hausmann et al. [5] has been around 5240 units.
The “One Belt, One Road” initiative, which was adopted as the main policy of Xi Jinping in October 2012 and was officially announced in September 2013, represents his administration’s attempt to lay the foundation for a more active and distinctive foreign policy [6]. In autumn of 2013, President Xi stated that his plans for the initiative consisted primarily of transportation projects aimed at enhancing China’s economic integration with Central Asia, the Persian Gulf, the Mediterranean, Central and Eastern Europe, and ultimately, Germany and the Netherlands [6]. The OBOR initiative will potentially involve over 60 countries and economic zones with a combined population of 4 billion people, the markets of which account for more than 1/3 of global GDP [6]. The OBOR policy is aimed at promoting China’s integration with the world, and much greater involvement in projects overseas might help Chinese firms to become more internationally competitive. At the same time, one rationale for the OBOR policy is that it is primarily aimed at developing the western parts of China, which have been left behind by the eastward export-oriented strategy of the last four decades [6]. Given the general success of that latter strategy, there are now more potential openings for trade with western countries than in East Asia. Meanwhile, by opening up through economic integration, China might build its learning and industrial base to meet the requirements of efficient high-tech production in order to better sustain its long-term growth.
In this paper, we evaluate whether the OBOR initiative has facilitated the upgrading of Chinese manufacturers via greater economic integration with other countries. In this regard, the paper constitutes a first attempt at an intensive examination of the deeper economic integration experience of China at the industrial level. In Section 2, we will paint a vivid picture of China to introduce the research background, and discuss related studies. Section 3 proposes the basic model. Section 4 solves the potential endogeneity problem by constructing counterfactuals to prove the policy effectiveness of the OBOR initiative. After the endogenous control process has been completed, the Ordinary Least Square method (OLS) is used to evaluate the impact of the OBOR on within-country-sectors, and the empirical results are presented in Section 5, and conclusions are presented in Section 6.
2. Background and Literature Review
2.1. The Background
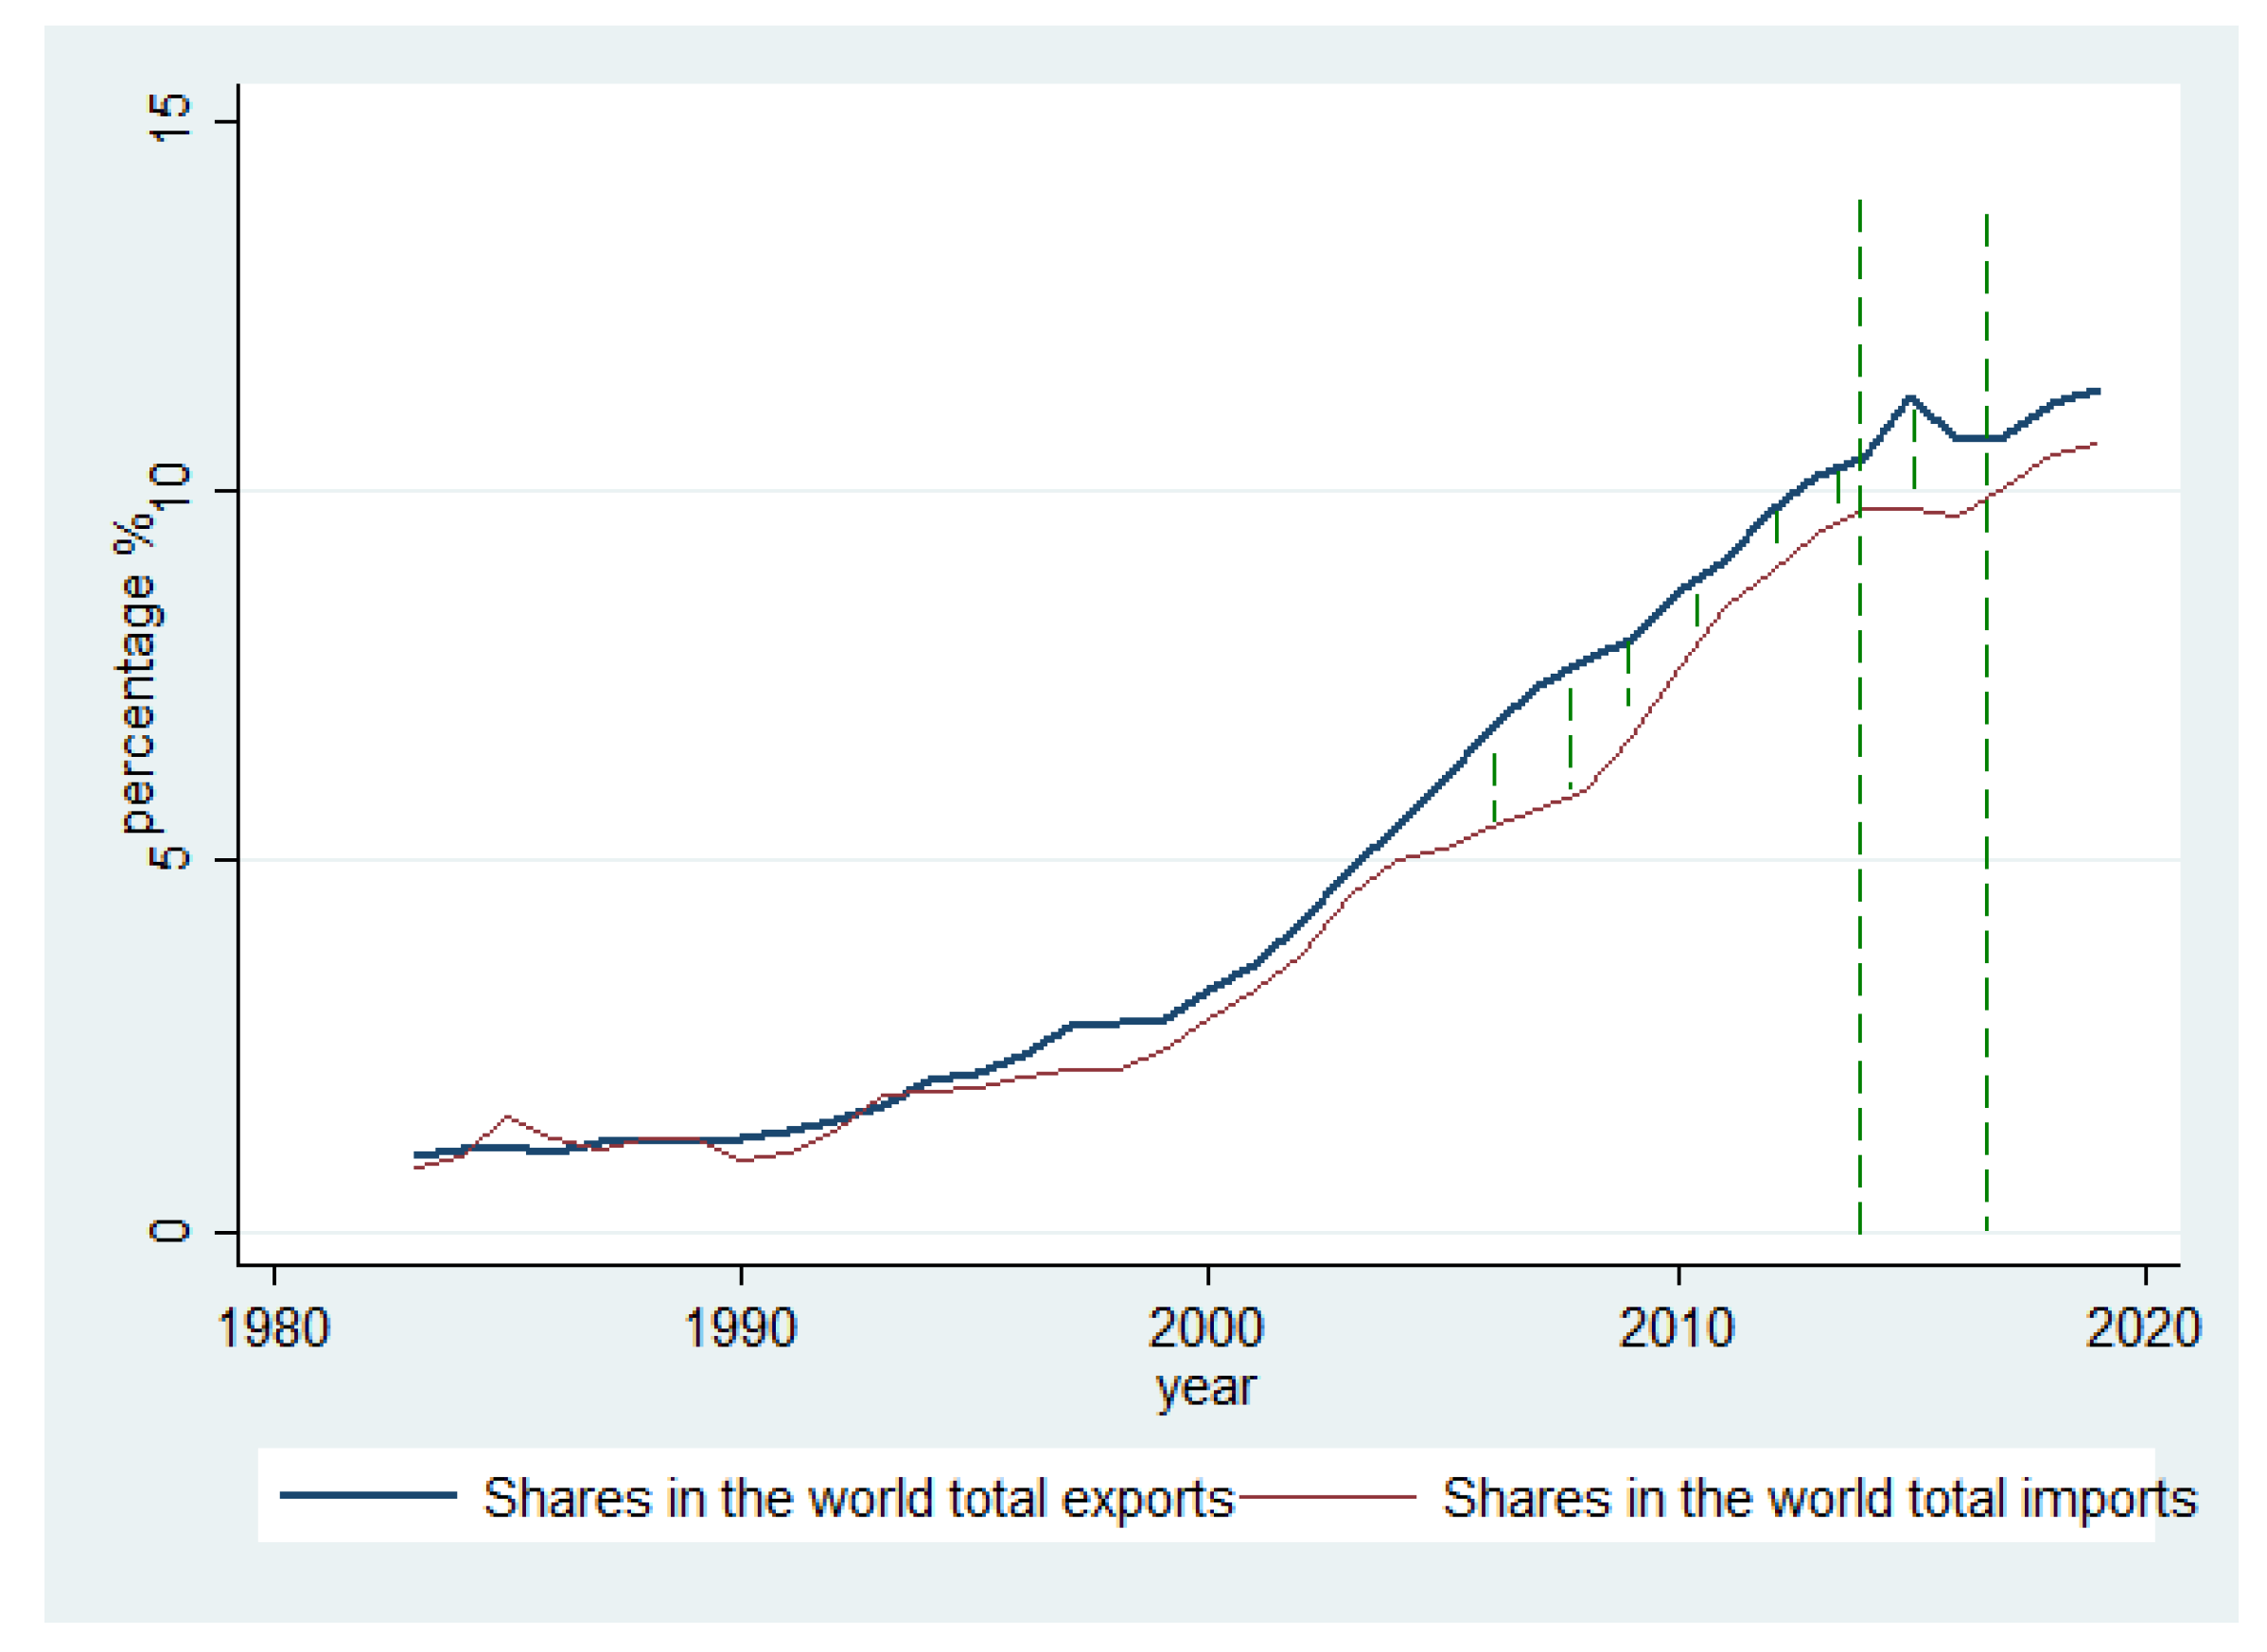
In 1979, China introduced its open-door approach in order to initiate its own industrialization. Although only four areas have been designated as Open Areas (The Hainan Island Economic Zone, 1982; and the Fujian, Zhujiang, and Changjiang in 1984.), this strategy has formed an important pillar to support China’s ambitious industrialization and modernization [7]. The resulting export-led growth appears to have been the engine behind this Asian miracle [8]. The total exports from China increased from 8 billion US$ in 1979 to more than 2.2 trillion US$ in 2017 [9]. In 40 years of reform and development, China has grown its share of the world market from less than 1 percent to 11 percent (Figure 1). This phenomenal export expansion has been caused by the dramatically changing composition of the Chinese export basket, which has shifted away from primary products toward manufactured goods [10]. In fact, the share of manufactured goods in China’s export basket now exceeds 89%, which is well above the world average of 70% [10]. In short, the integration of domestic manufacturing within the global production network has allowed China to become a major exporter in the world market.
China has enjoyed both rapid technical progress and traditional static gains from trade. As a developing country, China has rapidly increased its share of the manufacturing trade (Figure 1), with its total global market share being approximately 11% in 2018. From the descriptive statistics, however, we can see that there was a small peak in China’s share of the global market during the period from 2016–2017 (Figure 1).
China used to enjoy a comparative advantage in labor-intensive manufactured exports after joining the World Trade Organization (WTO). However, if China continued to mainly produce labor-intensive consumer goods in which it has a comparative advantage, the terms-of-trade of its exports would decline, and hence, China would be a net loser even if it exports greater volumes. This lesson had to be learned, and China’s exports have become more diversified with a rising share of manufactured goods. The statistics indicate that China’s export basket has diversified, since 2007, from primary products and household supplies to a wider spectrum that includes electronic products and general equipment [11]. Since 2010, China’s exports have not consisted just of labor-intensive commodities but also capital- and technology-intensive ones [12]. Since 2016, moreover, the share of medium- and high-technology manufacturing products in China’s export basket has exceeded 70%.
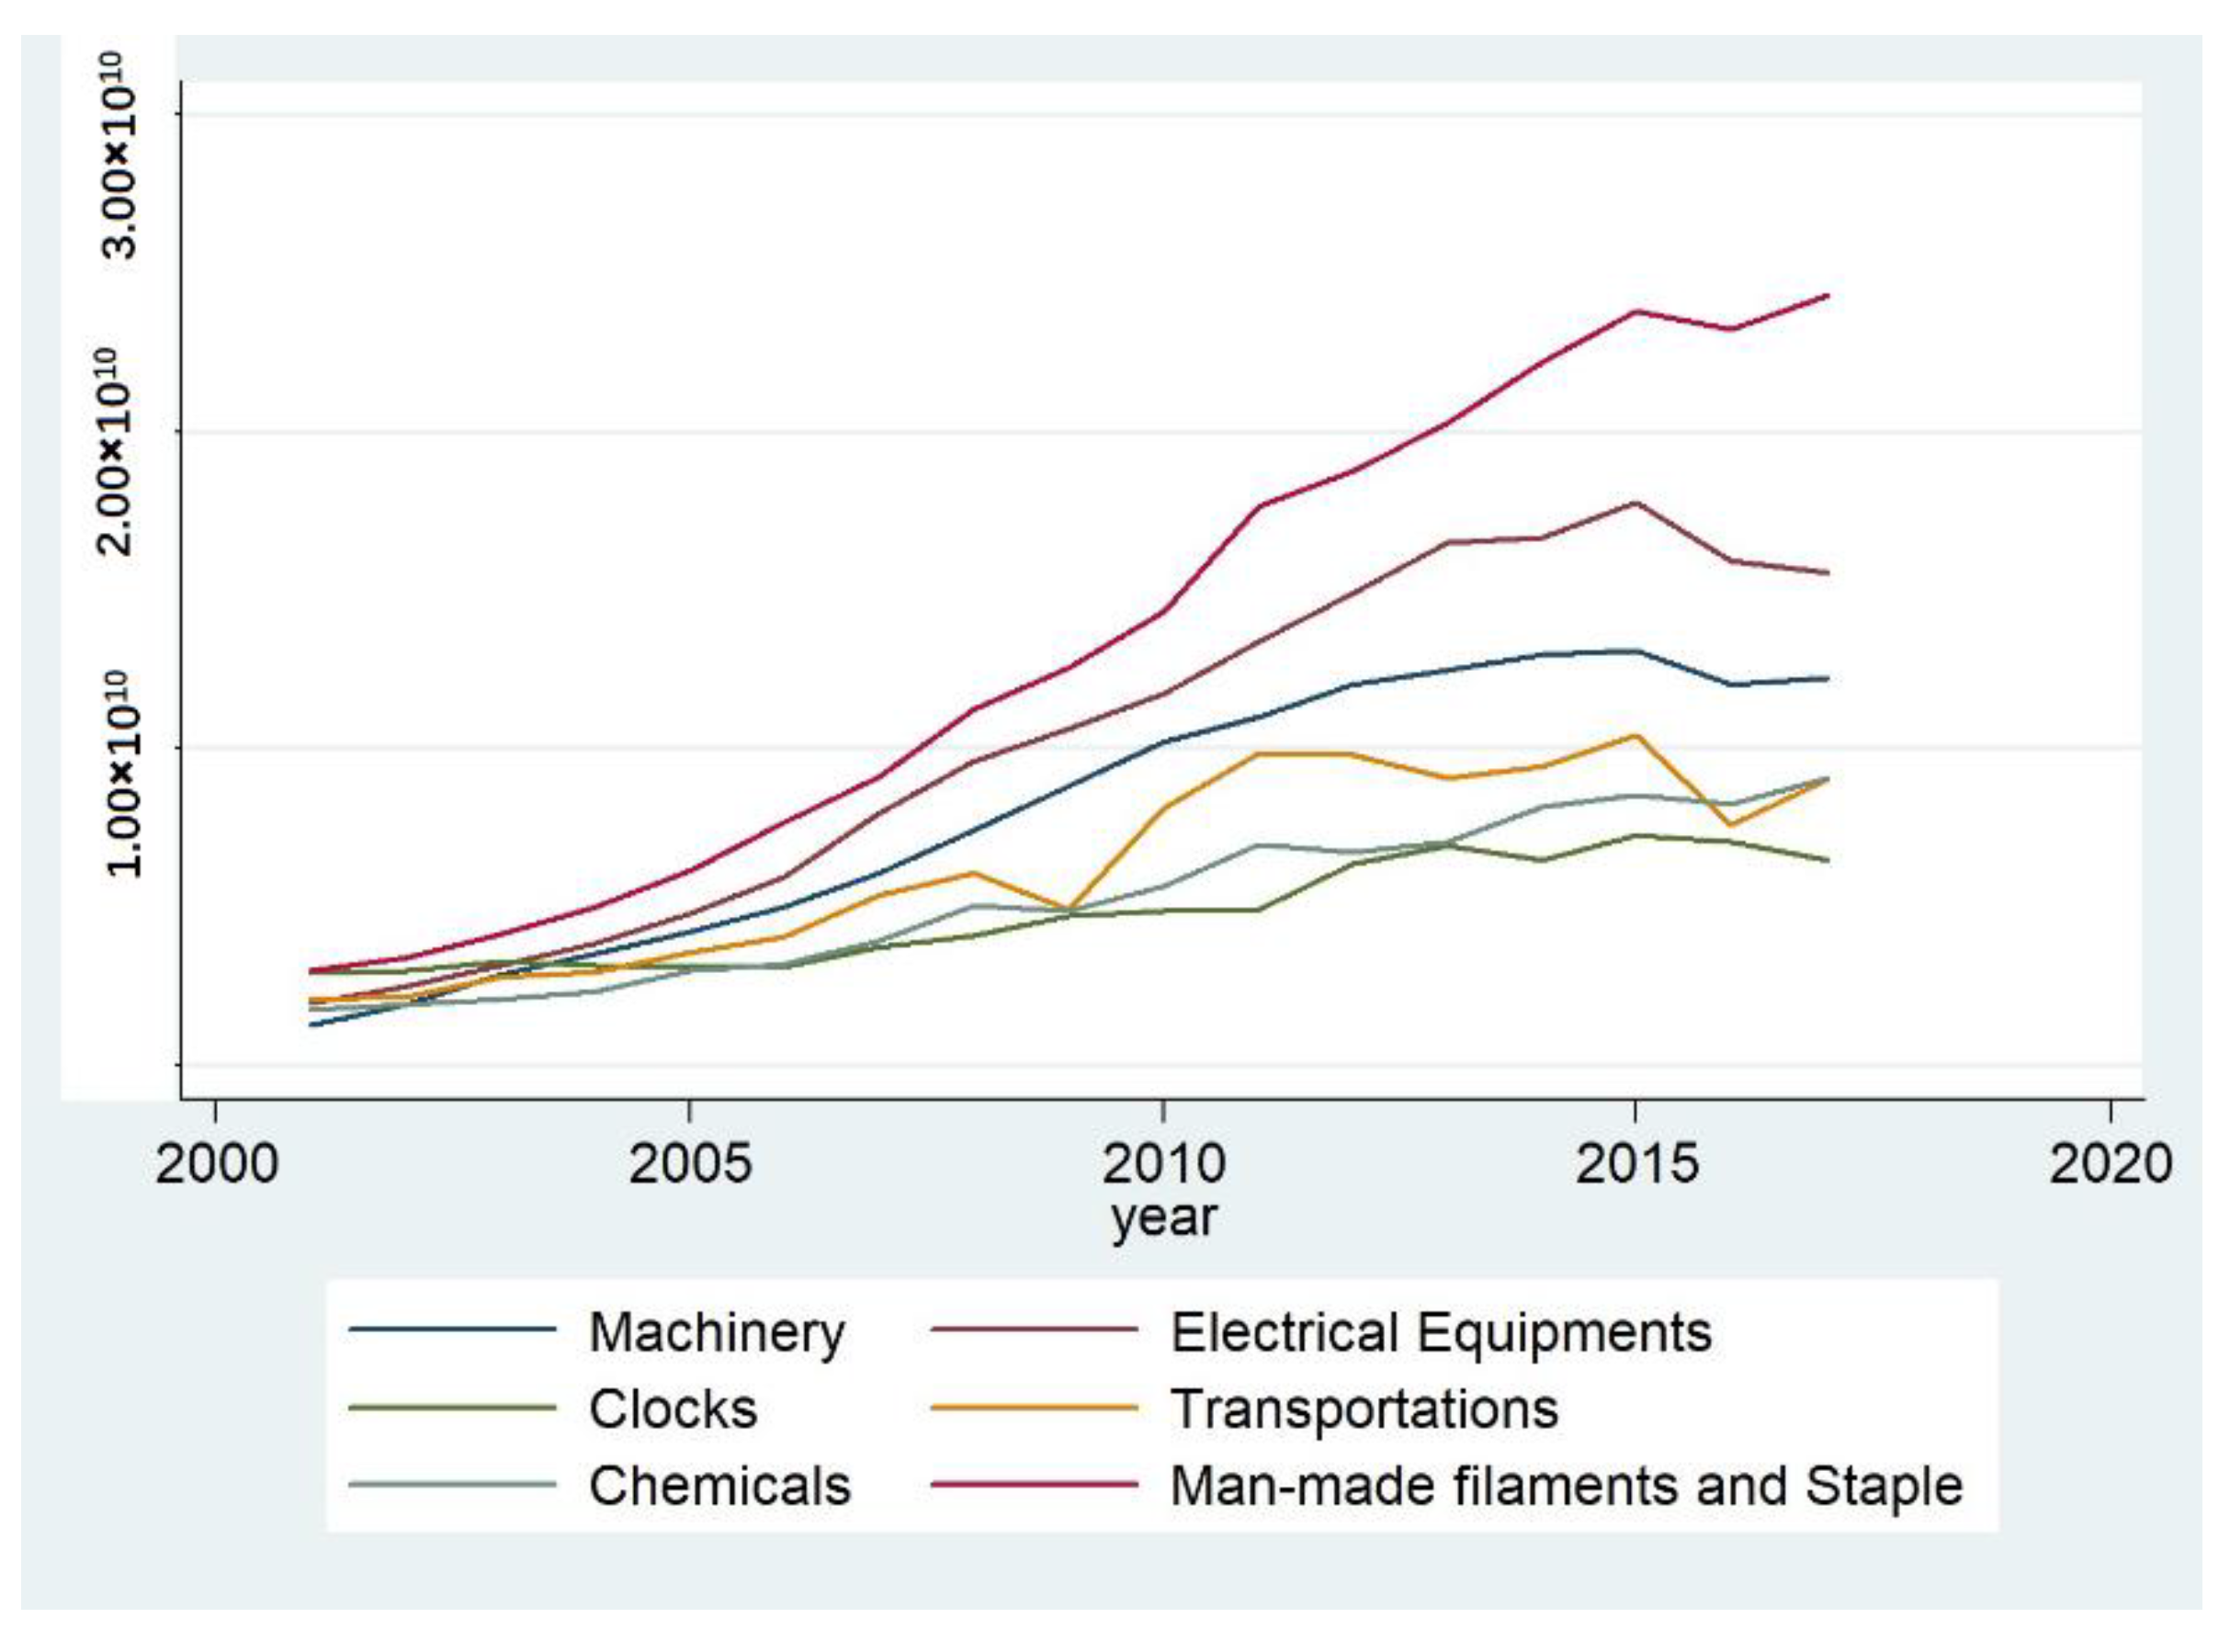
In continuing this transformation, China aims to become an advanced technology superpower by further shifting its export composition away from standard labor-intensive products towards high-tech product lines within global production networks [10]. Relatedly, its share of manufactured trade is rising rapidly in the high technology area (Figure 2).
The rapid pace and success in the industrialization of export-led manufacturing has resulted in these manufacturers becoming the major driver of Chinese industrialization in general. Township and village enterprises have played the most important role in exporting thus far, and there is a large productivity gap between the private sector and the public sector [13]. This is largely because inland state-owned firms have few outside links and mainly produce for the domestic market, i.e., they engage in inward-looking industrial activities. At the same time, because such enterprises consume much of the hard currency earned through the export of primary products, the Chinese economy has been facing stagnation. Sustaining the rising production of complex industrial products requires advanced organizational expertise, high levels of investment, forefront technologies, intense inter-industry linkages, and brand differentiation [10]. China’s simple low-cost advantages of the past, especially that of unskilled labor, do not count for much in the fast-changing world any more.
To achieve further growth in the face of these challenges, China is seeking opportunities to move up the technology and skill scale through greater reform and opening. Since the aforementioned inland enterprises are precluded from enjoying the benefits of foreign technology spill-over, the “One Belt, One Road” initiative would seem to constitute the deeper opening policy aimed at spurring the growth of industrial enterprises with competitive ability in international markets to foster new products and new technology and management skills through joint ventures with foreign concerns. In effect, Chinese policy-makers have opted to make innovations and entrepreneurship the new drivers of economic growth over the coming decades [12,13].
The OBOR initiative is intended to be built upon upgraded and fast transcontinental railway routes, highways, and port facilities; this makes it an enormously ambitious plan for long-term infrastructural development that will take decades to complete [7]. Meanwhile, it should be noted that this initiative would lead to weaker cross-border integration, since it focuses on creating transport linkages between countries, while leaving the production structure in each country untouched [7].
For long-run economic development, China requires deep-seated changes in the quality of the economic growth that takes place as a result of the scientific and technical revolution. Nevertheless, the promotion of export-oriented manufacturing as a complementary part of the industrial policy should still have the most significance in China [8]. Through further opening and economic integration, China can potentially build its learning and industrial base to meet the requirements of efficient high-tech production that can better sustain long-term growth. As shown in Figure 1, there was a small peak in China’s global market share after the initial implementation of the OBOR policy. Relatedly, Chen et al. [14] proved that there was a stimulatory effect of the “One Belt, One Road” initiative on Chinese trade volume.
The purpose of this article is to examine the possible differences in the nature of deeper openness to the rest of the world and the relevance of the “One Belt, One Road” initiative to China’s industrial progress, and to present a lucid account of the remarkable changes in the sophistication of individual manufacturing industries.
2.2. Literature Review
China’s economic integration with multinationals can affect its production capacity and composition of exports in many ways. It is important to engaging in production of more sophisticated and high-tech goods than those previously produced by the host country [8]. The entry of multinationals often leads to knowledge spillovers to local enterprises and industries for production upgrading [8]. In this case, the greater openness and economic integration brought by the “One Belt, One Road” initiative will presumably facilitate China’s industrial upgrading either through learning effects or establishing commercial linkages. According to the World Bank Survey 2012, one fifth of local enterprises acknowledge the modelling effect of foreign companies and claim they have learned about the availability of advanced technologies in their sector. Given the undoubted modelling effect of international giants, Chinese firms are seeking opportunities to participate in multinational production networks for survival in this fast-moving market.
The rationale behind this study is that the knowledge spillover from economic integration would boost production capacity and composition, and possibly a manufacture upgrading. It is necessary to clarify the factors of production for buildup of an industry development framework. Since this study is focused on the benefits from free trade and economic integration to domestic industries, we might begin with the relevant literature regarding how trade liberalization has affected the growth of the developing world. In 1878, the politician Kwang Chang Ling proposed that the US and China should build relationships on the principles of free trade and racial harmony, which could result in unprecedented levels of prosperity in both countries across the Pacific [3]. Subsequently, Alexander Del Mar lodged the criticism that scholars had failed to recognize the benefits brought by free trade [3]. Perhaps economists have, with few exceptions, overlooked free trade’s impressive array of stable, intellectual, and political contributions to industries and economic development. Hausmann and Rodrik [5] take a simple view of growth fundamentals, with their view being that industrialization in developing countries only requires foreign technology and good institutions. Meanwhile, Grossman and Helpman [15] discuss to what extent and in what ways free trade might serve as an engine of advanced industrialization, noting that as international trade provides sets of opportunities for investments and knowledge capital, innovations, advanced manufacturing, and remanufacturing commonly appear in the open economy.
There are numerous authors who have consistently stressed the importance of free trade given its natural power for equalizing social and economic progress [3]. Countries enjoy both rapid technological progress and the traditional gains from international trade, and hence, also experience improvement in their inter-temporal welfare [16]. Openness and integration induce scientific and technical revolutions in developing countries that can lead, in turn, to advanced manufacturing [17]. Economic integration leads to the closing of development gaps either through learning effects or the establishment of commercial linkages [17]. In this case, openness and integration would induce scientific and technical revolution in developing countries for advanced manufacturing [18]. Relatedly, export-led industrialization has driven most Asian countries to prosperity [7].
Given that Sarkar [19] has shown an insignificant long-term relationship between openness and growth in most East Asian countries during the 1961–2002 time period, policies aimed at opening up to the outside world seem only to have worked for countries in the middle-income group. Countries are required to finance increasing imports of machines and technology to continue the progress of rapid domestic industrialization. This requirement results, in turn, in massive demand in foreign exchange, which draws attention to export earnings growth [18]. The ultimate goal of trade is to assist developing countries towards industrialization and manufacturing upgrades. Exporting widely to the world could spur the economies of such countries to higher productivity, but whether it does so depend not only on how much they export but also on what they export and with whom they trade [20]. Studies of US trade patterns have concluded that US manufacturing exports exhibit the quality of being high-tech-intensive [21]. This means that maintaining a large trading volume is not the priority any more for middle-income countries, but such high-tech intensiveness shows the potential of domestic industries.
It is useful to consider both learning and economic scale as determinants of comparative advantage brought about by international trade [10]. Hausmann et al. [5] have demonstrated that the mix of goods that a country produces may have important implications for industrial development, and show a positive link between a country’s export basket and its productivity. Anand et al. [20] have shown that trade liberalization has had a positive impact on the complexity of India’s export basket. Meanwhile, Harding et al. [8] shifted the focus of debate away from the mere fact of exporting and toward the importance of export composition for growth. It is widely believed, relatedly, that making computers is better than frying potato chips; “you become what you do” is indeed true. Upgrades to production and climbing up the export chain have been instinctively adopted by politicians as an economic strategy. However, there are numerous obstacles that developing countries face in upgrading their exports given their limited capital stock and the limited skills of their labor forces. Also, there are differing opinions regarding the proportions by which different types of products account for China’s exports [12]. Some argue that Chinese exports are still primarily labor-intensive and resource-based, whereas others have found more skill-based and sophisticated exports [12]. Rodrick’s [10] research shows that China is an outlier in terms of its overall exports’ sophistication. He concluded that “China’s export bundle is that of a country with an income per capita level three times higher than that of China” [10]. The diversification of China’s exports has been confirmed by its highlighting of the higher technology content of those exports [12].
China is seeking opportunities to move further up the technology and skill scale. Gaulier et al. [22] found that the evolution of the Chinese trade structure is the result of its integration into international production processes. Harding et al. [8] present evidence suggesting that attracting foreign direct investment (FDI) offers potential for upgrading the export baskets of developing countries, as the entry of multinationals could facilitate domestic product upgrades through knowledge spillovers. Chinese policy-makers adopted the “One Belt, One Road” initiative in order to attract foreign partnerships and make innovation the new driver of economic growth in the coming decades. However, no attempt has been made thus far to examine whether the “One Belt, One Road” initiative has begun to assist with industrial upgrading in China. Meanwhile, the existing analyses are of aggregate trading volume in China, and thus, may obscure significant changes occurring in the trade patterns and industrial models of each industry. Filling this knowledge gap is important for broadening our understanding of China’s evolving and engaging role in the global economy, and also might provide evidence for evaluating its industrialization process.
3. The Basic Model
The rationale behind this study is the view that knowledge spillovers should boost production capacity and composition, which might lead, in turn, to manufacturing upgrades. First of all, it is necessary to clarify the factors of production in order to build up an industry development framework. Solow [23] set up a traditional growth accounting framework that recognizes production inputs and technological progress as key factors in spurring economic growth. Grossman [24] and Helpman [1,25] regard product innovation as the process of generating a range of differentiated products that is expanded by resource accumulation. Obviously, active international trade would facilitate the resource accumulation required for product innovation and productivity boosts among manufacturing industries.
More recently, Hallak et al. [26] have enriched the growth model by distinguishing two sources of productivity from production and process, and they predict that trade delivers export premia that enable exporters to sell higher quality products, charge higher prices, and use capital more intensively. Based on the theory of Hallak et al. [26,27], we extract a framework to illuminate the rationale of export-led manufacturing progress. If the total demand of product is
In Equation (1), represents the product category, is the quality, is the price, is the quality of category , and the elasticity of demand is larger than one. is the total potential sales of the exporter in domestic and foreign markets, obviously, larger markets promote higher production quality.
represents the quality preference, while (process productivity) captures an exporter’s ability to produce a given level of a product at low variable cost. The marginal cost (MC) is given by Equation (2), where is a constant and is the quality elasticity of marginal costs.
Equation (3) accounts for the fixed costs (F) in production. Here, is interpreted as the product productivity, is a constant, and is the product condition elasticity of fixed costs. Equation (4) shows that exporters try to minimize fixed costs and marginal costs for the sake of profit maximization.
Similar to the Equation (1), Equation (4) demonstrates that the process productivity () and the product productivity () would be increased by market expansion (), which gives a theoretical framework for export-led growth and industrial development.
Based on the neoclassical model of production, Hausmann and Rodrik [5,28] predict that poor countries will experience rapid convergence with the developed world once they have access to state-of-the-art technologies and good institutions. In this view, there are priority policies such as those encouraging trade liberalization, lower costs of trading, free capital flow, improved infrastructures, labor market flexibility, and innovative environments that can draw an economy into high productivity [20]. Grossman et al. [24] discuss to what extent and in what ways international trade and economic integration might enhance trade performance and serve as an engine of industrialization and economic growth. All in all, the key factor is the knowledge accumulation in domestic manufacturing industries for any further upgrading.
To clarify the rationale behind the study, we propose that attracting economic integration with multinationals can affect the production capacity and composition of exports through two channels: The first is by engaging in the production of more sophisticated and high-tech goods than those previously produced by the host country [8]. Second, the entry of multinationals can lead to knowledge spillovers to local enterprises and industries that result in production upgrading [8]. In this case, the greater openness and economic integration brought by the “One Belt, One Road” initiative will presumably facilitate China’s industrial upgrading either through learning effects or the establishment of commercial linkages.
3.1. The Empirical Model
We measure the export sophistication of China to reflect its manufacturing upgrades. Firstly, we propose to adopt the Panel Control method of Hsiao et al. [2] in order to solve the potential endogeneity problem of our research subjects. After the effectiveness of the OBOR policy has been proved and the causality of economic integration and the export structure has been clarified, the OLS estimations will be adopted for accurate policy evaluation.
Although openness and economic integration have been measured in various ways, they share a common feature in that they express trade in terms of its share of output for a given industry in one country [29]. As we have learned from most of the studies in this area, the openness among industries has been measured as (Exports+Imports)/Value-added or Exports/Value-added, which is referred to as the export share in total output [29]. Total employees and total fixed assets ( accounted for with a 4.85 percent annual depreciation rate) is taken to be a measure of human capital inputs and investments for each manufacturing industry. Excluding the contributions of new product design, labor, and capital inputs, our empirical analysis aims to show that there is a significant impact from economic integration promoted by the “One Belt, One Road” initiative on Chinese exports’ sophistication and trade structure.
3.2. Construction of Exports’ Sophistication
We illustrate the measurement of export sophistication to reflect the upgrading of manufacturing industries. Balassa [30] quantifies an exporter’s manufacturing competitiveness by dividing the exporter’s share in the export of a given product by its share in the combined exports of manufactured goods of all industrial countries in the global market. Based on Balassa’s method [30], Globerman [21] calculates the competitiveness and sophistication of a given manufacturing industry in a given country by dividing the value of the industry’s exports by the total value of global exports in the same year. The size of industries has been standardized by dividing the industrial exports by the total trade value at the industry-level. Their index of industry exports sophistication or trade performance for a country would be presented as:
where is the country’s exports of the th industry; is the world total exports of the sample industries, is the total shipments of the th industry, and is the total trade for the global markets [21]. In our case, is China’s exports of the th industry; is the total exports of the top 80 exporters in the sample industries, is the total shipments of the top 80 exporters of the th industry, and is the total trade of the top 80 exporters for the global markets. This measurement would provide relative competitiveness and sophistication comparisons for the manufacturing industries of different countries. The average among selected sectors has been calculated for 80 countries and is listed in the first column of Table A1.
Trade performance and manufacturing competitiveness are determined by accounting for both technology and quality factors. In recent years, the trade performance of China has shown significant growth accompanied by an increasing share of high-tech exports. Likewise, the upgrading of manufacturers is assessed by comparing China’s market share and competitiveness with that of the rest of the world in terms of a broad export basket [12]. Therefore, we measured the export sophistication of China to reflect its manufacturing upgrades. Based on the method of Balassa [30] and Hausmann and Rodrik [5], we calculated the comparative export basket complexity of major exporters in the world, and the results are listed in the third column of Table A1.
4. Treatment Effects of the OBOR Initiative to Manufacturers in China
4.1. Data
To learn more about the potential impacts of the OBOR initiative on Chinese industries, this paper used the export data of countries with annual total exports exceeding 10 million US dollars to predict the relative export sophistication of China in the absence of the OBOR intervention (the observed countries are listed in Table A1). The cross-country export data is available in the UN Comtrade database and ITC statistics. We compiled 2-digit Harmonized System (HS) classifications for different product categories and matching statistics for the corresponding sectors in China for a complete observation [31]. Table 1 shows the statistical values of China’s exports, outputs, assets, and employees at the industrial level from 2002–2017 that were obtained from the China Entrepreneur Investment Club Statistical database. The United Nation trade data has covered all major exporters in recent years. Our sample covers the top 80 exporters in the world from 2002–2017, and the export basket complexity values (calculated based on the method of Balassa [30]; Hausmann and Rodrik [5,28]) for each country are listed in the Table A1.
Our analysis relates the values of exports at the two-digit HS level to data on sectors in China treated as a priority in conducting integration within global production networks. The sectors are classified by technological characteristics. Lall [32] uses a four-fold technological categorization: resource-based, low-tech, medium-tech, and high-tech manufacturers. Resource-based products are mainly foods and beverages, refined petroleum, leather, and rubber. Low-tech manufacturers produce textiles, toys, furniture, simple metal products, and glassware. Medium-tech manufacturers utilize complex but not fast-moving technologies to produce machinery, chemicals, and simple electronics. High-tech industries include those that produce complex chemicals, pharmaceuticals, automobiles, aircrafts, and ships. China has high growth rates in each category. Nonetheless, the share of low-tech manufacturers in the Chinese export basket is declining steadily, largely compensated for by a rise in high-tech manufacturers. The descriptive statistics show that the production level of high-tech manufacturers has already exceeded those of medium- and low-tech manufacturers since 2016.
We included the export sophistication of China in logarithmic form, and use it to reflect its manufacturing upgrades at the industrial level (Table 1). In general, the statistic shows that there has been a rapid and sustained technological upgrading of China’s export basket.
4.2. Tests for Significance of the OBOR Policy Intervention
We propose to evaluate the impact of the “One Belt, One Road” initiative on manufacturing industries of China. However, when domestic R&D generates knowledge spillover, the benefits of greater openness become partly indeterminate. To examine the relationship between the greater openness brought by the OBOR initiative and the Chinese manufacturer complexity, we adopted the counterfactual approach and the Panel OLS method.
In this section, we evaluate the effectiveness of the OBOR policy by adopting the Panel Data Control method of Hsiao et al. [2], which can be seen as an endogenous control process. The counterfactual approach of Hsiao et al. [2] shares the rationale of the difference-in-differences approach. We compare the Chinese aggregate manufacturer complexity before and after the OBOR initiative implementation to the Chinese aggregate manufacturer complexity without the initiative (a synthetic counterfactual) during the same time period. The effect of the economic integration policy, then, is just the difference between the outcome with the experiment and the one without; in this manner, we focus on the impacts of the policy on the upgrading of manufacturing industries in China.
Since we cannot simultaneously detect the competitiveness of Chinese manufacturing industries under the OBOR initiative and without the initiative, it is necessary to construct the counterfactual of a China that has not experienced the policy. Applying the approach of Hsiao et al. [2], we use other countries’ exports sophistication to predict what would have happened to China had it not been subject to the OBOR policy intervention. In their method, the cross-sectional dependence is attributed to the presence of common factors that drive all the relevant cross-sectional units.
Let denote the manufactures’ competitiveness of China at year t under the OBOR policy intervention and denote the manufactures’ competitiveness of China at year t without the policy. The treatment effect of the OBOR policy for Chinese manufacturing competitiveness and export sophistication at year t is
The observations for other countries could be used to identify the number of common factors, K, and estimate by the maximum likelihood procedure [33]. In our case, the panel control method has been adopted to predict by in lieu of [2]. We assume the idiosyncratic components are uncorrelated across the selected countries, which means the OBOR policy intervention on China has no bearing on the idiosyncratic components of the selected countries. Hence, the contamination in the control group synthetic procedure could be avoided.
Instead of using the Akaike Information Criterion model employed in Hsiao et al. [2]’s approach, we adopted the elastic-net selection method for selecting the most relevant cross-sectional economies with which to construct the counterfactuals of China [34]. With an improved penalization on coefficients, the elastic-net selection method can screen out the most relevant predictors for the control group synthesis [35]. Although there are numerous countries available for the control selection, the elastic-net selection method only selected out the 10 most relevant predictors for synthesizing the counterfactuals. Table 2 lists the 10 candidates for the control group that were selected by the elastic-net method of Zou et al. [34]. The computation package of lasso in STATA is available at http://fmwww.bc.edu/RePEc/bocode/l.
According to Chen et al. [14], the participants in the OBOR initiative and China’s Asian neighbors should be excluded as control units without the treatment. Our selected countries for synthesizing the counterfactual include Argentina, Italy, Canada, Mexico, Egypt, Spain, France, Switzerland, Germany, and the UK, which coincidentally satisfy the presumed selection criteria, given that they are geographically remote from and have significant cultural differences with China.
The counterfactual has been synthesized by using observations for these 10 countries in 12 recent years (N = 10, T = 12). Table 2 lists the OLS estimated weights of the selected countries for the synthesis of the control group. With a of 0.943, the counterfactuals before the OBOR policy was implemented could be accurately approximated. All of the estimated parameters are not statistically significant, exactly satisfying the requirement for conducting a quasi-natural experiment that there be no consistent and continuous links between the treated group and the control group.
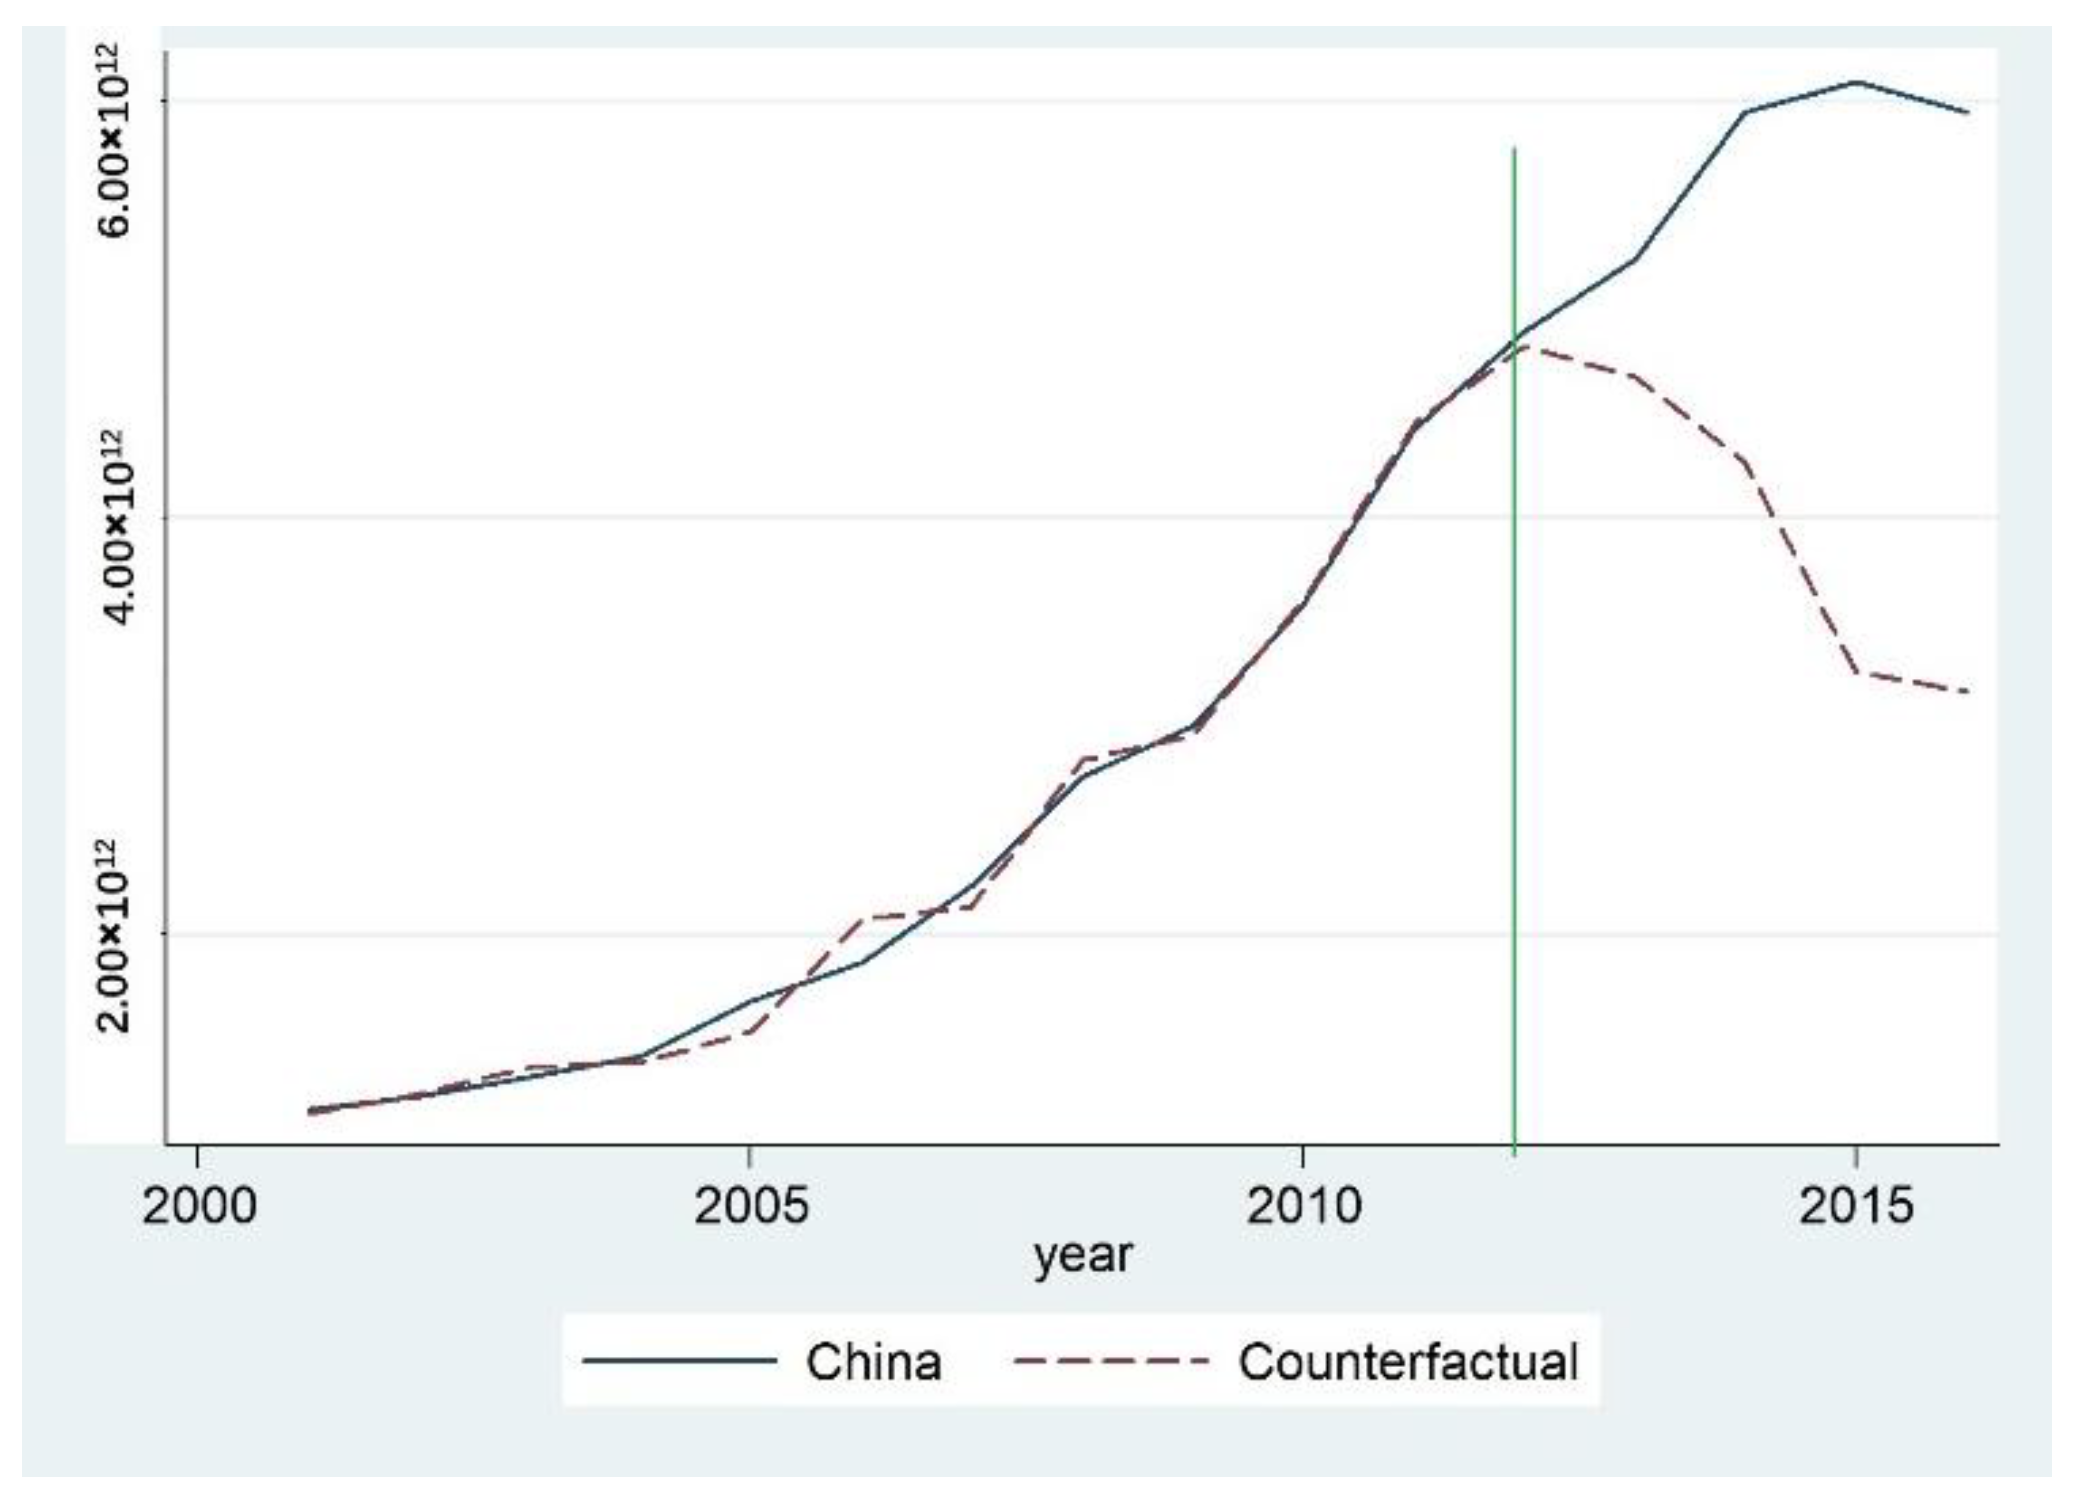
The actual and hypothetical export performance paths for the period 2001–2017 are plotted in Figure 3. Table 3 shows that the differences between the actual export sophistication of China and the counterfactual ones are very small. The synthetic control group has been approximated well in the period from 2001–2012 since the errors of fitting are within a tolerable range.
The treatment effects listed in Table 4 suggest that the export sophistication of China has risen substantially compared to the export sophistication the country would have had in the event that there had been no OBOR policy intervention. This finding supports the view that the complexity of Chinese manufacturing industries has increased by up to 50% through greater economic integration.
The counterfactual export sophistication of China has been approximated during the time period of 2001–2012. The empirical analysis indicates that there has been a certain and positive impact brought by the OBOR policy. Since the red-dashed line and the blue-solid line coincide with each other until the OBOR policy intervention was implemented (Figure 3), adequate synthesis results have been achieved. The blue-solid line (the actual export sophistication) separates from the red-dashed line (the counterfactual export sophistication). Specifically, the actual line rises well above the counterfactual one, regardless of the former’s decline after 2017, clearly there has been a certain and positive impact brought by the OBOR policy, in addition to showing that the actual relative export basket sophistication of China was valued at 6.12 trillion US$ in 2017. These significant intervention effects are not surprising given the “greater integration to re-industrialize” concept proposed by Xi’s administration. It is generally recognized that further opening and actively integrating with other industrialized countries would lead China to greater prosperity.
5. The Empirical Results
After the endogenous control process has been completed in Section 4.2, the OLS method can be used to evaluate the impact of the OBOR on within-country sectors (Table 5). Industries with improved trade performances had deeper openness and produced more new products in the base year than manufacturers with reduced export competitiveness, and this empirical result was statistically significant. The control variables in Table 5, namely, capital, employees, capital contribution rate, and fixed assets, were meant to quantify and reflect conventional factor-intensity ratios for employees and fixed capital. Our empirical analysis focuses on within-country sector variation in complexity. To consider sector endowments, the empirical specification includes manufacturing sector fixed effects.
The empirical results in Table 5 can be interpreted as evidence that the effectiveness of fixed assets and labor inputs in China’s industrialization is diminishing. Competitive manufacturing industries in the global market over our sample period were less labor-intensive and more high-tech than were other industries. Excluding the contributions of new product designs, labor inputs, and capital inputs, our empirical analysis still shows that there has been a significant impact of economic integration promoted by the “One Belt, One Road” initiative on Chinese exports sophistication and trade structure. The economic integration has significantly increased Chinese export sophistication by 6.52–6.70 units at the 1% statistical level (Table 5). These results support the proposition of the OBOR policy’s effectiveness, and evaluate the impacts of integration on the upgrading of domestic manufacturers accurately.
Industrial upgrading and export competitiveness depend on the extent and efficacy of efforts to master, adapt, and improve upon technologies, whereas heavy investment and labor input play a less important role in this regard. Meanwhile, a high capital investment rate is unlikely to be sustained in the coming decades, since there are signs of domestic savings declining in the short run. In future years, the savings rate is likely to decrease due to the changing consumption patterns of younger Chinese generations and the increasing ratio of aged dependency [13]. With a rising wage cost, China aims to adapt to competition from the low-price commodity markets by moving up the quality ladder. Although China’s export bundle overlaps with those of developed countries to a significant degree, the quality of Chinese goods currently remains below that of goods from advanced industrialized countries. Chinese policy-makers thus emphasize the importance of innovation and entrepreneurship in upgrading manufacturers and sustaining the country’s economic growth over the coming decades. China is hoping to enjoy rapid technical progress from economic integration, and hence, gain entry into the post-industrial era.
6. Conclusions
The integration of domestic manufacturing within the global production network has led China to become a major exporter; moreover, greater openness will facilitate the further upgrading of its manufacturers. The results of the present study lead us to conclude that the recent rise in the export competitiveness of Chinese manufacturing industries has been brought about by innovation intensity stemming from active integration with the rest of the world. Our results might simply reflect the conclusion that the economic integration and openness level in a country are important influences on the export competitiveness and upgrading of industry. Excluding the contributions of new product designs, labor inputs, and capital inputs, our empirical analysis still shows that there has been a significant impact from the economic integration promoted by the “One Belt, One Road” initiative on Chinese export sophistication and trade structure. The economic integration has significantly increased Chinese export sophistication by 6.52–6.70 units at the 1% statistical level.
The industrialization and economic growth of China are inevitability affected by the dialectic between the productive forces and the relations of production under its socialist regime. This new pattern of economic development is that of a long-term and contradictory process in which new policy demands and issues have to be designed and tackled by China. The Chinese have to improve their investment climate to attract foreign participation and have to seek opportunities in the worldwide production network. As a developing country, China still lacks the skills and technical bases to engage in modern and advanced manufacturing; thus, foreign investors are needed to bring in the necessary technology and provide the necessary training [32]. Meanwhile, the learning ability and pace vary greatly by country, depending on a country’s initial capabilities, market efficiency, and institutional efficacy, as well as the reforms undertaken to improve them [32]. Continuous reforms and policy innovations are necessary to sustain China’s long-term growth and spur ongoing upgrades to its manufacturers. The rising sophistication of China’s exports also has to be facilitated through upgrades to its human capital and policies [12,36].
Although China’s export bundle overlaps with those of developed countries to a significant degree, the quality of most Chinese goods currently remains below that of goods from advanced industrialized countries. With rising wage costs, China aims to adapt to competition from the low-price commodity markets by improving quality. In this regard, innovation and entrepreneurship are the main drivers for the upgrading of manufacturers and the sustaining of the nation’s economic growth over the coming decades. China is hoping to enjoy rapid technical progress from economic integration, and hence gain entry into the post-industrial era. Unfortunately, US President Donald Trump has declared a trade war with China, affecting both US-Sino trade relations and the global economy at large. Guo et al. [37] predict that the implementation of proposed US tariffs as high as 45% would cut the levels of most Chinese exports to the US. However, since production processes are split into discrete activities and allocated across countries, the intricate complementarity between trade and production have weakened President Trump’s ability to implement punitive tariffs.
Author Contributions
J.H. and S.-C.C. conceived and designed the research; J.H. performed the research; J.H. analyzed the data; J.H. and S.-C.C. wrote the paper; D.X. revised, verified, and rewrote the paper.
Funding
The authors give thanks to the funding of the China Science Research Foundation, Project Number: 71473071.
Conflicts of Interest
The authors declare no conflict of interest.
Appendix A

Table A1.
Comparative export basket complexity and sophistication of countries in 2017.
| NO. | Country | Weighted Competitiveness of Exports | GDP Deflated (US$) | Exports Sophistication (US$) |
|---|---|---|---|---|
| 1 | United States of America | 0.49895 | 1.69 × 10¹³ | 8.42 × 10¹² |
| 2 | China | 0.63157 | 9.69 × 10¹² | 6.12 × 10¹² |
| 3 | Japan | 0.647183 | 4.88 × 10¹² | 3.16 × 10¹² |
| 4 | Germany | 0.4871 | 3.15 × 10¹² | 1.53 × 10¹² |
| 5 | France | 0.553493 | 2.35 × 10¹² | 1.30 × 10¹² |
| 6 | United Kingdom | 0.478715 | 2.39 × 10¹² | 1.14 × 10¹² |
| 7 | Italy | 0.50865 | 1.74 × 10¹² | 8.83 × 10¹¹ |
| 8 | Korea, Republic of | 0.655609 | 1.30 × 10¹² | 8.52 × 10¹¹ |
| 9 | India | 0.44256 | 1.82 × 10¹² | 8.04 × 10¹¹ |
| 10 | Spain | 0.4453 | 1.22 × 10¹² | 5.43 × 10¹¹ |
| 11 | Switzerland | 0.715473 | 6.71 × 10¹² | 4.80 × 10¹¹ |
| 12 | Canada | 0.266946 | 1.42 × 10¹² | 3.78 × 10¹¹ |
| 13 | Netherlands | 0.454593 | 7.41 × 10¹² | 3.37 × 10¹¹ |
| 14 | Turkey | 0.601109 | 5.20 × 10¹¹ | 3.13 × 10¹¹ |
| 15 | Indonesia | 0.433232 | 7.09 × 10¹¹ | 3.07 × 10¹¹ |
| 16 | Mexico | 0.332521 | 7.75 × 10¹¹ | 2.58 × 10¹¹ |
| 17 | Belgium | 0.481987 | 4.29 × 10¹¹ | 2.07 × 10¹¹ |
| 18 | Poland | 0.464561 | 4.37 × 10¹¹ | 2.03 × 10¹¹ |
| 19 | Austria | 0.497128 | 3.49 × 10¹¹ | 1.73 × 10¹¹ |
| 20 | Russian Federation | 0.168681 | 9.12 × 10¹¹ | 1.54 × 10¹¹ |
| 21 | Brazil | 0.293932 | 5.02 × 10¹¹ | 1.48 × 10¹¹ |
| 22 | Sweden | 0.308796 | 4.70 × 10¹¹ | 1.45 × 10¹¹ |
| 23 | Australia | 0.117636 | 1.21 × 10¹² | 1.42 × 10¹¹ |
| 24 | Israel | 0.449275 | 3.15 × 10¹¹ | 1.42 × 10¹¹ |
| 25 | Ireland | 0.498982 | 2.66 × 10¹¹ | 1.33 × 10¹¹ |
| 26 | Hong Kong, China | 0.370115 | 3.15 × 10¹¹ | 1.17 × 10¹¹ |
| 27 | Thailand | 0.394631 | 2.78 × 10¹¹ | 1.10 × 10¹¹ |
| 28 | Denmark | 0.367515 | 2.89 × 10¹¹ | 1.06 × 10¹¹ |
| 29 | Singapore | 0.317058 | 2.91 × 10¹¹ | 9.23 × 10¹¹ |
| 30 | Portugal | 0.476962 | 1.93 × 10¹¹ | 9.19 × 10¹⁰ |
| 31 | Saudi Arabia | 0.130815 | 6.91 × 10¹¹ | 9.03 × 10¹⁰ |
| 32 | Malaysia | 0.337711 | 2.67 × 10¹¹ | 9.02 × 10¹⁰ |
| 33 | Egypt | 0.337777 | 2.38 × 10¹¹ | 8.04 × 10¹⁰ |
| 34 | Czech Republic | 0.409281 | 1.79 × 10¹¹ | 7.33 × 10¹⁰ |
| 35 | Bangladesh | 0.638769 | 1.13 × 10¹¹ | 7.21 × 10¹⁰ |
| 36 | Finland | 0.328633 | 2.10 × 10¹¹ | 6.89 × 10¹⁰ |
| 37 | Viet Nam | 0.453999 | 1.37 × 10¹¹ | 6.24 × 10¹⁰ |
| 38 | Greece | 0.295097 | 2.04 × 10¹¹ | 6.02 × 10¹⁰ |
| 39 | Norway | 0.175631 | 3.38 × 10¹¹ | 5.94 × 10¹⁰ |
| 40 | South Africa | 0.259493 | 2.09 × 10¹¹ | 5.42 × 10¹⁰ |
| 41 | United Arab Emirates | 0.134695 | 3.79 × 10¹¹ | 5.10 × 10¹⁰ |
| 42 | Philippines | 0.26915 | 1.71 × 10¹¹ | 4.61 × 10¹⁰ |
| 43 | Morocco | 0.493352 | 9.29 × 10¹⁰ | 4.59 × 10¹⁰ |
| 44 | Romania | 0.445519 | 9.72 × 10¹⁰ | 4.33 × 10¹⁰ |
| 45 | Hungary | 0.353537 | 1.08 × 10¹¹ | 3.80 × 10¹⁰ |
| 46 | Pakistan | 0.319631 | 1.13 × 10¹¹ | 3.61 × 10¹⁰ |
| 47 | Slovakia | 0.383004 | 8.72 × 10¹⁰ | 3.34 × 10¹⁰ |
| 48 | Qatar | 0.134228 | 2.19 × 10¹¹ | 2.94 × 10¹⁰ |
| 49 | Colombia | 0.157448 | 1.77 × 10¹¹ | 2.79 × 10¹⁰ |
| 50 | Chile | 0.12271 | 2.16 × 10¹¹ | 2.65 × 10¹⁰ |
| 51 | Panama | 0.644348 | 3.75 × 10¹⁰ | 2.41 × 10¹⁰ |
| 52 | Luxembourg | 0.424321 | 5.40 × 10¹⁰ | 2.29 × 10¹⁰ |
| 53 | Croatia | 0.465347 | 4.84 × 10¹⁰ | 2.25 × 10¹⁰ |
| 54 | Slovenia | 0.469721 | 4.20 × 10¹⁰ | 1.97 × 10¹⁰ |
| 55 | New Zealand | 0.117118 | 1.67 × 10¹¹ | 1.96 × 10¹⁰ |
| 56 | Bulgaria | 0.374144 | 4.72 × 10¹⁰ | 1.77 × 10¹⁰ |
| 57 | Lithuania | 0.440654 | 3.81 × 10¹⁰ | 1.68 × 10¹⁰ |
| 58 | Tunisia | 0.447569 | 3.24 × 10¹⁰ | 1.45 × 10¹⁰ |
| 59 | Peru | 0.09161 | 1.48 × 10¹¹ | 1.36 × 10¹⁰ |
| 60 | Ukraine | 0.344215 | 3.85 × 10¹⁰ | 1.33 × 10¹⁰ |
| 61 | Serbia | 0.394562 | 2.88 × 10¹⁰ | 1.14 × 10¹⁰ |
| 62 | Latvia | 0.41073 | 2.41 × 10¹⁰ | 9.90 × 10⁹ |
| 63 | Kazakhstan | 0.233809 | 3.81 × 10¹⁰ | 8.91 × 10⁹ |
| 64 | Estonia | 0.413453 | 1.96 × 10¹⁰ | 8.12 × 10⁹ |
| 65 | Myanmar | 0.160687 | 4.80 × 10¹⁰ | 7.71 × 10⁹ |
| 66 | Argentina | 0.145994 | 4.77 × 10¹⁰ | 6.97 × 10⁹ |
| 67 | Ecuador | 0.042171 | 6.93 × 10¹⁰ | 2.92 × 10⁹ |
| 68 | Cote d’Ivoire | 0.09553 | 2.94 × 10¹⁰ | 2.81 × 10⁹ |
| 69 | Algeria | 0.050198 | 5.47 × 10¹⁰ | 2.75 × 10⁹ |
| 70 | Nigeria | 0.007387 | 2.71 × 10¹¹ | 2.00 × 10⁹ |
| 71 | Belarus | 0.542934 | 9.69 × 10⁸ | 5.26 × 10⁸ |
| 72 | Bolivarian Republic of Venezuela | 0.039902 | 1.10 × 10¹⁰ | 4.37 × 10⁸ |
| 73 | Bahrain | 0.21055 | 2.50 × 10⁸ | 5.26 × 10⁷ |
| 74 | Iran, Islamic Republic of | 0.120058 | 3.42 × 10⁸ | 4.11 × 10⁷ |
| 75 | Taipei | 0.527632 | 1.08 × 10⁸ | 5.72 × 10⁷ |
| 76 | Angola | 0.5451 | 9.65 × 10⁹ | 5.26 × 10⁹ |
| 77 | Kuwait | 0.057074 | 1.28 × 10⁸ | 7.29 × 10⁶ |
| 78 | Libya, State of | 0.129087 | 4.80 × 10⁷ | 6.19 × 10⁶ |
| 79 | Oman | 0.170433 | 2.42 × 10⁷ | 4.13 × 10⁶ |
| 80 | Iraq | 0.14098 | 1.72 × 10¹¹ | 2.42 × 10¹⁰ |
Source: UN Comtrade and ITC statistics.
References
- Helpman, E.; Grossman, G. Product Development and International Trade. J. Political Econ. 1989, 97, 1261–1283. [Google Scholar] [Green Version]
- Hsiao, C.; Ching, H.S.; Wan, S.K. A Panel Data Approach for Program Evaluation: Measuring the Benefits of Political and Economic Integration of Hongkong with Mainland China. J. Appl. Econ. 2012, 27, 705–740. [Google Scholar] [CrossRef]
- Kashia, A. Alexander Del Mar: Free Trade and the Chinese Question. South. Calif. Q. 2012, 94, 304–345. [Google Scholar]
- OECD and ITC Statistic. Available online: https://data.oecd.org/ (accessed on 1 May 2018).
- Hausmann, R.; Rodrik, D. Economic development as self-discovery. J. Dev. Econ. 2002, 72, 603–633. [Google Scholar] [CrossRef]
- Ferdinand, P. The China dream and “One belt, One road”: Chinese foreign policy under Xi Jinping. Int. Aff. 2016, 92, 941–957. [Google Scholar] [CrossRef]
- Victor, F.S.S. China’s Export-Oriented Open Areas: The Export Processing Zone Concept. Asian Surv. 1988, 28, 661–675. [Google Scholar]
- Harding, T.; Javorcik, B.S. Foreign Direct Investment and Export Upgrading. Rev. Econ. Stat. 2012, 94, 964–980. [Google Scholar] [CrossRef]
- UN Comtrade Database. Available online: https://comtrade.un.org/ (accessed on 1 May 2018).
- Rodrik, D. What’s So Special about China’s Exports? NBER: Cambridge, MA, USA, 2006. [Google Scholar]
- Athukorala, P.C. Evolving Role in Global Production Networks. In China’s New Sources of Economic Growth; ANU Press: Canberra, Australia, 2017; pp. 363–388. [Google Scholar]
- Nataraj, G.; Tandon, A. China’s Changing Export Structure: A Factor-Based Analysis. Econ. Political Wkly. 2011, 46, 130–136. [Google Scholar] [CrossRef]
- Wang, X. Economic Growth Over the Past Twenty Years. In China: Twenty Years of Economic Reform; ANU Press: Canberra, Australia, 2012; pp. 27–50. [Google Scholar]
- Chen, S.-C.; Hou, J.; Xiao, D. “One Belt, One Road” Initiative to Stimulate Trade in China: A Counter-Factual Analysis. Sustainability 2018, 10, 3242. [Google Scholar] [CrossRef]
- Grossman, G.M.; Helpman, E. Trade, Innovation, and Growth. Am. Econ. Rev. 1990, 80, 86–91. [Google Scholar]
- Young, A. Learning by Doing and the Dynamic Effects of International Trade. Q. J. Econ. 1991, 106, 369–405. [Google Scholar] [CrossRef]
- Aitken, B.; Hanson, G.H.; Harrison, A.E. Spillovers, Foreign investment, and Export Behavior. J. Int. Econ. 1994, 43, 103–132. [Google Scholar] [CrossRef]
- Klaus, S.; Vale, M. Economic Growth and Economic Strategy. East. Eur. Econ. 1988, 27, 65–90. [Google Scholar]
- Sarkar, P. Trade Openness and Growth: Is There Any Link? J. Econ. Issues 2008, 42, 763–785. [Google Scholar] [CrossRef] [Green Version]
- Anand, R. Make in India: Which Export Can Drive the Next Wave of Growth? IMF: Washington, DC, USA, 2015. [Google Scholar]
- Globerman, S. Recent Changes in Export Performances of U.S. Manufacturing Industries. Am. Econ. 1980, 24, 62–67. [Google Scholar] [CrossRef]
- Gaulier, G.; Jean, S. Regionalism and the Regionalization of International Trade. CEPII Work. Pap. 2009, 44, 1707–1710. [Google Scholar]
- Solow, R.M. Technical Progress and the Aggregate Production Function. Rev. Econ. Stat. 1957, 39, 312–320. [Google Scholar] [CrossRef]
- Grossman, G.M.; Helpman, E. Quality Ladders in the Theory of Growth. Rev. Econ. Stud. 1991, 58, 43–61. [Google Scholar] [CrossRef]
- Helpman, E. Technology and Trade. Handb. Int. Econ. 1995, 3, 1279–1337. [Google Scholar]
- Hallak, J.C.; Sivadasan, J. Product and process productivity: Implications for quality choice and conditional exporter premia. J. Int. Econ. 2013, 91, 53–67. [Google Scholar] [CrossRef]
- Hallak, J.C.; Sivadasan, J. Firms’ Exporting Behavior under Quality Constraints; NBER: Cambridge, MA, USA, 2010. [Google Scholar]
- Hausmann, R.; Hwang, J.; Rodrik, D. What you export matters. J. Econ. Growth 2007, 12, 1–25. [Google Scholar] [CrossRef]
- Squalli, J.; Wilson, K. A New Measure of Trade Openness. World Econ. 2011, 34, 1745–1770. [Google Scholar] [CrossRef]
- Balassa, B. Trade Liberalization and Comparative Advantage. Manchester. Sch. 1965, 33, 99–123. [Google Scholar] [CrossRef]
- The National Bureau of Statistics of China. Available online: http://www.stats.gov.cn/english/ (accessed on 1 May 2018).
- Lall, S. Exports of Manufactures by Developing Countries: Emerging Patterns of Trade and Location. Oxf. Rev. Econ. Policy 1998, 14, 54–73. [Google Scholar] [CrossRef]
- Bai, J. Inferential Theory for Factor Models of Large Dimensions. Econometrica 2010, 71, 135–171. [Google Scholar] [CrossRef]
- Zou, H.; Zhang, H.H. On the Adaptive Elastic-Net with a diverging number of Parameters. Ann. Stat. 2009, 37, 1733–1751. [Google Scholar] [CrossRef]
- Zou, H.; Hastie, T. Regularization and Variable Selection via the Elastic Net. J. R. Stat. Soc. Ser. B 2005, 67, 301–320. [Google Scholar] [CrossRef]
- Wu, Y.; Guo, X.; Marinova, D. Productivity, Innovation and China Economic Growth. In China’s New Sources of Economic Growth; ANU Press: Canberra, Australia, 2017; pp. 213–228. [Google Scholar]
- Guo, M.; Lu, L.; Sheng, L. The Day After Tomorrow: Evaluating the Burden of Trump’s Trade War. Asian Econ. Pap. 2018, 17, 101–120. [Google Scholar] [CrossRef]
Figure 1.
The share of China in the global market (%). Source: data compiled from OECD database.

Figure 2.
China’s high-tech manufacturing exports, 2001–2017 (US$). Source: Data compiled from UN Comtrade database (comtrade.un.org/).
Figure 2.
China’s high-tech manufacturing exports, 2001–2017 (US$). Source: Data compiled from UN Comtrade database (comtrade.un.org/).

Figure 3.
The actual and counterfactual exports sophistication of China (US$).

Table 1.
Summary Statistics.
| Variable | Unit | Mean | SD | Min | Max | N |
|---|---|---|---|---|---|---|
| Exports | Billion US$ | 5.9 | 11 | 0.49 | 60 | 289 |
| Imports | Billion US$ | 4.0 | 7.7 | 0.25 | 46 | 289 |
| Exports share in outputs | Percentage | 0.26 | 0.32 | 0.01 | 1.56 | 289 |
| Value added | Billion RMB * | 2100 | 2500 | 43.4 | 11,000 | 289 |
| Export Sophistication | Trillion US$ | 0.88 | 0.72 | 0.018 | 2.9 | 289 |
| Ln(Export Sophistication) | Units | 22.46 | 1.09 | 19.01 | 24.11 | 289 |
| New Products | Billion RMB * | 240 | 350 | 0.667 | 2000 | 289 |
| Fix Assets | Million RMB * | 432.8 | 586.4 | 12.05 | 4047 | 289 |
| Capital | Million RMB * | 1414 | 1610 | 35.6 | 7604 | 289 |
| Employees | Thousand | 2497 | 1697 | 280.9 | 6378 | 289 |
| Cost profit rate | Percentage | 5.61 | 1.89 | 0.91 | 11.88 | 289 |
| Capital contribution rate | Percentage | 9.64 | 5.23 | 2.61 | 35.07 | 289 |
Source: UN Comtrade, ITC statistics, OECD and CEIC China Statistical database. * Note: RMB represents the Chinese currency.
Table 2.
Control group selection: weights of control groups.
| Variables | Coef. | Variables | Coef. |
|---|---|---|---|
| Argentina | −0.761 | Italy | −0.363 |
| (−0.12) | (−0.03) | ||
| Canada | 10.405 | Mexico | −2.283 |
| (0.9) | (−0.51) | ||
| Egypt | 7.717 | Spain | −11.162 |
| (0.59) | (−1.13) | ||
| France | −2.65 | Swiss | 0.746 |
| (−0.38) | (0.16) | ||
| Germany | 8.467 | UK | 0.938 |
| (1.89) | (0.34) | ||
| constant | −5.30 × 10¹² | ||
| (−1.00) | |||
| r2_adjusted | 0.943 | ||
| F | 19.242 | ||
| N | 120 |
Note: t statistics in parentheses. Here, all of the estimated parameters are not statistically significant, exactly satisfying the requirement for conducting a quasi-natural experiment that there be no consistent and continuous links between the treated group and the control group.
Table 3.
The synthesized exports sophistication of China (trillion US$).
| Year | China | Counterfactual | Error of Fitting |
|---|---|---|---|
| 2001 | 1.16 | 1.14 | 0.0174 |
| 2002 | 1.22 | 1.23 | −0.0129 |
| 2003 | 1.32 | 1.37 | −0.0456 |
| 2004 | 1.42 | 1.39 | 0.0292 |
| 2005 | 1.68 | 1.53 | 0.1490 |
| 2006 | 1.86 | 2.07 | −0.2130 |
| 2007 | 2.23 | 2.14 | 0.0941 |
| 2008 | 2.76 | 2.84 | −0.0792 |
| 2009 | 3.00 | 2.96 | 0.0442 |
| 2010 | 3.58 | 3.61 | −0.0299 |
| 2012 | 4.89 | 4.82 | 0.0653 |
Source: UN Comtrade and ITC statistics.
Table 4.
The treatment effects of the “One Belt, One Road” (OBOR) initiative (trillion US$).
| Year | China | Counterfactual | Treatment |
|---|---|---|---|
| 2013 | 5.24 | 4.68 | 0.56 |
| 2014 | 5.95 | 4.27 | 1.68 |
| 2015 | 6.09 | 3.26 | 2.83 |
| 2016 | 5.95 | 3.17 | 2.78 |
| 2017 | 6.12 | 3.22 | 2.66 |
Source: UN Comtrade and ITC statistics.
Table 5.
The impacts of openness on Chinese manufacturing industries.
| (1) | (2) | (3) | (4) | (5) | (6) | |
|---|---|---|---|---|---|---|
| New Products | 13.895 *** | 13.895 *** | 3.973 *** | 8.930 *** | 5.579 *** | |
| (11.27) | (4.37) | (5.1) | (6.85) | (7.01) | ||
| Openness | 6.704 *** | 6.520 *** | 7.719 *** | |||
| (14.34) | (14.21) | (15.64) | ||||
| Capital | 0.000 *** | |||||
| (6.02) | ||||||
| Employees | 0.000 ** | 0.000 *** | 0.000 *** | |||
| −3.17 | (5.18) | (6.91) | ||||
| Cost Profit Rate | −0.068 | −0.061 * | ||||
| (−1.84) | (−2.53) | |||||
| Capital Contribution Rate | 0.063 *** | 0.026 *** | ||||
| (7.32) | (4.49) | |||||
| Fix assets | 0.000 *** | |||||
| (7.19) | ||||||
| Constant | 21.076 *** | 22.528 *** | 20.510 *** | 21.341 *** | 20.278 *** | 20.750 *** |
| (165.65) | (93.52) | (224.32) | (107.64) | (255.13) | (153.33) | |
| N | 289 | 289 | 289 | 289 | 289 | 289 |
| r2_adjusted | 0.277 | 0.789 | 0.403 | 0.799 | 0.759 | |
| F | 127.08 | 274.292 | 71.231 | 291.595 | 231.896 |
t statistics in parentheses; * p < 0.05, ** p < 0.01, *** p < 0.001.
© 2018 by the authors. Licensee MDPI, Basel, Switzerland. This article is an open access article distributed under the terms and conditions of the Creative Commons Attribution (CC BY) license (http://creativecommons.org/licenses/by/4.0/).
Share and Cite
MDPI and ACS Style
Hou, J.; Chen, S.-C.; Xiao, D. Measuring the Benefits of the “One Belt, One Road” Initiative for Manufacturing Industries in China. Sustainability 2018, 10, 4717. https://0-doi-org.brum.beds.ac.uk/10.3390/su10124717
AMA Style
Hou J, Chen S-C, Xiao D. Measuring the Benefits of the “One Belt, One Road” Initiative for Manufacturing Industries in China. Sustainability. 2018; 10(12):4717. https://0-doi-org.brum.beds.ac.uk/10.3390/su10124717
Chicago/Turabian StyleHou, Jianing, Shih-Chih Chen, and De Xiao. 2018. "Measuring the Benefits of the “One Belt, One Road” Initiative for Manufacturing Industries in China" Sustainability 10, no. 12: 4717. https://0-doi-org.brum.beds.ac.uk/10.3390/su10124717
Note that from the first issue of 2016, this journal uses article numbers instead of page numbers. See further details here.