Risk Assessment and Mitigation Model for Overseas Steel-Plant Project Investment with Analytic Hierarchy Process—Fuzzy Inference System


Abstract
:1. Introduction
1.1. Existing Literature
1.2. Point of Departure and Research Motivation
2. Research Methodology and Data Collection
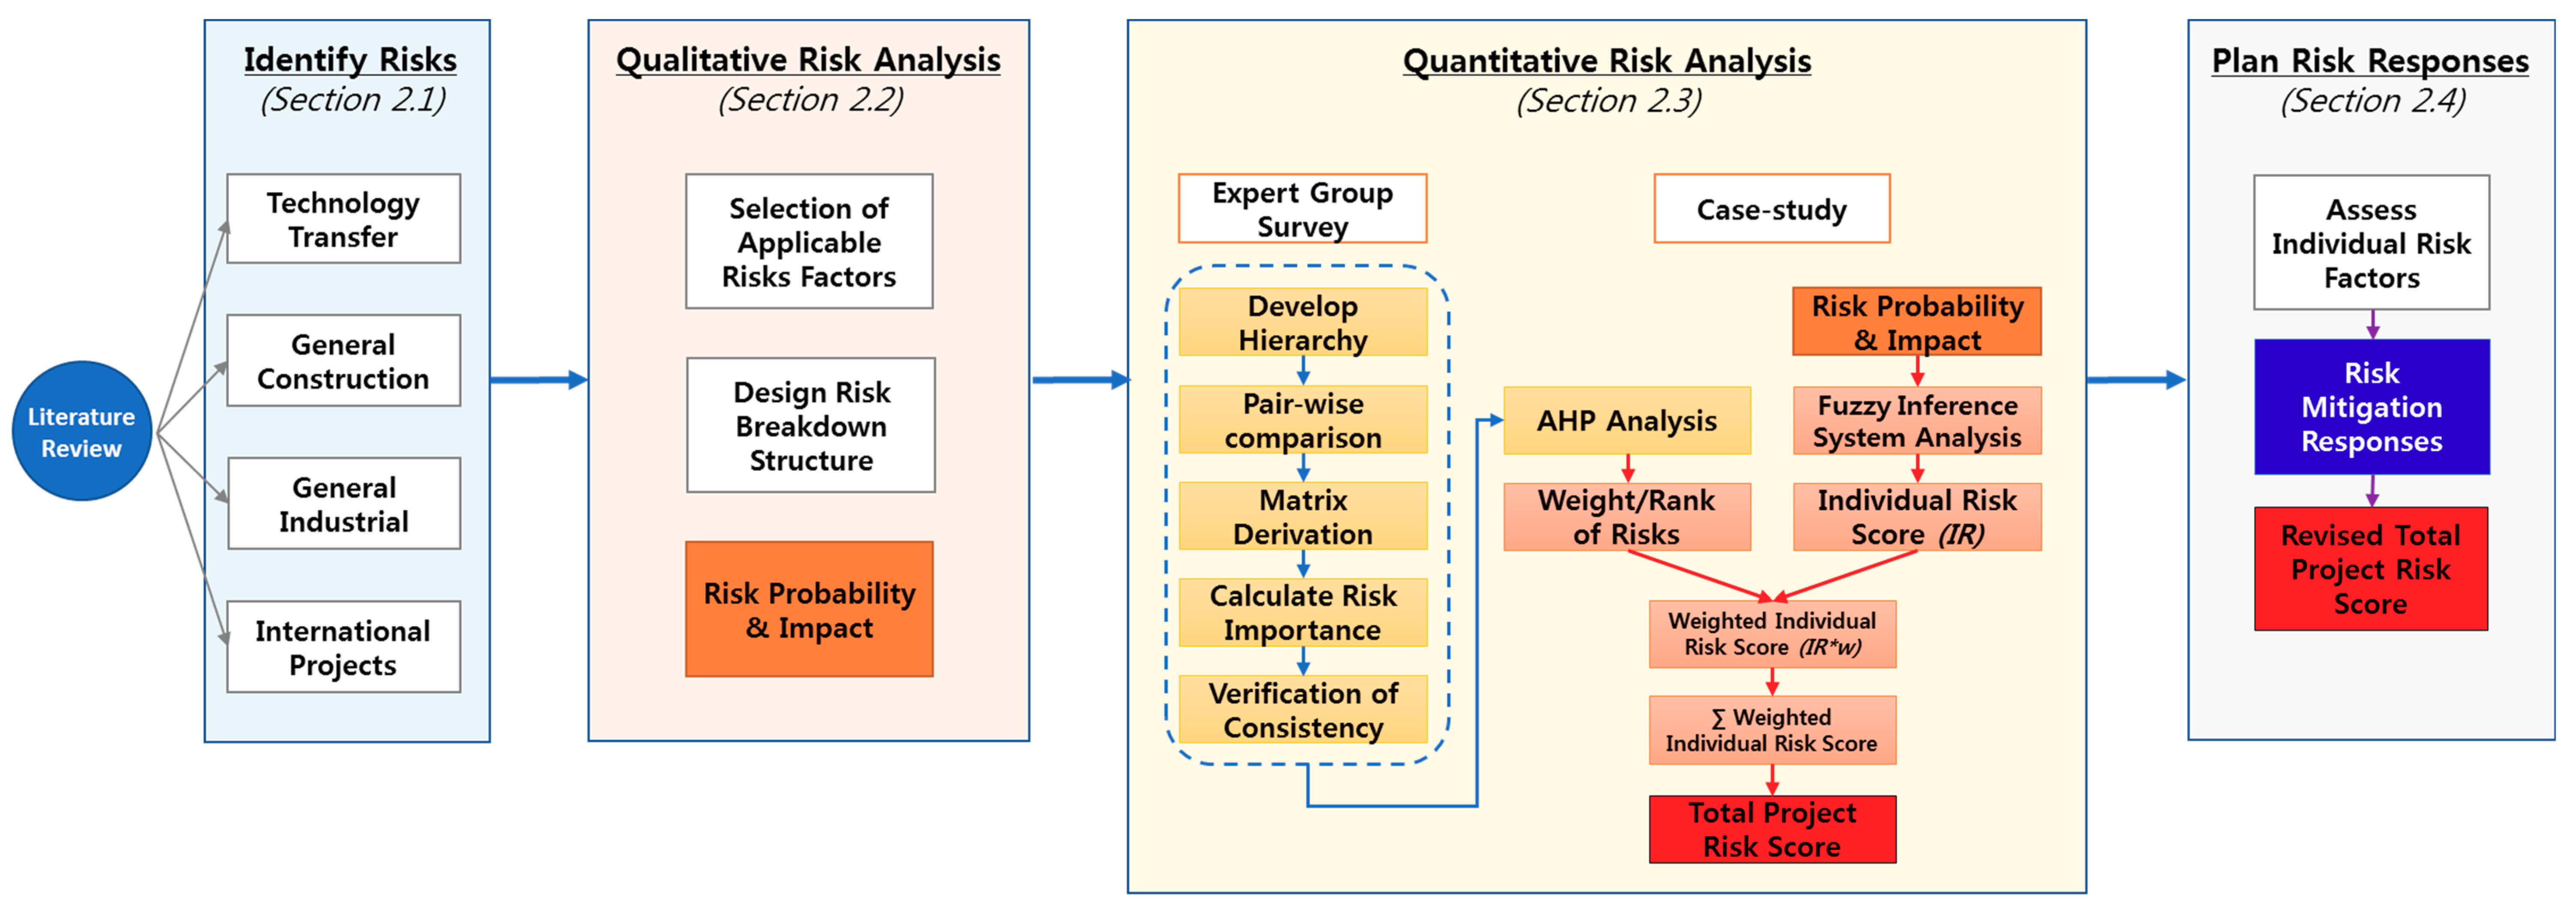
2.1. Risk Identification
2.2. Qualitative Risk Analysis
2.3. Quantitative Risk Analysis
2.4. Plan Risk Responses
3. Findings and Discussion
3.1. Risk Analysis Results
3.2. Proposed Risk Mitigation Measures
4. Discussion: Industry Implications
5. Conclusions
5.1. Limitations
5.2. Future Research
Author Contributions
Funding
Acknowledgments
Conflicts of Interest
Abbreviations
| AHP | Analytic Hierarchy Process |
| FIS | Fuzzy inference system |
| EPC | Engineering Procure and Construct |
| PDRI | Project Definition Rating Index |
| PMBOK | Project Management Body of Knowledge |
| O&M | Operation and Maintenance |
| POSCO | Pohang Iron and Steel Company |
| RBS | Risk Breakdown Structure |
| MATLAB | Matrix Laboratory |
References
- Min, D.J. Global Competitiveness Through Hybridization of FINEX and CEM Processes. Asian Steel Watch 2016, 2, 50–63. [Google Scholar]
- Gray, W.B.; Deily, M.E. Compliance and enforcement: Air pollution regulation in the US steel industry. J. Environ. Econ. Manag. 1996, 31, 96–111. [Google Scholar] [CrossRef]
- Gajdzik, B.; Gawlik, R. Choosing the Production Function Model for an Optimal Measurement of the Restructuring Efficiency of the Polish Metallurgical Sector in Years 2000–2015. Metals 2017, 8, 23. [Google Scholar] [CrossRef]
- Sun, J.; Peng, W.; Ding, J.; Li, X.; Zhang, D. Key Intelligent Technology of Steel Strip Production through Process. Metals 2018, 8, 597. [Google Scholar] [CrossRef]
- Manocha, S.; Ponchon, F. Management of Lime in Steel. Metals 2018, 8, 686. [Google Scholar] [CrossRef]
- Andersson, A.; Gullberg, A.; Kullerstedt, A.; Sandberg, E.; Andersson, M.; Ahmed, H.; Sundqvist-Ökvist, L.; Björkman, B. A Holistic and Experimentally-Based View on Recycling of Off-Gas Dust within the Integrated Steel Plant. Metals 2018, 8, 760. [Google Scholar] [CrossRef]
- Baricová, D.; Pribulová, A.; Futáš, P.; Buľko, B.; Demeter, P. Change of the Chemical and Mineralogical Composition of the Slag during Oxygen Blowing in the Oxygen Converter Process. Metals 2018, 8, 844. [Google Scholar] [CrossRef]
- Mali, N.H.; Dube, S.K. Risk Management in Steel Plants. Int. J. Eng. Tech. Res. 2018, 8, 100–105. [Google Scholar]
- Farkas, D. The Effect of Demand Uncertainity on Planning: The Steel Industry in Argentina. Ph.D. Dissertation, Virginia Polytechnic Institute and State University, Blacksburg, VA, USA, 1985. [Google Scholar]
- Price, A.H.; Weld, C.B.; El-Sabaawi, L.; Teslik, A.M. Unsustainable: Government Intervention and Overcapacity in the Global Steel Industry. Available online: https://www.wileyrein.com/media/publication/204_Unsustainable-Government-Intervention-and-Overcapacity-in-the-Global-Steel-Industry-April-2016.pdf (accessed on 11 December 2018).
- Bucur, A.; Dobrotă, G.; Oprean-Stan, C.; Tănăsescu, C. Economic and qualitative determinants of the world steel production. Metals 2017, 7, 163. [Google Scholar] [CrossRef]
- Zhang, J.L. Risks and Risk Management in Chinese Iron and Steel Enterprises. Adv. Mater. Res. 2011, 201, 1061–1065. [Google Scholar] [CrossRef]
- Ozorio, L.; Bastian-Pinto, C.; Baidya, T.K.; Brandão, L.E. Investment decision in integrated steel plants under uncertainty. Int. Rev. Financ. Anal. 2013, 27, 55–64. [Google Scholar] [CrossRef]
- Kaushal, L.A. Pohang Steel Company (POSCO) Project: Growth Versus Development; UNNAYAN, International Bulletin of Management and Economics: Gurgaon, India, 2017; Volume 7, Available online: http://unnayan.ipsacademy.org/v4/73.pdf (accessed on 11 December 2018).
- Kim, Y.; Shin, K.; Ahn, J.; Lee, E.B. Probabilistic Cash Flow-Based Optimal Investment Timing Using Two-Color Rainbow Options Valuation for Economic Sustainability Appraisement. Sustainability 2017, 9, 1781. [Google Scholar] [CrossRef]
- Lee, Y.J. Development of Index Model and Application: Investment Evaluation for Overseas Steel Business. Master’s Thesis, Pohang University of Science and Technology, Pohang, Korea, 2015. Available online: http://www.riss.kr/link?id=T13730925 (accessed on 11 December 2018).
- Gibson, G.; Dumont, P.R. Project Definition Rating Index (PDRI) for Industrial Projects; Technical Research Report 113-11; Construction Industry Institute: Austin, TX, USA, 1996. [Google Scholar]
- Shen, L.Y.; Wu, G.W.; Ng, C.S. Risk assessment for construction joint ventures in China. J. Constr. Eng. Manag. 2001, 127, 76–81. [Google Scholar] [CrossRef]
- El-Sayegh, S.M. Risk assessment and allocation in the UAE construction industry. Int. J. Proj. Manag. 2008, 26, 431–438. [Google Scholar] [CrossRef]
- Mansfield, E. International Technology Transfer: Forms, Resource Requirements, and Policies. Am. Econ. Rev. 1975, 65, 372–376. [Google Scholar]
- Davidson, W.H.; McFetridge, D.G. Key Characteristics in the Choice of International Technology Transfer Mode. J. Int. Bus. Stud. 1985, 16, 5–21. [Google Scholar] [CrossRef] [Green Version]
- Osland, G.E.; Taylor, C.R.; Zou, S. Selecting international modes of entry and expansion. Marketing Intell. Plan. 2001, 19, 153–161. [Google Scholar] [CrossRef] [Green Version]
- Park, J.H. Development and Application of Checklist for the Evaluation of International Technology Transfer: From the Viewpoint of Licensor. Korean J. Econ. Manag. 2008, 26, 57–82. [Google Scholar]
- Ocampo-Duque, W.; Ferre-Huguet, N.; Domingo, J.; Schuhmacher, M. Assessing water quality in rivers with fuzzy inference systems: A case study. Environ. Int. 2006, 32, 733–742. [Google Scholar] [CrossRef]
- Yang, M.; Khan, F.I.; Sadiq, R. Prioritization of environmental issues in offshore oil and gas operations: A hybrid approach using fuzzy inference system and fuzzy analytic hierarchy process. Process Saf. Environ. Prot. 2011, 89, 22–34. [Google Scholar] [CrossRef]
- Liu, K.F.; Lai, J.H. Decision-support for environmental impact assessment: A hybrid approach using fuzzy logic and fuzzy analytic network process. Expert Syst. Appl. 2009, 36, 5119–5136. [Google Scholar] [CrossRef]
- Ganguly, K.K.; Kalyan, K.G. A fuzzy AHP approach for inbound supply risk assessment. Benchmarking 2013, 20, 129–146. [Google Scholar] [CrossRef]
- Amindoust, A.; Ahmed, S.; Saghafinia, A.; Bahreininejad, A. Sustainable supplier selection: A ranking model based on fuzzy inference system. Appl. Soft Comput. 2012, 12, 1668–1677. [Google Scholar] [CrossRef]
- Carrera, D.A.; Mayorga, R.V. Supply chain management: A modular fuzzy inference system approach in supplier selection for new product development. J. Intell. Manuf. 2008, 19, 1–2. [Google Scholar] [CrossRef]
- Diouf, M.; Kwak, C. Fuzzy AHP, DEA, and Managerial Analysis for Supplier Selection and Development; From the Perspective of Open Innovation. Sustainability 2018, 10, 3779. [Google Scholar] [CrossRef]
- Lee, A.H.; Chen, W.C.; Chang, C.J. A fuzzy AHP and BSC approach for evaluating performance of IT department in the manufacturing industry in Taiwan. Expert Syst. Appl. 2008, 34, 96–107. [Google Scholar] [CrossRef]
- Chen, C.T.; Cheng, H.L. A comprehensive model for selecting information system project under fuzzy environment. Int. J. Proj. Manag. 2009, 27, 389–399. [Google Scholar] [CrossRef]
- Huang, Y.P.; Basanta, H.; Kuo, H.C.; Huang, A. Health symptom checking system for elderly people using fuzzy analytic hierarchy process. Appl. Syst. Innov. 2018, 1, 10. [Google Scholar] [CrossRef]
- Kim, J.; Kim, J. Optimal Portfolio for LNG Importation in Korea Using a Two-Step Portfolio Model and a Fuzzy Analytic Hierarchy Process. Energies 2018, 11, 3049. [Google Scholar] [CrossRef]
- Ravankar, A.; Ravankar, A.A.; Kobayashi, Y.; Emaru, T. Optimal Robot Path Selection Using Fuzzy Analytical Hierarchical Process. Multidiscip. Digit. Publ. Inst. Proc. 2017, 2, 111. [Google Scholar] [CrossRef]
- He, Y.; Wang, X.; Lin, Y.; Zhou, F. Optimal partner combination for joint distribution alliance using integrated fuzzy EW-AHP and TOPSIS for online shopping. Sustainability 2016, 8, 341. [Google Scholar] [CrossRef]
- Lee, Y.C.; Chou, C.J. Technology evaluation and selection of 3DIC integration using a three-stage fuzzy MCDM. Sustainability 2016, 8, 114. [Google Scholar] [CrossRef]
- Mokarram, M.; Najafi-Ghiri, M. Combination of Fuzzy Logic and Analytical Hierarchy Process Techniques to Assess Potassium Saturation Percentage of Some Calcareous Soils (Case Study: Fars Province, Southern Iran). Agriculture 2016, 6, 59. [Google Scholar] [CrossRef]
- Romeijn, H.; Faggian, R.; Diogo, V.; Sposito, V. Evaluation of deterministic and complex analytical hierarchy process methods for agricultural land suitability analysis in a changing climate. ISPRS Int. J. Geo-Inf. 2016, 5, 99. [Google Scholar] [CrossRef]
- Shen, L.; Govindan, K.; Shankar, M. Evaluation of barriers of corporate social responsibility using an analytical hierarchy process under a fuzzy environment—A textile case. Sustainability 2015, 7, 3493–3514. [Google Scholar] [CrossRef]
- Samanlioglu, F.; Taskaya, Y.E.; Gulen, U.C.; Cokcan, O. A Fuzzy AHP–TOPSIS-Based Group Decision-Making Approach to IT Personnel Selection. Int. J. Fuzzy Syst. 2018, 20, 1576–1591. [Google Scholar] [CrossRef]
- Chang, P.L.; Chen, Y.C. A fuzzy multi-criteria decision making method for technology transfer strategy selection in biotechnology. Fuzzy Sets Syst. 1994, 63, 131–139. [Google Scholar] [CrossRef]
- Baloi, D.; Price, A.D. Modelling global risk factors affecting construction cost performance. Int. J. Proj. Manag. 2003, 21, 261–269. [Google Scholar] [CrossRef]
- Hatefi, S.M.; Tamošaitienė, J. Construction projects assessment based on the sustainable development criteria by an integrated fuzzy AHP and improved GRA model. Sustainability 2018, 10, 991. [Google Scholar] [CrossRef]
- Mustafa, M.A.; Al-Bahar, J.F. Project risk assessment using the analytic hierarchy process. IEEE Trans. Eng. Manag. 1991, 38, 46–52. [Google Scholar] [CrossRef]
- Leśniak, A.; Kubek, D.; Plebankiewicz, E.; Zima, K.; Belniak, S. Fuzzy AHP Application for Supporting Contractors’ Bidding Decision. Symmetry 2018, 10, 642. [Google Scholar] [CrossRef]
- Ramkumar, M.; Schoenherr, T.; Jenamani, M. Risk assessment of outsourcing e-procurement services: Integrating SWOT analysis with a modified ANP-based fuzzy inference system. Prod. Plan. Control 2016, 27, 1171–1190. [Google Scholar] [CrossRef]
- Ramkumar, M. A modified ANP and fuzzy inference system based approach for risk assessment of in-house and third party e-procurement systems. Strateg. Outsourc. 2016, 9, 159–188. [Google Scholar] [CrossRef]
- Wang, Y.M.; Liu, J.; Elhag, T.M.S. An integrated AHP–DEA methodology for bridge risk assessment. Comput. Ind. Eng. 2008, 54, 513–525. [Google Scholar] [CrossRef]
- Taylan, O.; Kabli, M.R.; Porcel, C.; Herrera-Viedma, E. Contractor selection for construction projects using consensus tools and big data. Int. J. Fuzzy Syst. 2018, 20, 1267–1281. [Google Scholar] [CrossRef]
- Taylan, O.; Bafail, A.O.; Abdulaal, R.M.S.; Kabli, M.R. Construction projects selection and risk assessment by fuzzy AHP and fuzzy TOPSIS methodologies. Appl. Soft Comput. 2014, 17, 105–116. [Google Scholar] [CrossRef]
- Chen, P.; Wang, J. Application of a fuzzy AHP method to risk assessment of international construction projects. In Proceedings of the 2009 International Conference on Electronic Commerce and Business Intelligence, Beijing, China, 6–7 June 2009; pp. 459–462. [Google Scholar] [CrossRef]
- Ebrahimnejad, S.; Mousavi, S.M.; Seyrafianpour, H. Risk identification and assessment for build–operate–transfer projects: A fuzzy multi attribute decision making model. Expert Syst. Appl. 2010, 37, 575–586. [Google Scholar] [CrossRef]
- Lam, K.C.; Wang, D.; Lee, P.T.; Tsang, Y.T. Modelling risk allocation decision in construction contracts. Int. J. Proj. Manag. 2007, 25, 485–493. [Google Scholar] [CrossRef]
- Tah, J.H.; Carr, V. Knowledge-based approach to construction project risk management. J. Comput. Civ. Eng. 2001, 15, 170–177. [Google Scholar] [CrossRef]
- Carr, V.; Tah, J.H. A fuzzy approach to construction project risk assessment and analysis: Construction project risk management system. Adv. Eng. Softw. 2001, 32, 847–857. [Google Scholar] [CrossRef]
- Abdelgawad, M.; Fayek, A.R. Risk management in the construction industry using combined fuzzy FMEA and fuzzy AHP. J. Constr. Eng. Manag. 2010, 136, 1028–1036. [Google Scholar] [CrossRef]
- KarimiAzari, A.; Mousavi, N.; Mousavi, S.F.; Hosseini, S. Risk assessment model selection in construction industry. Expert Syst. Appl. 2011, 38, 9105–9111. [Google Scholar] [CrossRef]
- Zegordi, S.; Nik, E.R.; Nazari, A. Power plant project risk assessment using a fuzzy-ANP and fuzzy-TOPSIS method. Int. J. Eng.-Trans. B Appl. 2012, 25, 107–120. [Google Scholar] [CrossRef]
- Karsak, E.E.; Tolga, E. Fuzzy multi-criteria decision-making procedure for evaluating advanced manufacturing system investments. Int. J. Prod. Econ. 2001, 69, 49–64. [Google Scholar] [CrossRef]
- Jaganathan, S.; Erinjeri, J.J.; Ker, J.I. Fuzzy analytic hierarchy process based group decision support system to select and evaluate new manufacturing technologies. Int. J. Adv. Manuf. Technol. 2007, 32, 1253–1262. [Google Scholar] [CrossRef]
- Project Management Institute. Project Management Body of Knowledge (PMBOK), 5th ed.; Project Management Institute: Newtown Square, PA, USA, 2013. [Google Scholar]
- Saaty, T.L. Decision-making with the AHP: Why is the principal eigenvector necessary. Eur. J. Oper. Res. 2003, 145, 85–91. [Google Scholar] [CrossRef]
- Abel, E.; Mikhailov, L.; Keane, J. Group aggregation of pairwise comparisons using multi-objective optimization. Inf. Sci. 2015, 322, 257–275. [Google Scholar] [CrossRef]
- Ishizaka, A.; Labib, A. Review of the main developments in the analytic hierarchy process. Expert Syst. Appl. 2011, 38, 14336–14345. [Google Scholar] [CrossRef]
- Kang, J.K.; Min, B.C. Theory and Practice of AHP; Intervision: Seoul, Korea, 2008. [Google Scholar]
- Saaty, T.L. Theory and Applications of the Analytic Network Process: Decision Making with Benefits, Opportunities, Costs, and Risks; RWS Publications: Pittsburgh, PA, USA, 2005. [Google Scholar]
- Siraj, S.; Mikhailov, L.; Keane, J. A heuristic method to rectify intransitive judgments in pairwise comparison matrices. Eur. J. Oper. Res. 2012, 216, 420–428. [Google Scholar] [CrossRef]
- MathWorks, Inc.; Wang, W.-C. Fuzzy Logic Toolbox: For Use with MATLAB: User’s Guide; Mathworks Incorporated: Natick, MA, USA, 1998. [Google Scholar]
- Kim, Y.G.; Lee, E.B. Optimal Investment Timing with Investment Propensity Using Fuzzy Real Options Valuation. Int. J. Fuzzy Syst. 2018, 20, 1888–1900. [Google Scholar] [CrossRef]


| Level 1 | Level 2 | Level 3 | ||
|---|---|---|---|---|
| R1 Project External Environment | R11 | Characteristics of local government | R111 | Business practices and consistency of laws and policies |
| R112 | Local government regulations on the industry | |||
| R113 | Need for localization | |||
| R12 | Economy, market situation | R121 | The economic situation of the country to be promoted | |
| R122 | Changes in economic indicators (exchange rate, inflation rate, interest rate, etc.) | |||
| R123 | Market demand for the target product and competition | |||
| R124 | Downstream industry and material prices volatility | |||
| R13 | Social and cultural characteristics | R131 | Social stability | |
| R132 | Characteristics of local labor force | |||
| R133 | Cultural feature | |||
| R134 | Local awareness of the project | |||
| R14 | Geography/Climate and infrastructure conditions | R141 | Climate characteristics | |
| R142 | Characteristics of soil | |||
| R143 | Distance from home country | |||
| R144 | Status and plans of Infrastructure and utility | |||
| R15 | Legal standards (regulations) | R151 | Legal standards of design and licensing criteria | |
| R152 | Tariff standard | |||
| R153 | Environmental regulations | |||
| R154 | Procedures and criteria for repatriation of profits | |||
| R155 | Regulations on transfer of technology in home country | |||
| Level 1 | Level 2 | Level 3 | ||
|---|---|---|---|---|
| R2 Project Feasibility and Planning | R21 | Members of the project | R211 | Characteristics of a local joint venture |
| R212 | Capabilities of sub-contractor and material supplier | |||
| R213 | Features of lender (requirements) | |||
| R22 | Coal, raw materials, coke | R221 | Conditions of coal, ore, and raw materials | |
| R222 | Procurement plan of coal, ore, and raw materials | |||
| R23 | Scope and requirements for completion of the Project | R231 | Characteristics (process composition) and capacity of target product | |
| R232 | Schedule of the project | |||
| R233 | Suitability and validity of the applied process and technology | |||
| R234 | Documents and outputs related to the project | |||
| R235 | Performance requirements | |||
| R24 | Economics (profitability) | R241 | Investment costs | |
| R242 | Operating expenses | |||
| R243 | Revenue (product sales and prices) | |||
| R244 | Financing plan | |||
| R245 | Components and scale of license fees | |||
| Level 1 | Level 2 | Level 3 | ||
|---|---|---|---|---|
| R3 Project Contract | R31 | Clarity of contract | R311 | Experience with similar contracts |
| R312 | Clarification of criteria on LD (liquidated damages) | |||
| R313 | Ambiguous contract terms (imperfection) | |||
| R314 | Specification of force majeure | |||
| R32 | License contract | R321 | Infringement of intellectual property rights of third parties | |
| R322 | Prohibition of license transfer | |||
| R33 | Technology protection | R331 | Technology spill prevention plan | |
| R332 | Excessive requirements on the joint venture (or licensee) related to the technology | |||
| R333 | Access to operational records and ownership of developed technologies after completion | |||
| R34 | O&M contract | R341 | Excessive O&M expenses | |
| R342 | Poor plant availability and performance | |||
| Level 1 | Level 2 | Level 3 | ||
|---|---|---|---|---|
| R4 EPC | R41 | Engineering | R411 | Construction/Complexity |
| R412 | Specification of major equipment | |||
| R413 | Timeliness of design | |||
| R414 | Design faults (errors) and omissions | |||
| R42 | Procurement | R421 | Manpower procurement plan | |
| R422 | Procurement plan of major equipment | |||
| R43 | Construction | R431 | Selection of suitable construction method | |
| R432 | Transportation and quality assurance of construction materials and equipment | |||
| R433 | Collaboration with partners and local businesses | |||
| R434 | Worker’s safety management and construction safety facility | |||
| Project A | Project B | |
|---|---|---|
| Country | China | Iran |
| Company | National Steel Company | Trading company |
| Project | 3 million tons of integrated steel mill using new steel technology | 3 million tons of integrated steel mill using new steel technology |
| Financing | Equity to Debt = 40:60 Technology provider to Acquirer = 49:51 | Equity to Debt = 30:70 Technology provider to Acquirer = 20:80 |
| Features | Demand for steel in the region is expected to increase due to Western development strategies. Eco-friendly steel mill with new technology is established in accordance with the government’s environmental regulations | New investments are made in steel plants as economic sanctions are lifted. Local abundant natural gas can be used |
| Degree of Influence | VL | L | M | H | VH | |
|---|---|---|---|---|---|---|
| Likelihood of Occurrence | ||||||
| VL | VL | VL | L | M | M | |
| L | VL | L | M | M | H | |
| M | L | M | M | H | VH | |
| H | M | M | H | VH | VH | |
| VH | M | H | VH | VH | VH | |
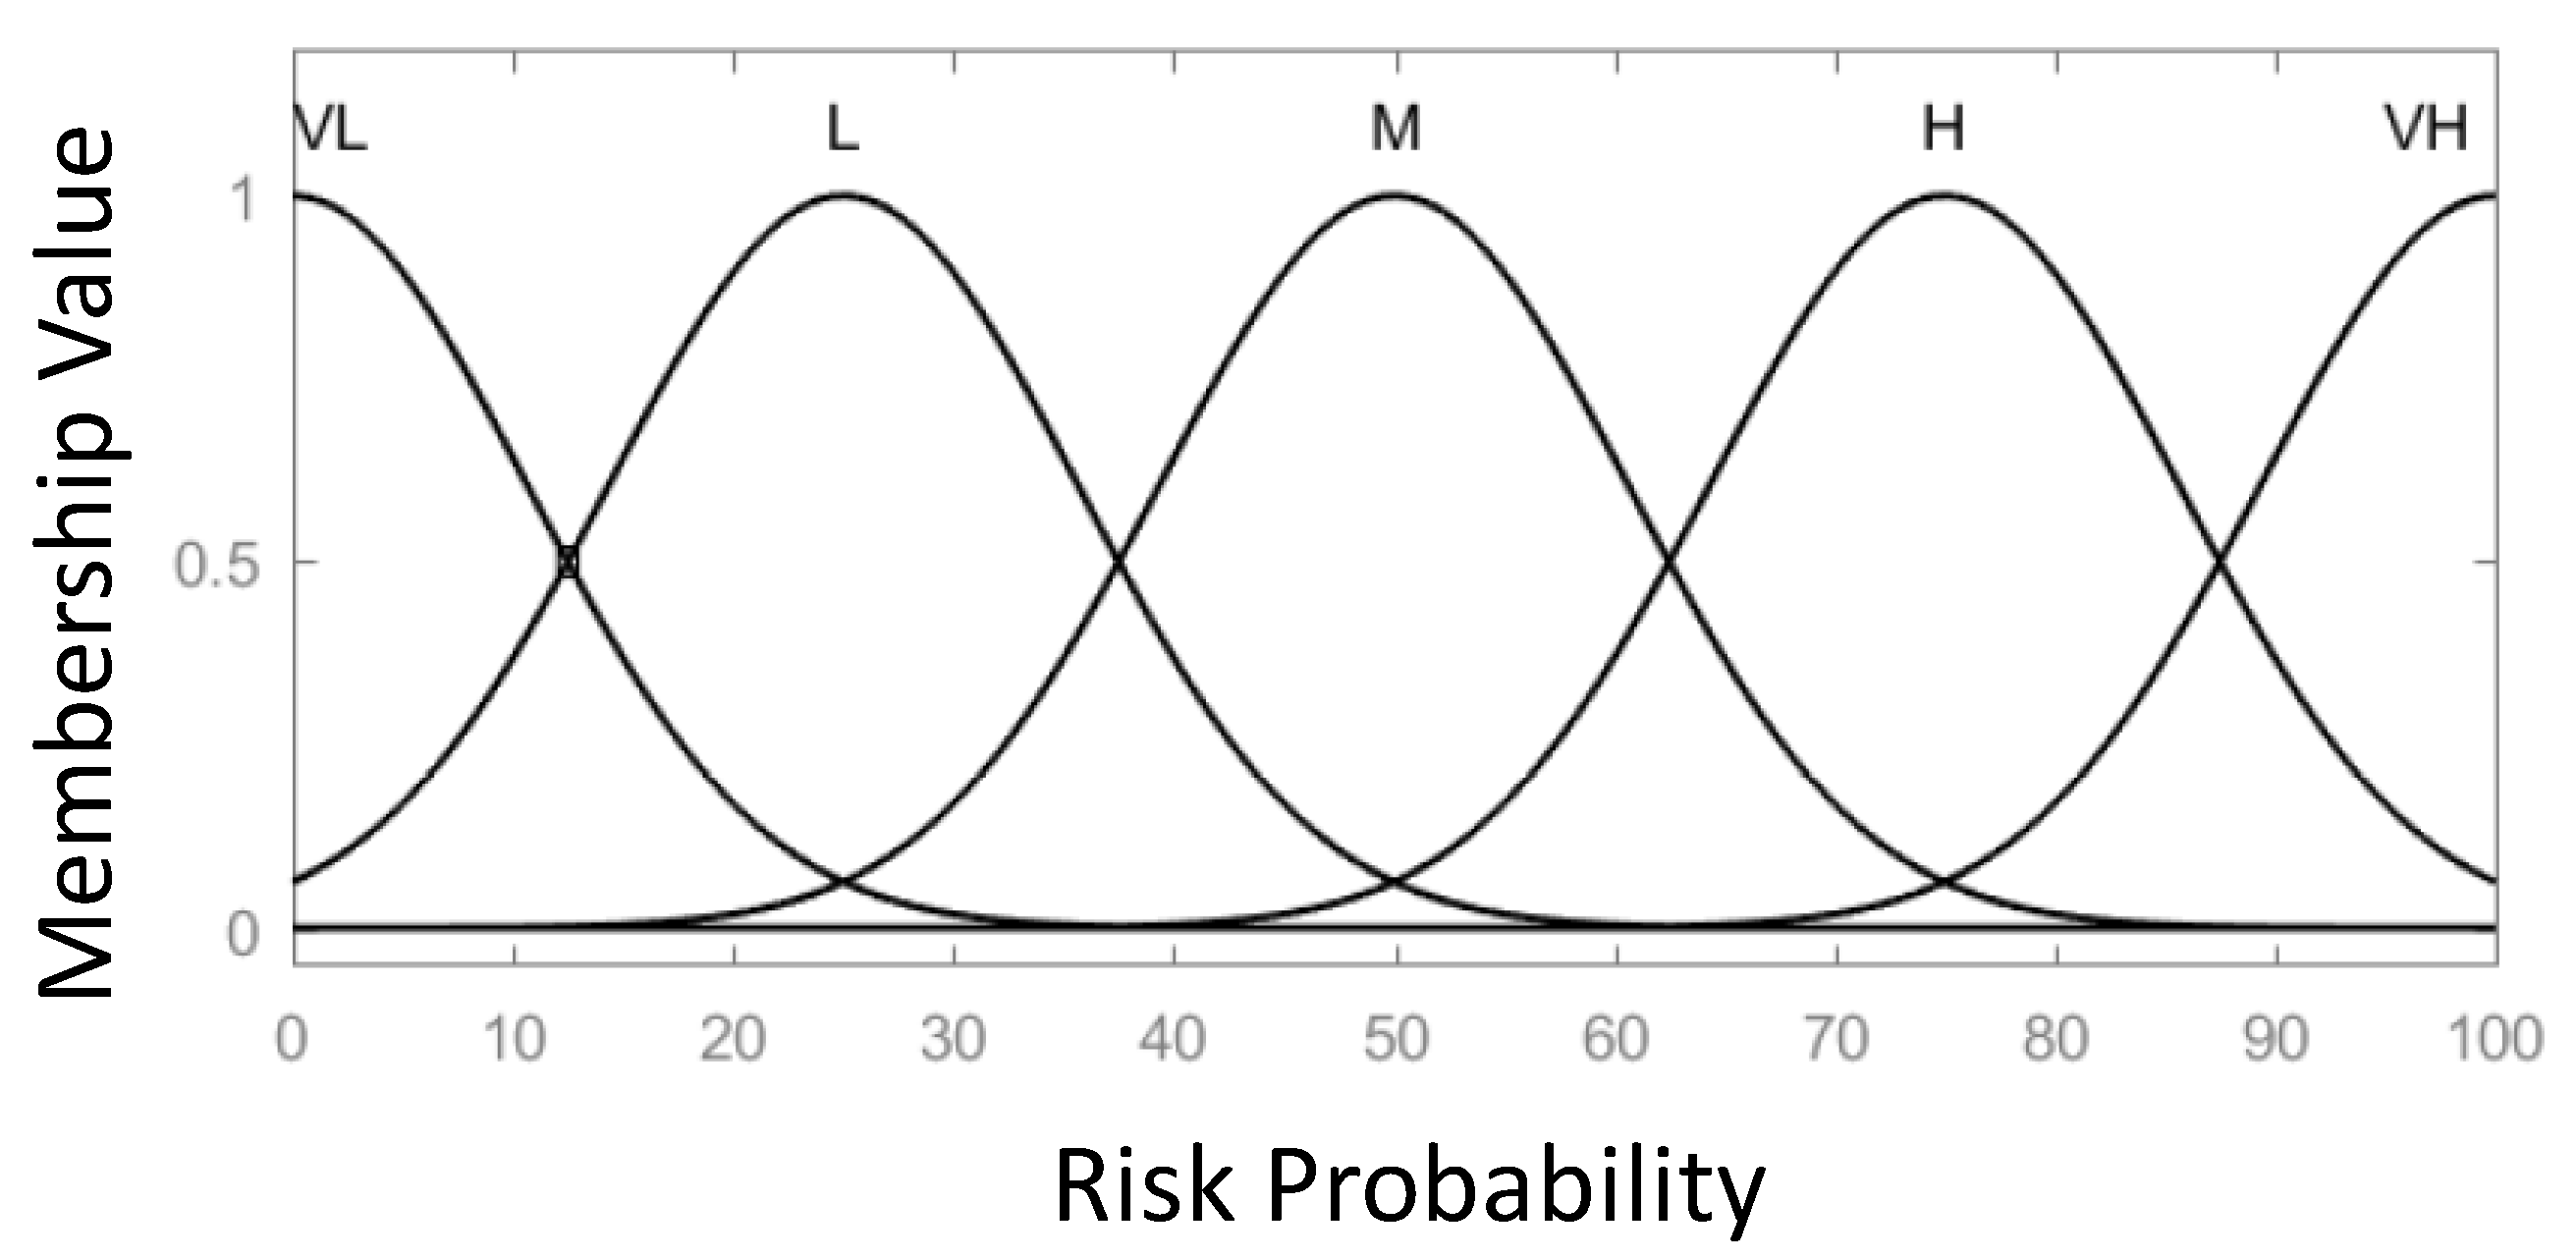
| Linguistic Variable | Gaussian MF Parameter | |
|---|---|---|
| Center (c) | Sigma (σ) | |
| Very Low | 0 | 10.5 |
| Low | 25 | |
| Medium | 50 | |
| High | 75 | |
| Very High | 100 | |
| Level 1 | Weight | Rank | Level 2 | Local Weight | Global Weight | Rank | ||
|---|---|---|---|---|---|---|---|---|
| R1 | Project External Environment | 0.194 | 4 | R11 | Characteristics of local government | 0.26 | 4.99 | 10 |
| R12 | Economy, market situation | 0.20 | 3.97 | 14 | ||||
| R13 | Social and cultural characteristics | 0.11 | 2.20 | 16 | ||||
| R14 | Geography/Climate and infrastructure conditions | 0.17 | 3.30 | 15 | ||||
| R15 | Legal standards (regulations) | 0.26 | 4.96 | 11 | ||||
| R2 | Project Feasibility and Planning | 0.284 | 1 | R21 | Project stakeholder | 0.14 | 4.03 | 13 |
| R22 | Coal, ore, and raw materials | 0.27 | 7.54 | 6 | ||||
| R23 | Scope and requirements for completion of the Project | 0.19 | 5.37 | 8 | ||||
| R24 | Economics (profitability) | 0.40 | 11.47 | 1 | ||||
| R3 | Contract | 0.278 | 2 | R31 | Clarity of contract | 0.34 | 9.43 | 3 |
| R32 | License contract | 0.20 | 5.64 | 7 | ||||
| R33 | Technology protection | 0.28 | 7.71 | 5 | ||||
| R34 | O&M contract | 0.18 | 5.00 | 9 | ||||
| R4 | EPC | 0.244 | 3 | R41 | Engineering | 0.44 | 10.68 | 2 |
| R42 | Procurement | 0.19 | 4.75 | 12 | ||||
| R43 | Construction | 0.37 | 8.97 | 4 | ||||
| Rank | Weight | Risk factor (Level 3) |
|---|---|---|
| 2 | 4.75 | Design faults (errors) and omissions |
| 3 | 3.75 | Poor plant availability and performance |
| 4 | 3.22 | Access to operational records and ownership of developed technologies after completion |
| 5 | 3.04 | Technology spill prevention plan |
| 6 | 3.02 | Ambiguous contract terms (imperfection) |
| 7 | 3.02 | Clarification of criteria on LD (liquidated damages) |
| 8 | 2.91 | Investment costs |
| 9 | 2.88 | Infringement of intellectual property rights by third parties |
| 10 | 2.79 | Revenue (product sales and prices) |
| 11 | 2.76 | Prohibition of license transfer |
| 12 | 2.7 | Conditions for coal, ore, and raw materials |
| Rank | Initial Rank by Priority | Project A | Project B |
|---|---|---|---|
| 1 | Procurement plan of coal, ore, and raw materials | Procurement plan of coal, ore, and raw materials | Procurement plan of coal, ore, and raw materials |
| 2 | Design faults (errors) and omissions | Design faults (errors) and omissions | Design faults (errors) and omissions |
| 3 | Poor plant availability and performance | Conditions for coal, ore, and raw materials | Poor plant availability and performance |
| 4 | Access to operational records and ownership of developed technologies after completion | Technology spill prevention plan | Conditions for coal, ore, and raw materials |
| 5 | Technology spill prevention plan | Investment cost | Investment cost |
| 6 | Ambiguous contract terms (imperfection) | Ambiguous contract terms (imperfection) | Ambiguous contract terms (imperfection) |
| 7 | Clarification of criteria on LD (liquidated damages) | Clarification of criteria on LD (liquidated damages) | Clarification of criteria on LD (liquidated damages) |
| 8 | Investment cost | Poor plant availability and performance | Financing plan |
| 9 | Infringement of intellectual property rights by third parties | Access to operational records and ownership of developed technologies after completion | Technology spill prevention plan |
| 10 | Revenue (product sales and prices) | Specification of major equipment | Specification of major equipment |
| 11 | Prohibition of license transfer | Procurement plan of major equipment | Procurement plan of major equipment |
| 12 | Conditions for coal, ore and raw materials | Requirements for preliminary commissioning and takeover | Revenue (product sales and prices) |
| Risk Factor | Response Mitigation Measures |
|---|---|
| Procurement plan of coal, ore, and raw materials | Understanding the status of available raw materials Review of location and logistics Review of feedstock supply agreement strategy |
| Design faults (errors) and omissions | Creation of design output checklist Sharing design output by discipline and reinforcement of crosschecks Strengthening communication with local companies |
| Conditions of coal, ore, and raw materials | Preliminary review and test of locally procured coal, ore, and raw materials |
| Technology spill prevention plan | Packaging design output and sharing only final output Adjustment of scope of project output at contract |
| Investment cost | Adjustment of project scope Optimization of equipment and design Localization of equipment and design Estimating the preliminary cost considering fluctuation such as exchange rates |
| Poor plant availability and performance | Documentation of O&M techniques for existing plant Improvement in availability and performance at the design stage Configuration and application of proven facilities |
| 1st Risk Assessment | 2nd Risk Assessment (After Response) | ||||||
|---|---|---|---|---|---|---|---|
| Risk Rank | 72.9702/100 | 66.9258/100 | |||||
| Weight | Score | Weight | Score | ||||
| 1 | Procurement plan of coal, ore, and raw materials | 4.85 | 4.86 | Procurement plan of coal, ore, and raw materials | 4.85 | 2.62 | |
| 2 | Design faults (errors) and omissions | 4.75 | 3.69 | Technology spill prevention plan | 3.04 | 2.50 | |
| 3 | Conditions of coal, ore and raw materials | 2.70 | 3.10 | Ambiguous contract terms (imperfection) | 3.02 | 2.44 | |
| 4 | Technology spill prevention plan | 3.04 | 2.71 | Design faults (errors) and omissions | 4.75 | 2.30 | |
| 5 | Investment cost | 2.91 | 2.58 | Clarification of criteria on LD (Liquidated damages) | 3.02 | 2.30 | |
| 1st Risk Assessment | 2nd Risk Assessment (After Response) | ||||||
|---|---|---|---|---|---|---|---|
| Risk Score | 70.0003/100 | 64.4484/100 | |||||
| Weight | Score | Weight | Score | ||||
| 1 | Procurement plan of coal, ore, and raw materials | 4.85 | 3.77 | Ambiguous contract terms (imperfection) | 3.02 | 2.43 | |
| 2 | Design faults (errors) and omissions | 4.75 | 2.93 | Clarification of criteria on LD (Liquidated damages) | 3.02 | 2.33 | |
| 3 | Poor plant availability and performance | 3.75 | 2.69 | Financing plan | 2.60 | 2.29 | |
| 4 | Conditions of coal, ore and raw materials | 2.70 | 2.53 | Technology spill prevention plan | 3.04 | 2.23 | |
| 5 | Investment cost | 2.91 | 2.48 | Design faults (errors) and omissions | 4.75 | 2.02 | |
© 2018 by the authors. Licensee MDPI, Basel, Switzerland. This article is an open access article distributed under the terms and conditions of the Creative Commons Attribution (CC BY) license (http://creativecommons.org/licenses/by/4.0/).
Share and Cite
Kim, M.-S.; Lee, E.-B.; Jung, I.-H.; Alleman, D. Risk Assessment and Mitigation Model for Overseas Steel-Plant Project Investment with Analytic Hierarchy Process—Fuzzy Inference System. Sustainability 2018, 10, 4780. https://0-doi-org.brum.beds.ac.uk/10.3390/su10124780
Kim M-S, Lee E-B, Jung I-H, Alleman D. Risk Assessment and Mitigation Model for Overseas Steel-Plant Project Investment with Analytic Hierarchy Process—Fuzzy Inference System. Sustainability. 2018; 10(12):4780. https://0-doi-org.brum.beds.ac.uk/10.3390/su10124780
Chicago/Turabian StyleKim, Min-Sung, Eul-Bum Lee, In-Hye Jung, and Douglas Alleman. 2018. "Risk Assessment and Mitigation Model for Overseas Steel-Plant Project Investment with Analytic Hierarchy Process—Fuzzy Inference System" Sustainability 10, no. 12: 4780. https://0-doi-org.brum.beds.ac.uk/10.3390/su10124780