Research on Technological Innovation Efficiency of Tourist Equipment Manufacturing Enterprises


1
School of Business Administration, Nanjing University of Finance & Economics, Nanjing 210023, China
2
Postdoctoral Program, Southeast University, Nanjing 210000, China
3
Department of Management Science and Engineering, School of Management, Shanghai University, Shanghai 200444, China
4
School of Management, University of South Australia, South Australia 5000, Australia
*
Author to whom correspondence should be addressed.
Sustainability 2018, 10(12), 4826; https://0-doi-org.brum.beds.ac.uk/10.3390/su10124826
Submission received: 17 October 2018
/
Revised: 13 December 2018
/
Accepted: 14 December 2018
/
Published: 18 December 2018
(This article belongs to the Special Issue Transition from China-Made to China-Innovation
)
Abstract
:With the lack of quantitative literature related to the tourist equipment manufacturing industry, this study used the innovation input and output data from 12 listed tourist equipment manufacturing companies in 2011–2017 and employed data envelopment analysis (DEA)–Malmquist to analyze the change of technological innovation efficiency. The Malmquist index and its decompositions were used as dependent variables separately, and government ownership, cooperation with academics, and cooperation with international corporations as independent variables to construct a Tobit regression model. The results of static DEA show that the efficiencies of 12 tourist equipment manufacturing enterprises display a slight decline rule, and DEA–Malmquist analysis showed that the decline of technological innovation efficiency main derives from both the decline of technical efficiency and technical level. Moreover, other innovative subjects have different impacts on the technological innovation efficiency of China’s tourist equipment manufacturing enterprises. Thus, enterprises need to increase input of innovation and enhance the management level. In addition, they should manage the relationship between these innovative subjects and enhance the ability of collaborative innovation and independent innovation.
1. Introduction
With the development and upgrade of the manufacturing industry and the implementation of “China’s manufacturing 2025” [1], technological progress, deregulation and management innovation lead to the blurring or disappearance of boundaries between different industries. Industrial enterprises tend to intersect and permeate each other to form new industries [2]. In this background, the tourist equipment manufacturing industry, which was formed by the integration of the manufacturing industry and tourist industry, has become as an emerging industry supported and developed by the state.
As a product of the integration of the manufacturing industry and tourist industry, China’s tourist equipment manufacturing industry is still in the preliminary research stage. The tourist equipment manufacturing industry is the set of enterprises that offer equipment production or intermediate goods to tourist enterprises and tourists. In September 2015, the state council of China published “The Implementation Suggestions on Promoting the Development of the Tourist Equipment Manufacturing Industry” [3]. It points out that the tourist equipment manufacturing industry is characterized by high growth, high knowledge, and high value added, with a long industrial chain, driving effect, and broad market prospect. Accelerating the development of the tourist equipment manufacturing industry is significant to promoting the upgrade of the industrial structure of China’s equipment manufacturing industry, cultivating new economic growth points, promoting a steady growth of the national economy, transforming the development pattern. and adjusting the industrial structure.
Enterprises which offer cruise ships, low-altitude aircrafts, and recreational vehicles in China’s market are increasing in recent years, and the tourist equipment manufacturing industry is experiencing a rapid development from scratch [4]. However, severe problems exist in both the production practices and academic levels of China’s tourist equipment manufacturing industry. Firstly, the majority of China’s tourist equipment manufacturing enterprises lie in the process of working and assembly of the industrial value chain. Their core technologies are dependent on imports, and their products lack innovation; those factors lead to a limited innovation ability of enterprises, which strictly constrains the space for sustainable development of the tourist equipment manufacturing industry. Secondly, as an emerging term with Chinese characteristics, the tourist equipment manufacturing industry has rarely been studied by domestic scholars and foreign researchers [5]. Furthermore, the existing literature mainly focuses on the concept differentiation and the qualitative description of the industrial status, etc., with a lack of quantitative research on the development status and direction of the industry. Finally, since the development of manufacturing industry is mostly accompanied by a large amount of energy consumption and waste discharge, the scale and the level of technological and management innovation of manufacturing enterprises directly determine whether the manufacturing industry can achieve coordinated and sustainable development with society, economy, and the environment. Therefore, the analysis of the technological innovation efficiency of China’s tourist equipment manufacturing enterprises is undoubtedly of great significance.
In this study, data envelopment analysis (DEA)–Malmquist was used to evaluate the change of technological innovation efficiency of the tourist equipment manufacturing industry and Tobit regression was employed to explore the factors which can influence the innovation efficiency of the tourist equipment manufacturing industry.
The structure of this paper is as follows: The second part is a literature review; the third part outlines the research methods and presents the data and variables; the fourth part gives the empirical results and analysis; and the fifth part provides a conclusion and some implications.
2. Literature Review
As a product of the in-depth integration of the tourist industry and the equipment manufacturing industry, the tourist equipment manufacturing industry has not received extensive attention from the academic community [2]. However, compared with the sparsely academic research on the tourist equipment manufacturing industry, the research results of the equipment manufacturing industry are fruitful, mainly concentrated on the industrial agglomeration of the equipment manufacturing industry [6], innovation [7], efficiency evaluation [8], industry competitiveness [9], and other aspects. China, being the largest trading country in the equipment manufacturing industry in 2009, faces problems such as insufficient independent innovation capacity, excess capacity at the medium and low ends of the value chain combined with inadequate guarantee capacity of high-end industries, and weak international competitiveness of domestic enterprises [10]. Past research has shown that the equipment manufacturing industry of China has a strong tendency to be resource-intensive and is still at the low-end value chain of the global industrial chain [11], indicating that China’s equipment manufacturing industry has no enough advantage in international competition [12]. Similarly, Chen and Liu [13] calculated the consumption rate of China’s equipment manufacturing industry in various industries through four years of input–output data. Research showed that China’s equipment manufacturing industry has a strong resource-intensive tendency, while being less dependent on productive services. Kaplinsky and Morris [14] point out that only a “high-end” manufacturing industry can improve enterprises’ profitability and competitiveness, while the “low-end” manufacturing industry would drag the economy into the dilemma of poverty-type growth. Due to the characteristics of high energy consumption and high emissions, a lot of literature has studied the relationship among manufacturing development, technological innovation, and sustainable development in recent years. From the microlevel, Garbiea [15] set indicators based on the “three pillars” of sustainable development, namely, economic, social, and environmental, and measured the sustainable development index of manufacturing enterprises. Lovdal and Neumann [16] proposed to improve the development level and sustainability of the energy equipment industry through internationalization strategies. Xie et al. [17] indicated China has gained the reputation of a “global factory” due to its phenomenal industrial growth over the past decades, but its industrial energy consumption has resulted in serious environmental problems. Si and Qiao [18] used CCR (a DEA model considering scale efficiency), BCC (a DEA model without considering scale efficiency), and the scale efficiency method to analyze the dynamic development trend of technological innovation efficiency in China’s equipment manufacturing industry. The results showed the majority of sectors should improve their pure technology and scale efficiency, and technological innovation is an important driving force for the transformation and upgrade of China’s equipment manufacturing industry.
Fan and Du [19] showed that both the overall and stage technological innovation efficiency of China’s high-end equipment manufacturing has different degrees of fluctuations and differences among the sub-industries, and the low efficiency of R and D restricts the whole optimization of efficiency. Further, analyzing, obviously, the low technological innovation efficiency restricts the sustainable development of China’s tourist equipment manufacturing industry [20]. To the best of our knowledge, there does not exist any research on the technological innovation efficiency of China’s tourist equipment manufacturing industry. Considering that DEA is a widely used method in efficiency evaluation, the results of DEA can also be used as the original data for Tobit regression, logistic regression, AHP (Analytic Hierarchy Process), and other methods to explore more valuable conclusions. Therefore, based on the perspective of sustainable development, the study employs the DEA–Malmquist method, using R and D input and output data of 12 listed companies in China’s equipment manufacturing industry to evaluate the change of technological innovation efficiency.
Helix models can help to understand the coevolution of innovation between enterprise and other innovative subjects [21]. The triple helix model explores the transformation of knowledge between university–industry–government, and regards universities, industry, and the government as important poles in the spiral of innovation process [22]. In addition to completing their traditional functions, they interact and coevolve with the rest to form a new “triple spiral” relationship, and release a continuous flow of innovation, improving the regional efficiency of technological innovation [23]. The quadruple helix broadens the triple helix by blending in features of the public, such as civil society and the media-based and culture-based public [24]. Based on the triple helix and the quadruple helix, the quintuple helix brings in the perspective of the natural environments of society and the economy for knowledge production and the innovation systems [25]. Thus, in addition to studying the technological innovation efficiency of tourist equipment manufacturing enterprises, it is necessary to examine the influence of the government, universities, and international organizations on enterprises’ innovation. Collaborative innovation with the government, universities, international companies, and other innovative subjects is an important method for enterprises to obtain external innovation resources, which significantly expand the technical field, bear research and development (R and D) costs, and disperse R and D risks [26]. Using two longitudinal panel datasets of Chinese manufacturing firms, Zhou et al. [27] found that state ownership in an emerging economy enables a firm to obtain crucial R and D resources while making the firm less efficient in using those resources to generate innovation, especially for start-up firms or enterprises which are involved in the fierce industrial competition. In addition, government spending can improve the environment and infrastructure of technological innovation and improve the output level of enterprises’ technological innovation [28]. However, a lot of research has stated that government grants partly crowd out private R and D to negatively affect innovation efficiency [29,30]. Although the social relationships of enterprises in collaboration with academics can improve an enterprise’s ability to absorb knowledge, integrate resources, acquire more explicit knowledge and tacit knowledge, and improve the enterprise’s innovation performance, the assessment of university–industry collaborative projects are complicated [31]. As for international corporation, a lot of literature has indicated that technology import and foreign investment would promote the innovation capability of domestic enterprises [32]. However, China’s equipment manufacturing industry is at a low technology level and domestic enterprises have weak capability in international competition [10]. Thus, it is uncertain how the government, universities, and international corporations influence the innovation efficiency of China’s tourist equipment manufacturing industry. To explore these factors, the Malmquist index and its decompositions are used as dependent variables, while government ownership, collaboration with academics, and collaboration with international corporations are used as independent variables, and then the Tobit regression method is used to explore the synergistic relationship of China’s equipment manufacturing industry with the government, universities, and international corporations.
3. Methods, Variables, and Data Descriptions
3.1. Research Methods
3.1.1. Data Envelopment Analysis (DEA)
The evaluation methods of product innovation efficiency mainly include parametric method and nonparametric method. Data envelopment analysis (DEA) is a nonparametric method using a linear programming approach to measure multiple inputs and outputs. The simulation results of Banker and Natarajan [33] prove that DEA is more effective than the parameter estimation method. The essence of DEA is using a mathematical programming model to estimate best-practice frontiers without a priori underlying functional form assumption through computing multi-input/multi-output values [34]. DEA was first proposed by Charnes et al. [35] as a statistical analysis method for efficiency evaluation under the hypothesis of “relative effectiveness”, and the CCR model is suitable for efficiency comparison under the constant return scale (CRS). Subsequently, Banker et al. [36] put forward the BCC model to explain the efficiency of a decision unit under a variable return scale (VRS). With in-depth study, a number of different DEA models and their corresponding real-world applications have appeared in the literature [37]. The major advantage of the DEA approach is that DEA does not require any assumptions about the function form. That means that DEA does not need any a priori information on the underlying functional forms and weights among various input and output factors. Therefore, it is reasonable to select DEA for technological innovation efficiency evaluation in this study. However, since DEA is only an afterward method for efficiency evaluation, its results are difficult to be applied in practice. Therefore, factors which affect efficiency are usually further explored by Tobit regression analysis [38].
3.1.2. DEA–Malmquist
Due to the uniqueness of an enterprise’s technological innovation, the evaluation of its efficiency needs to analyze the status of decision units in “multiple time periods”. The traditional static DEA is only applicable to the analysis of the status of each decision unit in a specific “point-in-time” [39]. Instead of the traditional DEA model, the dynamic DEA–Malmquist model was introduced in this research [40,41,42,43].
According to Fare et al. [44], the output-based Malmquist index assumes that for each time period t = 1, 2…T, the production technology St models the transformation of inputs into outputs , and the function of St is:
The output distance function is defined at t as:
In Formula (2), xt represents the input vector while yt represents the output vector, θ on behalf of the directional output indicators. According to Xu and Qu [42], if and only if , ; while if and only if is on the boundary or frontier of technology, .
Formula (3) is used to measure the Malmquist index of total factor productivity growth from t to t + 1:
In Formula (3), (xt, yt) and (xt+1, yt+1) respectively represent the input and output vectors in the t period and t + 1 period. and respectively represent the distance function of period t and period t + 1, with reference to the technology in period t.
With reference to the technology in period t, the output-based Malmquist index can be expressed as:
Similarly, with reference to the technology in period t + 1, the output-based Malmquist index can be expressed as:
Assuming that constant returns to scale, the Malmquist index can be decomposed into an index of technical efficiency change (EC) and index of technical level change (TC), as shown in the formulas:
When xt = xt+1 and yt = yt+1, it means that there is no change in input and output in this period. Technical efficiency refers to the approach to the optimal production state and measures the catch-up degree of the decision-making unit to the optimal production state from the t period to the t+1 period, which is called the “catch-up effect” [45]. However, the technical level refers to the outward translation of the optimal production state boundary, which is used to measure the movement from period t to period t + 1, namely, the “growth effect”. When EC >1, the decision-making unit approaches the frontier, indicating that the efficiency increases, and vice versa. In addition, when TC >1, the production possibility boundary moves outwards, indicating that there is progress or innovation, and the efficiency increases. Moreover, the index of technical efficiency change (EC) can be further decomposed into an index of pure technical efficiency change (PEC) and index of scale efficiency change (SEC), as shown in the formula:
In general, as mentioned by Xia and Zhong [46], the CCR and BCC models can be used to solve the Malmquist index. However, four different distance functions should be solved when we need to calculate the Malmquist index of the input vector and output vector in any adjacent two years [44,46].
In these formulas, k represents the decision-making unit, hereafter enterprise in this study. Zk,t is an intensity indicator variable, which measures the intensity of specific activities that may be employed in the process of production.
3.2. Description of Variables and Indicators
There is no consistent standard for the selection of innovation indicator variables [47]. However, two aspects of it need to be considered: First, there should be no multicollinearity between the input or output indicators; second, in terms of performance evaluation of technological innovation, researchers usually consider the employee involvement, R and D input, and other technological innovation expenses as the input index, while they always set the output index from the benefits of technological innovation products and total benefits of enterprises [39]. Considering that the availability of statistical data and the fact of China’s tourist equipment manufacturing industry, the variables and indicators selected in this paper and corresponding explanations are shown in Table 1.
(1) Innovation input variable X1: Intensity of R and D personnel. Humans are the subject of innovation activity; thus, employee participation is crucial for an enterprise’s innovation. We consider R and D personnel as a measurement for innovation input. However, large enterprises usually have more employees and relatively more R and D personnel, while small and medium-sized enterprises have fewer employees and R and D personnel. It is unsuitable if we only use R and D personnel as an indicator. In order to avoid this problem as far as possible, this article chooses the proportion of R and D personnel to the total number of employees to measure the innovation input variable, which is named the intensity of R and D personnel.
(2) Innovation input variable X2: Intensity of R and D expenditure. Wen and Feng [48] take R and D expenditure as the indicator to measure innovation input, but the investment of enterprises of different sizes is different. Therefore, this research adopts the ratio of R and D expenditure to operating income to measure the innovation input variable, which is recorded as the intensity of R and D expenditure.
(3) Innovation output variable Y1: Number of patent applications. Jiang and Guan [49] use the number of patent applications as a measurement of innovation output. The stronger the innovation activity, the more the patent output. Thus, this article takes the number of patent applications as the indicator to measure the innovation output.
(4) Innovation output variable Y2: Profit ratio of sales. Wang and Li [50] take the profit ratio of sales as an indicator to measure corporate profit ratio, which is the ratio of total profit to operating income. Thus, this article takes the profit ratio of sales as the indicator to measure the innovation output variable, which reflects the overall innovation performance of the enterprise from the perspective of finance.
(5) Innovation output variable Y3: Total labor productivity. Li and Mu [51] use total labor productivity as an output variable to measure the innovation performance of listed companies, while Hu and Pang [39] use total labor productivity to measure the technological innovation management and implementation of enterprises. Thus, total labor productivity is taken as an indicator to measure innovation output.
3.3. Data Source
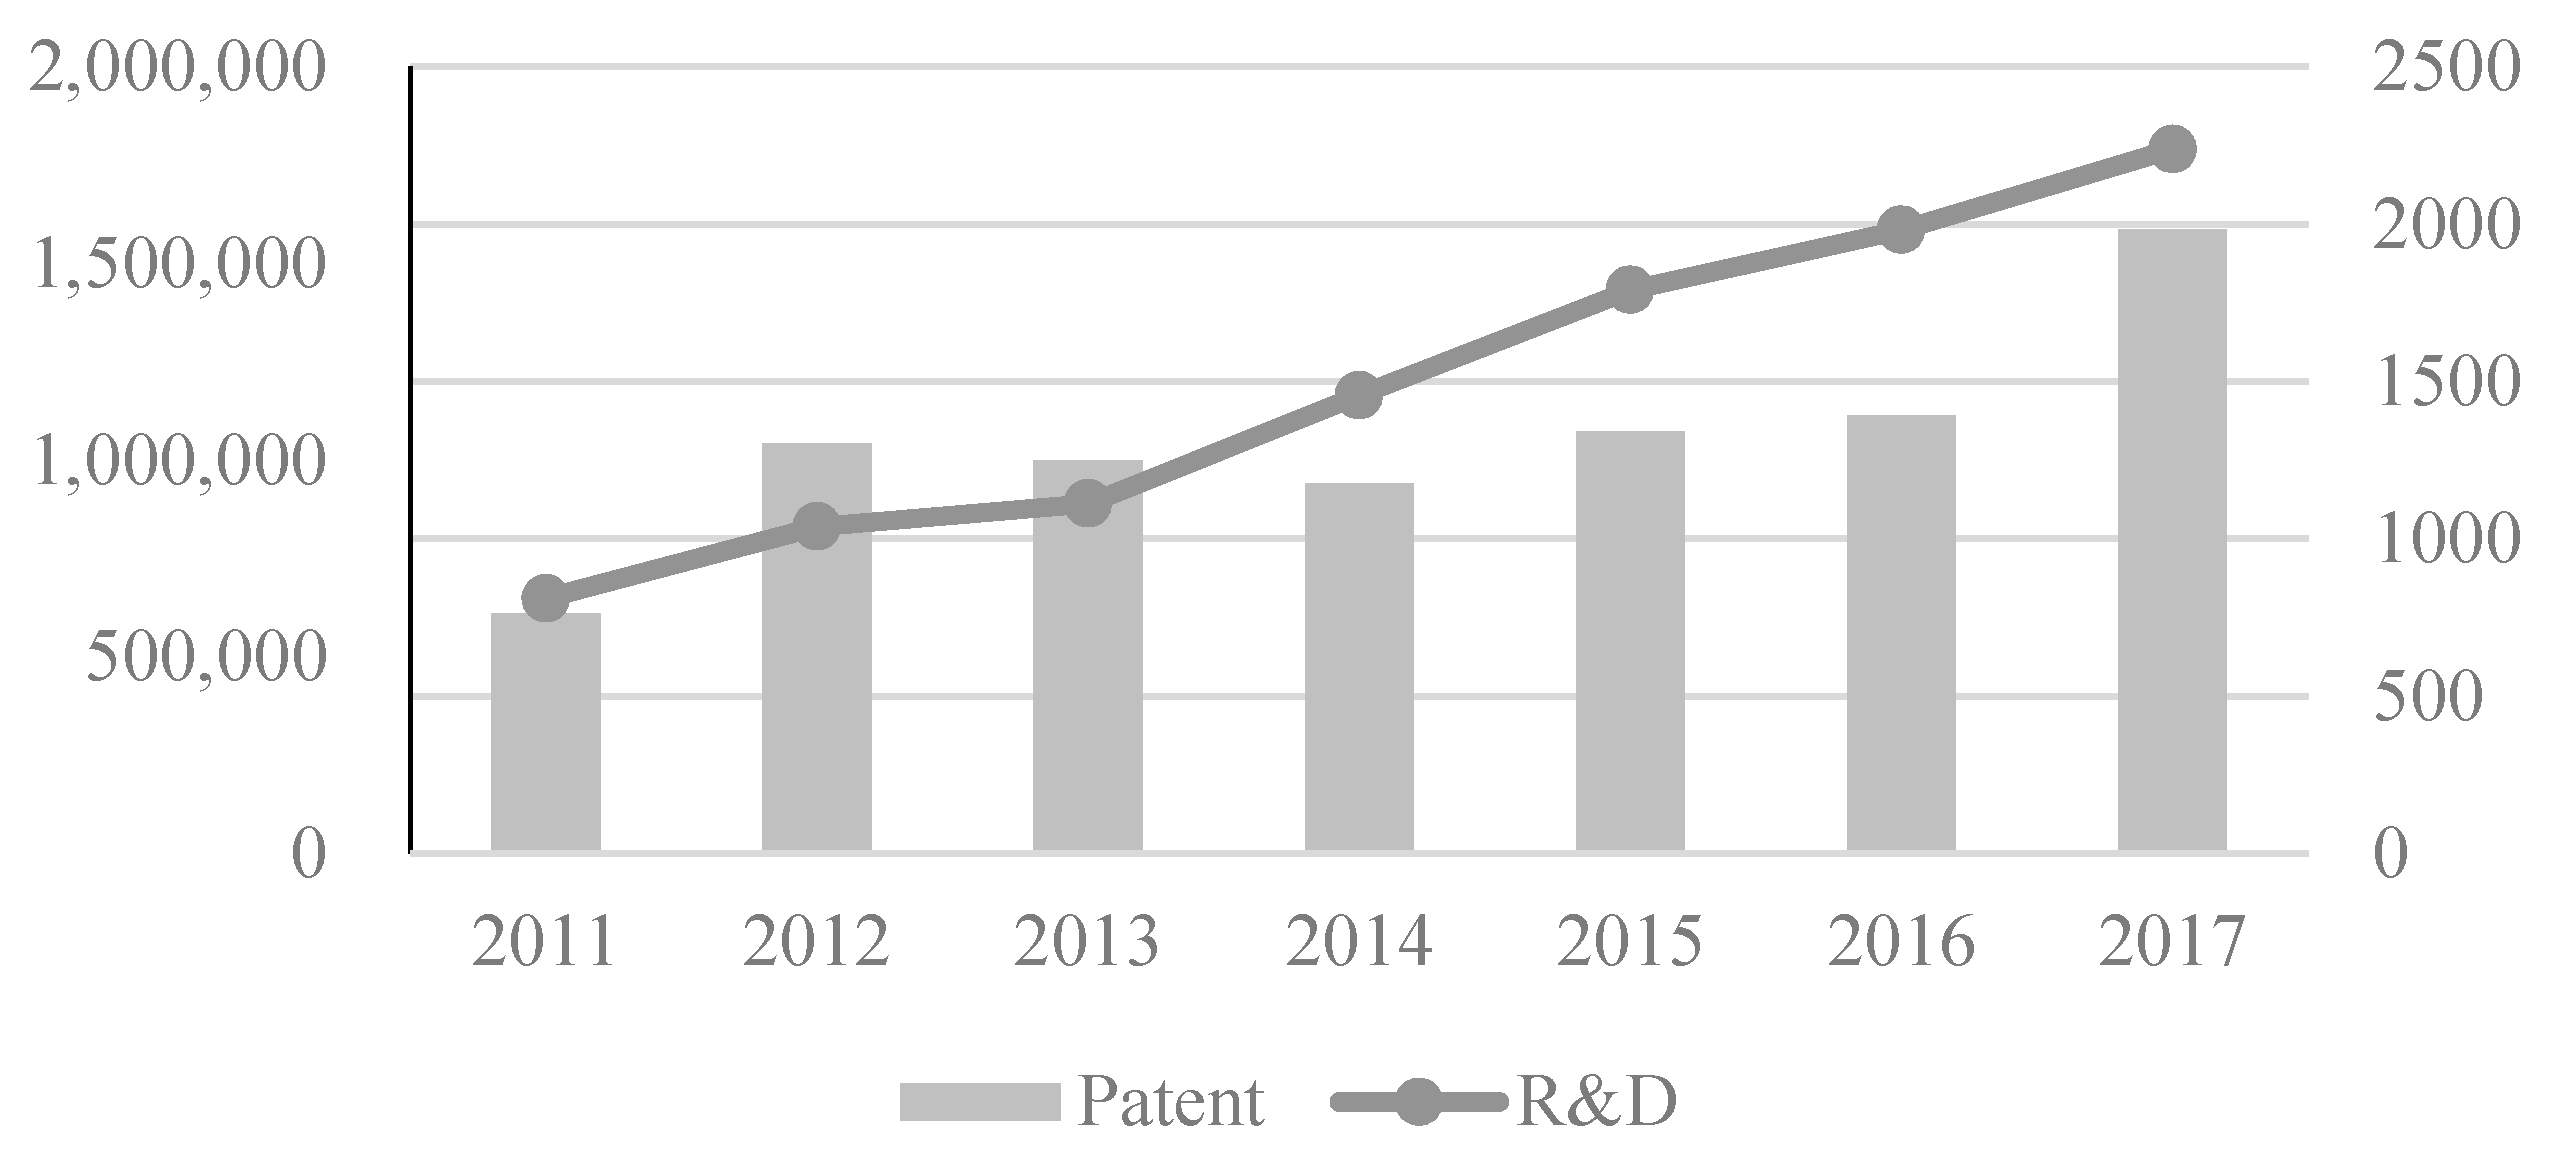
Considering the openness of data of listed companies, 12 listed companies of China’s tourist equipment manufacturing industry were selected as the research object, and the period was from 2011 to 2017; thus, 84 qualified samples were acquired. Data sources are listed companies’ annual reports and industry database in Wind. Figure 1 shows the R and D expenditure and patents of the sample enterprises.
4. Empirical Research
4.1. Analysis of Static DEA
In this study, Deap2.1 software was used due to it eliminating the complex calculation process, and directly showing the outcomes of three indicators of efficiency measurement: Total efficiency, technical efficiency, and scale efficiency [39]. Total efficiency is the measurement and evaluation of the overall technical efficiency of decision units, which reflects the level of management decision-making. Technical efficiency refers to the change of technological efficiency when the scale is fixed. Scale efficiency refers to the difference between the existing production scale and the optimal production scale when assuming the management level is fixed, which is the measurement of the enterprise scale. The level of efficiency defines the level of prosperity, which can be reached by an economy as well as by the competitiveness of the country [52]. The efficiency values of 14 listed companies of China’s tourist equipment manufacturing industry in 2011–2017 can be seen in Appendix A. Figure 2 indicates that the innovation technological efficiency of 12 listed companies of China’s tourist equipment manufacturing industry shows a law of slight decline overtime, but in 2017, total efficiency and scale efficiency show an uptrend, indicating that the technical involvement input of the tourist equipment manufacturing industry is insufficient.
4.2. Analysis of DEA–Malmquist
Referring to the practices of past researches [42,53,54,55], the Malmquist index (MI) of 12 tourist equipment industrial enterprises was solved in DEAP 2.1 and the results as shown in Table 2 and Table 3.
The distribution of the Malmquist indexes and their decompositions of sample companies was shown in Table 2. The overall Malmquist indexes of the technological innovation efficiencies of China’s tourist equipment manufacturing enterprises showed a downward trend at first, then an upward trend, and again a downward trend at last. In 2011–2012 and 2012–2013, the Malmquist indexes were all lower than 1, indicating that the technological innovation efficiencies of China’s tourist equipment manufacturing enterprises declined in these periods; while in 2013–2014 and 2014–2015, the Malmquist indexes were all higher than 1, indicating that the technological innovation efficiencies of China’s tourist equipment manufacturing enterprises increased in these periods; however, in 2015–2016 and 2016–2017, the Malmquist indexes were all lower than 1, indicating that the technological innovation efficiencies of China’s tourist equipment manufacturing enterprises declined in these periods. Further analysis of the structure of technological innovation efficiency showed that the index of technical efficiency change (EC) and index of technical level change (TC) alternately lead to the reduction of technological innovation efficiency. The results indicated that the technical input and management input of tourist equipment manufacturing enterprises are both inadequate, and the policy is not stable, which is the main reason to restrict the improvement of technological innovation efficiency. Furthermore, since 2014–2015, TC has been less than 1, indicating that since 2014, the problem of insufficient innovation input of enterprises has not been improved.
As mentioned above, the index of efficiency change (EC) could be further decomposed into the index of pure technical efficiency change (PEC) and index of scale efficiency change (SEC). The two indexes could be used to further analyze the reasons for technical efficiency changes (EC). It could be seen that since 2012–2103, scale efficiency changes (SEC) were all higher than 1, indicating that scale efficiency was on the rise and tourist equipment manufacturing enterprises in an effective state of scale. However, pure technical efficiency has been fluctuating up and down: Though it increased in two periods, in most periods it declined. It especially showed a downward trend in recent periods, which is the main reason for technical efficiency fluctuations.
In general, from 2011 to 2017, the technological innovation efficiencies of tourist equipment manufacturing enterprises decreased by 12.6% on average, among which the technical level decreased by 7.1% and technical efficiency decreased by 5.9%, indicating that both TC and EC lead to the decline of technological innovation efficiency of tourist equipment manufacturing enterprises, and the decline of EC was mainly derived from the decline of PEC (−6.4%).
Horizontally comparing the 12 enterprises’ technological innovation efficiencies (Table 3), it can be found that 8 enterprises’ Malmquist indexes were declined and the biggest decline was 50.8%, indicating that as an emerging industry, the development of technological innovation efficiency of the tourist equipment manufacturing industry has great problems. Undoubtedly, the decline was caused by decreases both at the technical level and in technical efficiency. Therefore, for most of the tourist equipment manufacturing enterprises, both input of technology and input of management were insufficient. In addition, there are great differences between enterprises, especially in pure technical efficiency, while the difference in scale efficiency was relatively small, indicating that the increase in technological innovation efficiency mainly depends on the improvement of pure technical efficiency.
4.3. Analysis of Tobit Regression Model
Through the DEA–Malmquist model, we analyzed technological innovation efficiency, which objectively reflects the technical innovation level of the current tourist equipment manufacturing industry. Furthermore, considering that efficiency value is a number in the range 0 to 1, this research used a Tobit regression model to determine the influence of possible factors on technological innovation efficiency of tourist equipment manufacturing enterprises [56]. Five efficiencies from DEA–Malmquist analysis were taken as dependent variables. Government ownership, long-term cooperation with universities, and cooperation with international corporations were considered as independent variables, in order to explore the synergistic relationship between enterprises with these innovative subjects.
The Tobit regression model is:
i = 1, 2, 3, 4, 5. Efficiency represents the Malmquist index (MI), technical efficiency change (EC), technical level change (TC), pure technical efficiency change (PEC), and scale efficiency change (SEC); Ownership represents whether owned by government; university represents whether long-term cooperation with universities; and international represents whether cooperation with international corporations.
Tobit regression analysis was performed with Eviews 8.0, and the results are shown in Table 4.
The results (Table 4) of Tobit regression analysis show that both cooperation with academics (Estimate = 0.165, Std. = 0.04) and cooperation with international corporations (Estimate = 0.235, Std. = 0.06) significantly influence the Malmquist index (MI), while government ownership (Estimate = −0.017, Std. = 0.05) has no significant effect on the Malmquist index (MI). Similarly, both cooperation with academics (Estimate = 0.076, Std. = 0.04) and cooperation with international corporations (Estimate = 0.137, Std. = 0.05) significantly influence the Malmquist index (MI), while government ownership (Estimate = −0.011, Std. = 0.04) has no significant effect on technical efficiency change (EC). The results were also supported when the dependent variable was technical level change (TC), with both cooperation with academics (Estimate = 0.093, Std. = 0.04) and cooperation with international corporations (Estimate = 0.106, Std. = 0.05) significantly influencing technical level change (TC), while government ownership (Estimate = −0.011, Std. = 0.04) having no significant effect on technical level change (TC). Finally, considering the fact that technical efficiency change (EC) can be decomposed into pure technical efficiency (PEC) and scale efficiency change (SEC), some slightly different results are also shown in Table 4. Differently, cooperation with international corporations (Estimate = 0.100, Std. = 0.05) positively influences pure technical efficiency (PEC) significantly, and government ownership (Estimate = −0.120, Std. = 0.05) negatively influences pure technical efficiency (PEC) significantly, while cooperation with academics (Estimate = −0.016, Std. = 0.05) has no significant effect on pure technical efficiency (PEC). In addition, both cooperation with academics (Estimate = 0.107, Std. = 0.03) and government ownership (Estimate = −0.010, Std. = 0.03) positively influences scale efficiency change (SEC) significantly, while cooperation with international corporations (Estimate = 0.061, Std. = 0.04) has no significant impact on scale efficiency change (SEC).
In conclusion, in the synergistic relationship between tourist equipment manufacturing enterprises and other innovative subjects, the government has no significant impact on the technological innovation efficiency of enterprises, that is, no matter whether the enterprises are government-owned or not, innovation efficiency is not affected. Further analysis indicates that government ownership has a positive effect on scale efficiency change (SEC), while a negative effect on pure technical efficiency change (PEC). The reason for this phenomenon may be that although being owned by government allows enterprises to obtain large amounts of government input and preferential policies to enlarge their scale, government input partly crowds out private R and D to negatively affect innovation efficiency [27], and government-owned enterprises have more innovation efficiency loss than private enterprises [47]. In the future, the government should optimize the investment structure, increase enterprises’ support in tax incentives and other aspects, encourage enterprises to make progress in the area of independent innovation, and minimize direct fiscal subsidies to avoid crowding out private capital.
Moreover, cooperation with universities positively affects both technical efficiency change (EC) and technical level change (TC), and it also positively influences the Malmquist index (MI). This shows that in China’s tourist equipment manufacturing industry, industry–university collaborative innovation has played an important role. However, further analysis shows that cooperation with universities has a positive effect on scale efficiency change (SEC), while it has an insignificant effect on pure efficiency change (PEC). The possible reason lies in the lack of long-term strategic considerations for industry–university cooperation, which is mainly based on projects. Additionally, there is a lack of science and technology intermediary organizations to translate academic research into actual output. In the future, it is necessary to strengthen industry–university collaborative innovation, cooperation under the guidance of long-term interests, and make rational use of scientific research resources. In addition, scientific evaluation methodology to measure industry–university projects should be exploited [31] and some intermediary should be established to transform scientific achievements into economic output.
Finally, cooperation with international corporations has a significantly positive impact on the Malmquist index (MI), technical efficiency change (EC), technical level change (TC), and pure technical efficiency change (PEC). This indicates that cooperation with international corporations is an important source for enterprises to obtain advanced technology and scientific management methods. However, the effect of cooperation with international corporations on scale efficiency change (SEC) is not significant, which indicates that the cooperation of China’s tourist equipment manufacturer enterprises with international corporations still stays at the level of technology import. In the future, all-round cooperation with international corporations should be strengthened, and international advanced technologies should be introduced through talent introduction, technology import, and sino–foreign joint venture, to gradually improve the level of technological and independent innovation. In fact, this conclusion is also consistent with Lovdal and Neumann [16], that is, to overcome the barriers to the development of the equipment manufacturing industry through internationalization.
5. Conclusions and Implications
In this study, DEA–Malmquist and Tobit regression were used to analyze the technological innovation efficiency of China’s tourist equipment manufacturing industry and explore the synergistic relationship with other innovative subjects. Due to the tourist equipment manufacturing industry being an emerging industry with a small number of listed companies, this study collected as much as possible the input and output data from 12 listed companies in 2011–2017, and then calculated technological innovation efficiency through DEA. It must be acknowledged that sample limitations may slightly influence the results of the study, but this study is still meaningful to China’s tourist equipment manufacturing industry.
(1) Theoretical implications
First, as an emerging industry with Chinese characteristics, all sectors of society pay close attention to the development of the tourist equipment manufacturing industry [2]. However, no one knew what it was really like, what the problems were, and how it would develop in the future. Though there is some literature discussing the definition of tourist equipment manufacturing industry [4,5], it only studies it from a qualitative perspective, but with a lack of empirical evidence, especially the evaluation of the development status and the relationship with other environmental factors. The current research filled this gap. In this study, DEA analysis was used to evaluate the change of technological innovation efficiency and find out the strengths and weaknesses. In addition, the Tobit model was used to study the influence of other innovation subjects on technological innovation efficiency, to help enterprises to cooperate with other subjects in a targeted way. Through empirical research, the development status of the tourist equipment manufacturing industry can be better reflected and we can help all sectors of society (both scholars and practitioners) to better understand “what this industry is?”, “how is it going in future,” and “how to develop it”.
Second, using helix models [24,25], the current article studied the relationship between the government, university, international corporations, and the efficiency of China’s tourist equipment manufacturing enterprises, which has certain enlightening significance for the academic community. Because each enterprise does not exist in an independent individual form, the coevolution theory states that the individual behavior of one species is affected by the individual behavior of another species during the evolution of the two species [57]. Positive coevolution derives from mutual benefit brought about by mutualistic symbiosis, while negative coevolution derives from predatory competition [21]. This study finds a positive impact of international corporations and universities on the Malmquist index, indicating that the two innovative subjects and the tourist equipment manufacturing enterprise coevolve positively, while a negative impact of the government on the Malmquist index (although it is not significant) indicates that this is a negative coevolution, and the government would bring about the crowing out effect [29,30]. Therefore, we should be aware of the importance of these environmental factors when it comes to the further development of China’s tourist equipment manufacturing industry.
(2) Practical implications
First, the results of the static DEA analysis show that the technological innovation efficiency of China’s tourist equipment manufacturing enterprises in 2011–2017 generally display the law of decline, and total efficiency is always lower than technical efficiency and scale efficiency. This indicates that the tourist equipment manufacturing industry, despite high-end manufacturing, has not developed very well. It is not technically efficient nor scale-efficient as a whole, indicating that it has a large space to develop. Thus, enterprises need to improve the ability of resource integration, optimize the allocation of resources, and enhance the ability of independent innovation to achieve sustainable development.
Second, among the 12 sample companies, the technological innovation efficiency of 8 companies is declining. It can be predicted that many companies are in a downward trend, which is not good news. Since 2014, the problems of insufficient innovation input and backward management methods have not been improved, which may be because enterprises have never realized these problems. This study was conducted to help enterprises to understand this situation, increasing input in innovation and improving management methods. Further, through the decomposition of the Malmquist index, it can be found that the reason for the low technical efficiency is the low pure technical efficiency, thus, it is critical to increase technical input.
Third, Tobit regression analysis shows that state ownership has a significantly positive impact on the scale efficiency of enterprises but no impact on other efficiencies. However, scale efficiency is not the main reason for the decline of technological innovation efficiency. Therefore, the scale advantage of state-owned tourist equipment manufacturing enterprises has not yet been converted into a technical advantage, so it is worth encouraging how to explore the transformation mode. Cooperation with international corporations has a significantly positive impact on the Malmquist index (MI), technical efficiency change (EC), technical level change (TC), and pure technical efficiency change (PEC), while it cannot affect scale efficiency change (SEC), indicating that currently, it mainly relies on technology import, and no long-term international strategic cooperation has been formed. Cooperation with universities has a positive and significant impact on the Malmquist index (MI), technical efficiency change (EC), technical level change (TC), and scale efficiency change (SEC), while it cannot influence pure efficiency change (PEC). This shows that it is still difficult to transform scientific research into technologies, and enterprises need to strengthen technical cooperation with universities.
However, this study has some limitations. First, there were only 12 companies selected, which is due to the difficulty in obtaining data from the emerging industry. With the development of the industry, data from more enterprises will be available for research in the future, and the conclusions drawn will inevitably be more representative. Second, we only considered the role of innovative subjects but not the role of firm size, team, knowledge, etc. on technological innovation efficiency; these are good research topics in the future. Third, this study shows that different innovative subjects have different effects on technological innovation efficiency, but this study has not studied the interaction between different innovative subjects. In the future, this problem can be studied through a more detailed design.
Author Contributions
Y.L. conceived and designed the research; H.G. verified the scientific of the research and investigated the current research status; N.D. analyzed the data; Y.L. wrote the original draft and edited the paper; N.D. and Y.L. revised the paper according to experts’ comments.
Funding
This paper is supported in part by the Fundamental Research Funds for the National Natural Science Foundation Youth Project “Research on Tourist Loyalty Based on Shared Experience: Theoretical Expansion and Empirical Analysis” (71704072), and MOE (Ministry of Education in China) Project of Humanities and Social Sciences “Research on Performance Evaluation and Influence Mechanism of Regional Tourist Industry Based on Structural Equation Model” (14YJC630080).
Acknowledgments
We thank the editors and reviewers for careful review and insightful comments. We would like to thank Macy Liu for her kind help and contributions in polishing the language and content of the paper.
Conflicts of Interest
The authors declare no conflict of interest.
Appendix A

Table A1.
Results of Static DEA Analysis.
| Firm | 2017 | 2016 | 2015 | 2014 | ||||||||
| CRS | VRS | SCA | CRS | VRS | SCA | CRS | VRS | SCA | CRS | VRS | SCA | |
| DMU1 | 1.000 | 1.000 | 1.000 | 1.000 | 1.000 | 1.000 | 1.000 | 1.000 | 1.000 | 1.000 | 1.000 | 1.000 |
| DMU2 | 1.000 | 1.000 | 1.000 | 1.000 | 1.000 | 1.000 | 1.000 | 1.000 | 1.000 | 1.000 | 1.000 | 1.000 |
| DMU3 | 0.657 | 0.760 | 0.865 | 0.325 | 0.326 | 0.999 | 0.359 | 0.422 | 0.851 | 0.262 | 0.384 | 0.682 |
| DMU4 | 0.268 | 0.406 | 0.661 | 0.294 | 0.475 | 0.620 | 0.346 | 0.513 | 0.674 | 0.349 | 0.543 | 0.642 |
| DMU5 | 0.291 | 0.296 | 0.983 | 0.352 | 0.417 | 0.845 | 0.405 | 0.856 | 0.473 | 0.132 | 0.199 | 0.663 |
| DMU6 | 0.437 | 0.554 | 0.790 | 0.946 | 1.000 | 0.946 | 0.682 | 1.000 | 0.682 | 0.574 | 0.757 | 0.758 |
| DMU7 | 0.345 | 0.494 | 0.700 | 0.465 | 1.000 | 0.465 | 0.691 | 1.000 | 0.691 | 0.415 | 1.000 | 0.415 |
| DMU8 | 0.128 | 0.132 | 0.970 | 0.097 | 0.103 | 0.939 | 0.307 | 0.379 | 0.810 | 1.000 | 1.000 | 1.000 |
| DMU9 | 0.825 | 1.000 | 0.825 | 0.692 | 1.000 | 0.692 | 0.919 | 1.000 | 0.919 | 1.000 | 1.000 | 1.000 |
| DMU10 | 0.746 | 1.000 | 0.746 | 0.824 | 1.000 | 0.824 | 0.997 | 1.000 | 0.997 | 0.898 | 1.000 | 0.898 |
| DMU11 | 0.377 | 0.385 | 0.979 | 0.436 | 0.558 | 0.782 | 0.638 | 0.845 | 0.755 | 0.578 | 0.755 | 0.766 |
| DMU12 | 0.738 | 0.766 | 0.963 | 0.455 | 0.514 | 0.886 | 0.498 | 0.556 | 0.895 | 0.627 | 0.639 | 0.981 |
| Mean | 0.568 | 0.649 | 0.847 | 0.574 | 0.699 | 0.833 | 0.654 | 0.798 | 0.812 | 0.653 | 0.773 | 0.817 |
| Std. | 0.285 | 0.299 | 0.120 | 0.294 | 0.319 | 0.162 | 0.261 | 0.243 | 0.156 | 0.307 | 0.268 | 0.184 |
| Firm | 2013 | 2012 | 2011 | |||||||||
| CRS | VRS | SCA | CRS | VRS | SCA | CRS | VRS | SCA | ||||
| DMU1 | 0.621 | 1.000 | 0.621 | 1.000 | 1.000 | 1.000 | 0.978 | 1.000 | 0.978 | |||
| DMU2 | 1.000 | 1.000 | 1.000 | 1.000 | 1.000 | 1.000 | 1.000 | 1.000 | 1.000 | |||
| DMU3 | 0.662 | 0.666 | 0.994 | 0.671 | 0.913 | 0.735 | 0.530 | 0.838 | 0.633 | |||
| DMU4 | 0.353 | 0.492 | 0.717 | 0.040 | 0.143 | 0.279 | 0.914 | 0.974 | 0.938 | |||
| DMU5 | 0.050 | 0.107 | 0.468 | 0.052 | 0.055 | 0.941 | 0.764 | 0.775 | 0.987 | |||
| DMU6 | 0.701 | 0.701 | 1.000 | 0.687 | 0.790 | 0.869 | 0.825 | 0.899 | 0.918 | |||
| DMU7 | 0.381 | 1.000 | 0.381 | 0.396 | 1.000 | 0.396 | 0.238 | 1.000 | 0.238 | |||
| DMU8 | 0.872 | 1.000 | 0.872 | 0.789 | 1.000 | 0.789 | 0.430 | 0.447 | 0.962 | |||
| DMU9 | 1.000 | 1.000 | 1.000 | 1.000 | 1.000 | 1.000 | 1.000 | 1.000 | 1.000 | |||
| DMU10 | 0.740 | 0.850 | 0.871 | 0.600 | 0.799 | 0.752 | 0.427 | 0.507 | 0.843 | |||
| DMU11 | 0.829 | 0.834 | 0.994 | 0.724 | 0.924 | 0.783 | 1.000 | 1.000 | 1.000 | |||
| DMU12 | 1.000 | 1.000 | 1.000 | 1.000 | 1.000 | 1.000 | 1.000 | 1.000 | 1.000 | |||
| Mean | 0.684 | 0.804 | 0.827 | 0.663 | 0.802 | 0.795 | 0.759 | 0.870 | 0.875 | |||
| Std. | 0.284 | 0.266 | 0.216 | 0.331 | 0.323 | 0.228 | 0.266 | 0.190 | 0.217 | |||
CRS = total efficiency, VRS = technical efficiency, and SCA = scale efficiency. Source: Own source.
References
- The State Council of China. China’s Manufacturing 2025. Available online: http://www.miit.gov.cn/n973401/n1234620/n1234622/c4409653/content.html (accessed on 5 December 2018).
- Cheng, J.; Lin, L.U.; Zhu, F.B. On the study progress of tourist industrial merging and its enlightenment. Tour. Trib. 2011, 26, 13–19. [Google Scholar]
- The State Council of China. The Implementation Suggestions on Promoting the Development of the Tourist Equipment Manufacturing Industry. Available online: http://www.miit.gov.cn/n1146290/n4388791/c4325772/content.html (accessed on 27 August 2018).
- Li, B.W. Research on the concept, cultivation and development of tourist manufacturing industry. Inq. Econ. Issues 2014, 3, 186–190. [Google Scholar]
- Geng, S.T.; Yang, S.F. Value chain upgrade strategy of China’s tourist equipment manufacturing. Acad. Exchang. 2015, 258, 139–143. [Google Scholar]
- Liu, W.Y. Empirical analysis on agglomeration in China’s equipment manufacturing industry. Econ. Theory Bus. Manag. 2011, 6, 103–112. [Google Scholar]
- Wu, L. Research on the evolution of the breakthrough innovation mechanism for equipment manufacturing industry. Sci. Sci. Manag. S T 2014, 35, 121–128. [Google Scholar]
- Niu, Z.D.; Zhang, Q.X. An analysis of technological innovation efficiency of manufacturing equipment industries in China. J. Quant. Tech. Econ. 2012, 11, 51–57. [Google Scholar]
- Chen, C.; Wang, Y. The international competitiveness of China’s equipment manufacturing industry and its technical progress effects. Forum Sci. Technol. China 2014, 12, 80–86. [Google Scholar]
- Zhang, D.N.; Chen, Y. Study on development level and mode of equipment manufacturing industry in China. J. Quant. Tech. Econ. 2014, 31, 99–114. [Google Scholar]
- Ge, J.P.; Lin, L.; Huang, M. Innovation Management: The mechanism and paths of enhancing the international competitiveness of China’s equipment manufacturing industry through information technology. In Proceedings of the 9th Wuhan International Conference on E-Business, Wuhan, China, 29 May 2010. [Google Scholar]
- Gereffi, G.; Humphrey, J.; Economy, T.S. The governance of global value chains. Rev. Int. Political Econ. 2005, 12, 78–104. [Google Scholar] [CrossRef] [Green Version]
- Chen, A.Z.; Liu, Z.B. Determinants of Chinese machinery industries’ position in GVCS: Based on input-output empirical analysis of divided industries. J. Int. Trade 2011, 4, 115–125. [Google Scholar]
- Kaplinsky, R.; Morris, M. Value chain analysis: A tool for enhancing export supply policies. Int. J. Technol. Learn. Innov. Dev. 2008, 1, 283–308. [Google Scholar] [CrossRef]
- Garbie, I.H. An analytical technique to model and assess sustainable development index in manufacturing enterprises. Int. J. Prod. Res. 2014, 52, 4876–4915. [Google Scholar] [CrossRef]
- Lovdal, N.; Neumannn, F. Internationalization as a strategy to overcome industry barriers: An assessment of the marine energy industry. Energy Policy 2011, 39, 1093–1100. [Google Scholar] [CrossRef]
- Xie, B.C.; Duan, N.; Wang, Y.S. Environmental efficiency and abatement cost of China’s industrial sectors based on a three-stage data envelopment analysis. J. Clean. Prod. 2017, 153, 626–636. [Google Scholar] [CrossRef]
- Si, L.B.; Qiao, H.Y. Evaluation of technological innovation efficiency in equipment manufacturing industry based on input orientation—Panel data analysis based on data envelopment model. J. Discret. Math. Sci. Cryptogr. 2017, 20, 1381–1386. [Google Scholar] [CrossRef]
- Fan, D.C.; Ming-Yue, D.U. Research on technological innovation resource allocation efficiency and its influencing factors in high-end equipment manufacturing industries—Based on the empirical analysis of the two-stage stoned-tobit model. Chin. J. Manag. Sci. 2018, 26, 13–24. [Google Scholar]
- Lu, F.Y.; Chang, Y.H.; Lu, X. Performance analysis of R&D input and output in China’s equipment manufacturing industry—based on the three national economic censuses. J. Ind. Technol. Econ. 2016, 4, 153–160. [Google Scholar]
- Xiao, J.H.; Xie, K.; Wu, Y.; Rang, J.S. Coevolution of enterprise and consumer to construct dynamic capability: A case Study of b2c e-commerce dream bazaar. Manag. World. 2014, 8, 134–151. [Google Scholar]
- Etzkowitz, H.; Leydesdorff, L. The triple helix—University-industry-government relations: A laboratory for knowledge based economic development. Soc. Sci. Electron. Publ. 2014, 14, 14–19. [Google Scholar]
- Villarreal, O.; Calvo, N. From the Triple Helix model to the Global Open Innovation model: A case study based on international cooperation for innovation in Dominican Republic. J. Eng. Technol. Manag. 2015, 35, 71–92. [Google Scholar] [CrossRef]
- Carayannis, E.G.; Campbell, D.F. ‘Mode 3’ and ‘Quadruple Helix’: Toward a 21st century fractal innovation ecosystem. Int. J. Technol. Manag. 2009, 46, 201–234. [Google Scholar] [CrossRef]
- Carayannis, E.G.; Campbell, D.F. Open innovation diplomacy and a 21st century fractal research, education and innovation (FREIE) ecosystem: Building on the quadruple and quintuple helix innovation concepts and the “mode 3” knowledge production system. J. Knowl. Econ. 2011, 2, 327–372. [Google Scholar] [CrossRef]
- Okamuro, H. Determinants of successful R&D cooperation in Japanese small businesses: The impact of organizational and contractual characteristics. Res. Policy 2007, 36, 1529–1544. [Google Scholar] [Green Version]
- Zhou, K.Z.; Gao, G.Y.; Zhao, H. State ownership and firm innovation in China: An integrated view of institutional and efficiency logics. Adm. Sci. Q. 2017, 62, 375–404. [Google Scholar] [CrossRef]
- Chen, Q.J. Does government spending on science and technology improve the efficiency of enterprise technology innovation? Bus. Manag. J. 2017, 554, 6–19. [Google Scholar]
- Herrera, L.; Sanchez-Gonzalez, G. Firm size and innovation policy. Int. Small Bus. J. 2013, 31, 137–155. [Google Scholar] [CrossRef] [Green Version]
- Hong, J.; Feng, B.; Wu, Y.; Wang, L.J. Do government grants promote innovation efficiency in China’s high-tech industries? Technovation. 2016, 57, 4–13. [Google Scholar] [CrossRef]
- Albats, E.; Fiegenbaum, I.; Cunningham, J.A. A micro level study of university industry collaborative lifecycle key performance indicators. J. Technol. Transf. 2018, 43, 389–431. [Google Scholar] [CrossRef]
- Chen, X.S.; Wang, H.Q.; Gu, Y. The effect of innovation environment on the equipment manufacturing industry in China. In Proceedings of the 19th International Conference on Industrial Engineering and Engineering Management: Management System Innovation, Changsha, China, 27 October 2012. [Google Scholar]
- Banker, R.D.; Natarajan, R. Evaluating contextual variables affecting productivity using data envelopment analysis. Oper. Res. 2008, 56, 48–58. [Google Scholar] [CrossRef]
- Huang, C.; Dai, C.; Guo, M. A hybrid approach using two-level DEA for financial failure prediction and integrated SE-DEA and GCA for indicators selection. Appl. Math. Comput. 2015, 251, 431–441. [Google Scholar] [CrossRef]
- Charnes, A.; Cooper, W.W.; Rhodes, E. Measuring the efficiency of decision-making units. Eur. J. Oper. Res. 1979, 2, 429–444. [Google Scholar] [CrossRef]
- Banker, R.D.; Charnes, A.; Cooper, W.W. Some models for estimating technical and scale inefficiencies in data envelopment analysis. Manag. Sci. 1984, 30, 1078–1092. [Google Scholar] [CrossRef]
- Guan, J.C.; Yam, R.C.; Mok, C.K.; Ma, N. A study of the relationship between competitiveness and technological innovation capability based on DEA models. Eur. J. Oper. Res. 2006, 170, 971–986. [Google Scholar] [CrossRef]
- Chodakowska, E.; Nazarko, J. Environmental DEA method for assessing productivity of European countries. Technol. Econ. Dev. Econ. 2017, 23, 589–607. [Google Scholar] [CrossRef]
- Hu, B.G.; Pang, J. A research on empirical analysis of technological collaborative innovation of agricultural industrialization leading enterprises: Based on dynamic DEA and multinomial logistic regression model. Econ. Probl. 2016, 2, 74–79. [Google Scholar]
- Malmquist, S. Index numbers and indifference surfaces. Trabajos de Estadística 1953, 4, 209–242. [Google Scholar] [CrossRef]
- Hashimoto, A.; Haneda, S. Measuring the change in R&D efficiency of the Japanese pharmaceutical industry. Res. Policy 2008, 37, 1829–1836. [Google Scholar] [Green Version]
- Xu, J.; Qu, X. Research on the efficiency and influencing factors of environmental technology innovation of equipment manufacturing industries. Oper. Res. Manag. Sci. 2015, 1, 035. [Google Scholar]
- Klumpp, M. Do forwarders improve sustainability efficiency? Evidence from a European DEA Malmquist Index Calculation. Sustainability 2017, 9, 842. [Google Scholar] [CrossRef]
- Färe, R.; Grosskopf, S.; Norris, M. Productivity growth, technical progress, and efficiency change in industrialized countries: Reply. Am. Econ. Rev. 1997, 87, 1040–1044. [Google Scholar]
- Gu, N.H.; Li, J.F. An empirical analysis on the regional disparity of technical efficiency realized in China’s service industries. Econ. Res. J. 2006, 1, 46–56. [Google Scholar]
- Xia, W.; Zhong, P. Study on R&D dynamic efficiency of Chinese manufacturing industries based on DEA-Malmquist Index. R D Manag. 2011, 2, 009. [Google Scholar]
- Dong, X.Q.; Zhao, J.; Yuan, P.W. Research on innovation efficiency loss of state-owned enterprises. China Ind. Econ. 2014, 311, 97–108. [Google Scholar]
- Wen, J.; Feng, G. Heterogeneous institutional investor, nature of firm and independent innovation. Econ. Res. J. 2012, 3, 53–64. [Google Scholar]
- Jiang, J.; Guan, J.C. An analysis of relative efficiency to Chinese low-and medium-technology sectors. Stud. Sci. Sci. 2008, 26, 1325–1332. [Google Scholar]
- Wang, Z.B.; Li, C.B. The impact of asset-light strategy on firms’ profit margin—Evidence from China’s manufacturing firms. China Ind. Econ. 2015, 327, 108–121. [Google Scholar]
- Li, J.Y.; Mu, Y.; Economics, S.O.; University, N. Innovation performance of Chinese public companies based on DEA method. Sci. Sci. Manag. S T 2015, 36, 11–121. [Google Scholar]
- Nazarko, J.; Chodakowska, E. Labour efficiency in construction industry in Europe based on frontier methods: Data envelopment analysis and stochastic frontier analysis. J. Civ. Eng. Manag. 2017, 23, 787–795. [Google Scholar] [CrossRef]
- Sun, J.; Zhang, J.; Zhang, J.; Ma, J.; Zhang, Y. Total factor productivity assessment of tourism industry: Evidence from China. Asia Pac. J. Tour. Res. 2015, 20, 280–294. [Google Scholar] [CrossRef]
- Zhang, J.; Qu, X.; Sangaiah, A.K. A Study of Green Development Mode and Total Factor Productivity of the Food Industry Based on the Industrial Internet of Things. IEEE Commun. Mag. 2018, 56, 72–78. [Google Scholar] [CrossRef]
- Huang, Y.; Luo, S.; Xu, G.; Zhou, G. Quantitative analysis and evaluation of enterprise group financial company efficiency in China. Sustainability 2018, 10, 3210. [Google Scholar] [CrossRef]
- Chodakowska, E.; Nazarko, J. Measuring productivity of construction industry in Europe with Data Envelopment Analysis. Procedia Eng. 2015, 122, 204–212. [Google Scholar]
- Castellacci, F.; Natera, J.M. The dynamics of national innovation systems: A panel cointegration analysis of the coevolution between innovative capability and absorptive capacity. Res. Policy 2013, 42, 579–594. [Google Scholar] [CrossRef] [Green Version]
Figure 1.
2011–2017 R and D expenditure and patents of the sample enterprises. Source: Wind.

Figure 2.
Mean efficiency distribution. Source: Own source.

Table 1.
Description of variables and indicators.
| Variable | Indicator | Description of Indicator |
|---|---|---|
| Input variable | X1: Intensity of R and D personnel | = number of R and D personnel/total number of employees |
| X2: Intensity of R and D expenditure | = R and D expenditure/operating income | |
| Output variable | Y1: Number of patent applications | = number of patent applications |
| Y2: Profit ratio of sales | = Total profit/operating income | |
| Y3: Total labor productivity | = operating income/total number of employees |
Source: Own source.
Table 2.
2011–2017 Malmquist index and its decomposition of technological innovation efficiency of tourist equipment manufacturing enterprises.
Table 2.
2011–2017 Malmquist index and its decomposition of technological innovation efficiency of tourist equipment manufacturing enterprises.
| Year | EC | TC | PEC | SEC | MI |
|---|---|---|---|---|---|
| 2011–2012 | 0.681 | 1.056 | 0.752 | 0.906 | 0.719 |
| 2012–2013 | 1.190 | 0.573 | 1.126 | 1.056 | 0.681 |
| 2013–2014 | 0.991 | 1.111 | 0.988 | 1.003 | 1.101 |
| 2014–2015 | 1.071 | 0.988 | 1.067 | 1.003 | 1.058 |
| 2015–2016 | 0.808 | 0.977 | 0.789 | 1.024 | 0.790 |
| 2016–2017 | 1.003 | 0.989 | 0.954 | 1.051 | 0.993 |
| Mean | 0.941 | 0.929 | 0.936 | 1.006 | 0.874 |
Source: Own source.
Table 3.
2011–2017 Malmquist index and its decomposition of technological innovation efficiency of each enterprise.
Table 3.
2011–2017 Malmquist index and its decomposition of technological innovation efficiency of each enterprise.
| Firm | EC | TC | PEC | SEC | MI |
|---|---|---|---|---|---|
| 1 | 1.004 | 1.063 | 1.000 | 1.004 | 1.067 |
| 2 | 1.000 | 0.825 | 1.000 | 1.000 | 0.825 |
| 3 | 1.037 | 1.023 | 1.000 | 1.037 | 1.060 |
| 4 | 0.815 | 0.604 | 0.864 | 0.943 | 0.492 |
| 5 | 0.852 | 0.797 | 0.852 | 0.999 | 0.679 |
| 6 | 0.900 | 0.997 | 0.926 | 0.972 | 0.897 |
| 7 | 1.064 | 1.027 | 0.889 | 1.197 | 1.092 |
| 8 | 0.817 | 0.967 | 0.816 | 1.001 | 0.790 |
| 9 | 0.968 | 0.957 | 1.000 | 0.968 | 0.927 |
| 10 | 1.097 | 1.020 | 1.120 | 0.980 | 1.119 |
| 11 | 0.850 | 0.980 | 0.853 | 0.996 | 0.833 |
| 12 | 0.951 | 1.006 | 0.957 | 0.994 | 0.957 |
| Mean | 0.941 | 0.929 | 0.936 | 1.006 | 0.874 |
Source: Own source.
Table 4.
Results of Tobit regression.
| Dependent Variable | MI | EC | TC | PEC | SEC |
|---|---|---|---|---|---|
| Intercept | 0.674 *** | 0.833 *** | 0.834 *** | 0.963 *** | 0.862 *** |
| (0.07) | (0.05) | (0.08) | (0.08) | (0.04) | |
| Ownership | −0.017 | −0.011 | 0.011 | −0.120 * | 0.110 *** |
| (0.05) | (0.04) | (0.04) | (0.05) | (0.03) | |
| International | 0.235 *** | 0.137 *** | 0.106 * | 0.100 * | 0.061 |
| (0.06) | (0.05) | (0.05) | (0.05) | (0.04) | |
| University | 0.165 *** | 0.076 * | 0.093 * | −0.016 | 0.107 *** |
| (0.04) | (0.04) | (0.04) | (0.05) | (0.03) |
* p < 0.05, ** p < 0.01, *** p < 0.001; The numbers in parentheses are standard errors. Source: Own source.
© 2018 by the authors. Licensee MDPI, Basel, Switzerland. This article is an open access article distributed under the terms and conditions of the Creative Commons Attribution (CC BY) license (http://creativecommons.org/licenses/by/4.0/).
Share and Cite
MDPI and ACS Style
Lin, Y.; Deng, N.; Gao, H. Research on Technological Innovation Efficiency of Tourist Equipment Manufacturing Enterprises. Sustainability 2018, 10, 4826. https://0-doi-org.brum.beds.ac.uk/10.3390/su10124826
AMA Style
Lin Y, Deng N, Gao H. Research on Technological Innovation Efficiency of Tourist Equipment Manufacturing Enterprises. Sustainability. 2018; 10(12):4826. https://0-doi-org.brum.beds.ac.uk/10.3390/su10124826
Chicago/Turabian StyleLin, Yuanyuan, Nianqi Deng, and Hailian Gao. 2018. "Research on Technological Innovation Efficiency of Tourist Equipment Manufacturing Enterprises" Sustainability 10, no. 12: 4826. https://0-doi-org.brum.beds.ac.uk/10.3390/su10124826
Note that from the first issue of 2016, this journal uses article numbers instead of page numbers. See further details here.