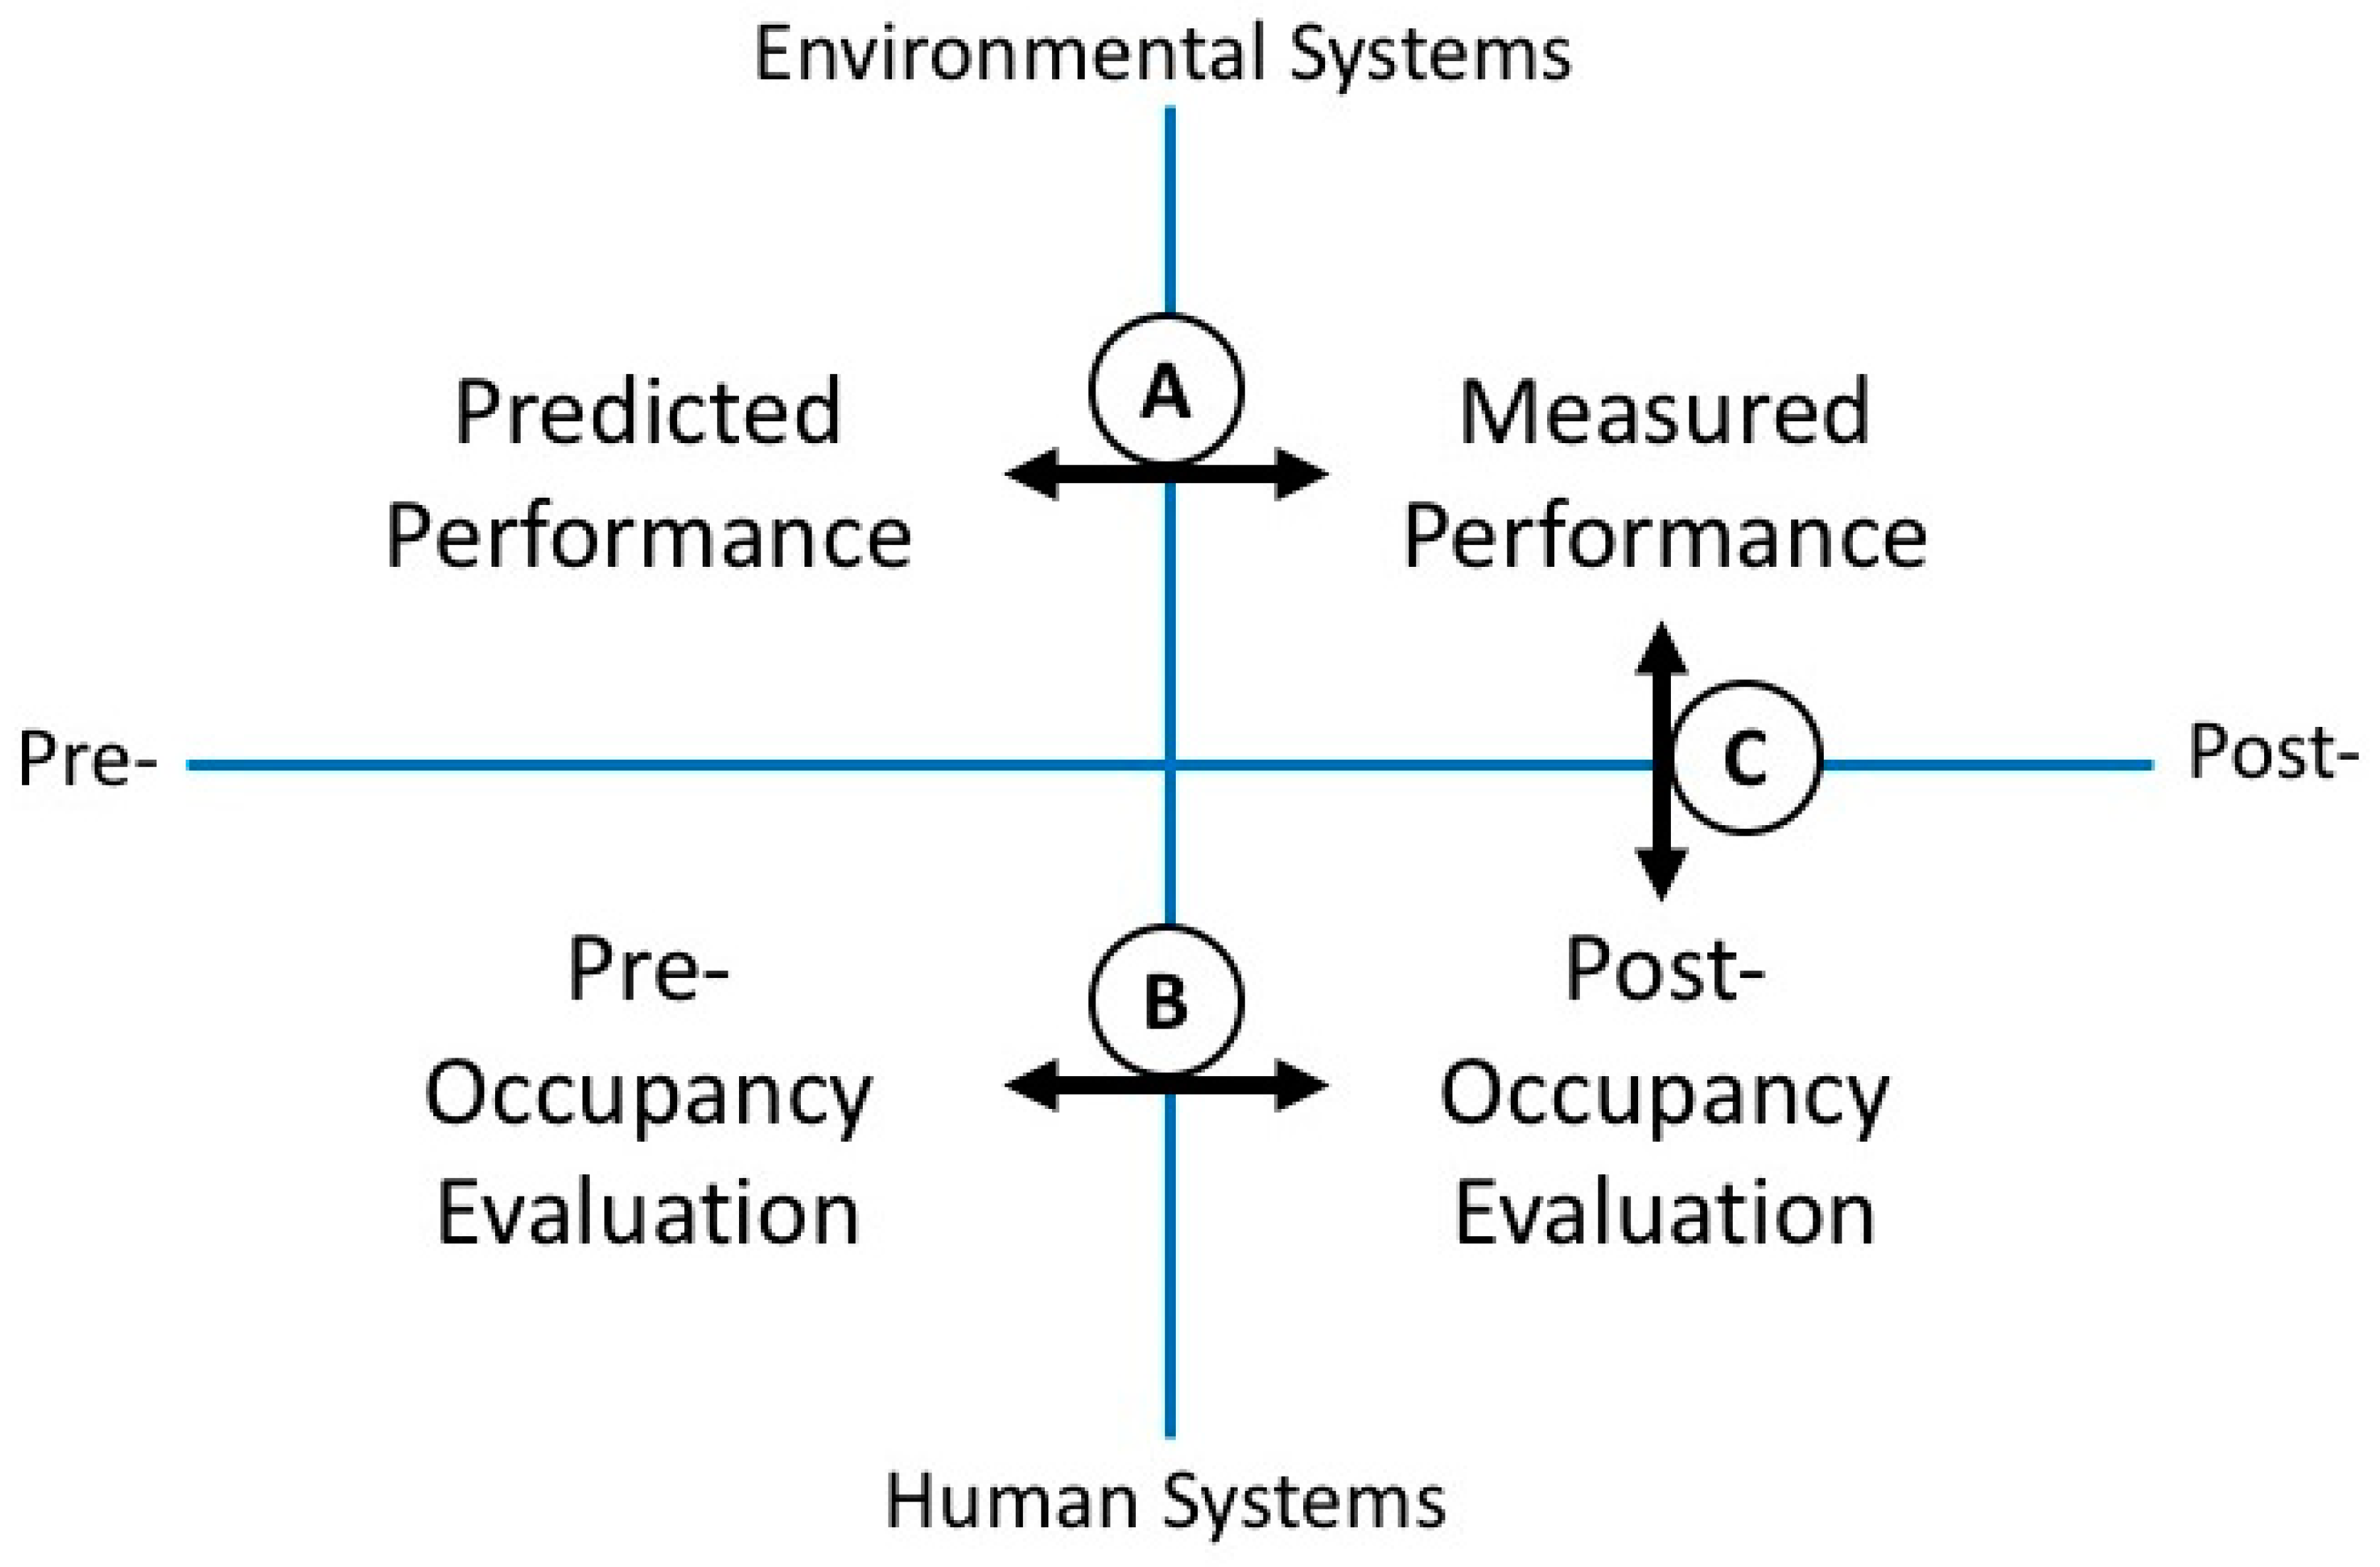
In order to achieve the potential advantages of a regenerative sustainability approach to the built environment, we need to develop systems of performance assessment that allow us to evaluate the potential for net positive outcomes in both human and environmental terms. We propose an approach to built environment performance assessment based on the following simple conceptual framework.
In contrast to environmental performance assessment, the assessment of human systems in buildings is usually conducted qualitatively (bottom two quadrants), through methods focused on occupants using input and feedback methods that include surveys and interviews. It is much less frequent, consisting mainly of episodic post-occupancy or post-retrofit evaluations.
In retrofits, Pre-OEs are not uncommon [
23], but for new builds, Pre-OEs are not typically carried out, meaning that there is usually no baseline for post-occupancy evaluations. Moreover, the quantitative performance of environmental systems is rarely compared to occupant experience of these systems, e.g., measured air quality and experienced air quality (For two recent exceptions, see Chang and Touchie (2017) and Touchie et al. (2016)). However, there is growing interest in these, with some published studies [
24,
25,
26,
27,
28,
29]. Researchers have acknowledged the need for pre-occupancy evaluations in health care environments, for example, as there is an increasing focus on evidence-based design and a desire for more scientific bases for design decisions [
30]. In their manifesto for “building human agency”, Cole, Brown and MacKay propose a directive that addresses pre- and post-occupancy evaluations: “Pre- and post- occupancy evaluations in new and existing buildings should become mandatory steps within the integrated design process to accelerate our understanding of the systemic inhabitants-architecture interactions” [
31].
Section 3.2 discusses some relevant survey and interview Pre-OE and POE methods and questions in more depth.
The following sections of this paper discuss these gaps in more detail.
3.1. Prediction Gap: Predicted vs. Actual Performance
The most well-documented performance gap in sustainable buildings is the quantitative discrepancy between the predicted and the actual performance of Environmental Systems such as energy, water, or carbon emissions. We are calling this discrepancy the Prediction Gap, and distinguish it from the other two Gaps that we explore below: it is typically measured in terms of energy use, and it is straightforward to quantitatively measure and compare calculations at the design or pre-retrofit stage to energy bills or measured performance on site.
Many published studies have shown that sustainable buildings do not perform as expected [
32,
33,
34]. Typically, they perform worse than expected, but sometimes they do better than their targets for designed energy use intensity [
35]. Newsham et al. [
36] found in a re-analysis of LEED certified office buildings that, generally, they perform better than non-LEED certified buildings, but that at an individual level results varied widely between designed and measured performance. In a study of 66 Canadian university buildings, Storey [
37] found no correlation between LEED certification and energy performance. And in a study of nine high performing buildings in Canada, Bartlett et al. [
38] found that three of the nine had actual energy use significantly higher than predicted.
3.1.1. Assessing the Prediction Gap
This section outlines findings from recent studies of the cause of the Prediction Gap, in particular modeling inaccuracies, assumptions about user behaviour, organizational and disciplinary silos and lack of comprehensive studies.
Modelling inaccuracy and, therefore, incorrect building assumptions are often blamed for the Prediction Gap. Common reasons are:
simulation tools tend to be incomplete in their representation of energy loads related to specific areas or systems in the building, especially when a project uses newer design strategies such as natural ventilation or advanced renewable energy and water systems which present challenges for modeling software;
energy models struggle to account for the actual/future usage of a building and seldom account for occupancy schedules and levels;
accurate representations of occupant behaviour are not part of the typical modelling practices;
weather files provide historic and therefore inaccurate weather data used in the simulations [
39]; and
studies have shown design-assist and compliance energy models prepared at the design stage are rarely verified or calibrated through as-built models, which provide predictions of energy performance based on what is actually built [
16] (pp. 12–14).
Another source of modeling inaccuracy is the incorporation of rated equipment efficiency rather than system/plant efficiency and operating strategies [
40]. Bartlett et al. [
38] cite the above, as well as quality issues, occupancy changes, commissioning, and operational issues, which can lead to additional costs for building owners, reduced occupant productivity, and buildings that fail to live up to their potential. Also, there is a need to properly model the system components and their control algorithms. To do this, the design must incorporate real performance curves, not just single point efficiencies. The perceived failure of a building due to these discrepancies has been termed “the credibility gap”, and it has created cynicism in the building industry, where people find it hard to ‘trust’ green design [
41].
A special issue of BRI Journal (2018) dedicated to the energy performance gap and its causes suggests the importance of improving behavioural assumptions in energy modeling and simulation, and delves further into other causes of the gap relating to occupant and other stakeholder practices [
42]. Studies showed that occupants are a more diverse group than assumed [
43], and similarly, that data on occupancy should be grouped by age, income and other variables, rather than considering users as a homogenous group [
44].
In a similar vein, studies have shown that people use their buildings differently, even in the case of studies comparing similar physical spaces, making accurate predictions is difficult. For example, Gram-Hanssen [
45] analyzed quantitative and qualitative data from different households living in similar homes in a suburb of Copenhagen and found that energy consumption due to usage patterns varied significantly, with some families using three times the energy of another family in a similar house. As a result, a challenge to better understanding the gap between predicted versus actual performance is in better identifying qualities and characteristics of the building users or occupants: to know how to design for what people want and will do, the users and their wishes must be known [
46].
Organizational structures and the typical disciplinary silos of the building process also contribute to the Prediction Gap. In such cases, the gap arises from institutional and cultural barriers in communication. Fedoruk et al. [
15] found that institutional issues arise from the way the various stages of the building life cycle were specified, contracted and implemented. These had the greatest impact on the discrepancy between anticipated and achieved building energy performance.
Another important issue is the nature of disciplinary roles on a typical project, where the person making the assumptions that define building performance goals is not the same person carrying out ongoing monitoring or taking lessons from this project to another one. This illustrates the need to have a commissioning agent on the project team from the beginning. Fedoruk et al. emphasized ”the importance of having meaningful and effective building energy monitoring capabilities, an understanding of energy system boundaries in design and analysis, crossing the gaps between different stages of a building life cycle, and feedback processes throughput design and operation” [
15] (p. 752). To this we would add the importance of an integrated design process, as well as an integrated approach to project delivery that considers the whole building life cycle throughout design, construction, commissioning and operation. “Beyond technical considerations or simply injecting new information, a rethink is required of how buildings are planned, designed, constructed, commissioned and operated in order to close the performance gap” [
15] (p. 751).
There is a need for more detailed studies of the Prediction Gap that examine a range of data and causes. A good example is a recent study of nine Canadian buildings that provides important findings that compare their predicted performance based on design stage modeling and green rating submissions with the actual building performance over two years using metered data for energy and water from the utility bills and submeters. The energy and water data were also compared to benchmarks for typical performance of similar buildings. In each of the buildings there was a significant gap between the measured and predicted performance of at least one of the systems being examined, and the researchers gained important insights into the difficulties of resolving the performance gap [
38,
47]. An unusual feature of this study was that it compared benchmarks of similar buildings, metered data, spot site measurements, interview data with the design team and building manager and occupant survey data.
This comprehensive approach found that rigorous reconciliation between projected and actual performance was not considered possible because it would mean revising performance projections made at the design stage to reflect actual building use and occupancy (for example, if more people used the building than initially assumed, predictions would need to be revised), and they found that in the nine projects, only one of the building models had an energy model that had been recalibrated [
38]. Their findings related to the nature of the disciplinary silos, distinct workflows and timetables, lack of funding, and a lack of interaction, and confirmed many of the reasons for the Prediction Gap cited above. The lack of model recalibration means that within the current way of working, design stage assumptions are not corrected. The usual workflows and outputs are not designed to be paired with findings from after the building is built and inhabited. This leads to obvious difficulties in comparing and evaluating the success of building performance. Consistency in what is being evaluated, and communication about what data is collected between design stages and occupancy stages of a building’s life span are important considerations for this gap.
3.1.2. The Future of the Prediction Gap
The energy performance gap is the easiest to define and measure, and yet it remains an urgent problem. Buildings are not performing as expected, and energy policies and building regulations are not adequately acknowledging and planning for this gap. The Prediction Gap has been studied in a number of disciplines, and many researchers see this gap as a problem relating to assumed building characteristics that can be solved by better modeling. However as noted above, a number of new studies argue that importance must be placed on understanding the nuances of institutional rules governing building design, construction and commissioning, occupant behaviour and buildings in use.
Future research relating to the Prediction Gap will need to acknowledge and delve more deeply into fundamental questions about the barriers to better understand this gap. There is a need to critically reflect upon what kinds of tools and methods we use to collect building performance data, what kinds of data to collect, who collects this data and how is it interpreted.
Relevant to the challenges of this gap are what we have termed the Prediction Paradox. The Paradox lies in the issue of how to predict building performance accurately, and also, in how to interpret results. If we want to better understand a building’s overall performance, the issues described above mean we cannot make accurate predictions; in fact, we argue that more information will not improve predictive accuracy of building performance as a whole. This is an inherent result of the complexity and resultant emergent properties of socio-technical systems like buildings, not of lack of knowledge. We can predict accurately only at the component level (e.g., heat loss through a specific material), where physical performance is well understood.
Much of the literature on what we are calling the Prediction Gap focuses on ways to narrow or eliminate it. However, due to the challenges of accurately predicting building performance outlined above, we argue that it is undesirable to attempt to resolve the complexities of building performance in terms of a single prediction for quantitative aspects such as energy performance.
Instead, we propose supplementing predictive approaches by moving in the direction of scenario analysis [
48,
49] and backcasting techniques [
50,
51] that focus on the range of possible outcomes, and on the ways that desirable outcomes could be approached. Developing alternative scenarios of performance based on different assumptions about behavioural and institutional issues would allow us to get a sense of the range of potential performance outcomes. At the same time, backcasting from desirable outcomes may help to guide the design process by focussing attention on those design strategies that work best to achieve design goals across the range of scenarios.
In this way, if the process of predicting performance is understood to be inherently uncertain, the design team can innovate within the predictive space by use of scenario analysis and backcasting. There are obvious challenges to instituting such processes for design teams and clients who are used to working towards specific performance targets. However, scenario analysis may present a good supplemental activity, as it can be seen as falling within the realm of conceptual design where various built forms and strategies are discussed, iterated, and analysed.
3.2. Expectations Gap: Official Story vs. Lived Experience
Gap B is the qualitative, social analogue to the quantitative performance gap discussed above, and occupies the Human Systems bottom half of
Figure 1, noted as ‘B’: it is often present when comparing Pre-Occupancy and Post-Occupancy Evaluation results. The Expectations Gap in the context of occupancy assessment is defined by Coleman and Robinson [
17] as the gap in occupant expectations: it lies between what occupants expect and what they experience in a building, and is expressed in qualitative feedback through survey and/or interview. The gap, summarized here, therefore describes differences between an assumed or predicted story about building performance as perceived and shared by occupants (based on prior experience, and sometimes influenced by information available about the building) and the dynamic, ongoing lived experience of it [
17].
In considering this gap, the role of people in buildings, and their assessment of the building through survey and/or interview, becomes of central importance. Cole et al. [
52] argued for the necessity of involved occupants, in the aim of re-contextualizing comfort requirements under climate change goals and building energy use [
3]. To enable this re-contextualization, occupant opinions and experiences are ideally sought and valued in building design and operations, allowing feedback and feedforward to design stakeholders [
17,
52,
53,
54,
55,
56].
Outside of ratings of comfort, which can be quantified and analysed statistically, themes and stories can be discerned from occupant commentary through content analysis and interpretation. Drawn out by survey and/or interview questions, once coded and interpreted [
57,
58,
59,
60,
61], these stories can illuminate how the building is, how it should have been, or that it has not yet become a space that enables health, well-being and productivity, for example.
The evidence for a qualitative performance gap can be seen in the form of disappointment and backlash, (including claims of greenwashing in the case of a green or regenerative building) [
17]. Thus, there are two levels at which the qualitative performance gap has potential negative consequences: at the level of occupants, in which disappointment about building performance may affect their perception of their employer or the sustainable building movement as a whole; and at the level of designers, who rely on the good reputation of precedent buildings for continued success.
A particular instance of the Expectations Gap is found in highly sustainable buildings [
62], where stakeholders’ expectations (designers, clients, and those with an invested interest in the building’s performance) become codified in promotional material, which then influences occupant expectations, a finding supported by other researchers [
53,
54]. Conceived of as ‘bids’ for social or normative alignment [
63], occupant stories about the qualities of built space constitute a powerful socially binding force, and have implications for the normalization of current and future building design [
17,
52,
62].
The characterization and content of stories or narratives about building energy efficiency has been discussed in policy literature [
64,
65,
66], in which the concern is to bridge and close the performance gap. However, Coleman and Robinson argued that it may be more fruitful to understand this qualitative gap as a generative space for a re-making of the building performance story as a whole [
17]. In doing so, the aim is to understand the building context as a continuously adaptable, and therefore, potentially optimizable setting, requiring ongoing feedback from occupants [
55].
In other words, the very existence of the Expectations Gap calls for interactive adaptivity, a concept developed by Cole et al. [
52], which asserts that building performance must take into account more than just the individual and ecological factors; performance must include broader societal circumstances, over time. Interactive adaptivity integrates “[a] dynamic and complex building system with a participatory process, interactivity between inhabitants, and between inhabitants and building elements”, and allows adaptation “to changing conditions (e.g., seasonal temperature change, or, on a larger scale, global climate change), resulting in a fluid but robust design that is responsive to social, ecological, and economic conditions over time.” [
52] (p. 333). In effect, the building engages in a conversation with its occupants, leading to mutual adaptation over time.
The Jim Pattison Pavilion in an iiSBE case study [
67] provides a simple but non-trivial example of interactive adaptivity: windows fitted with red and green lights guide the occupant to open or close windows in order to maximize cooling. In turn, these lights constitute a tool for awareness of energy consumption, and the process as a whole engenders continual optimization. The Comfy app (
www.comfy.com) provides another example in which building response can adapt based on occupant feedback on temperature, lighting, room bookings and other aspects, thereby centering on the occupant experience with both building systems and occupants continuously learning from it.
3.2.1. Assessing the Expectations Gap
Exploring the Expectations Gap relies on the collection of at least one source of data, taken from Pre- Occupancy and Post-Occupancy Evaluations, or pre-retrofit and post-retrofit studies. A Pre-occupancy evaluation (Pre-OE) or Pre-retrofit evaluation is an evaluation used as a baseline against which future evaluations can be compared. Usually, the same survey is conducted in the Pre-OE and POE so that data can be statistically compared. Responses in the Pre-OE and POE, with identical or different populations, can be compared in the sense that the data depicts responses to the “before” and “after” moving or retrofit conditions.
Some assessment studies have used a control group, in the form of a sub-population of individuals that remain behind in the prior building: both groups (those remaining behind, and those moving) are surveyed with the Pre-OE, and later the POE, at the same time [
29,
68].
The formulation of control populations is challenging, however, since building typologies and programming, compounded by differing building tenants and populations, constitute incredibly diverse ‘entities’ with many variables affecting evaluation outcomes. Paired matches (the same individual is surveyed before and after the move or retrofit) may therefore provide a better way to control for effects, which we assume are perceived more consistently by a single individual, than they are perceived between different individuals.
Yet, the goal of surveying pre- and post-occupancy matched pair individuals is itself hampered by attrition amplified by the sometimes lengthy amount of time between pre- and post-occupancy, as well as the fact that it is often not known what tenant, let alone individuals, are moving into a building. In this case, an unmatched control (different individuals in groups before and after the move) is assumed to be better than none.
The question of when to conduct the pre- and post-evaluations is also significant, and depends on the aim of evaluation. If the desire is to capture deficiencies or the immediate impact of a retrofit, then earlier in occupancy of the new building or retrofit is best; and if it is to understand how the building performs under optimized conditions, then later in occupancy is best. The first 6–12 months of an occupant’s experience in a new build or retrofit is a sensitive adjustment period for both occupants and building operators. At this time, complaints are high and new habits and routines are being established by all. For the aim of identifying and fixing deficiencies, this is a good period to run a POE, but of course, it will likely turn up the largest Expectations Gap, which also may be highly transitory depending on how soon the deficiencies are rectified. For later POEs, Paevere and Brown found that the case study green building (CH2) was still being fine-tuned after one year [
69], while McCunn and Gifford suggest that 4 years may not be long enough for the positive effects of a green building to be felt [
70]. As such, building operators would know best when it is an optimal time to run a POE, or at least, they would be able to flag ongoing deficiencies during analysis. The season that an assessment is run is also significant, since if the pre- and post-occupancy evaluations are to be matched with as little variability as possible, then ideally, the seasons are matched as well, meaning that at least a year’s gap between the two evaluations is necessary.
In terms of requesting qualitative data, questions in the Pre-OE survey and/or interview [
59,
71] can be used to query occupant expectation of future conditions, benefits, and features, such as: anticipated IEQ performance, support of sustainable activities, the expected impact of building conditions and features on productivity, well-being and health, and so on. In the absence of interviews, a section for open comments in surveys usually elicits illuminating and unexpected feedback. As [
72] indicates, surveys are often used as repositories for complaints; further, complaints are useful to investigate because they often indicate a change in what is normal and expected [
62].
This data is then analysed through coding, categorization, distillation and interpretation [
57,
58,
60,
61] for themes that build into narratives (software like NVivo can be useful for this purpose), with outliers taken into consideration. Thus, pre- and post-commentary is analysed and coded for themes (e.g., the expression of skepticism, a feeling of forgiveness, the sense of tribe) and narratives (e.g., “I heard about the user interface we’d get and I was annoyed when we didn’t, but it’s not really a big deal—work is easier now because all my colleagues are all here”), and the before and after stories are then compared for similarity and difference.
If data that can be analysed more quantitatively is desired, questions that directly ask about expectations before the move or retrofit can also provide a picture of difference or similarity in expectations, before and after a retrofit or move. For example, in the Pre-OE, a set of Likert scale questions could ask, “Rate your level of agreement with the statement: ‘I expect that air quality will be excellent at all times.’” Following up on the POE after the move or retrofit, the mirroring question would ask, “Rate your level of agreement with the statement, ‘My expectations were met regarding air quality.’” This data can be statistically analysed, and it can also be considered alongside the prevalent themes, narratives, and outliers produced by the analysis of interview questions and survey commentary, for further informal comparison.
Traditional POE data (e.g., Likert scale data on workplace and IEQ satisfactions) can also be inspected for how it connects to, supports or contradicts the data on expectations, or commentary before and after.
Interpretations can be further connected to other data where expectations are unmet (e.g., in the Pre-OE, an occupant thought there would be art installed; in the POE, it turns out that the lack of it is perceived to hamper well-being, thereby connecting the two), or where expectations are exceeded (the occupant expected plentiful fresh air; they experienced more fresh air than expected, and this is perceived to directly enhance health). In all cases, a coding session of the same qualitative data could be conducted independently by another researcher to corroborate interpretations [
57].
As mentioned, adding another layer of complexity to the assessment of the Expectations Gap is the particular case of highly novel, innovative, and/or green buildings, which are usually touted for their difference in publicly-available and distributed promotional materials. According to Coleman and Robinson, for buildings that have been publicly marketed the promotional material itself (brochures, building tour script, external and internal signage, online building manual, media coverage, etc.) will significantly influence occupant expectations. These materials can be collected and analysed as well, and interpreted to constitute a collective “Official Story” [
17]. The same authors found that the Official Story derived from promotional materials and a media analysis was clearly reflected in occupant stories about the building [
17,
62]. In terms of analysis of the Expectations Gap, in the case of highly promoted buildings, designer and stakeholder aspirations may dominate occupant expectations, and the lived experience assessed in the POE is then positioned as a reaction to that Official Story [
17].
3.2.2. The Future of the Expectations Gap
The Expectations Gap exists in green building performance as it does in other fields, because the complexities of reality—often of an institutional and social nature—intrude upon expectations. However, the Expectations Gap is unique in that it relies entirely on subjective qualitative data, which is based on the interplay, feedback and feedforward between prior, and later, occupant experience. When the stakeholders’ collective vision for the building is available at or even before moving in, the occupant experience is ultimately an evaluation of that vision.
It is worth noting that in the special case of sustainable buildings where promotional Official Stories influence occupant expectations, this promotion is almost always focused on innovative and novel building features, rather than on occupant social and well-being-related opportunities. This is significant because researchers [
17,
73] have shown that occupants are more readily disappointed with the anticipated physical benefits of a building than they are with the intangible benefits (such as social and creative opportunities, well-being and productivity, etc.) afforded by a building context. As a result, we suggest that the existence of a significant Expectations Gap in a sustainable building indicates that building stakeholders should focus more on promoting the social and productive aspects of inhabitation, rather than on innovative building features [
17,
53].
This focus on the role of the occupant provides a rationale for their involvement in design and operations, as is suggested by the Soft Landings approach [
56] and a variety of other authors [
55,
74,
75]. Cole et al. noted that building occupants may be considered ‘inhabitants’ when they play an active role in the maintenance and performance of their buildings, as opposed to ‘occupants’, who are passive recipients of pre-determined comfort conditions [
52].
The logical complement to the involvement of engaged occupants is a continuous form of POE, allowing continuous feedback, feedforward and optimization of the building environment in tandem with occupants’ satisfaction, well-being, and productivity. This is furthermore in keeping with a regenerative approach, seeking to balance human and environmental well-being, and ultimately provides interactive adaptivity [
52,
53], allowing for an active process of mutual accommodation between the building and its occupants.
The concept of forgiveness illustrates the opportunity of the recommended notion of interactive adaptivity. A phenomenon noted by various building researchers, occupants of green buildings appear to be more forgiving of conditions affecting their comfort than are occupants of conventional buildings [
53,
72,
76,
77,
78,
79]. (Leaman and Bordass calculate a ‘forgiveness factor’ as the ratio of overall comfort, to the mean of the individual indoor environmental quality (IEQ) variables scores. The factor ranges from 0.8-1.0. A factor higher than 1.0 indicates more tolerant occupants, who are willing to tolerate insufficient conditions in spite of expressed dissatisfactions (Leaman and Bordass, 2007)). Importantly, greater forgiveness is also associated with greater occupant control and feedback [
62,
77,
80]. The message is that a green building, with greater control and feedback allowances for occupants, is more likely to be forgiven its failings. At the very least, adaptation through interactivity, in the gap between what was expected and what was delivered, allows for new expectations [
17].
Last, a general challenge related to instituting interactive adaptivity and feedback processes entails a change in the ecosystem of building design and facilities management, for occupants, managers, designers, and clients. These changes have significant implications for the required skills and training of building operators. Further, occupants would be faced with typically unfamiliar expectations of engagement, and building and construction stakeholders would need to learn how to work with negative feedback (which must be seen as part and parcel of instituting dialogue in a regenerative sustainability context).
3.3. Outcomes Gap: Measured vs. Experienced
The Outcomes Gap C describes the difference between measured performance and the lived experience—between Environmental and Human System data. Specifically, this measured performance typically relates to indoor environmental quality parameters that are indicators of visual, acoustical and thermal comfort and indoor air quality. These parameters may include light levels, air temperature, mean radiant temperature, relative humidity, and carbon dioxide concentration, among others. The measured data is often compared to standards or accepted models which are used to determine if the measurements indicate a satisfactory environment. Data on the lived experience is typically captured through occupant surveys or interviews, both structured and unstructured. Guerra-Santina and Aidan [
81] provide a comprehensive overview of data collection methods to evaluate building performance energy and thermal comfort using both qualitative and quantitative methods. Then, these results can be compared to determine if the monitored conditions and the reported conditions agree with one another. Examination of the Outcomes Gap is a critical first step to contextualizing the sometimes misleading quantitative metrics like energy performance or temperature and getting to the root whether the building occupants are satisfied or not and, perhaps more importantly, why they perceive the building in the way they do [
82].
Numerous studies have gathered both Environmental and Human System data that have been used to examine the Outcomes Gap. Studies related to this gap are typically conducted in office environments and have largely focused on issues of personal environmental control and perceptions versus measured conditions relating to daylight and ventilation. While all of the studies presented here involved the collection and analysis of both qualitative and quantitative data, only some studies have collected these various data types attempting to correlate qualitative responses to the quantitative monitoring data in various ways, either directly for certain parameters like lighting levels, or indirectly, through translational models, such as in the case of thermal comfort.
For example, studies that simply examine both data types include Altomonte and Schiavon [
83], Geng et al. [
84] and Newsham et al. [
85]. Altomonte and Schiavon [
83] studied the difference between BREEAM and non-BREEAM office buildings using survey data on lighting, acoustic and thermal comfort which were collected while spot measurements of various IEQ parameters were collected at the respondent’s workstation. The findings related to lighting led the authors to hypothesize that personal control over lighting available in non-BREEAM buildings, which allowed occupants to intervene during periods of visual discomfort, resulting in greater satisfaction with the indoor environment and a tolerance for greater fluctuation in lighting levels. Geng et al. [
84] compared environmental measurements, survey results and productivity tests under various air temperature conditions from 16 °C to 28 °C. Interestingly, they found that thermal dissatisfaction appeared to override awareness of other IEQ parameters like lighting, noise and IAQ, but when occupants were thermally comfortable, they became more aware of these parameters, specifically, noise and lighting, demonstrating the interconnectedness of the IEQ perceptions and primacy of thermal comfort. A laboratory-based study by Newsham et al. [
85] used occupant surveys to evaluate occupant attitudes to having personal control over the changing environmental conditions that would occur during a demand response event. They found that the ability to control one’s lighting and ventilation levels both increased satisfaction and decreased energy use.
Examples of studies that attempted to find a correlation between survey responses and environmental measurements include Leder et al. [
86] and Choi et al. [
87]. A field-based study by Leder et al. [
86] measured perceived conditions versus measurements of IEQ parameters in an office space. Stepwise regression was used to compare field measurements of environmental conditions at individual workstations to simultaneous online questionnaires about the respondent’s environment to determine which conditions most impacted occupant satisfaction. The study findings support the idea that green buildings can provide better perceived indoor environmental quality compared with conventional buildings. Choi et al. [
87] compared 15-min IEQ measurements at various workstations in the perimeter and interior of an office with survey data yielding numerical ratings of various IEQ parameters. They found that IEQ guidelines did not necessarily yield comfortable conditions, and thus, made a series of recommendations about temperature, lighting and air flow rates to improve occupant satisfaction.
This type of research is less common in the residential sector, but a handful of studies have begun to examine the Outcomes Gap in this sector. Similarly, in the residential sector, some studies only examine these two datasets, such as Liu et al. [
23] and Dascalaki and Sermpetzoglou [
88]. For example, Liu et al. (2015) examined the performance of two Swedish apartment buildings: one that had undergone an energy retrofit and one that had not. They used indoor temperature data and energy data to calibrate a building energy model which was then used to generate PMV and PPD data based on the model described in ASHRAE Standard 55. These pre- and post-retrofit modeled thermal comfort indicators were compared with reported thermal comfort issues from pre-retrofit and post-retrofit occupant surveys. A correlation was found, but not quantified given the different metrics output from the model and the surveys. The surveys also found improvements in many other areas of indoor environmental quality, including noise and air quality, but site measurements for these parameters were not collected for comparison with these perceived improvements. A study of Hellenic schools included IEQ measurements for one week as well as occupant surveys of teachers and some pupils [
88]. Approximately 60% of the time the monitored conditions were considered unacceptable relative to standards such as ASHRAE. The survey data, which included a numerical rating of various IEQ parameters, was reported separately without a comparison to the monitored data. The most frequent survey complaints related to insufficient ventilation, noise disturbance, glare and thermal discomfort.
Only one residential study directly examined the gap between the qualitative and quantitative data. A three-year study of social housing buildings in Toronto showed a significant difference in the resident-reported thermal comfort and the calculated thermal comfort levels based on ASHRAE Standard 55 and in-situ environmental measurements in both summer and winter [
89,
90]. Generally, occupants were less satisfied with wintertime conditions than the comfort standard would suggest, but interestingly, the particular combination of the building type (e.g., low or high rise) and occupancy type (e.g., senior or family) appeared to have an impact on the level of agreement between reported and calculated thermal comfort. The mid-rise buildings (which had a combination of senior and single occupancy types) saw the closest agreement between measured and perceived thermal comfort. While the measured data collected from high-rise buildings occupied by families suggested a higher level of comfort than the survey responses indicated, the data collected from the low-rise buildings occupied by seniors suggested a lower level of comfort, despite occupants reporting satisfactory conditions.
There are some obvious limitations to comparing monitored data with results from a survey. Comparing qualitative survey responses with quantitative parameter measurements leads to questions about what constitutes an agreement between these two data sets. Are we measuring the right parameters and asking the right questions to allow for a direct comparison between these qualitative and quantitative data? How do we compare continuously monitored parameter data to episodic survey data? Furthermore, should average or extreme conditions be compared? The next section explores these aspects related to assessing the Outcomes Gap.
3.3.1. Assessing the Outcomes Gap
(1) Comparison of qualitative and quantitative data
Of the three performance gaps, the Outcomes gap is perhaps the most challenging to assess and quantify, primarily because different metrics must be compared directly. The first two performance gaps involve comparisons of the same data type (e.g., degrees Celsius or ekWh/m2 for the Prediction Gap or the results of a ranking survey question for the Expectations Gap). To assess the Outcomes Gap, on the other hand, survey results must be compared with monitored data.
This ‘translation’ of data to enable the comparison between these two data types often occurs via an existing model. The model serves as a means of converting one data set into a form where it can be directly compared with the other. The challenge with this comparison, and a likely contribution to the existence of the Outcomes Gap, lies in the model assumptions. While it may be possible to reduce the influence of inaccurate assumptions by gathering more performance data, there is a practical limit to the number, type and placement of sensors in occupied spaces. Furthermore, there is a question as to whether we are even measuring the correct parameters to assess occupant satisfaction.
For example, the thermal comfort model in ASHRAE Standard 55: Thermal Environmental Conditions for Human Occupancy includes inputs such as air temperature, mean radiant temperature, relative humidity, air velocity, clothing level and metabolic rate to determine whether the majority of occupants would find the particular set of conditions comfortable. These values are used to determine the Predicted Mean Vote (PMV) or the Predicted Percent Dissatisfied (PPD), which can be directly compared to the results from a survey question which asks the occupant to rate their thermal comfort on a Likert scale of the ASHRAE Thermal Comfort Index, or state whether they are satisfied or dissatisfied with their thermal environment. The empirical relationship between these model inputs and outputs may be quite strong when the inputs are fully characterized at the occupant level in a laboratory setting and the testing is conducted on a sufficiently large sample. However, gathering the model inputs in an actual building is significantly more challenging. This can be seen by examining how we would collect data to input into a thermal comfort model in order to allow for a comparison with the survey data.
Devices such as smart thermostats and sensors connected to building automation systems can easily collect data on air temperature and relative humidity; however, both of these parameters are collected locally at the sensor location and do not necessarily reflect the variation in these conditions throughout the zone of interest, and specifically, where the occupant is currently located. Data on the other parameters are significantly more challenging to collect. Mean radiant temperature (MRT) can be measured using a globe thermometer located in the geometric centre of the zone, which is obviously impractical for an occupied space, and only reflects MRT at the location of the thermometer. Alternatively, infrared imaging can be used to determine interior surface temperatures, and then shape factors can be used to determine the resulting mean radiant field at the location of the occupant.
Once again, the imaging and shape factor calculations are impractical for long term monitoring as all surface temperatures in the zone must be collected and the occupant(s) location must be known. To characterize draught sensation and air speed throughout a zone, a matrix of air velocity sensors distributed throughout the zone volume would be required, but this would be impossible to instrument in an occupied space. Clothing levels and metabolic rate depend on occupant preferences and activities. All of these parameters vary throughout the zone or from person to person and through the day and year. Therefore, based on current and commonly-available sensor technology, assumptions about many of these monitored parameters are often required to use these ‘translational’ models, such as those described in ASHRAE Standard 55.
Even if it were possible to collect all of these environmental data in an occupied space, some occupant perceptions and preferences will extend beyond the upper and lower acceptability limit as dictated by the model. So, while the model might provide an indication of the conditions under which most occupants would be satisfied, most current models cannot precisely predict how a given occupant will perceive certain interior conditions. Therefore, perhaps our efforts are better spent using survey data to interpret quantitative data collected through monitoring, rather than try to directly compare them.
(2) Comparison of continuous and episodic data collection
Inexpensive data storage means data on IEQ parameters can be collected at short intervals (e.g., every few minutes) for long monitoring periods (e.g., months or years); however, surveys and interviews are generally expensive and time consuming to conduct, and so, for a given study, are often only conducted at a single point in time or, at best, a handful of times throughout the study period. Even with surveys conducted via smartphone, there is a practical limit to the number of times one can survey a study participant before annoyance or impatience sets in. This difference in data collection frequency presents challenges for comparing the qualitative survey data and the quantitative monitored data.
These occupant surveys may reflect real-time observations or retrospective ones [
82]; however, the ability to recollect their experiences and perceptions varies between individuals and the time span which they are asked to consider. For example, an occupant may easily be able to recall the quality of their experience in a space over the last 15 min or hour, but may find it more challenging to characterize this experience over a few months or a year. This can be a result of trying to recall past experiences under different current conditions or after significant passage of time (e.g., considering wintertime thermal comfort in response to a survey question posed during the middle of summer) or difficulty aggregating a range of conditions experienced (e.g., will the occupant report on the extreme periods of discomfort or their impressions of the average conditions in the space). The wording of survey questions, as well as the motivation of the occupant, can influence how these questions are interpreted and responded to.
With respect to the monitored data, we need to determine what time span should be used for comparison with the survey responses. This decision is relatively simple if the survey question asks an occupant to recall conditions over a 15-min period, but if queried about seasonal differences in terms of the level of satisfaction with the space, how should the monitored data be processed for comparison? One option is to examine the average or extreme values over the time period and compare these to the survey responses. Alternatively, a translational model can be used to determine if the conditions would be considered satisfactory over the given time period, and then the proportion of time with satisfactory conditions in the given time period can be compared to the survey response. Regardless, we must make assumptions about how the respondents are interpreting the questions before processing and comparing the data.
3.3.2. The Future of the Outcomes Gap
There are numerous challenges that must be addressed with respect to the Outcomes Gap. However, as with the Expectations Gap, instead of trying to close this gap, we may wish to use the existence of it as a creative resource to inform the development of new, more meaningful ways of thinking about performance, and thereby better performance indicators of occupant satisfaction. The critical question we must ask ourselves is which data type, Environmental System or Human System, is indicative of ‘real’ performance? In other words, we can measure indoor conditions and compare them to a standard, but if the occupants are not satisfied, does it really matter that the quantitative measurements meet the standard? This section discusses some of the challenges and opportunities related to collecting and comparing these two data types.
To improve occupant satisfaction, we can consider increasing the frequency of occupant feedback, allowing for adequate control over the space either centrally or individually in response to occupant discomfort and, perhaps most importantly, finding a way to communicate the consequences of this gap to building designers and owners.
With respect to data collection, as sensors become smaller and less expensive, there are a number of wearable options that might be able to provide real-time, local-to-the occupant environmental feedback to building control systems. Mobile devices, desktop apps or wireless polling stations throughout the building can provide easier, less-intrusive ways to collect real-time data on occupant perceptions of their space, and provide these data directly to building operators. Alternatively, image analytics of facial expressions from security footage or assessment of mood via social media could yield occupant feedback without requiring their explicit participation in the process. In all cases, establishing best practices around privacy considerations is a challenge not limited to methods of building performance assessment, and insight may be drawn from fields where monitoring is common.
Another challenge emerges where satisfying the desire for an individual to have control over their space may be at odds with the satisfaction of the larger group occupying the space, which must be carefully considered and addressed at the design stage. Furthermore, gathering and processing this individual versus group feedback must be managed by building operators in order to make use of these data. Applications, such as the Comfy App, that can aggregate feedback and provide guidance to operators, are necessary to quickly process these vast amounts of real time data to make the findings actionable. However, even with these advances in data collection and processing, we are often limited by the controls and zoning associated with our current heating, cooling, ventilation, lighting, window and blind control systems, just to name a few.
Finally, the findings from exploration of this gap must be communicated beyond academic circles. Best practices and common challenges should be incorporated into guidelines, standards and regulations so that minimization or elimination of this gap will be considered from even the earliest stages of schematic design. Only through consideration of this performance gap throughout the design, construction and operation of a building can we put occupant wellbeing first and foremost in our list of performance objectives for the built environment.


