Digital Technologies Towards Resource Efficiency in the Agrifood Sector: Key Challenges in Developing Countries


Centre for International Manufacturing, Institute for Manufacturing (IfM), Department of Engineering, School of Technology, University of Cambridge, Cambridge CB3 0FS, UK
*
Author to whom correspondence should be addressed.
Sustainability 2018, 10(12), 4850; https://0-doi-org.brum.beds.ac.uk/10.3390/su10124850
Submission received: 31 October 2018
/
Revised: 17 December 2018
/
Accepted: 17 December 2018
/
Published: 19 December 2018
(This article belongs to the Special Issue Preserving Ecosystem Services via Sustainable Agro-Food Chains)
Abstract
:Resource efficiency in the agri-food sector is a global urgent issue considering the urbanisation phenomena, the increased nutritional needs, and the emergence of diversified dietary norms. Despite the ongoing progress in digital technologies that could enable resource-efficient operations in the sector, their effectiveness—even in developed countries—remains debateable mainly due to the limited understanding that further impedes their adoption by farmers. Among others, ease of access, training, and engagement with digital technologies appears to be challenging for most stakeholders, especially during the production (farming) stage. Specifically, in developing countries, that often encounter major natural resources challenges, the diverse socio-cultural background of the farmers hinders the adoption of digital technologies to perform highly automated and efficient agricultural operations for ensuring sustainability output. In this regard, we explore publicly available data sources (i.e., institutional reports, databases) to identify key challenges in adopting digital technologies for efficient resource use from a systems-level perspective. Thereafter, we map the determinant factors using the System Dynamics methodology in order to identify areas of interventions to limit natural resources’ appropriation and support agri-food sustainability.
1. Introduction
The way agriculture influences food security and humanity poses a very complicated issue. However, it is unquestionable that its impact is significant. An agri-food system depends on different operations such as arable farming, soil cultivation, production of diverse products such as crops, fibres, and timber, breeding and raising livestock, and manufacturing and marketing of foods. Thus, today’s societies request the global agri-food system to use fewer resources and be more environmentally-friendly [1].
Digital technologies significantly influence all segments of the economy including the agri-food sector. The latest report from the World Bank [2] outlines the key gains from the application of advancements in Information and Communications Technologies (ICT) in the agri-food system. In particular, ICT support higher involvement in the wider economy, boost effectiveness by supplementing other production elements, and foster innovation by intensely decreasing transaction costs. Smartphones and the Internet assist in overcoming information obstacles that limit market entrance for small producers and expand current knowledge supplying extension services that advance food supply chain management. Despite the numerous encouraging examples of concrete results, these have not been materialised to the anticipated level. The key cause is that technology can only address some, but not all, of the barriers encountered by food supply chain stakeholders in developing countries [3].
The challenges facing the agri-food sector differ significantly, depending on the economic status and development level of every region. Developed countries deal with overweight malnutrition while, in the other extreme developing countries, like the Middle East and North Africa (MENA) region, struggle with undernourishment. In this regard, a prevailing concern, given the resource efficiency issues in such regions is the expanding dependence on the global market for essential food products. Current policies in the MENA area focus on sustaining cereal production and consumption and, as a result, 65% of cropland is planted with water-demanding grains. The outlook of the Organisation for Economic Co-operation and Development (OECD) and the Food and Agriculture Organization of the United Nations (FAO) for the MENA region foresees on-going dietary changes toward meat consumption, extended freshwater appropriation at non-sustainable rates, and progressive dependence upon global markets [4]. Initiatives to reduce poverty and produce added-value agricultural products could contribute to more diversified and nutritious diets. However, such changes require capacity building in the agri-food system by leveraging digital technologies [5]. A holistic view in the agri-food system should also consider the implementation of management accounting and control system principles since these facilitate the evaluation of the benefits stemming from the adoption of sustainability-driven innovations in organisations [6]. Indicatively, the external focus of management accounting and control systems is documented to enhance export propensity for the establishment of food value chains [7].
This research attempts to map the agri-food sector’s resource efficiency related challenges in the developing world from a "how to leverage digital technologies" perspective. In the extant literature, management accounting and control systems have been used to align individual operations with organisational goals [8,9]. In this regard, in order to effectively capture the underlying complexities and the non-linear behaviour of the agri-food system over time, we adopt the System Dynamics (SD) methodology to further understand the long-term effects of digital technologies in sustainable agri-food systems [10]. SD is a simulation-based approach, which has been proven quite successful in policy-making at a strategic level regarding a wide range of sectors and challenges [11]. Our research findings, reflected upon the proposed causal loop diagram, echo the major resources’ efficiency challenges being encountered by developing countries since these are identified in the reviewed policy documents. Therefore, we do not focus on a particular country as an exemplar case.
This research contributes to the extant body of literature by systematically mapping the complex interrelations governing the resource-constraint agri-food sector in developing countries and by indicating targeted digital technology interventions to tackle major sustainability challenges from an end-to-end supply chain perspective. In addition, existing systems-level analysis methods for agri-food sustainability are mainly positioned on a high-level conceptual space whereas the provided mapping approach has been thoroughly structured to be able to inform further quantitative analysis and provides the backbone for a simulation-based decision support tool.
The paper is structured as follows. The next section sets the objectives and describes the research approach employed. Afterwards, we discuss the key challenges under the different agri-food system levels, which is followed by a synthesis of results at a Systems Dynamics causal-loop projection. In the last section, we outline the main conclusions and provide the implications of the current work through future research suggestions.
2. Research Objective and Approach
The object of scrutiny in the current work is two-faceted, including synthesis of the extant literature (i.e., institutional reports and research articles) and mapping of sustainability related challenges in developing nations with reference to the agri-food system. The multi-faceted character of our approach aims to inform a coherent construct about the complex topic of this research [12].
2.1. Research Objective
The main objective of this research is to support academics and practitioners alike toward ensuring sustainability and viability of the agri-food sector in developing countries by specifically providing an SD-based mapping framework that could inform the effective assessment and implementation of digital interventions. In this regard, we first map the key challenges that affect the triple-helix of sustainability with regard to the agri-food sector in developing countries. At a greater extent, we identify targeted digital technology-driven interventions and recognise their causal effect in an end-to-end agri-food supply chain system, which could promote sustainable performance.
2.2. Methodology
At the first stage, the methodological step refers to a literature review in order to recognise the key challenges that govern agri-food supply networks in developing countries. In this regard, to ensure a high integrity, our review focuses on reports by FAO as the appreciated public actor that provides widely accredited standards with regard to food agriculture sustainability [13]. We also retrieved major publications by OECD since the organisation that gauges the impact of national agricultural policies towards global food security and sustainability [14]. At a second stage, we use SD mapping to capture the causal effects of the identified challenges across end-to-end supply systems. SD defines problems dynamically through two stages, i.e., mapping and modelling, in order to ensure modelling robustness and inform targeted and efficient policy interventions. The structural elements of the SD include feedback mechanisms, causal loop diagrams, and stock and flow maps [15].
- Feedback structures assist in capturing the actual patterns of a system’s behaviour over the course of time.
- Causal loop diagrams help capture the mental models that describe a system. Annotated arrows depict the causal influences among a system’s variables. A positive (denoted as “+”) polarity denotes a reinforcing loop, which means that the cause and the resulting effect change toward the same direction. On the contrary, a negative (denoted as “−”) polarity denotes a balancing feedback where the cause and the effect change towards the opposite direction.
- Stocks provide memory to a system, which enables a dynamic disequilibrium.
Contrary to traditional optimisation and simulation techniques that are appropriate for analysing static and linear systems, SD can help capture the dynamic behaviour of a system, introduce system interventions, and assess a system’s response and evolution phenomena in time. Recent sustainability-focused studies incorporate SD to evaluate the impact of alternative interventions at either a policy or a technological level on the resulting sustainability performance of agri-food supply chains [16,17].
3. Challenges in the Agri-Food System
The impact of digital technology interventions on agricultural outcomes and overall supply chain’s performance sustainability and efficiency is unquestionable especially in developing countries. First, digitalisation significantly improves market transparency and traceability. Mobile phone coverage in Niger resulted in greater arbitrage openings, reduction in price dispersion, lesser waste, and welfare growth for consumers and producers [18]. In India, Internet kiosks contributed to rises in farm prices due to bargaining advances with middlemen as well as better market involvement in isolated areas via effective management and marketing [19,20]. Second, digital technologies are associated with an increase in farm productivity. In Peru, mobile phone coverage improved income and food security (mainly at a rural household level) over better management practices [21]. In India, hotline voice services facilitated the acceptance of enhanced inputs by allowing cost-effective extension guidance and weather forecasts while supporting agricultural investment decisions [22]. Third, a considerable improvement in logistics efficiency occurred. In Zambia, an SMS-based service optimised supply chain management by enabling better coordination of transportation and delivery of products [23]. Lastly, in Kenya, mobile money simplified secure payments, which allowed quick and secure money transfer for agri-inputs and subsidies etc. [24].
Nonetheless, fundamental problems remain unresolved and key challenges need to be addressed. Our review attempts to identify such challenges. For a more meaningful presentation of the review’s output, we adopted an end-to-end supply chain perspective. Thus, in the following five sub-sections, we provide a taxonomy of key challenges with respect to the main pillars of sustainability (i.e., economy, environment, society) regarding production (farming), processing-manufacturing, distribution (transportation-logistics), wholesaling-retailing (trade) and consumption levels, respectively.
3.1. Production (Farming)
Global food availability is the common denominator among the several challenges at the production (farming) level. Increasing demand, due to income and population growth, overtakes expected supply gains stemming from productivity advancements and increased mobilisation of land, water, and other resources. Tighter global markets indicate higher food prices and, therefore, the availability issue affects nations with low food affordability [25]. Table 1 summarises the key challenges regarding the production (farming) level in developing countries.
In particular, the identified key challenges mainly refer to the food “safety-security-affordability” nexus and the associated resources’ efficiency issues. As a result, one of the main challenges relates to the effective way farmers gain access to new knowledge in agriculture and resource management in an era of patent rights and regulations imposed by the World Trade Organization [26]. Investments in the agri-food system could result in bridging the gap between production and the growing demand for food commodities, adjusting to the evolving dietary patterns in a more sustainable way [27]. Such a sustainable increase in productivity could offer greater scope compared to mobilising more resources [25].
3.2. Processing-Manufacturing
The agri-food manufacturing sector is a vital sector in many agri-based developing countries. For instance, in sub-Saharan Africa’s most countries, agriculture signifies between 30% and 50% of total production value added while, in some countries, this respective value accounts for more than 80%. Nonetheless, the lack of essential infrastructure—from rural roads and electrical power grids to storage and refrigerated transportation—refrains any attempt from further growth [28]. Financing essential infrastructure and new technology interventions could result in significant improvements with respect to efficient energy use, reduction in waste, and water scarcity. Table 2 outlines the main food manufacturing-related challenges.
3.3. Distribution (Transportation-Logistics)
Increasing need for greater volumes of high-value food commodities raises challenges at both the upstream supply chain, from the suppliers of production inputs and manufacturers/processors, and downstream to the packaging, distribution, and storage levels of operations [28]. At a greater extent, a lack of appropriate infrastructure typically impacts the quality of the distributed food supplies [29]. Distribution is a critical echelon of operations in an agri-food system. Supporting the sector with infrastructure and technology investments to improve links among all supply chain actors could assist in overcoming the prevailing challenges [29,30]. Table 3 provides a synopsis of the key sustainability challenges related to distribution.
3.4. Wholesaling–Retailing (Trade)
In addition to the previously mentioned established challenges governing agri-food systems in developing nations, there are rising doubts about trade risks globally. Agri-food trade plays a vital role towards food security and emphasising the need for supporting trade-related digital technology interventions [2,4]. Global trade can influence positively rural development by supplying inputs and equipment and by fulfilling food demand. Nevertheless, trade liberalisation results in growing imports, which benefits consumers and restrains local production at the same time [26]. Table 4 provides an overview of challenges with regard to the wholesaling-retailing (trade) supply chain echelon.
3.5. Consumption
Food demand depends on population/income growth, emerging dietary patterns, and diversified consumer preferences. Current trends suggest developments in consumer demand patterns due to the observed increase in average incomes such as the declining role of cereals and the growing demand for protein-rich diets. On the other hand, food health issues negatively influence consumer demand [4]. Table 5 below summarises the main challenges related to consumption.
4. Synthesis of Results
Below, we present the complexity and non-linear behaviour of the challenges governing agri-food supply chains in developing countries through the respective causal loop diagram. In particular, we synthesise the literature results and we map the key challenges and their interrelations to structural elements of an agri-food supply chain.
System Description
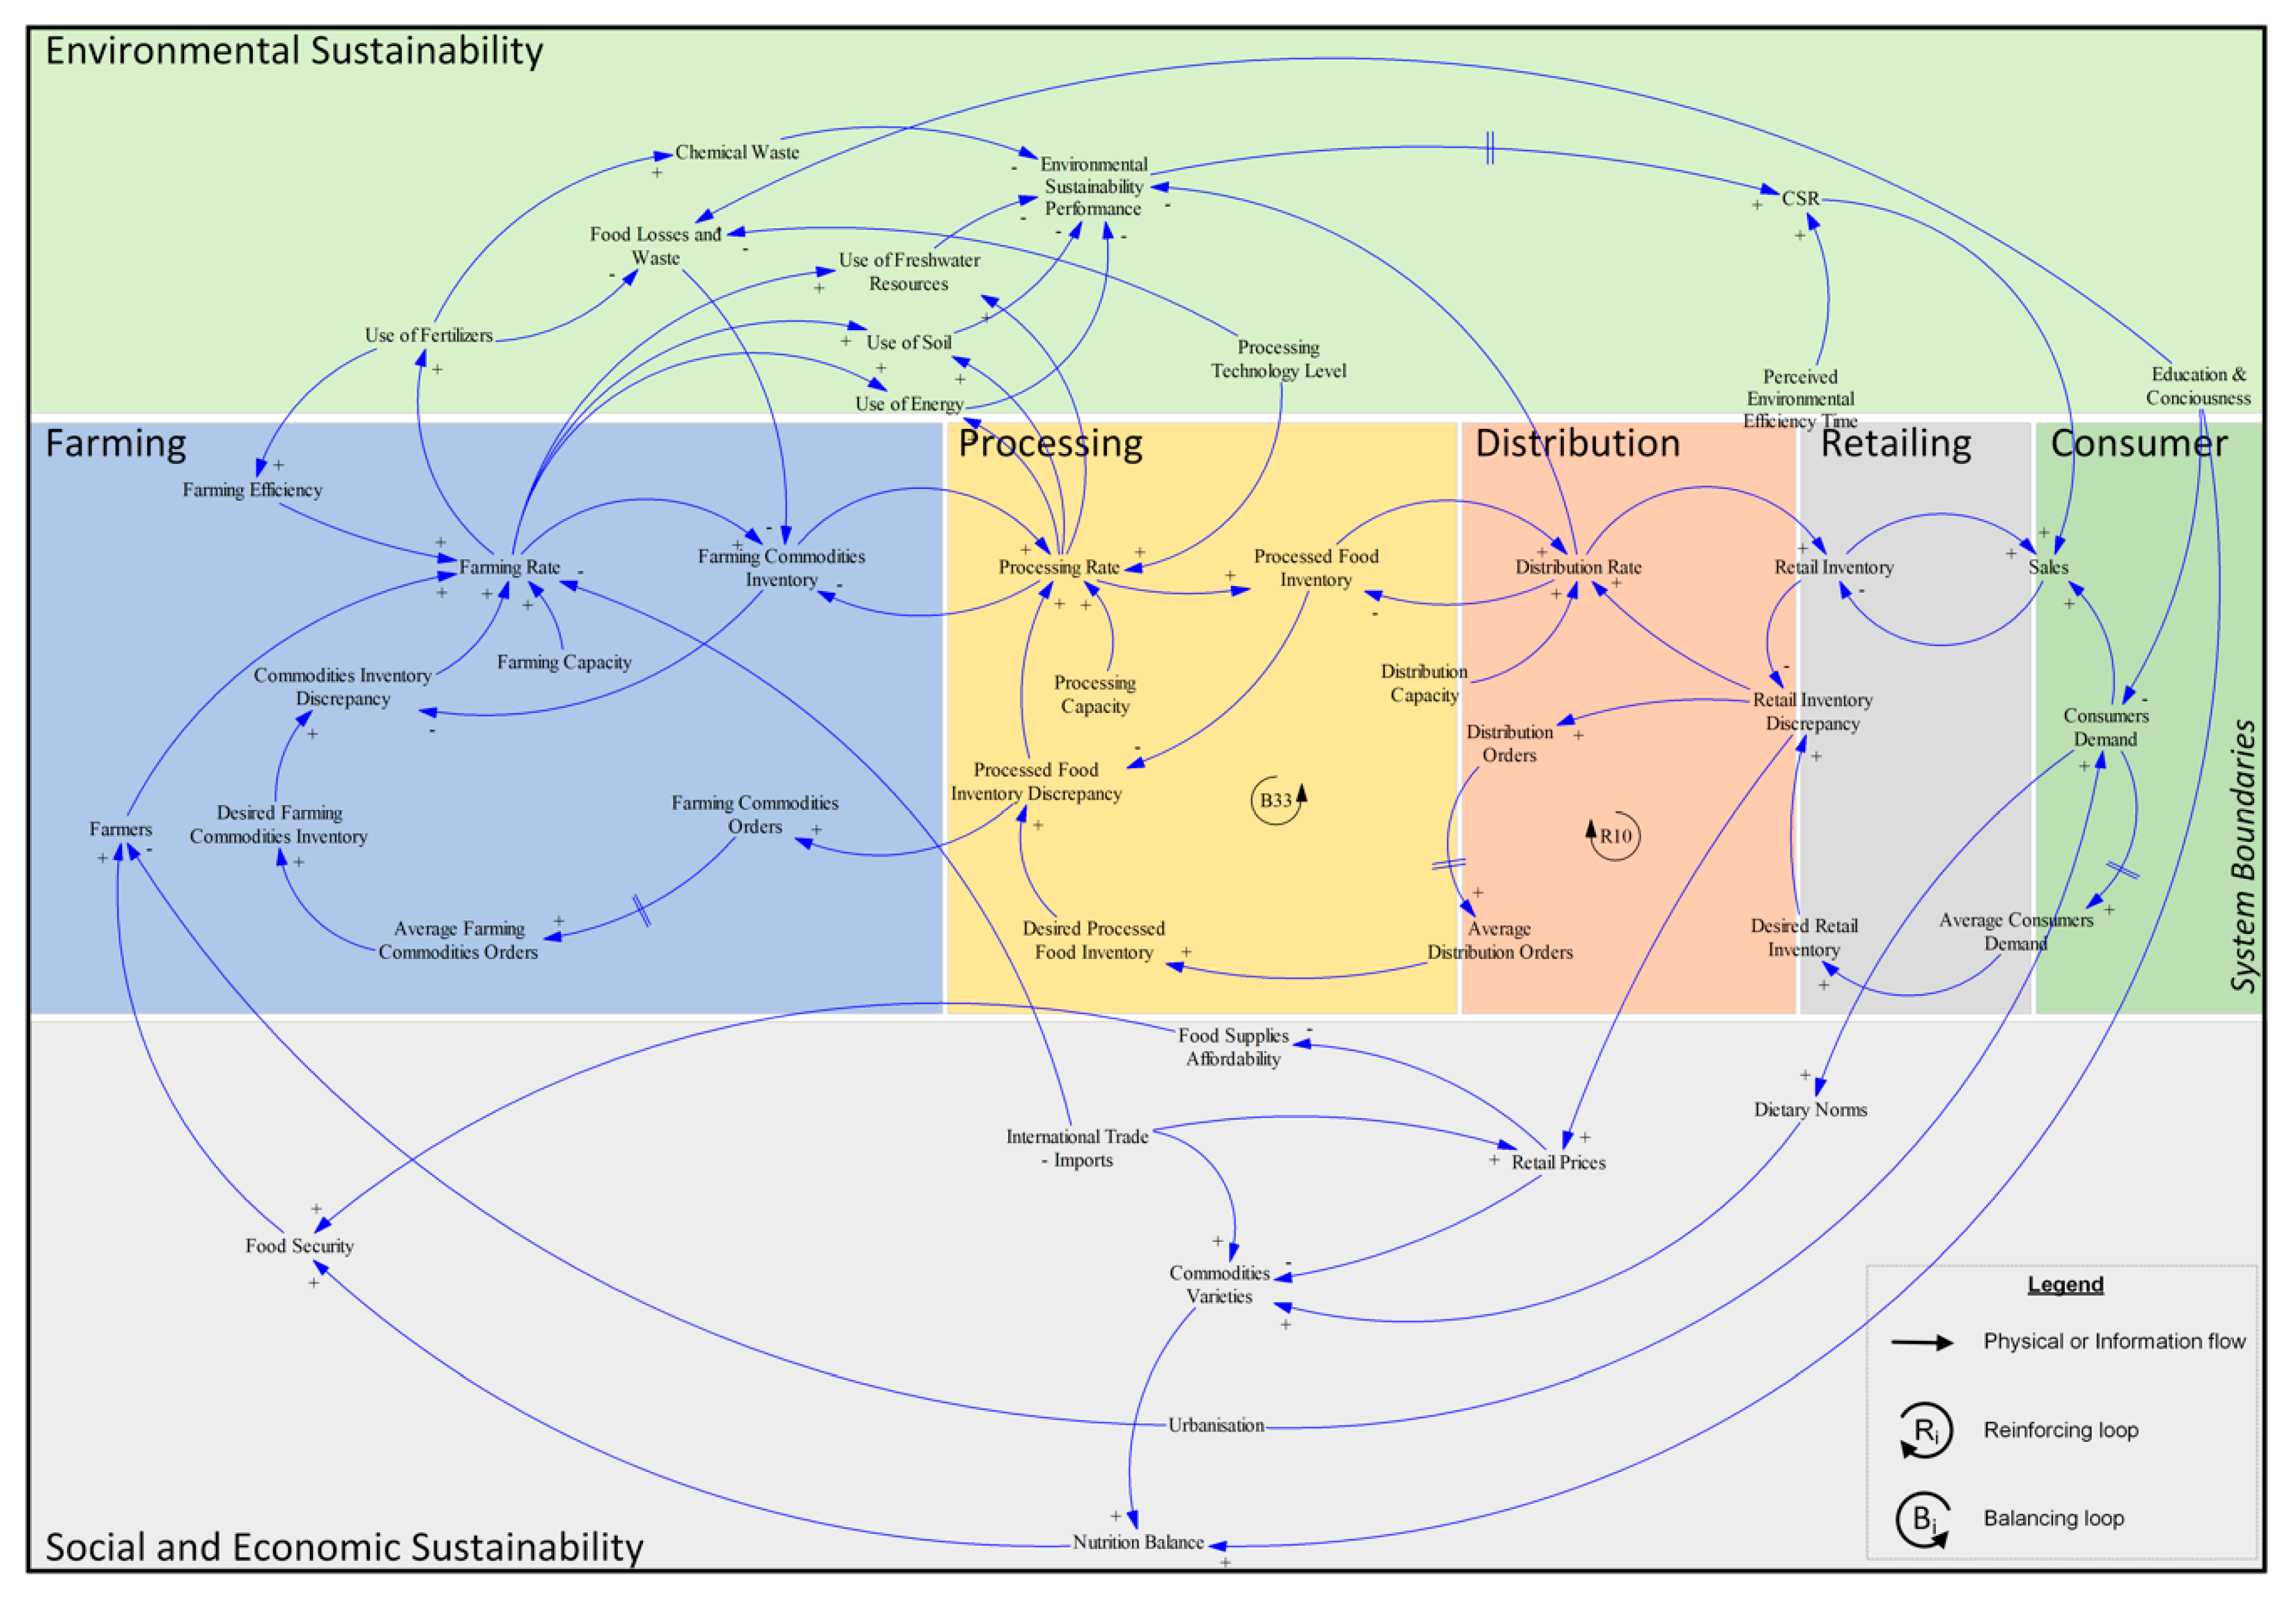
We consider an agri-food supply chain that consists of the following stages: (i) agricultural production, (ii) processing, (iii) distribution, (iv) wholesaling-retailing, and (v) consumption. Each stage accounts for sustainability in a variant degree. We identify a total of 78 feedback loops (described in detail in Appendix), which denote a sequence of causes and effects that circulate across each loop and impact a food sustainability related challenge [31]. Compared to the common traditional methodological approaches that have a static and free-of-feedback view of agri-food systems, SD allows us to capture the dynamic nature of the sustainability issue in the agri-food sector [32]. Overall, our mapping approach includes 29 reinforcing (denoted as R—Table A1 in Appendix) and 49 balancing (denoted as B—Table A2 in Appendix) loops.
Indicatively, in the reinforcing loop R10 (see Figure 1), an increased “Retail Inventory Discrepancy” results in higher “Retail Prices”. However, increased prices of food commodities reduce “Food Supplies Affordability”, which, in turn, reduces “Food Security”. Nevertheless, increased “Food Security” assists in sustaining the population of “Farmers”, which further supports an increased “Farming Rate” and high “Farming Commodities Inventory” levels. The availability of commodities can then sustain an enhanced “Processing Rate”, which increased the “Use of Freshwater Resources”. However, the appropriation of freshwater resources negatively impacts the “Environmental Sustainability Performance” of the respective supply system, which accordingly impacts “CSR” and “Sales”. In turn, enhanced “Sales” reduce “Retail Inventory”, which decreases the “Retail Inventory Discrepancy”.
Furthermore, in the balancing loop B33 (see Figure 1), as the “Retail Inventory Discrepancy” increases due to the difference between the market demand and the retailer’s inventory, enhanced “Distribution Orders” are placed to balance supply and demand. Thereafter, the “Average Distribution Orders”, which are the smoothed “Distribution Orders” over time due to the physical response limitations of the ordering system, are increased and, in turn, increase the “Desired Processed Food Inventory”. Augmented “Desired Processed Food Inventory” increases the “Processed Food Inventory Discrepancy”, which associates to greater “Farming Commodities Orders”. However, increased “Average Farming Commodities Orders” result in an elevated “Desired Farming Commodities Inventory”, which widens the agricultural “Commodities Inventory Discrepancy”. The greater this discrepancy, the more intense is the “Farming Rate”. Thus, an enhanced “Farming Rate” results in augmented “Farming Commodities Inventory”. The more the availability of commodities, the greater the “Processing Rate”, which results in greater “Use of Freshwater Resources”. The intensive appropriation of freshwater resources decreases the “Environmental Sustainability Performance” that negatively impacts “CSR (Corporate Social Responsibility)” and market “Sales” due to the environmental consciousness of consumers. Lower “Sales” have a minimal impact on the “Retail Inventory”, which results in a lower “Retail Inventory Discrepancy”.
The developed SD-based causal loop diagram imparts a better understanding of the enhanced complexity in sustainable agri-food supply chain management by capturing the dynamic relationships among natural resources’ appropriation, consumers’ social sensitivity in terms of food security, markets’ responsiveness towards commodities’ prices, and corporate social responsibility. At a greater extent, the provided causal loop diagram, in conjunction with any external sustainability goals and drivers at both corporate and institutional levels, assist the ex-ante assessment of the sustainability performance resulting from the potential implementation of digital technologies. In particular, Figure 1 could support business stakeholders in selecting appropriate digital technologies to tackle challenges across end-to-end agri-food supply chains. The selected technology-driven interventions should result in a balanced, yet optimum, nexus among environmental impact, economic effects, and social phenomena. Indicatively, the FAO and the International Telecommunication Union recognise the role of unmanned aerial systems to address the challenges of hunger, malnutrition, and counter the effects of climate change with further implications to prices and natural resources’ use [33].
5. Conclusions
There are many challenges in the agri-food sector toward resource efficiency, both in developed and developing countries. Several of these challenges refer to the same issues at a global level, e.g., energy-related concerns, yet others differ dramatically depending on the country’s status of (economic) development, e.g., water scarcity. Without any doubt, a key approach to tackle these challenges is by leveraging digital technologies not only from a practical and applied perspective but also from a policy-making angle.
The most essential challenges identified refer to: tackling hunger and malnutrition, sustainably improving productivity, reducing waste, and ensuring a sustainable natural resource base. However, the main contribution of this research is the comprehensive illustration of the complex interactions among the factors influencing these challenges within the agri-food system. The SD approach clearly demonstrates that every challenge requires a set of actions to be properly addressed due to numerous interdependencies among different processes and stakeholders. Investigating this topic by employing an end-to-end supply chain approach reveals that individual interventions in a single supply chain echelon or operation are highly unlikely to resolve any challenge.
Implications of our findings and, at the same time, suggestions for future research imply the quantification of the proposed SD causal loop, which employs data for high priority developing regions. Particular focus should be attributed to the modelling of the social sustainability parameters captured in the modelling approach and assess the behaviour and performance of the agri-food system toward potential interventions [34]. This shall initially validate the theoretical approach and then strengthen the impact of any interference derived from such an analysis. In a greater scale, this concept could be applied at a country (or even system of countries) level, leveraging digital technologies in feeding and processing enormous data-sets. Visualisations of alternative interventions would be an insightful tool for policy-makers.
Author Contributions
F.A. and J.S.S. conceived the general idea of the paper. N.T. designed the research methodology. N.T. and F.A. designed the model. All authors analysed and discussed the results. N.T. and F.A. wrote the paper.
Funding
This research has received funding from the BBSRC under Reference No. BB/P027970/1, Project Title: “Transforming India’s Green Revolution by Research and Empowerment for Sustainable food Supplies”.
Conflicts of Interest
The authors declare no conflict of interest.
Appendix A
Structure of Feedback Loops

Table A1.
Reinforcing loops.
| Feedback Loop | Causal Effect Sequence |
|---|---|
| Reinforcing R1 | Retail Inventory Discrepancy → Retail Prices → Food Supplies Affordability → Food Security → Farmers → Farming Rate → Use of Freshwater Resources → Environmental Sustainability Performance → CSR → Sales → Retail Inventory → Retail Inventory Discrepancy |
| Reinforcing R2 | Retail Inventory Discrepancy → Retail Prices → Food Supplies Affordability → Food Security → Farmers → Farming Rate → Use of Soil → Environmental Sustainability Performance → CSR → Sales → Retail Inventory → Retail Inventory Discrepancy |
| Reinforcing R3 | Retail Inventory Discrepancy → Retail Prices → Food Supplies Affordability → Food Security → Farmers → Farming Rate → Farming Commodities Inventory → Processing rate → Processed Food Inventory → Distribution Rate → Retail Inventory → Retail Inventory Discrepancy |
| Reinforcing R4 | Retail Inventory Discrepancy → Retail Prices → Food Supplies Affordability → Food Security → Farmers → Farming Rate → Use of Energy → Environmental Sustainability Performance → CSR → Sales → Retail Inventory → Retail Inventory Discrepancy |
| Reinforcing R5 | Retail Inventory Discrepancy → Retail Prices → Commodities Varieties → Nutrition Balance → Food Security → Farmers → Farming Rate → Use of Soil → Environmental Sustainability Performance → CSR → Sales → Retail Inventory → Retail Inventory Discrepancy |
| Reinforcing R6 | Retail Inventory Discrepancy → Retail Prices → Commodities Varieties → Nutrition Balance → Food Security → Farmers → Farming Rate → Farming Commodities Inventory → Processing Rate → Processed Food Inventory → Distribution Rate → Retail Inventory → Retail Inventory Discrepancy |
| Reinforcing R7 | Retail Inventory Discrepancy → Retail Prices → Commodities Varieties → Nutrition Balance → Food Security → Farmers → Farming Rate → Use of Freshwater Resources → Environmental Sustainability Performance → CSR → Sales → Retail Inventory → Retail Inventory Discrepancy |
| Reinforcing R8 | Retail Inventory Discrepancy → Retail Prices → Food Supplies Affordability → Food Security → Farmers → Farming Rate → Use of Fertilizers → Chemical Waste → Environmental Sustainability Performance → CSR → Sales → Retail Inventory → Retail Inventory Discrepancy |
| Reinforcing R9 | Retail Inventory Discrepancy → Retail Prices → Commodities Varieties → Nutrition Balance → Food Security → Farmers → Farming Rate → Use of Energy → Environmental Sustainability Performance → CSR → Sales → Retail Inventory → Retail Inventory Discrepancy |
| Reinforcing R10 | Retail Inventory Discrepancy → Retail Prices → Food Supplies Affordability → Food Security → Farmers → Farming Rate → Farming Commodities Inventory → Processing rate → Use of Freshwater Resources → Environmental Sustainability Performance → CSR → Sales → Retail Inventory → Retail Inventory Discrepancy |
| Reinforcing R11 | Retail Inventory Discrepancy → Retail Prices → Food Supplies Affordability → Food Security → Farmers → Farming Rate → Farming Commodities Inventory → Processing Rate → Use of Soil → Environmental Sustainability Performance → CSR → Sales → Retail Inventory → Retail Inventory Discrepancy |
| Reinforcing R12 | Retail Inventory Discrepancy → Retail Prices → Food Supplies Affordability → Food Security → Farmers → Farming Rate → Use of Fertilizers → Food Losses and Waste → Farming Commodities Inventory → Processing Rate → Processed Food Inventory → Distribution Rate → Retail Inventory → Retail Inventory Discrepancy |
| Reinforcing R13 | Retail Inventory Discrepancy → Retail Prices → Commodities Varieties → Nutrition Balance → Food Security → Farmers → Farming Rate → Use of Fertilizers → Chemical Waste → Environmental Sustainability Performance → CSR → Sales → Retail Inventory → Retail Inventory Discrepancy |
| Reinforcing R14 | Retail Inventory Discrepancy → Retail Prices → Food Supplies Affordability → Food Security → Farmers → Farming Rate → Farming Commodities Inventory → Processing Rate → Use of Energy → Environmental Sustainability Performance → CSR → Sales → Retail Inventory → Retail Inventory Discrepancy |
| Reinforcing R15 | Retail Inventory Discrepancy → Retail Prices → Commodities Varieties → Nutrition Balance → Food Security → Farmers → Farming Rate → Use of Fertilizers → Food Losses and Waste → Farming Commodities Inventory → Processing Rate → Processed Food Inventory → Distribution Rate → Retail Inventory → Retail Inventory Discrepancy |
| Reinforcing R16 | Retail Inventory Discrepancy → Retail Prices → Commodities Varieties → Nutrition Balance → Food Security → Farmers → Farming Rate → Farming Commodities Inventory → Processing Rate → Use of Freshwater Resources → Environmental Sustainability Performance → CSR → Sales → Retail Inventory → Retail Inventory Discrepancy |
| Reinforcing R17 | Retail Inventory Discrepancy → Retail Prices → Commodities Varieties → Nutrition Balance → Food Security → Farmers → Farming Rate → Farming Commodities Inventory → Processing Rate → Use of Energy → Environmental Sustainability Performance → CSR → Sales → Retail Inventory → Retail Inventory Discrepancy |
| Reinforcing R18 | Retail Inventory Discrepancy → Retail Prices → Food Supplies Affordability → Food Security → Farmers → Farming Rate → Farming Commodities Inventory → Processing Rate → Processed Food Inventory → Distribution Rate → Environmental Sustainability Performance → CSR → Sales → Retail Inventory → Retail Inventory Discrepancy |
| Reinforcing R19 | Retail Inventory Discrepancy → Retail Prices → Commodities Varieties → Nutrition Balance → Food Security → Farmers → Farming Rate → Farming Commodities Inventory → Processing Rate → Use of Soil → Environmental Sustainability Performance → CSR → Sales → Retail Inventory → Retail Inventory Discrepancy |
| Reinforcing R20 | Retail Inventory Discrepancy → Retail Prices → Commodities Varieties → Nutrition Balance → Food Security → Farmers → Farming Rate → Farming Commodities Inventory → Processing Rate → Processed Food Inventory → Distribution Rate → Environmental Sustainability Performance → CSR → Sales → Retail Inventory → Retail Inventory Discrepancy |
| Reinforcing R21 | Retail Inventory Discrepancy → Retail Prices → Food Supplies Affordability → Food Security → Farmers → Farming Rate → Use of Fertilizers → Food Losses and Waste → Farming Commodities Inventory → Processing Rate → Use of Energy → Environmental Sustainability Performance → CSR → Sales → Retail Inventory → Retail Inventory Discrepancy |
| Reinforcing R22 | Retail Inventory Discrepancy → Retail Prices → Food Supplies Affordability → Food Security → Farmers → Farming Rate → Use of Fertilizers → Food Losses and Waste → Farming Commodities Inventory → Processing Rate → Use of Soil → Environmental Sustainability Performance → CSR → Sales → Retail Inventory → Retail Inventory Discrepancy |
| Reinforcing R23 | Retail Inventory Discrepancy → Retail Prices → Food Supplies Affordability → Food Security → Farmers → Farming Rate → Use of Fertilizers → Food Losses and Waste → Farming Commodities Inventory → Processing Rate → Use of Freshwater Resources → Environmental Sustainability Performance → CSR → Sales → Retail Inventory → Retail Inventory Discrepancy |
| Reinforcing R24 | Retail Inventory Discrepancy → Retail Prices → Food Supplies Affordability → Food Security → Farmers → Farming Rate → Use of Fertilizers → Food Losses and Waste → Farming Commodities Inventory → Processing Rate → Processed Food Inventory → Distribution Rate → Environmental Sustainability Performance → CSR → Sales → Retail Inventory → Retail Inventory Discrepancy |
| Reinforcing R25 | Retail Inventory Discrepancy → Retail Prices → Commodities Varieties → Nutrition Balance → Food Security → Farmers → Farming Rate → Use of Fertilizers → Food Losses and Waste → Farming Commodities Inventory → Processing Rate → Use of Energy → Environmental Sustainability Performance → CSR → Sales → Retail Inventory → Retail Inventory Discrepancy |
| Reinforcing R26 | Retail Inventory Discrepancy → Retail Prices → Commodities Varieties → Nutrition Balance → Food Security → Farmers → Farming Rate → Use of Fertilizers → Food Losses and Waste → Farming Commodities Inventory → Processing Rate → Use of Freshwater Resources → Environmental Sustainability Performance → CSR → Sales → Retail Inventory → Retail Inventory Discrepancy |
| Reinforcing R27 | Retail Inventory Discrepancy → Retail Prices → Commodities Varieties → Nutrition Balance → Food Security → Farmers → Farming Rate → Use of Fertilizers → Food Losses and Waste → Farming Commodities Inventory → Processing Rate → Use of Soil → Environmental Sustainability Performance → CSR → Sales → Retail Inventory → Retail Inventory Discrepancy |
| Reinforcing R28 | Retail Inventory Discrepancy → Retail Prices → Commodities Varieties → Nutrition Balance → Food Security → Farmers → Farming Rate → Use of Fertilizers → Food Losses and Waste → Farming Commodities Inventory → Processing Rate → Processed Food Inventory → Distribution Rate → Environmental Sustainability Performance → CSR → Sales → Retail Inventory → Retail Inventory Discrepancy |
| Reinforcing R29 | Use of Fertilizers → Farming Efficiency → Farming Rate → Use of Fertilizers |
Table A2.
Balancing loops.
| Feedback Loop | Causal Effect Sequence |
|---|---|
| Balancing B1 | Retail Inventory Discrepancy → Distribution Rate → Retail Inventory → Retail Inventory Discrepancy |
| Balancing B2 | Retail Inventory Discrepancy → Distribution Rate → Environmental Sustainability Performance → CSR → Sales → Retail Inventory → Retail Inventory Discrepancy |
| Balancing B3 | Retail Inventory Discrepancy → Distribution Orders → Average Distribution Orders → Desired Processed Food Inventory → Processed Food Inventory Discrepancy → Processing Rate → Processed Food Inventory → Distribution Rate → Retail Inventory → Retail Inventory Discrepancy |
| Balancing B4 | Retail Inventory Discrepancy → Distribution Rate → Processed Food Inventory → Processed Food Inventory Discrepancy → Processing Rate → Use of Energy → Environmental Sustainability Performance → CSR → Sales → Retail Inventory → Retail Inventory Discrepancy |
| Balancing B5 | Retail Inventory Discrepancy → Distribution Rate → Processed Food Inventory → Processed Food Inventory Discrepancy → Processing Rate → Use of Soil → Environmental Sustainability Performance → CSR → Sales → Retail Inventory → Retail Inventory Discrepancy |
| Balancing B6 | Retail Inventory Discrepancy → Distribution Rate → Processed Food Inventory → Processed Food Inventory Discrepancy → Processing Rate → Use of Freshwater Resources → Environmental Sustainability Performance → CSR → Sales → Retail Inventory → Retail Inventory Discrepancy |
| Balancing B7 | Retail Inventory Discrepancy → Distribution Orders → Average Distribution Orders → Desired Processed Food Inventory → Processed Food Inventory Discrepancy → Processing Rate → Use of Freshwater Resources → Environmental Sustainability Performance → CSR → Sales → Retail Inventory → Retail Inventory Discrepancy |
| Balancing B8 | Retail Inventory Discrepancy → Distribution Orders → Average Distribution Orders → Desired Processed Food Inventory → Processed Food Inventory Discrepancy → Processing Rate → Use of Energy → Environmental Sustainability Performance → CSR → Sales → Retail Inventory → Retail Inventory Discrepancy |
| Balancing B9 | Retail Inventory Discrepancy → Distribution Orders → Average Distribution Orders → Desired Processed Food Inventory → Processed Food Inventory Discrepancy → Processing Rate → Use of Soil → Environmental Sustainability Performance → CSR → Sales → Retail Inventory → Retail Inventory Discrepancy |
| Balancing B10 | Retail Inventory Discrepancy → Distribution Orders → Average Distribution Orders → Desired Processed Food Inventory → Processed Food Inventory Discrepancy → Processing Rate → Processed Food Inventory → Distribution Rate → Environmental Sustainability Performance → CSR → Sales → Retail Inventory → Retail Inventory Discrepancy |
| Balancing B11 | Retail Inventory Discrepancy → Distribution Rate → Processed Food Inventory → Processed Food Inventory Discrepancy → Processing Rate → Farming Commodities Inventory → Commodities Inventory Discrepancy → Farming Rate → Use of Energy → Environmental Sustainability Performance → CSR → Sales → Retail Inventory → Retail Inventory Discrepancy |
| Balancing B12 | Retail Inventory Discrepancy → Distribution Rate → Processed Food Inventory → Processed Food Inventory Discrepancy → Processing Rate → Farming Commodities Inventory → Commodities Inventory Discrepancy → Farming Rate → Use of Soil → Environmental Sustainability Performance → CSR → Sales → Retail Inventory → Retail Inventory Discrepancy |
| Balancing B13 | Retail Inventory Discrepancy → Distribution Rate → Processed Food Inventory → Processed Food Inventory Discrepancy → Processing rate → Farming Commodities Inventory → Commodities Inventory Discrepancy → Farming Rate → Use of Freshwater Resources → Environmental Sustainability Performance → CSR → Sales → Retail Inventory → Retail Inventory Discrepancy |
| Balancing B14 | Retail Inventory Discrepancy → Distribution Orders → Average Distribution Orders → Desired Processed Food Inventory → Processed Food Inventory Discrepancy → Processing rate → Farming Commodities Inventory → Commodities Inventory Discrepancy → Farming Rate → Use of Energy → Environmental Sustainability Performance → CSR → Sales → Retail Inventory → Retail Inventory Discrepancy |
| Balancing B15 | Retail Inventory Discrepancy → Distribution Orders → Average Distribution Orders → Desired Processed Food Inventory → Processed Food Inventory Discrepancy → Processing rate → Farming Commodities Inventory → Commodities Inventory Discrepancy → Farming Rate → Use of Soil → Environmental Sustainability Performance → CSR → Sales → Retail Inventory → Retail Inventory Discrepancy |
| Balancing B16 | Retail Inventory Discrepancy → Distribution Rate → Processed Food Inventory → Processed Food Inventory Discrepancy → Farming Commodities Orders → Average Farming Commodities Orders → Desired Farming Commodities Inventory → Commodities Inventory Discrepancy → Farming Rate → Use of Soil → Environmental Sustainability Performance → CSR → Sales → Retail Inventory → Retail Inventory Discrepancy |
| Balancing B17 | Retail Inventory Discrepancy → Distribution Orders → Average Distribution Orders → Desired Processed Food Inventory → Processed Food Inventory Discrepancy → Processing Rate → Farming Commodities Inventory → Commodities Inventory Discrepancy → Farming Rate → Use of Freshwater Resources → Environmental Sustainability Performance → CSR → Sales → Retail Inventory → Retail Inventory Discrepancy |
| Balancing B18 | Retail Inventory Discrepancy → Distribution Rate → Processed Food Inventory → Processed Food Inventory Discrepancy → Farming Commodities Orders → Average Farming Commodities Orders → Desired Farming Commodities Inventory → Commodities Inventory Discrepancy → Farming Rate → Use of Freshwater Resources → Environmental Sustainability Performance → CSR → Sales → Retail Inventory → Retail Inventory Discrepancy |
| Balancing B19 | Retail Inventory Discrepancy → Distribution Rate → Processed Food Inventory → Processed Food Inventory Discrepancy → Processing Rate → Farming Commodities Inventory → Commodities Inventory Discrepancy → Farming Rate → Use of Fertilizers → Chemical Waste → Environmental Sustainability Performance → CSR → Sales → Retail Inventory → Retail Inventory Discrepancy |
| Balancing B20 | Retail Inventory Discrepancy → Distribution Rate → Processed Food Inventory → Processed Food Inventory Discrepancy → Farming Commodities Orders → Average Farming Commodities Orders → Desired Farming Commodities Inventory → Commodities Inventory Discrepancy → Farming Rate → Use of Energy → Environmental Sustainability Performance → CSR → Sales → Retail Inventory → Retail Inventory Discrepancy |
| Balancing B21 | Retail Inventory Discrepancy → Distribution Rate → Processed Food Inventory → Processed Food Inventory Discrepancy → Farming Commodities Orders → Average Farming Commodities Orders → Desired Farming Commodities Inventory → Commodities Inventory Discrepancy → Farming Rate → Use of Fertilizers → Chemical Waste → Environmental Sustainability Performance → CSR → Sales → Retail Inventory → Retail Inventory Discrepancy |
| Balancing B22 | Retail Inventory Discrepancy → Distribution Orders → Average Distribution Orders → Desired Processed Food Inventory → Processed Food Inventory Discrepancy → Farming Commodities Orders → Average Farming Commodities Orders → Desired Farming Commodities Inventory → Commodities Inventory Discrepancy → Farming Rate → Farming Commodities Inventory → Processing Rate → Processed Food Inventory → Distribution Rate → Retail Inventory → Retail Inventory Discrepancy |
| Balancing B23 | Retail Inventory Discrepancy → Distribution Orders → Average Distribution Orders → Desired Processed Food Inventory → Processed Food Inventory Discrepancy → Farming Commodities Orders → Average Farming Commodities Orders → Desired Farming Commodities Inventory → Commodities Inventory Discrepancy → Farming Rate → Use of Soil → Environmental Sustainability Performance → CSR → Sales → Retail Inventory → Retail Inventory Discrepancy |
| Balancing B24 | Retail Inventory Discrepancy → Distribution Orders → Average Distribution Orders → Desired Processed Food Inventory → Processed Food Inventory Discrepancy → Farming Commodities Orders → Average Farming Commodities Orders → Desired Farming Commodities Inventory → Commodities Inventory Discrepancy → Farming Rate → Use of Freshwater Resources → Environmental Sustainability Performance → CSR → Sales → Retail Inventory → Retail Inventory Discrepancy |
| Balancing B25 | Retail Inventory Discrepancy → Distribution Orders → Average Distribution Orders → Desired Processed Food Inventory → Processed Food Inventory Discrepancy → Farming Commodities Orders → Average Farming Commodities Orders → Desired Farming Commodities Inventory → Commodities Inventory Discrepancy → Farming Rate → Use of Energy → Environmental Sustainability Performance → CSR → Sales → Retail Inventory → Retail Inventory Discrepancy |
| Balancing B26 | Retail Inventory Discrepancy → Distribution Orders → Average Distribution Orders → Desired Processed Food Inventory → Processed Food Inventory Discrepancy → Processing Rate → Farming Commodities Inventory → Commodities Inventory Discrepancy → Farming Rate → Use of Fertilizers → Chemical Waste → Environmental Sustainability Performance → CSR → Sales → Retail Inventory → Retail Inventory Discrepancy |
| Balancing B27 | Retail Inventory Discrepancy → Distribution Rate → Processed Food Inventory → Processed Food Inventory Discrepancy → Farming Commodities Orders → Average Farming Commodities Orders → Desired Farming Commodities Inventory → Commodities Inventory Discrepancy → Farming Rate → Farming Commodities Inventory → Processing Rate → Use of Energy → Environmental Sustainability Performance → CSR → Sales → Retail Inventory → Retail Inventory Discrepancy |
| Balancing B28 | Retail Inventory Discrepancy → Distribution Rate → Processed Food Inventory → Processed Food Inventory Discrepancy → Farming Commodities Orders → Average Farming Commodities Orders → Desired Farming Commodities Inventory → Commodities Inventory Discrepancy → Farming Rate → Farming Commodities Inventory → Processing Rate → Use of Soil → Environmental Sustainability Performance → CSR → Sales → Retail Inventory → Retail Inventory Discrepancy |
| Balancing B29 | Retail Inventory Discrepancy → Distribution Rate → Processed Food Inventory → Processed Food Inventory Discrepancy → Farming Commodities Orders → Average Farming Commodities Orders → Desired Farming Commodities Inventory → Commodities Inventory Discrepancy → Farming Rate → Farming Commodities Inventory → Processing Rate → Use of Freshwater Resources → Environmental Sustainability Performance → CSR → Sales → Retail Inventory → Retail Inventory Discrepancy |
| Balancing B30 | Retail Inventory Discrepancy → Distribution Orders → Average Distribution Orders → Desired Processed Food Inventory → Processed Food Inventory Discrepancy → Farming Commodities Orders → Average Farming Commodities Orders → Desired Farming Commodities Inventory → Commodities Inventory Discrepancy → Farming Rate → Use of Fertilizers → Chemical Waste → Environmental Sustainability Performance → CSR → Sales → Retail Inventory → Retail Inventory Discrepancy |
| Balancing B31 | Retail Inventory Discrepancy → Distribution Orders → Average Distribution Orders → Desired Processed Food Inventory → Processed Food Inventory Discrepancy → Farming Commodities Orders → Average Farming Commodities Orders → Desired Farming Commodities Inventory → Commodities Inventory Discrepancy → Farming Rate → Farming Commodities Inventory → Processing Rate → Use of Soil → Environmental Sustainability Performance → CSR → Sales → Retail Inventory → Retail Inventory Discrepancy |
| Balancing B32 | Retail Inventory Discrepancy → Distribution Orders → Average Distribution Orders → Desired Processed Food Inventory → Processed Food Inventory Discrepancy → Farming Commodities Orders → Average Farming Commodities Orders → Desired Farming Commodities Inventory → Commodities Inventory Discrepancy → Farming Rate → Farming Commodities Inventory → Processing Rate → Use of Energy → Environmental Sustainability Performance → CSR → Sales → Retail Inventory → Retail Inventory Discrepancy |
| Balancing B33 | Retail Inventory Discrepancy → Distribution Orders → Average Distribution Orders → Desired Processed Food Inventory → Processed Food Inventory Discrepancy → Farming Commodities Orders → Average Farming Commodities Orders → Desired Farming Commodities Inventory → Commodities Inventory Discrepancy → Farming Rate → Farming Commodities Inventory → Processing Rate → Use of Freshwater Resources → Environmental Sustainability Performance → CSR → Sales → Retail Inventory → Retail Inventory Discrepancy |
| Balancing B34 | Retail Inventory Discrepancy → Distribution Orders → Average Distribution Orders → Desired Processed Food Inventory → Processed Food Inventory Discrepancy → Farming Commodities Orders → Average Farming Commodities Orders → Desired Farming Commodities Inventory → Commodities Inventory Discrepancy → Farming Rate → Use of Fertilizers → Food Losses and Waste → Farming Commodities Inventory → Processing Rate → Processed Food Inventory → Distribution Rate → Retail Inventory → Retail Inventory Discrepancy |
| Balancing B35 | Retail Inventory Discrepancy → Distribution Rate → Processed Food Inventory → Processed Food Inventory Discrepancy → Farming Commodities Orders → Average Farming Commodities Orders → Desired Farming Commodities Inventory → Commodities Inventory Discrepancy → Farming Rate → Use of Fertilizers → Food Losses and Waste → Farming Commodities Inventory → Processing Rate → Use of Freshwater Resources → Environmental Sustainability Performance → CSR → Sales → Retail Inventory → Retail Inventory Discrepancy |
| Balancing B36 | Retail Inventory Discrepancy → Distribution Rate → Processed Food Inventory → Processed Food Inventory Discrepancy → Farming Commodities Orders → Average Farming Commodities Orders → Desired Farming Commodities Inventory → Commodities Inventory Discrepancy → Farming Rate → Use of Fertilizers → Food Losses and Waste → Farming Commodities Inventory → Processing Rate → Use of Soil → Environmental Sustainability Performance → CSR → Sales → Retail Inventory → Retail Inventory Discrepancy |
| Balancing B37 | Retail Inventory Discrepancy → Distribution Rate → Processed Food Inventory → Processed Food Inventory Discrepancy → Farming Commodities Orders → Average Farming Commodities Orders → Desired Farming Commodities Inventory → Commodities Inventory Discrepancy → Farming Rate → Use of Fertilizers → Food Losses and Waste → Farming Commodities Inventory → Processing Rate → Use of Energy → Environmental Sustainability Performance → CSR → Sales → Retail Inventory → Retail Inventory Discrepancy |
| Balancing B38 | Retail Inventory Discrepancy → Distribution Orders → Average Distribution Orders → Desired Processed Food Inventory → Processed Food Inventory Discrepancy → Farming Commodities Orders → Average Farming Commodities Orders → Desired Farming Commodities Inventory → Commodities Inventory Discrepancy → Farming Rate → Farming Commodities Inventory → Processing Rate → Processed Food Inventory → Distribution Rate → Environmental Sustainability Performance → CSR → Sales → Retail Inventory → Retail Inventory Discrepancy |
| Balancing B39 | Retail Inventory Discrepancy → Distribution Orders → Average Distribution Orders → Desired Processed Food Inventory → Processed Food Inventory Discrepancy → Farming Commodities Orders → Average Farming Commodities Orders → Desired Farming Commodities Inventory → Commodities Inventory Discrepancy → Farming Rate → Use of Fertilizers → Food Losses and Waste → Farming Commodities Inventory → Processing Rate → Use of Soil → Environmental Sustainability Performance → CSR → Sales → Retail Inventory → Retail Inventory Discrepancy |
| Balancing B40 | Retail Inventory Discrepancy → Distribution Orders → Average Distribution Orders → Desired Processed Food Inventory → Processed Food Inventory Discrepancy → Farming Commodities Orders → Average Farming Commodities Orders → Desired Farming Commodities Inventory → Commodities Inventory Discrepancy → Farming Rate → Use of Fertilizers → Food Losses and Waste → Farming Commodities Inventory → Processing Rate → Use of Energy → Environmental Sustainability Performance → CSR → Sales → Retail Inventory → Retail Inventory Discrepancy |
| Balancing B41 | Retail Inventory Discrepancy → Distribution Orders → Average Distribution Orders → Desired Processed Food Inventory → Processed Food Inventory Discrepancy → Farming Commodities Orders → Average Farming Commodities Orders → Desired Farming Commodities Inventory → Commodities Inventory Discrepancy → Farming Rate → Use of Fertilizers → Food Losses and Waste → Farming Commodities Inventory → Processing Rate → Use of Freshwater Resources → Environmental Sustainability Performance → CSR → Sales → Retail Inventory → Retail Inventory Discrepancy |
| Balancing B42 | Retail Inventory Discrepancy → Distribution Orders → Average Distribution Orders → Desired Processed Food Inventory → Processed Food Inventory Discrepancy → Farming Commodities Orders → Average Farming Commodities Orders → Desired Farming Commodities Inventory → Commodities Inventory Discrepancy → Farming Rate → Use of Fertilizers → Food Losses and Waste → Farming Commodities Inventory → Processing Rate → Processed Food Inventory → Distribution Rate → Environmental Sustainability Performance → CSR → Sales → Retail Inventory → Retail Inventory Discrepancy |
| Balancing B43 | Use of Fertilizers → Food Losses and Waste → Farming Commodities Inventory → Commodities Inventory Discrepancy → Farming Rate → Use of Fertilizers |
| Balancing B44 | Use of Fertilizers → Food Losses and Waste → Farming Commodities Inventory → Processing Rate → Processed Food Inventory → Processed Food Inventory Discrepancy → Farming Commodities Orders → Average Farming Commodities Orders → Desired Farming Commodities Inventory → Commodities Inventory Discrepancy → Farming Rate → Use of Fertilizers |
| Balancing B45 | Distribution Rate → Processed Food Inventory → Distribution Rate |
| Balancing B46 | Retail Inventory → Sales → Retail Inventory |
| Balancing B47 | Farming Commodities Inventory → Processing Rate → Farming Commodities Inventory |
| Balancing B48 | Farming Commodities Inventory → Commodities Inventory Discrepancy → Farming Rate → Farming Commodities Inventory |
| Balancing B49 | Farming Commodities Inventory → Processing Rate → Processed Food Inventory → Processed Food Inventory Discrepancy → Farming Commodities Orders → Average Farming Commodities Orders → Desired Farming Commodities Inventory → Commodities Inventory Discrepancy → Farming Rate → Farming Commodities Inventory |
References
- Traitler, H.; Zilberman, D.; Heikes, K.; Petiard, V.; Dubois, M. Megatrends in Food and Agriculture: Technology, Water Use and Nutrition, 1st ed.; John Wiley & Sons Ltd.: Hoboken, NJ, USA, 2018. [Google Scholar]
- World Bank. World Development Report 2016: Digital Dividends; World Bank: Washington, DC, USA, 2016. [Google Scholar]
- Deichmann, U.; Goyal, A.; Mishra, D. Will Digital Technologies Transform Agriculture in Developing Countries? World Bank Group: Washington, DC, USA, 2016. [Google Scholar]
- OECD; FAO. OECD-FAO Agricultural Outlook 2018-2027; OECD Publishing: Paris, France; Rome, Italy, 2018. [Google Scholar]
- FAO. e-Agriculture Summary Discussion e-Forum on ICTs and Open Data in Agriculture and Nutrition; FAO: Rome, Italy, 2018. [Google Scholar]
- Lopez-Valeiras, E.; Gomez-Conde, J.; Naranjo-Gil, D. Sustainable innovation, management accounting and control systems, and international performance. Sustainability 2015, 7, 3479–3492. [Google Scholar] [CrossRef]
- Gomez-Conde, J.; Lopez-Valeiras, E. The dual role of management accounting and control systems in exports: Drivers and payoffs. Span. J. Financ. Account. 2018, 47, 307–328. [Google Scholar] [CrossRef]
- Garcia Osma, B.; Gomez-Conde, J.; de las Heras, E. Debt pressure and interactive use of control systems: Effects on cost of debt. Manag. Account. Res. 2018, 40, 27–46. [Google Scholar] [CrossRef]
- Jack, L.; Florez-Lopez, R.; Ramon-Jeronimo, J.M. Accounting, performance measurement and fairness in UK fresh produce supply networks. Account. Organ. Soc. 2018, 64, 17–30. [Google Scholar] [CrossRef]
- Forrester, J.W. Industrial Dynamics; MIT Press: Cambridge, MA, USA, 1961. [Google Scholar]
- Roberts, E.B. Managerial Applications of System Dynamics; MIT Press: Cambridge, MA, USA, 1978. [Google Scholar]
- Espinasse, B.; Ferrarini, A.; Lapeyre, R. A multi-agent system for modelisation and simulation-emulation of supply-chains. IFAC Proc. Vol. 2000, 33, 413–418. [Google Scholar] [CrossRef]
- Agovino, M.; Cerciello, M.; Gatto, A. Policy efficiency in the field of food sustainability. The adjusted food agriculture and nutrition index. J. Environ. Manag. 2018, 218, 220–233. [Google Scholar] [CrossRef] [PubMed]
- Brooks, J. Policy coherence and food security: The effects of OECD countries’ agricultural policies. Food Policy 2014, 44, 88–94. [Google Scholar] [CrossRef]
- Sterman, J. Business Dynamics: Systems Thinking and Modelling for a Complex World; McGraw-Hill Higher Education: Boston, MA, USA, 2000. [Google Scholar]
- Tsolakis, N.; Srai, J.S.; Aivazidou, E. Blue water footprint management in a UK poultry supply chain under environmental regulatory constraints. Sustainability 2018, 10, 625. [Google Scholar] [CrossRef]
- Aivazidou, E.; Tsolakis, N.; Vlachos, D.; Iakovou, E. A water footprint management framework for supply chains under green market behaviour. J. Clean. Prod. 2018, 197, 592–606. [Google Scholar] [CrossRef]
- Aker, J.C. Information from markets near and far: Mobile Phones and agricultural markets in Niger. Am. Econ. J. Appl. Econ. 2010, 2, 46–59. [Google Scholar] [CrossRef]
- Goyal, A. Information, direct access to farmers, and rural market performance in Central India. Am. Econ. J. Appl. Econ. 2010, 2, 22–45. [Google Scholar] [CrossRef]
- Fafchamps, M.; Minten, B. Impact of SMS-based agricultural information on Indian farmers. World Bank Econ. Rev. 2012, 26, 383–414. [Google Scholar] [CrossRef]
- Beuermann, D.W.; McKelvey, C.; Vakis, R. Mobile phones and economic development in rural Peru. J. Dev. Stud. 2012, 48, 1617–1628. [Google Scholar] [CrossRef]
- Cole, S.; Fernando, A.N. The Value of Advice: Evidence from Mobile Phone-Based Agricultural Extension; Working Paper 13-047; Harvard Business School: Boston, MA, USA, 2012. [Google Scholar]
- Dixie, G.; Jayaraman, N. Module 9: Strengthening Agricultural Marketing with ICT. In ICT in Agriculture: Connecting Smallholders to Knowledge, Networks, and Institutions; The International Bank for Reconstruction and Development/The World Bank; Agriculture and Rural Development: Washington, DC, USA, 2011; pp. 205–237. [Google Scholar]
- Jack, W.; Suri, T. Risk sharing and transactions costs: Evidence from Kenya’s mobile money revolution. Am. Econ. Rev. 2014, 104, 183–223. [Google Scholar] [CrossRef]
- OECD. Global Food Security: Challenges for the Food and Agricultural System; Organisation for Economic Co-operation and Development: Paris, France, 2013. [Google Scholar]
- FAO. The Future of Food and Agriculture—Trends and Challenges; Food and Agriculture Organization: Rome, Italy, 2017. [Google Scholar]
- Sasmal, J. Resources, Technology and Sustainability: An Analytical Perspective on Indian Agriculture; Springer: Singapore, 2016. [Google Scholar]
- FAO. The State of Food and Agriculture. Leveraging Food Systems for Inclusive Rural Transformation; Food and Agriculture Organization: Rome, Italy, 2017. [Google Scholar]
- Akkerman, R.; Farahani, P.; Grunow, M. Quality, safety and sustainability in food distribution: A review of quantitative operations management approaches and challenges. OR Spectrum 2010, 32, 863–904. [Google Scholar] [CrossRef]
- LeGrand, T. Overviews of Food Systems and Agro-Industry, Value Chains, and Food Loss and Waste in the Countries of Eastern Europe and Central Asia; Food and Agriculture Organization: Budapest, Hungary, 2018. [Google Scholar]
- Georgiadis, P.; Vlachos, D. The effect of environmental parameters on product recovery. Eur. J. Oper. Res. 2004, 157, 449–464. [Google Scholar] [CrossRef]
- Tsolakis, N.; Srai, J.S. A System Dynamics approach to food security through smallholder farming in the UK. Chem. Eng. Trans. 2017, 57, 2023–2028. [Google Scholar]
- FAO; ITU. E-Agriculture in Action: Drones for Agriculture; Food and Agriculture Organization; International Telecommunication Union: Bangkok, Thailand, 2017. [Google Scholar]
- Duman, G.M.; Taskaynatan, M.; Kongar, E.; Rosentrater, K.A. Integrating environmental and social sustainability into performance evaluation: A Balanced Scorecard-based Grey-DANP approach for the food industry. Front. Nutr. 2018, 5, 65. [Google Scholar] [CrossRef] [PubMed]
Figure 1.
System Dynamics—causal loop diagram.

Table 1.
“Production (Farming)” sustainability related challenges.
| # | Challenge | Sustainability | Source | ||
|---|---|---|---|---|---|
| En | Ec | So | |||
| 1 | Sustainably improving agricultural productivity to meet increasing demand | ● | ● | ● | [25,26] |
| 2 | Ensuring a sustainable natural resource base | ● | [27] | ||
| 3 | Mitigating hunger and all forms of malnutrition | ● | ● | [26] | |
| 4 | Making food systems more efficient, inclusive, and resilient | ● | ● | ● | [26] |
| 5 | Ensuring flexible agriculture: the industry responds to the real needs of people | ● | ● | [1] | |
| 6 | Producing more with less while preserving and enhancing the livelihoods of farmers | ● | ● | [28] | |
| 7 | Promoting industrialisation in late-transforming countries | ● | [28] | ||
Symbols: “En” for Environmental; “Ec” for Economic; “So” for Social.
Table 2.
“Processing-Manufacturing” sustainability related challenges.
| # | Challenge | Sustainability | Source | ||
|---|---|---|---|---|---|
| En | Ec | So | |||
| 1 | Reducing end-to-end supply chain losses and waste | ● | ● | [25] | |
| 2 | Promoting industrialisation in most developing countries | ● | ● | [28] | |
| 3 | Making food systems more efficient, inclusive, and resilient | ● | ● | ● | [26] |
| 4 | Ensuring nutrient balance for all: everyone should have access to a balanced diet | ● | ● | [1] | |
| 5 | Making more efficient use of scarce water and energy resources | ● | [25] | ||
| 6 | Lacking essential infrastructure–electrical power grids, storage, cold supply chain facilities | ● | [28] | ||
Symbols: “En” for Environmental. “Ec” for Economic. “So” for Social.
Table 3.
“Distribution (Transportation-Logistics)” sustainability related challenges.
| # | Challenge | Sustainability | Source | ||
|---|---|---|---|---|---|
| En | Ec | So | |||
| 1 | Making food systems more efficient, inclusive, and resilient | ● | ● | ● | [26,29] |
| 2 | Ensuring access to adequate food supplies for everyone | ● | ● | [1] | |
| 3 | Lacking essential infrastructure–rural roads, refrigerated transportation | ● | [28] | ||
| 4 | Connecting rural producers with logistics centers–closer links between buyers and sellers through innovative logistics | ● | ● | [3,29,30] | |
Symbols: “En” for Environmental. “Ec” for Economic. “So” for Social.
Table 4.
“Wholesaling-Retailing (Trade)” sustainability related challenges.
| # | Challenge | Sustainability | Source | ||
|---|---|---|---|---|---|
| En | Ec | So | |||
| 1 | Ensuring food affordability: food raw materials can be afforded by every individual | ● | ● | [1,22] | |
| 2 | Eradicating extreme poverty and reducing inequality | ● | ● | [23] | |
| 3 | Reducing end-to-end supply chain losses and waste | ● | ● | [22] | |
| 4 | Ensuring food security and safety | ● | ● | ● | [1] |
| 5 | Eliminating domestic production (farming) constraints imposed by imports | ● | ● | [23] | |
Symbols: “En” for Environmental. “Ec” for Economic. “So” for Social.
Table 5.
“Consumption” sustainability related challenges.
| # | Challenge | Sustainability | Source | ||
|---|---|---|---|---|---|
| En | Ec | So | |||
| 1 | Securing nutrient balance for all: everyone should have access to a balanced diet | ● | ● | [1] | |
| 2 | Enhancing understanding over the relationship between food and health: nutrition understood and lived | ● | ● | [1] | |
| 3 | Reducing end-to-end supply chain losses and waste | ● | ● | [25] | |
| 4 | Tackling issues related to global food availability, tighter world markets, higher prices, and food access | ● | ● | [25] | |
| 5 | Accommodating changing dietary patterns | ● | ● | [28] | |
Symbols: “En” for Environmental. “Ec” for Economic. “So” for Social.
© 2018 by the authors. Licensee MDPI, Basel, Switzerland. This article is an open access article distributed under the terms and conditions of the Creative Commons Attribution (CC BY) license (http://creativecommons.org/licenses/by/4.0/).
Share and Cite
MDPI and ACS Style
Anastasiadis, F.; Tsolakis, N.; Srai, J.S. Digital Technologies Towards Resource Efficiency in the Agrifood Sector: Key Challenges in Developing Countries. Sustainability 2018, 10, 4850. https://0-doi-org.brum.beds.ac.uk/10.3390/su10124850
AMA Style
Anastasiadis F, Tsolakis N, Srai JS. Digital Technologies Towards Resource Efficiency in the Agrifood Sector: Key Challenges in Developing Countries. Sustainability. 2018; 10(12):4850. https://0-doi-org.brum.beds.ac.uk/10.3390/su10124850
Chicago/Turabian StyleAnastasiadis, Foivos, Naoum Tsolakis, and Jagjit Singh Srai. 2018. "Digital Technologies Towards Resource Efficiency in the Agrifood Sector: Key Challenges in Developing Countries" Sustainability 10, no. 12: 4850. https://0-doi-org.brum.beds.ac.uk/10.3390/su10124850
Note that from the first issue of 2016, this journal uses article numbers instead of page numbers. See further details here.