Article

Heating and Cooling Performance of Office Buildings with a-Si BIPV Windows Considering Operating Conditions in Temperate Climates: The Case of Korea

1
Department of Energy Systems Engineering, Seoul National University, 1 Gwanak-ro, Gwanak-gu, Seoul 08826, Korea
2
Department of Architectural Engineering, Hanbat National University, 125 Dongsuh-daero, Yoosung-gu, Daejeon 34158, Korea
3
R&D Lab, Kolon Global Co., 32 Songdogwahak-ro, Yeonsu-gu, Incheon 21984, Korea
*
Author to whom correspondence should be addressed.
Sustainability 2018, 10(12), 4856; https://0-doi-org.brum.beds.ac.uk/10.3390/su10124856
Submission received: 18 November 2018 / Revised: 14 December 2018 / Accepted: 15 December 2018 / Published: 19 December 2018

Abstract

:
This study analyzed the heating and cooling performance of an office building in Daegu, Korea, equipped with amorphous-Si (a-Si) building-integrated photovoltaic (BIPV) windows. EnergyPlus was used to simulate and compare the heating and cooling loads of models for clear glass double-layer, heat-absorbing glass double-layer, and low-emissivity (low-e) glass double-layer windows. In addition, the impact of changes in building operation time, temperature settings, air infiltration from the entrances, and internal load were also analyzed as these all have a large impact on heating and cooling loads. Finally, three types of heating and cooling equipment were tested, and their power and primary energy consumption analyzed, to determine the actual energy used. Under baseline conditions, there was an 18.2% reduction in heating and cooling loads when the BIPV model was used compared to when the clear glass double-layer window was used. In addition, increases in temperature settings and air infiltration from the entrances had a negative effect on the reduction of the heating and cooling loads demonstrating a need for intensive management of these features if a-Si BIPV windows are installed in a building.

1. Introduction

Saving energy in buildings and an increase in the use of renewable energy are being promoted worldwide as measures to combat climate change [1]. Korea has enacted a policy that makes it mandatory for buildings to be zero-energy by 2025, spurring active research into the component technologies of these kinds of buildings [2].
Zero-energy buildings minimize energy consumption and convert any remaining energy from fossil fuels to renewable energy annually [3]. A building’s energy consumption differs according to climatic conditions and the its purpose, design specifications, and operating conditions [4]. Therefore, to minimize energy consumption in buildings, various new technologies, including highly efficient equipment, are being developed to improve building components such as insulation, airtightness, and solar control and research on integrated economic design techniques is underway [5]. Renewable energy sources for buildings include biomass, geothermal, solar, and wind power there have been proposals to develop and apply technology to convert these energy sources into those suitable for local needs [6].
Among these, building-integrated photovoltaic (BIPV) technology has attracted attention for its ability to reduce energy consumption and generate renewable energy simultaneously [7]. BIPV differs from building-attached photovoltaic (BAPV) technology that replaces the exterior material of a building [8]. The former generates power and has a large influence on how a building is cooled, heated, and lit [9]. BIPV components can be classified as roof, outer wall, window, and shading types depending on their shape and purpose of installation. BIPV windows, in particular, have thermal and optical properties that differ from those of conventional windows and thus have a great impact on building energy consumption [10].
BIPV technologies and products are currently in active development [11]. In addition, various studies are being conducted on their effects on energy generation and energy consumption in buildings based on their application [12]. Their power generation efficiency and energy impacts have been analyzed according to inclined angle, direction, and installation location [13,14]. Energy consumption vary largely in buildings, depending on their purpose and the climate of the region where they are located; these factors have also been analyzed [15]. In Singapore, which has a tropical climate, micromorphic silicon (μc-Si) BIPV windows are more economical than conventional windows relative to power generation, lighting, and reducing energy spent on cooling [16]. In the United Arab Emirates (UAE), BIPV windows are installed in outer walls to reduce the cooling load by at least three times the power generation [17]. In the United States, the results of a simulation in which amorphous-Si BIPV (a-Si BIPV) windows were used in buildings in six cities with different climate conditions showed that the energy used for heating and cooling was largely reduced in a cooling dominant regions. However, heating and cooling energy consumption increased in heating dominant regions [18]. Analysis of energy reduction via the use of BIPV windows have also been applied to the atria of university buildings in the United Kingdom [19]. In Brazil, BIPV windows were applied in different regions and the generation performance and the impact of building heating and cooling were analyzed [20]. A method by which to analyze overall energy performance based on EnergyPlus simulation of the application of semitransparent photovoltaic (STPV) technology in the region of Hong Kong was proposed; the feasibility of this analysis was proved by comparing it with other windows [21,22]. The effect was analyzed by using the Energy Balance Index (EBI), which comprehensively analyzes changes in power generation, heating and cooling, and lighting energy consumption based on the optical properties of four types of Si PVs with different light transmittance levels [23]. In addition, the effect of direction of installation was analyzed by comparing an a-Si PV and a dye-sensitized solar module (DSM) with reference glass (RG), based on the window standards used in different regions of Italy [24]. The effect of a-Si BIPV with different light transmittance levels in different building design conditions such as room depth, room height, room width, window height, and window-to-wall ratio (WWR) under the climatic conditions in central region of China was also analyzed [25]. These studies conducted their analyses by comparing the type of STPV used, climate conditions, and change in building design conditions with RG. Their results showed the effect of saving heating/cooling energy from application of STPV technology in a climate and under design conditions that mostly required cooling.
As a peninsula located at the intersection of the Asian continent and the Pacific Ocean, Korea is in a temperate climate zone and consumes a high amount of energy for both heating and cooling [26]. Given existing research, the effects of applying BIPV windows in Korea are expected to vary according to the design and operating conditions of particular buildings.
Accordingly, this study simulated a case in which a-Si BIPV windows were installed at an office building in Daegu, Korea, to investigate the differences caused to the heating and cooling loads by changes in building operating conditions when different types of windows were installed. The models used for comparison included those based on clear, heat-absorbing (tinted), and low-emissivity (low-e) glass windows. In addition, the main operating conditions that affected heating and cooling loads were set as variables for operating time, temperature settings, air infiltration from entrances, and internal loads, thus following previous research [27]. This study also included an interview with a building operations manager.
The purpose of this study was to compare the impacts of a-Si BIPV windows in office buildings with those of office buildings using other windows, and to use this data to analyze the characteristics of heating and cooling loads and evaluate how reductions therein varied according to building operating conditions. In addition, the data from this study could serve as baselines for proper operations management for cases in which a-Si BIPV windows are applied to office buildings in temperate climates.

2. Materials and Methods

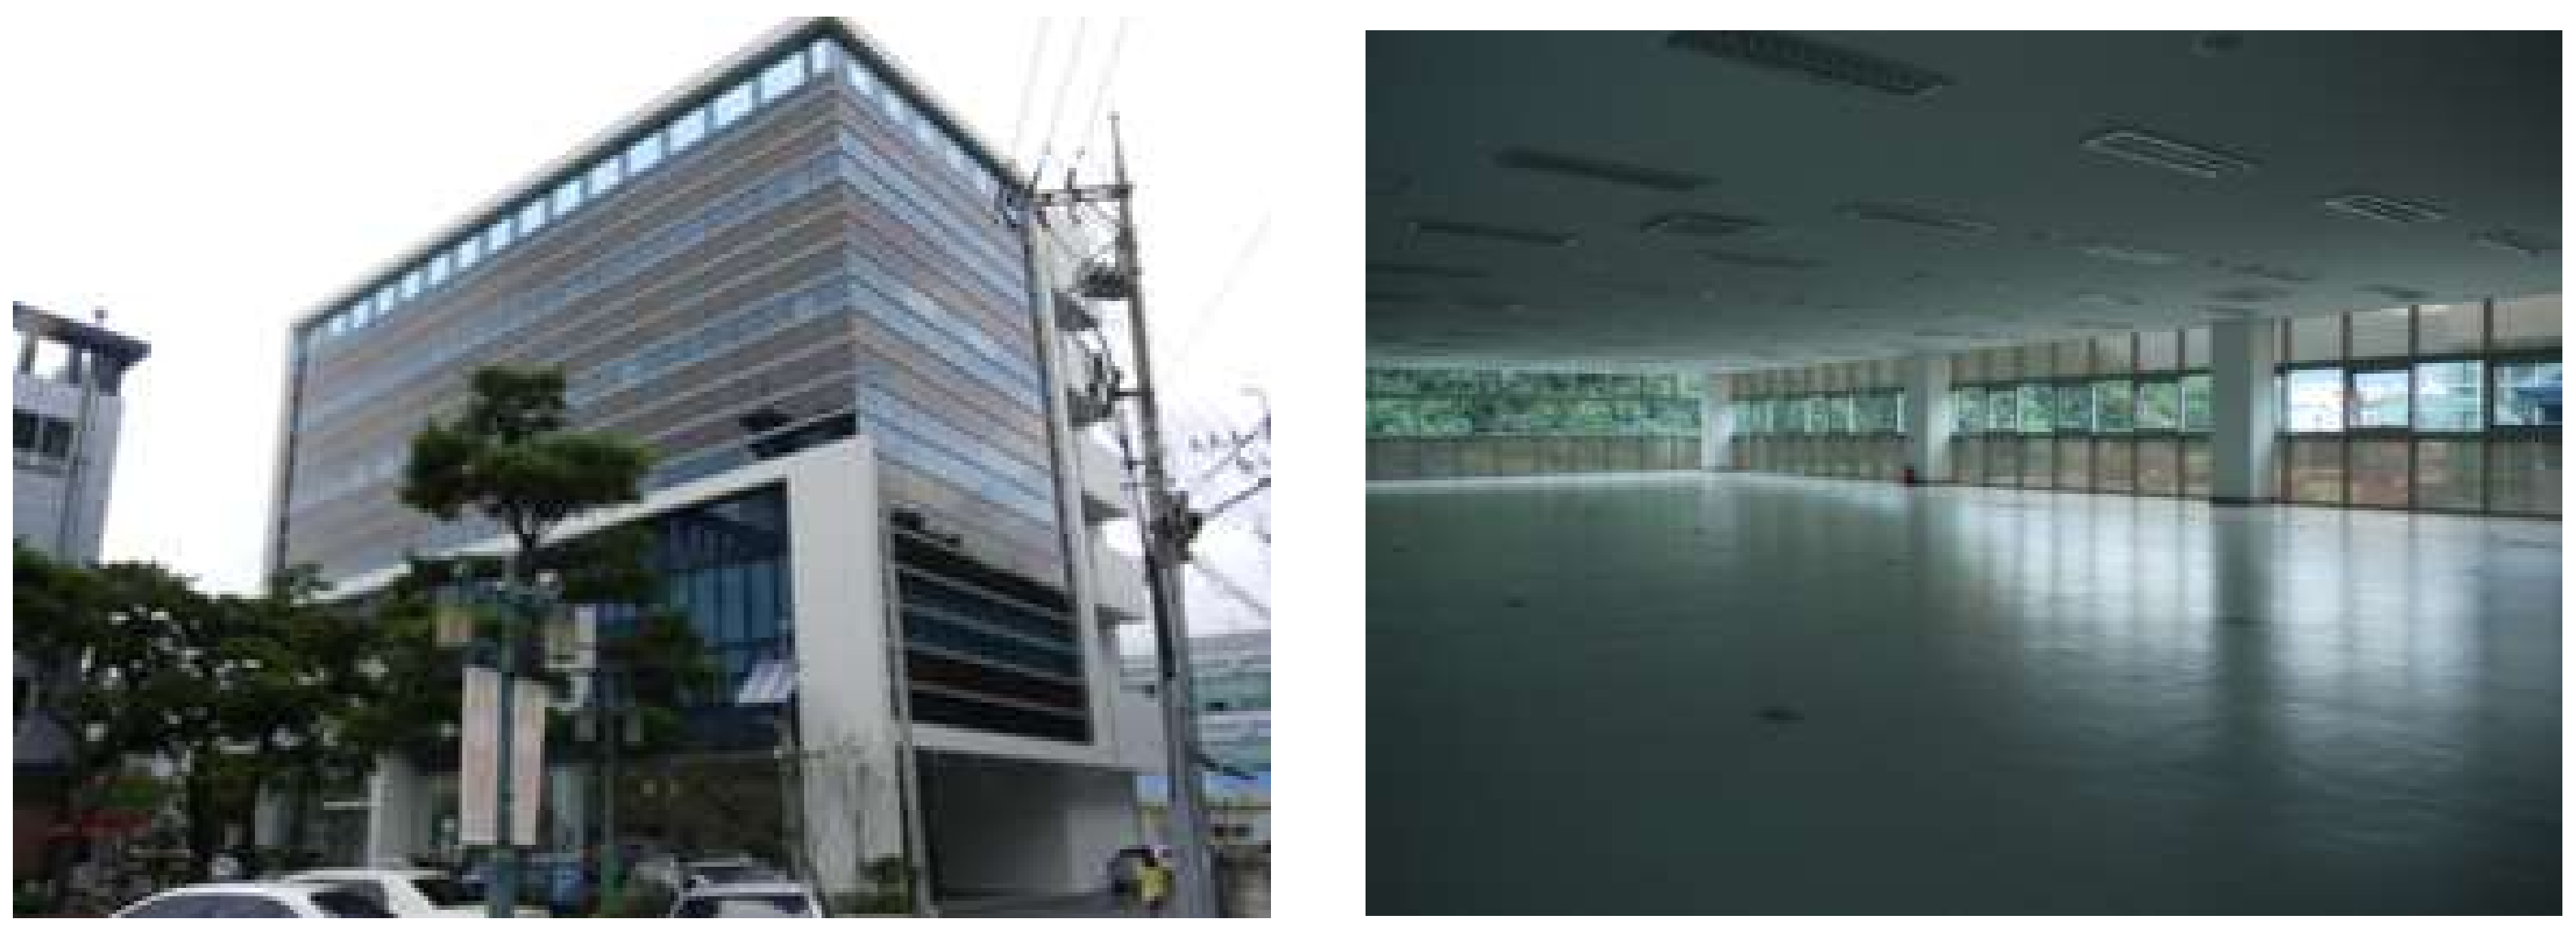
2.1. Office Building with Amorphous-Si (a-Si) BIPV Windows

The building used in this study is a small-scale office building with one underground floor and five floors above ground. Floors 1–2 are exhibition spaces used for selling automobiles, whereas floors 3–5 are office spaces for various businesses [28].
This building has a curtain wall exterior. To reduce the heating and cooling loads, the west, north, and a part of the east side of the building were designed as insulated walls, whereas windows were installed on the south and east sides of the office spaces to provide daylight and a view. The installed windows combine a double layer of a-Si PVs and a double layer of clear glass. As a BIPV window is less than 10% transparent, clear glass double-layer windows were installed in some areas to provide daylight and views (Figure 1).
As shown in Figure 1, the building includes windows consisting of four layers; on each floor, one (two) layer(s) of clear glass windows were installed on the south (east) side.
The a-Si windows installed are translucent; an a-Si photovoltaic module with an output of 44 Wp was fabricated as a multilayer module with a configuration of 27 mm, including a 10 mm a-Si laminated module, 12 mm of air, and 5 mm of clear glass. The specifications and generation performance of the a-Si module applied have been described in previous studies [29,30,31].
The specifications and standards of the applied a-Si module, fabricated by Kaneka in Japan, are shown in Figure 2. Further building specifications are given in Table 1. Of the total area of each of the third to fifth floors that are the subject of this study, the public zone consists of a non-air-conditioned area of bathrooms, corridors, and stairs while the office zone is air-conditioned area. The floor plans of floors 3–5 are shown in Figure 3.

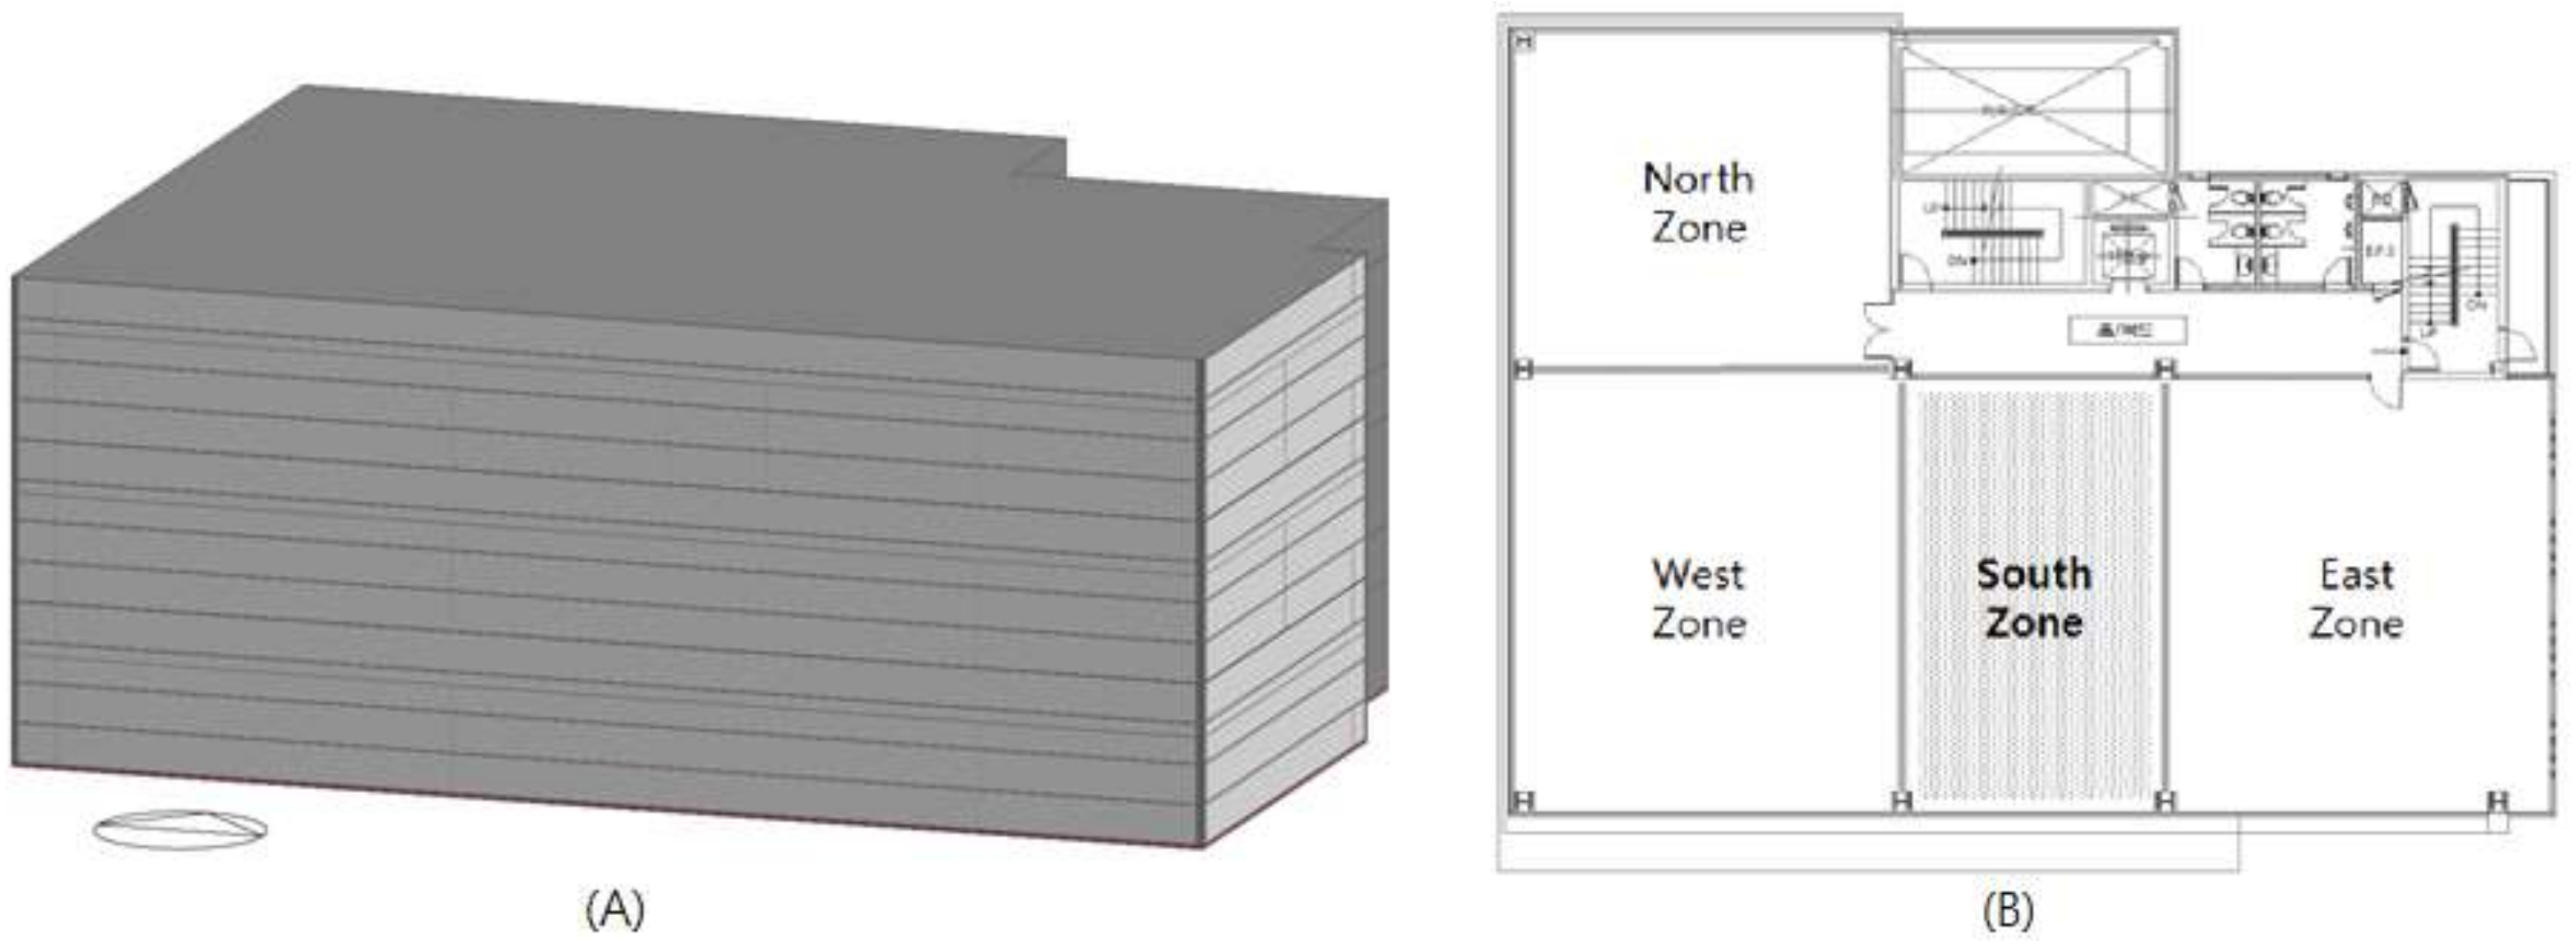
2.2. Building Model for Simulation

EnergyPlus 8.6, a dynamic energy analysis program developed by the U.S. Department of Energy, was used to analyze the heating and cooling performance of the building. EnergyPlus uses a heat balance equation to analyze heat transfer and energy consumption, and also reflects the detailed properties of a window to enable analysis of its transfer and consumption of energy [32]. It also used hourly climate data for the period of simulation, which was January to December 2014. The climate data was taken from the Korea Meteorological Administration and converted into the type of input file required by EnergyPlus.
The analysis was based on a simulation of floors 3–5 of the building, on which BIPV windows were installed to investigate their effects. The southern and eastern BIPV windows in the simulation model reflected the actual building design conditions. The western and northern envelopes were designed insulated walls (Table 2). In addition, adiabatic conditions were set for the third floor. The heating and cooling loads were calculated using IdealLoadAirSystem, which measures these factors without considering the efficiency of the equipment used. Figure 3 shows the building model used for simulation.
The internal loads, which play a major role in the energy consumption of office buildings, were determined by comparing the specifications of the equipment installed in the building with actual electricity consumption and by confirming the number of occupants of the building (Table 3).
The clear glass, heat-absorbing glass, and low-e glass window models were then applied and compared. All the glass, except that including the a-Si module, was 6 mm thick, according to the International Glazing Database (IGDB), whereas the double-layer window contained a 12 mm layer of air. The results of previous studies were used in the specifications of the a-Si module [28].
The thermal and optical properties of the selected glass materials, including those of the double-layer window obtained from the calculation in EnergyPlus [33], are shown in the Table 4. For the a-Si windows, the 6 mm clear glass used based on IGDB guidelines for double layering was slightly different from that used in the actual building, which was 5 mm thick.
The ASI28 and CL24 windows were combined for the BIPV model applied to the actual building. The values of the CL24 and ASI28 windows were also applied in the simulation, each to their respective window layers in the BIPV model, and analyzed (Table 5).
To select the building operating conditions for the simulation, we reviewed studies in the literature [27,34,35] and conducted interviews with building operation managers.
Floors 3–5 of the building were leased to various business, such as an insurance sales firm, a city gas utility management company, a construction firm, and an automobile sales company. Even when an electric heat pump (EHP) was used for heating and cooling, each office freely set their own operation times and temperatures without a central control system. In addition, the power usage was measured collectively rather than by individual offices, and the usage was distributed according to the number of employees for each company. This led to excessive heating and cooling.
Moreover, because most of the companies in the building were engaged in both sales and customer service, customers and employees were entering and exiting frequently. Without a design to reduce air infiltration from entrances such as revolving doors, vestibules, or air curtains, air infiltration from the entrances has a significant impact. The light and equipment power density in this building are 4 W/m2 and 6 W/m2, respectively, which is lower than that for other office buildings [34].
With these building properties under consideration, the operation time, temperature settings, air infiltration, and internal loads were selected as the variables for the operating conditions, and the consumption of energy for heating and cooling was analyzed based on these (Table 6).
Air infiltration from entrance doors was assumed to occur during operation times. Constant infiltration through the exterior walls or windows was determined to be 0.5 air changes per hour (ACH) based on the literature [27].
The operation time and heating and cooling temperature settings were selected based on the general case in Korean office buildings. The following values were selected as baseline operating conditions. Operation time from 09:00–18:00 local time (9 h); heating and cooling temperature settings of 26 °C and 20 °C, respectively; air infiltration from entrance doors of 0.5 ACH; light/equipment load of 10 W/m2; and occupancy of 0.11 persons/m2. The changes in annual heating and cooling loads were analyzed according to the changes in each of these variables.
The heating and cooling loads of the window models were first compared to the baseline operating conditions in the simulation. Next, the variations in heating and cooling loads according to changes in each operating condition variable in the baseline operation combination were examined.
Following this, mixed combination cases were created in addition to the base combination; the heating and cooling energy reduction effect of the a-Si BIPV window was examined using these cases.
Finally, the actual energy consumption for heating and cooling was compared to the primary energy consumption when several different types of heating and cooling equipment were used in the building.

3. Results and Discussion

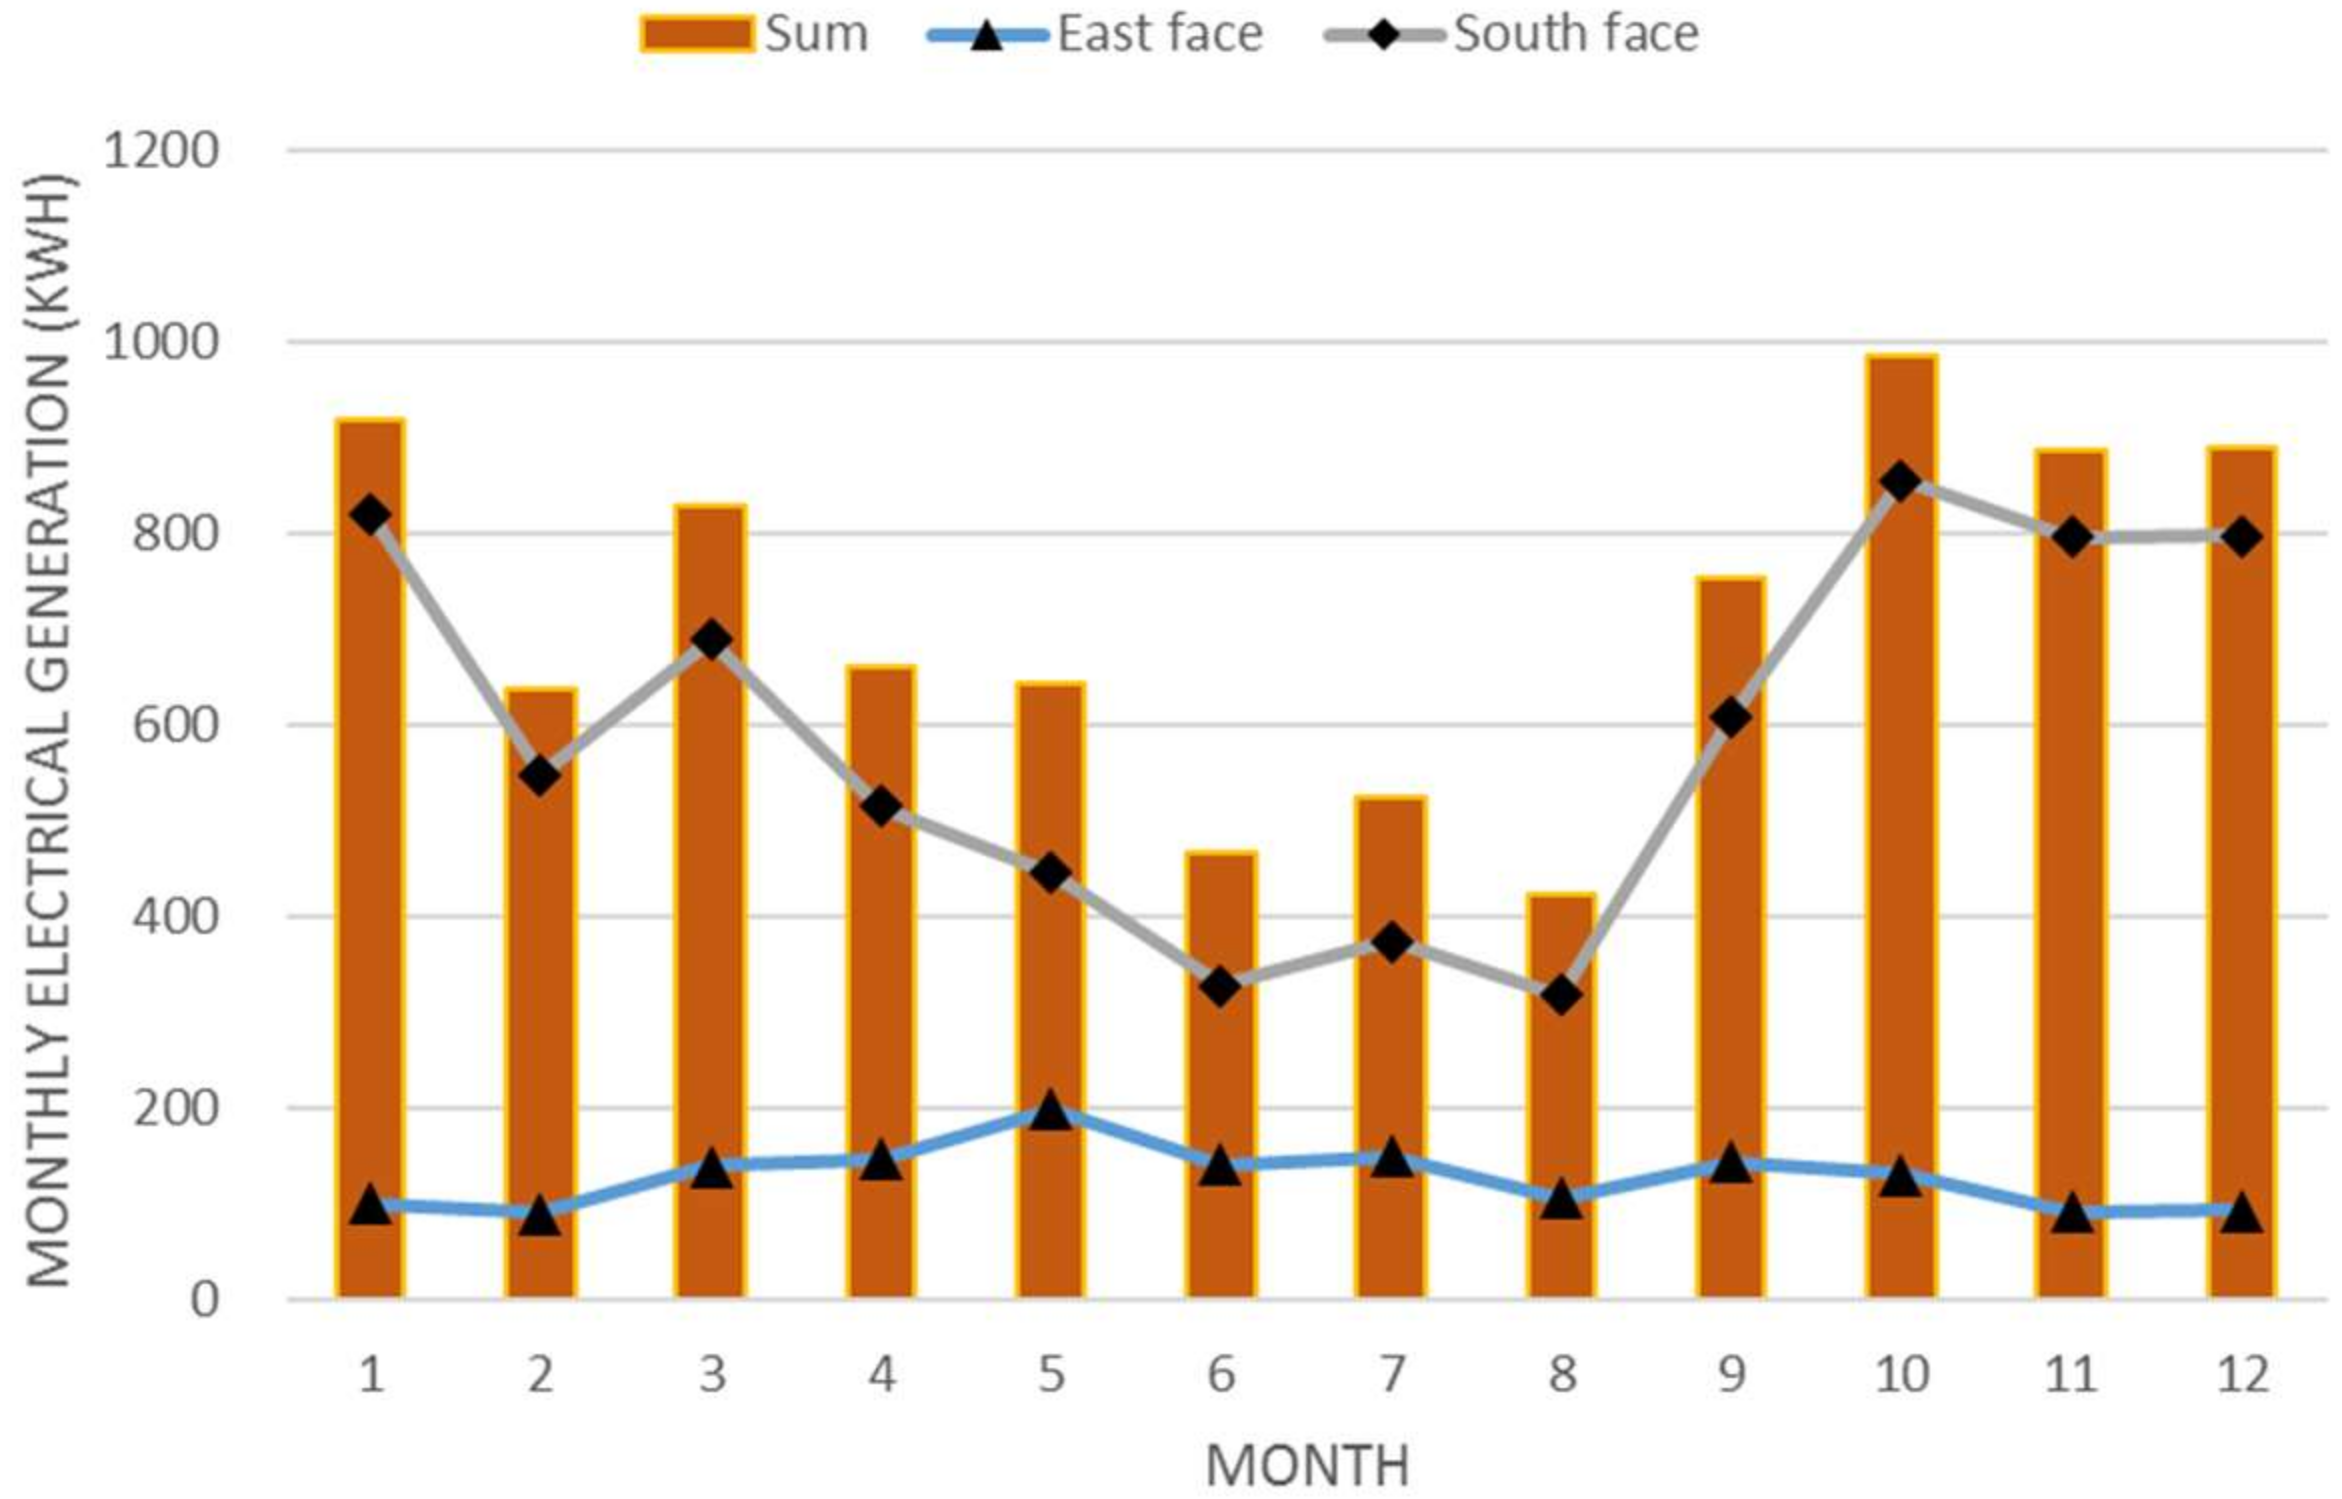
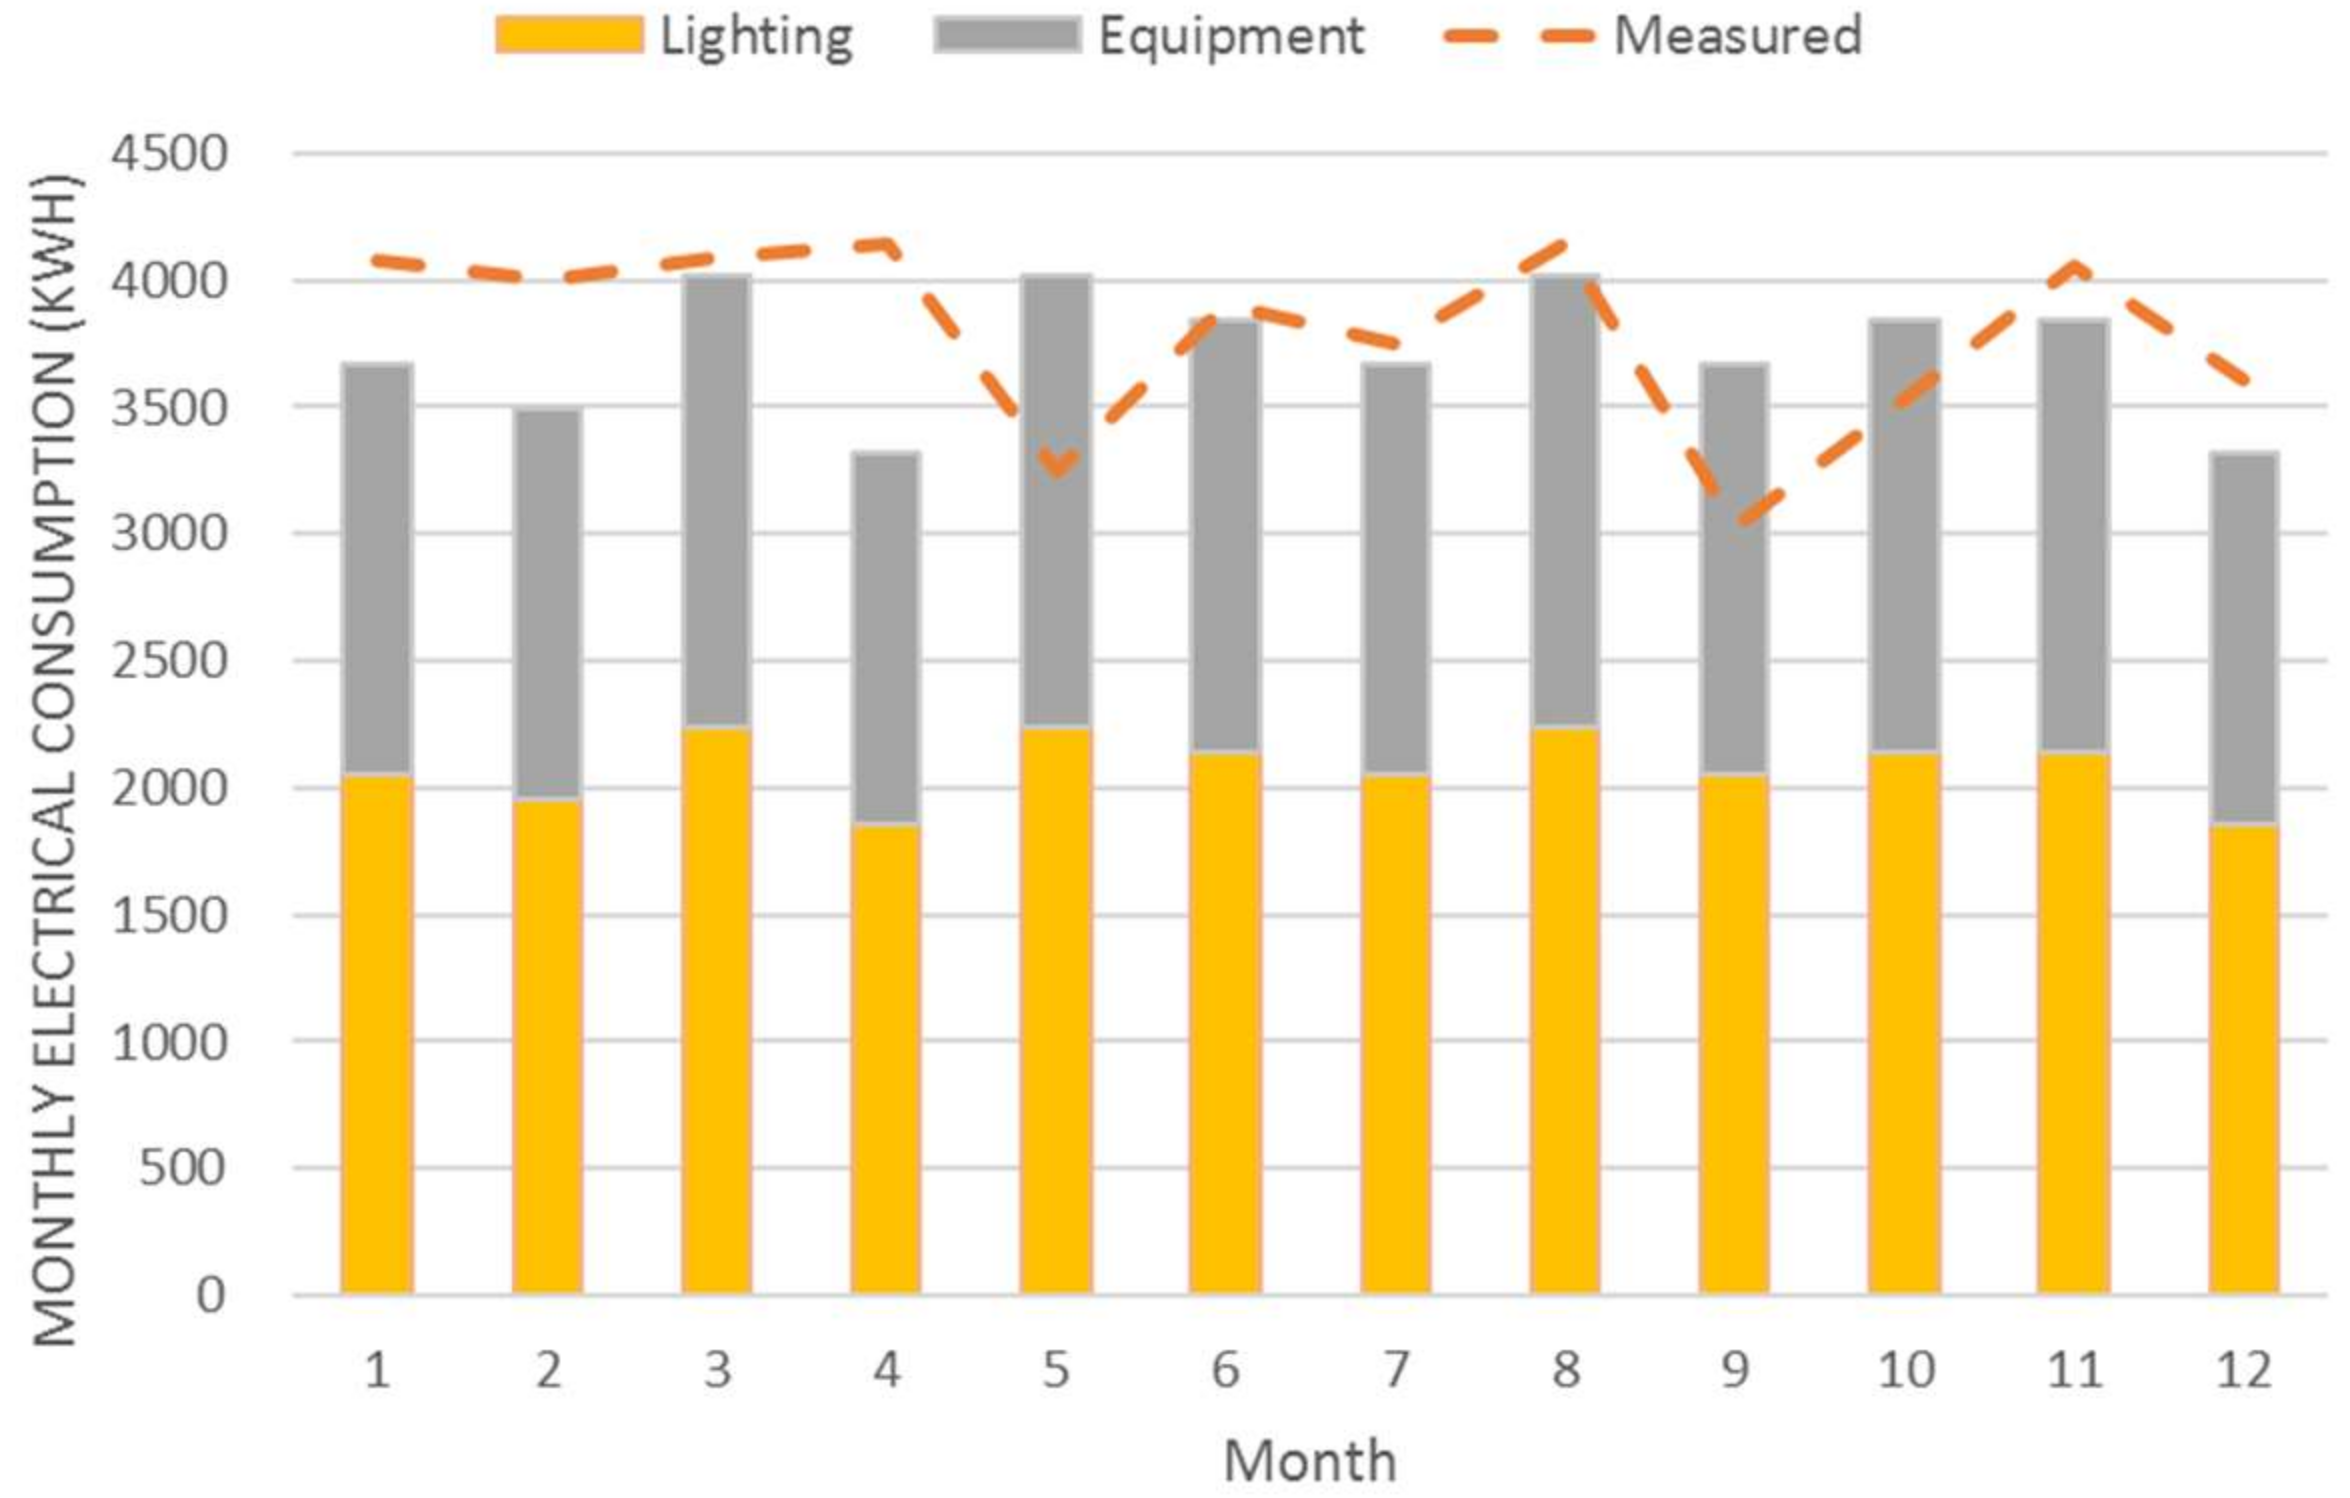
3.1. Measuring Data of the Test Site Building

During the study period, we measured the power generated from BIPVs and that used for lighting, electric equipment, and by the EHP to heat and cool an actual building. The alternating current (AC) power measured with the inverter was used to generate BIPV power. The monthly power usage by lighting, other equipment, and EHP for each floor was measured with an energy meter.
The total capacity of a-Si BIPV windows is 15.31 kWp, of which 10.56 kWp was on the south face and 4.75 kWp was on the east face. The annual generated power measured during the test period was 8617 kWh (Figure 4).
Power generation was high from October to March, when the solar altitude was low, and the average annual reference yield was 1.54 h/day. For the south face, the total annual power generated was 7093 kWh, and the average annual reference yield was 1.84 h/day.
The PV module installed on the east face generated a total of 1524 kWh of power with an average annual reference yield of 0.88 h per day; these results are lower than those on the south face. The generated on the south face varied greatly throughout the year, showing a higher value of 819.4 kWh in January, when the solar altitude was low. This result is nearly 2.59 times higher than the power generated during the summer, particularly the August value of 316.9 kWh.
The capture loss (Lc) from partial shading and the system loss (Ls)-based inverter efficiency of the BIPV windows installed in the building were analyzed in detail in a previous study [31]. Therefore, the power generation performance was not analyzed in this study.
The annual power usage of the building was measured at 132,058 kWh (Figure 5). The lighting and office equipment used 45,585 kWh/year, or 34.5% of the total power usage, with a monthly average of 3798 kWh/month. There was not much difference in the monthly variation in the power usage of the lighting and office equipment.
The power used by the EHP for heating and cooling was measured at 86,473 kWh/year, or 65.5% of the total; the highest values were 10,522 kWh in January (during winter) and 9722 kWh in August (during summer), respectively.

3.2. Comparing Measured Data and Simulated Results

The building measurement data were analyzed in comparison with the simulation results. The exact operating conditions could not be identified because the heating and cooling temperatures were controlled independently by the occupants of each office according to their working hours: there was no centralized control. Therefore, we conducted three rounds of interviews with the building manager as well as an on-site inspection, and the operating conditions were applied based on those results, as follows.
In the simulation, the usage of power for lighting and office equipment was reflected in the input values. An interview with a building manager revealed that the average operational timings of the building were 08:30–19:30 local time (11 h) in 2014. The power density values for light and equipment, as shown in Table 3, were applied to reflect the corresponding operation time while considering how the building’s lighting and office equipment was used. The results of the simulation showed an annual lighting and office equipment power usage of 44.7 MWh, which is approximately 98% of the actual power usage of 45.6 MWh (Figure 6).
Operational conditions determined according to the on-site inspections were input into the simulation for comparison with the power used for heating and cooling. The annual power consumption for heating and cooling obtained by simulating operational hours of 08:30–19:30 (11 h), a heating and cooling temperature of 24 °C and 24 °C, respectively, and 2.0 ACH of air inflow based on entries and exits from the door of 79.9 MWh, which was 92.4% of the actual measured value of 86.4 MWh (Figure 7). When the monthly data were compared, there were differences between July and December, which is the vacation season. During these months each company in the building went on vacation as a group for one week, thus resulting in the low energy consumption for heating and cooling. Taking into consideration the fact that the measured and simulated results showed similar tendencies, the next step in the simulation was to apply and analyze the proposed operating conditions.

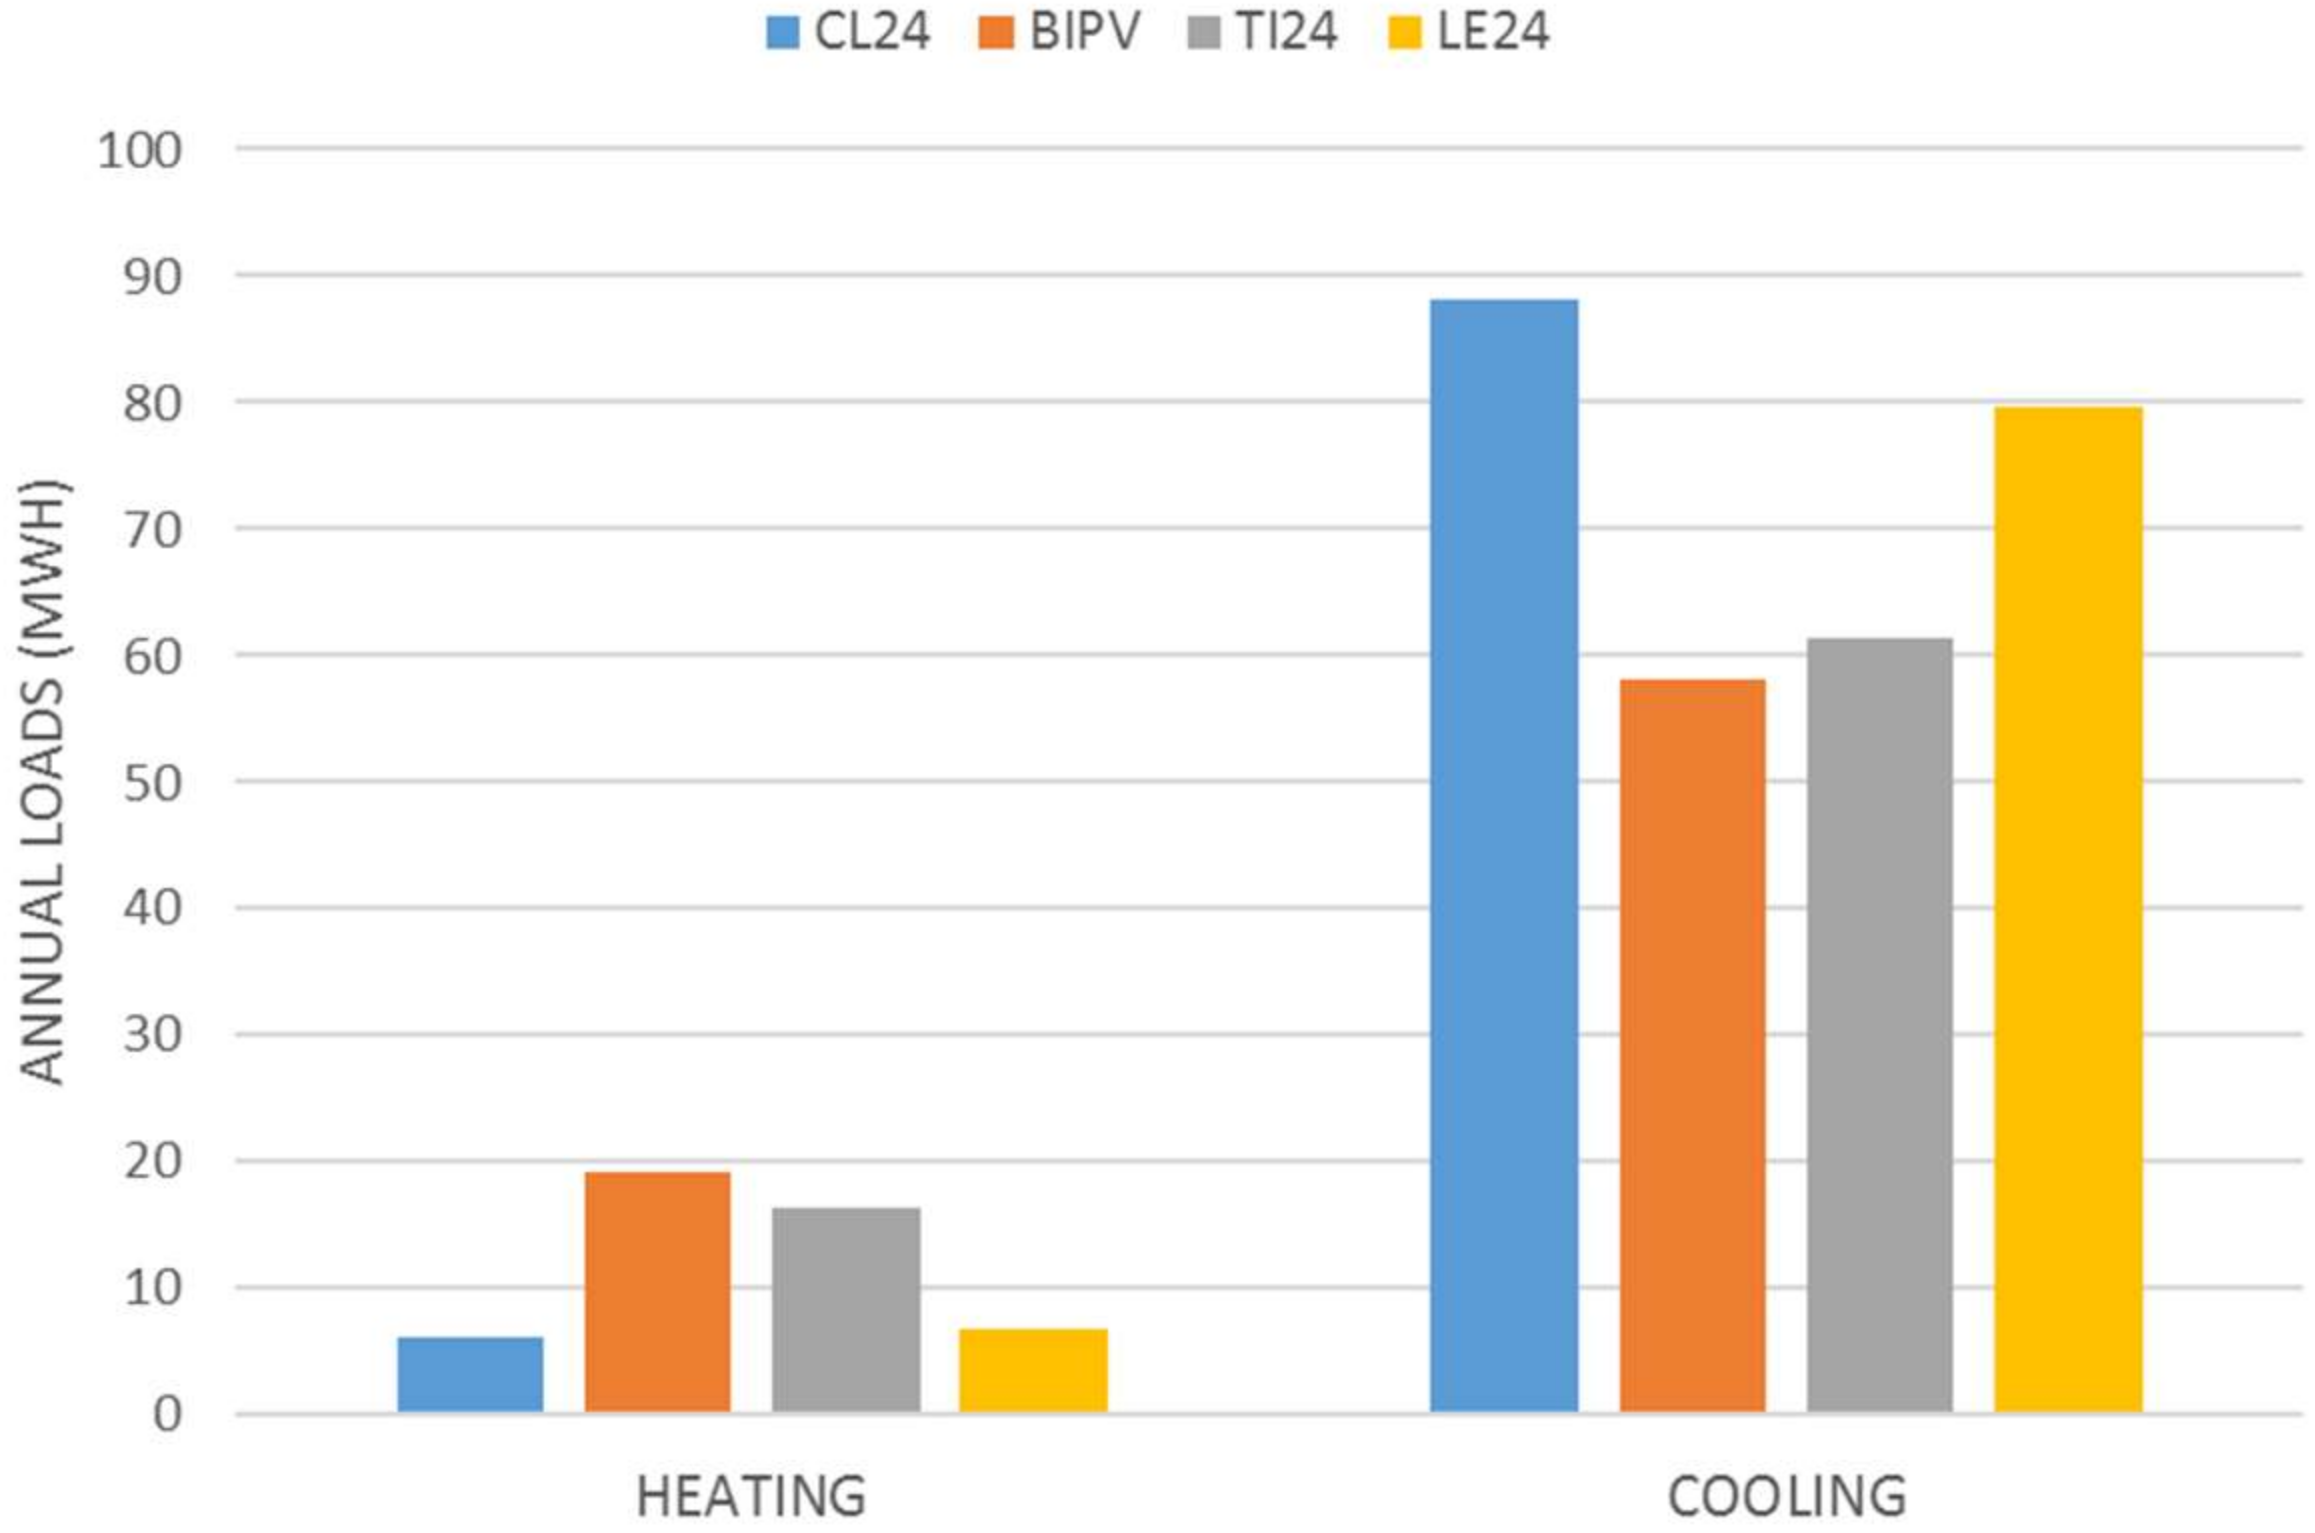
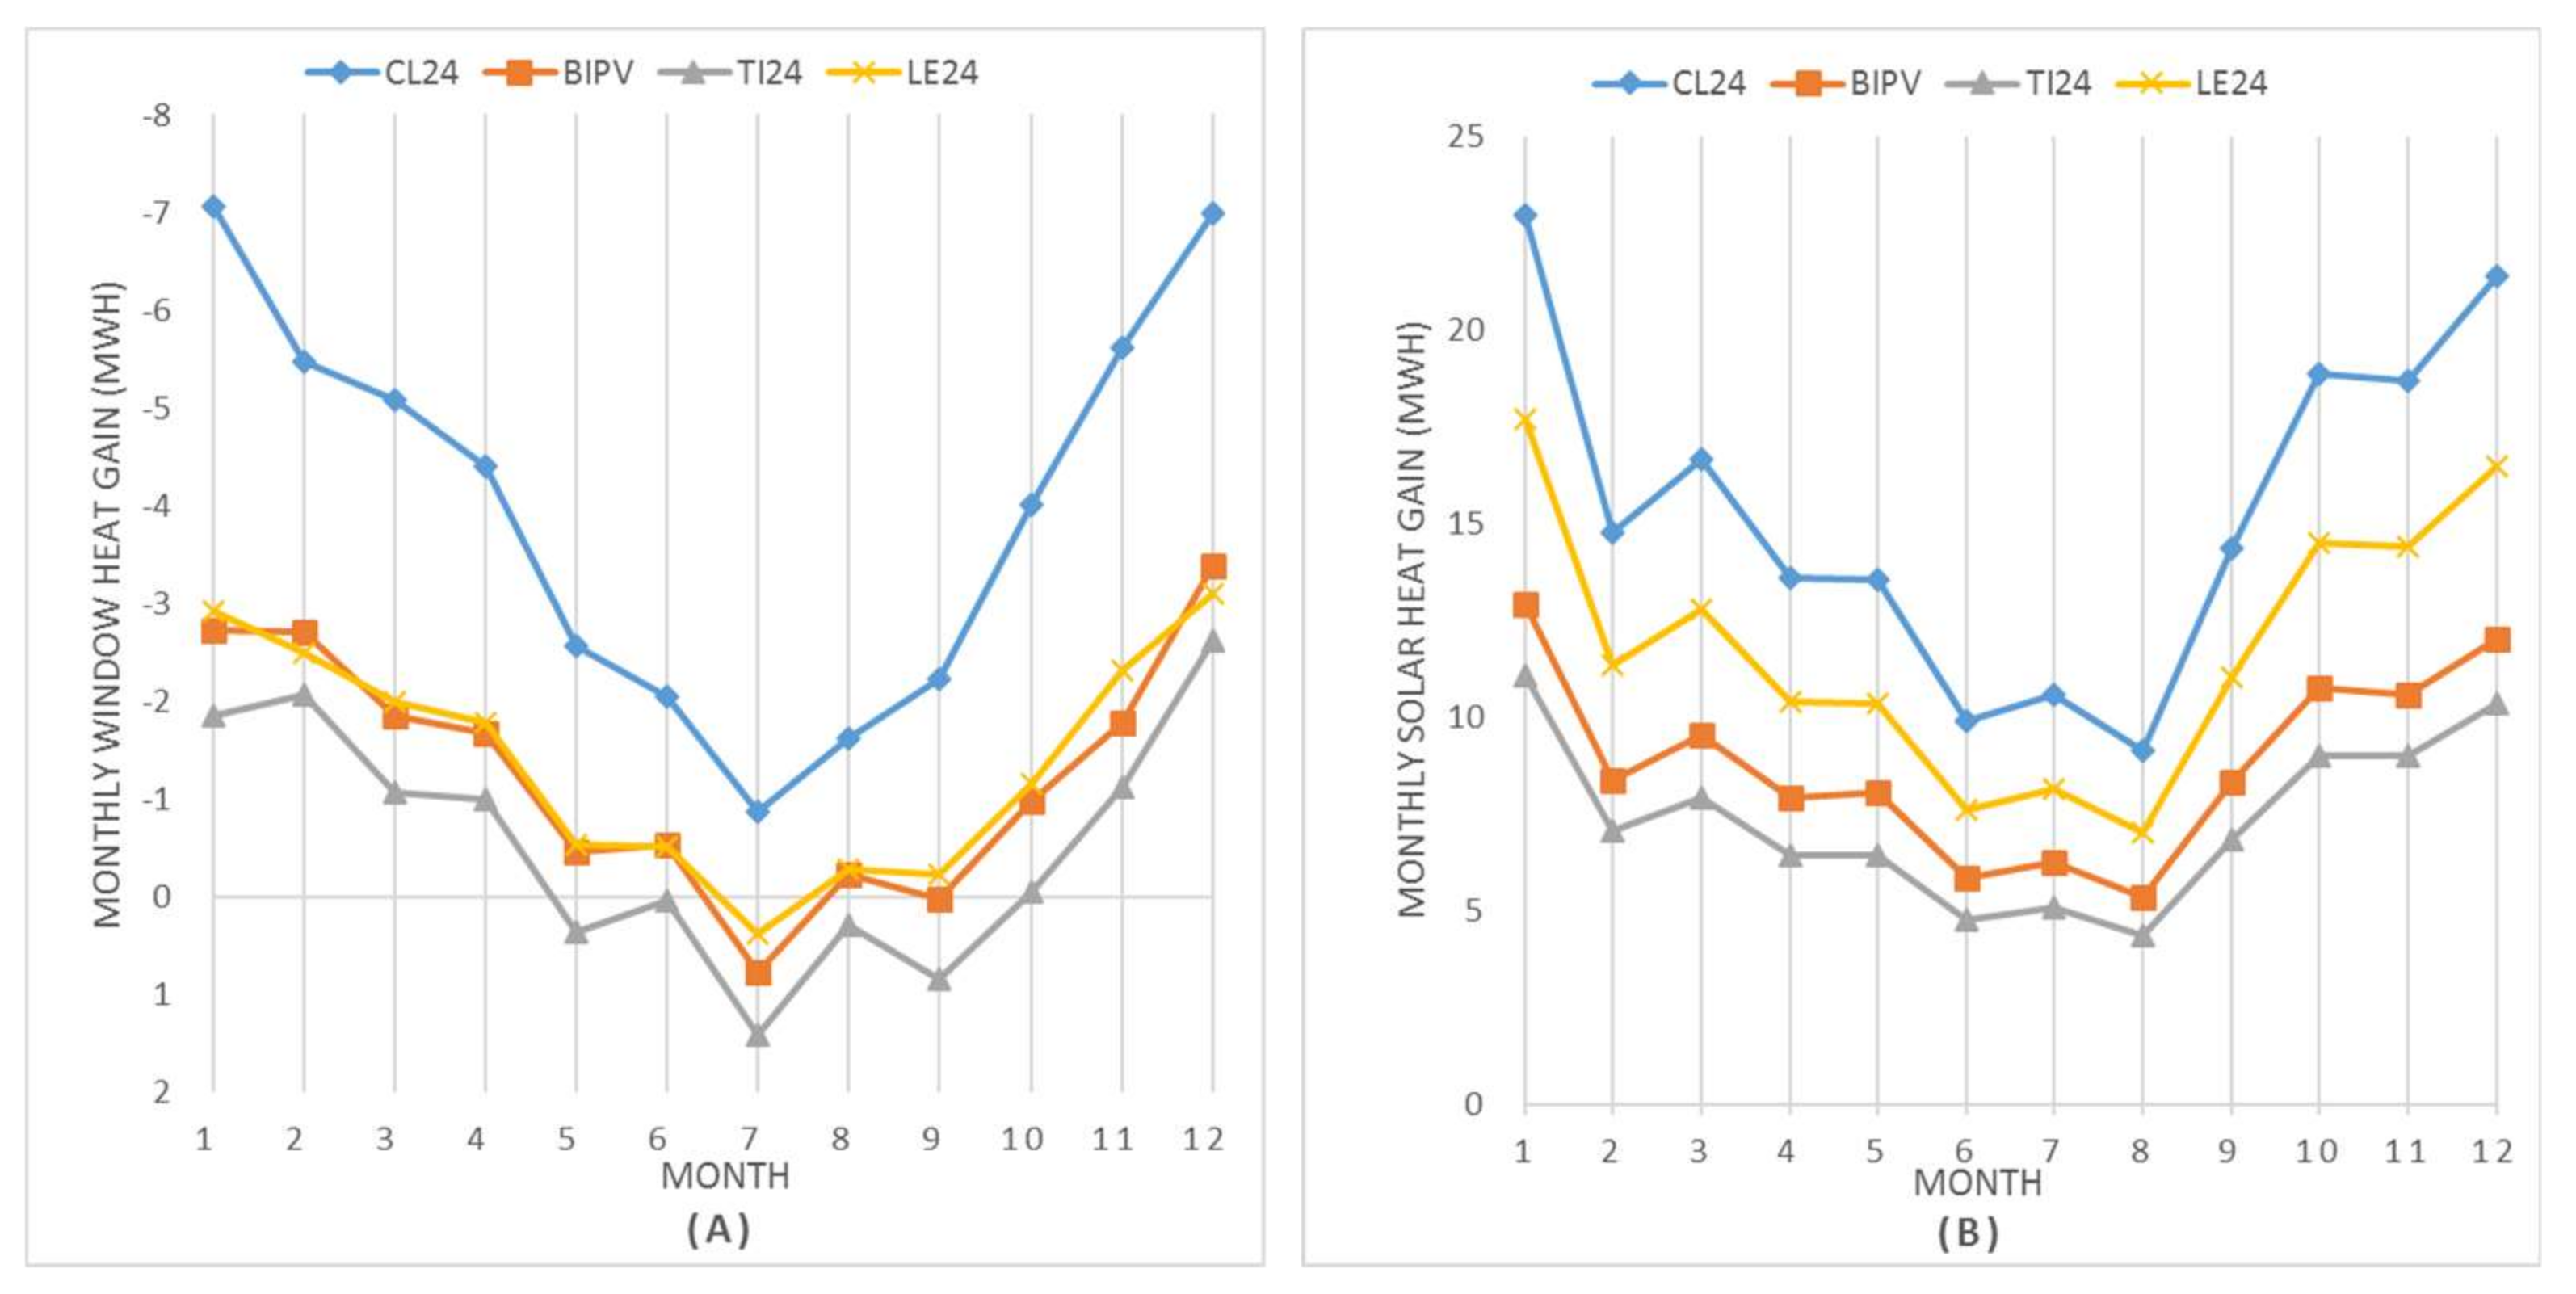
3.3. Results of Operations under Baseline Conditions

The monthly heating and cooling loads when the baseline operating conditions were applied (Figure 8) were compared to determine these properties for the four window models. As the heating and cooling loads were obtained using the IdealLoadAirSystem module in EnergyPlus, the energy efficiency of the heating and cooling equipment was not reflected.
The baseline operating conditions were selected as follows: an operation time from 09:00–18:00 local time (9 h); heating and cooling temperatures of 26 °C and 20 °C, respectively; base infiltration of 0.5 ACH, air infiltration from the entrances of 0.5 ACH; and internal loads of 10 W/m2 and 0.11 person/m2.
The schedule for applying the heating and cooling equipment, lighting, office equipment, and air infiltration values matched the operation time set in the simulation.
For all window models, the annual cooling load were larger than the annual heating load. For CL24, the baseline model, the annual heating load was 6103 kWh while the annual cooling load was 88,163 kWh, or 93.5% of total load, which is an overwhelming proportion. Similarly, the LE24 model had an annual heating load of 6697 kWh and an annual cooling load of 79,711 kWh, or 7.8% and 92.2%, respectively, of the total loads. The BIPV and TI24 models had respective annual heating load of 19,100 kWh and 16,339 kWh, or 24.7% and 22.7% of their totals. These are higher ratios than those of the CL24 and LE24 models (Figure 9).
We then compared the window and solar heat gain, which also affect the heating and cooling loads (Figure 10). For all window models under the baseline operating conditions, there was a large difference between the CL24 model and the others in terms of these two factors.

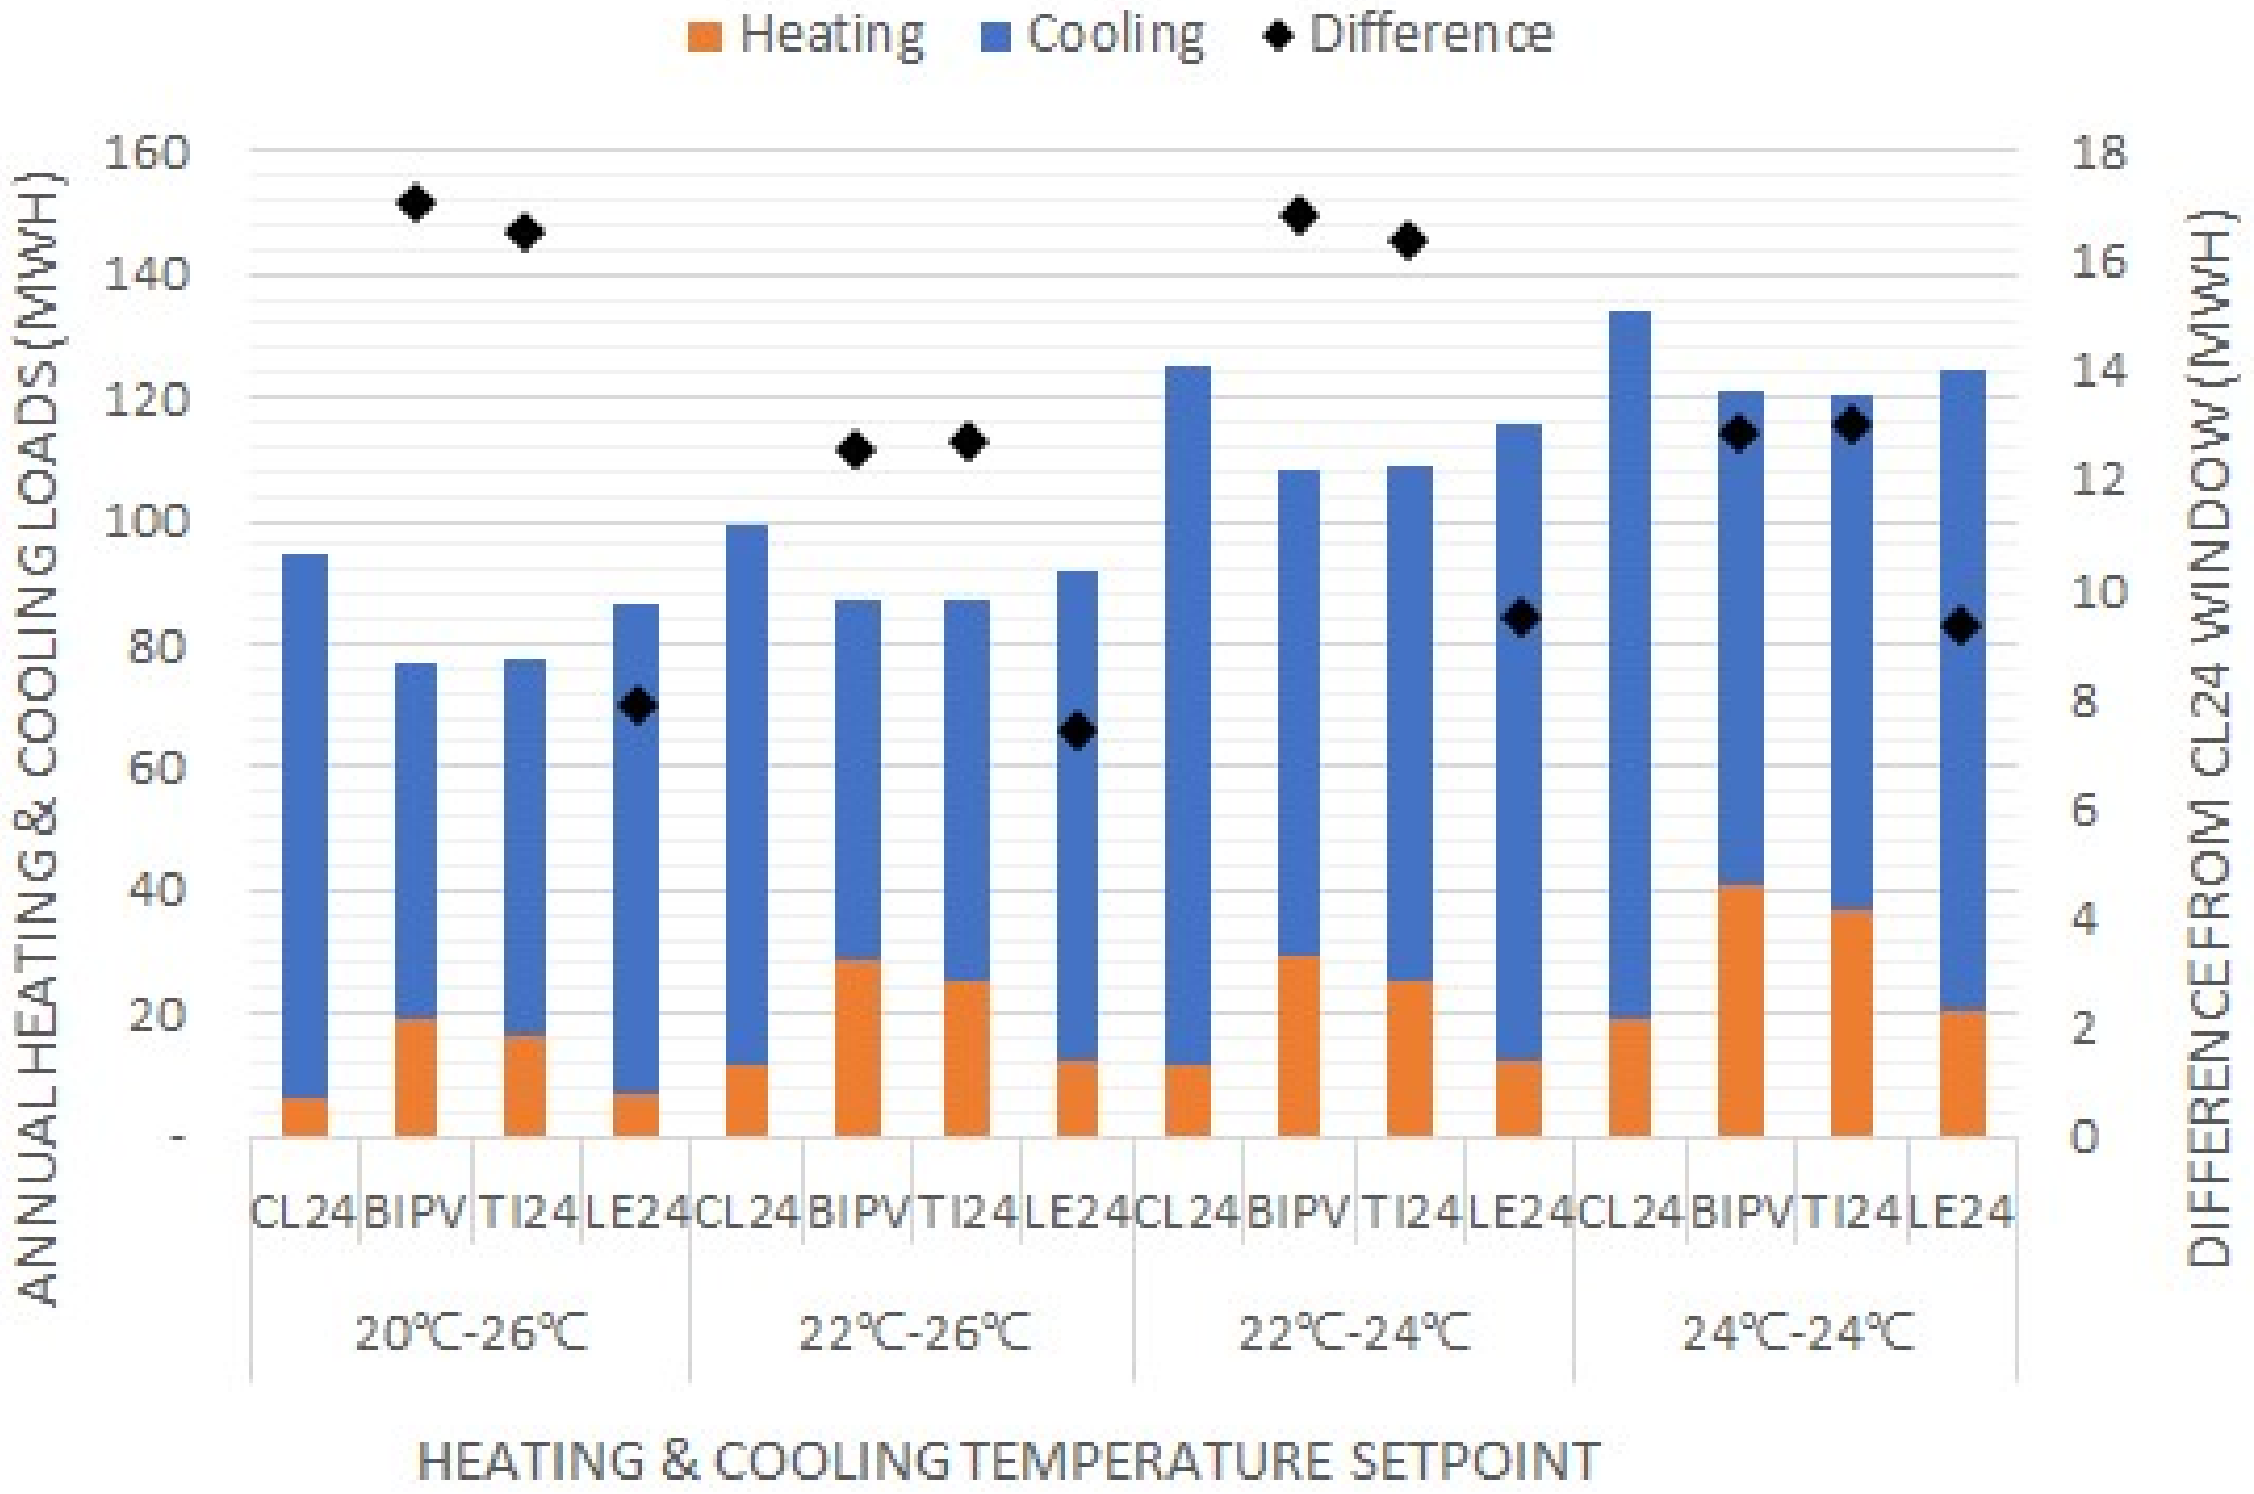
3.4. Results of Simulating Different Operating Conditions

We conducted simulations for the four variables of operating condition, i.e., operation time, temperature settings, air infiltration from the entrances, and internal load by comparing them with baseline operating conditions and then analyzed each of the results. Figure 11 shows the analysis for changes in operation time.
For the CL24 model, as the operation time increased the heating load increased from 5765 kWh in Case 1 (09:00–17:00 local time; 8 h) to 7061 kWh in Case 4 (08:30–19:30 local time; 11 h), which is a growth rate of 22.5%. The cooling load increased from 80,757 kWh in Case 1 to 100,630 kWh in Case 4, which is a growth rate of 24.6%. The BIPV model had heating and cooling load growth rates of 17.4% and 28.2%, respectively, for Case 4 compared with Case 1, indicating that the cooling load had a higher growth rate.
Compared with CL24, the heating and cooling loads reduction was the highest in Case 4 at 18,664 kWh for the BIPV model. For the TI24 model, Case 1 showed a reduction of 15,110 kWh, whereas the reduction was 18,035 kWh in Case 4. The reduction in the LE24 model was smaller than that in the BIPV or TI24 models.
Figure 12 shows the reduction in the heating and cooling loads for the CL24 model based on the changes in heating and cooling temperature settings.
In Case 1, the heating temperature was 20 °C and cooling temperature setting was 26 °C. In Case 2, the heating temperature setting was increased to 22 °C and the same cooling temperature was retained. Given these conditions, the results show that the change in the cooling load of each model was insignificant; conversely, the heating load increased for each model and were particularly large for the BIPV and TI24 models. The reduction in their heating and cooling loads decreased from 17,078 kWh and 16,521 kWh to 12,587 kWh and 12,678 kWh, respectively. For the LE24 model, the reduction in the heating load increased from 7857 kWh to 9374 kWh.
In Case 3, the heating and cooling temperatures were set to 22 °C and 24 °C, respectively; the cooling load increased because the lower cooling temperature in this case was 2 °C lower than that in Case 2. For the CL24 model, the cooling load grew 28.8% over the study period, while the growth rates of the cooling load for the BIPV, TI24, and LE24 models were 24.4%, 25.0%, and 25.4%, respectively. Thus, when the cooling temperature was lowered, the reduction in both the heating and cooling loads of the BIPV, TI24, and LE24 models increased.
For Case 4, in which the heating temperature was increased to 24 °C in line with the results of Case 2, the heating load of the BIPV and TI24 models increased greatly compared to the results of the CL24 model, whereas the reduction in the heating and cooling loads decreased further. As shown by these, the increases in heating temperature had negative effects on the energy reduction of the BIPV and TI24 models whereas decreases in cooling temperature increased the energy reduction.
We next examined the energy reduction and the heating and cooling loads of the window models based on changes in the air infiltration from the entrance doors (Figure 13).
We observed large differences in the energy reduction among the window models when the air infiltration from the entrance door was altered to 0.5, 1.0, 1.5, and 2.0 ACH.
For the CL24 model, an increase in air infiltration from the entrance door resulted in increases in the heating load but slight decreases in the cooling load. Similar results were noted for the LE24 model. On the contrary, the heating load increased, although the cooling load showed no significant changes, in the BIPV and TI24 models. A comparison of Cases 1 and 4, which had the smallest and largest air infiltration from the entrance door, respectively, revealed that the increase amount of heating and cooling loads of the CL24, BIPV, TI24, and LE24 models are 14,455 kWh, 23,950 kWh, 22,939 kWh, and 12,327 kWh respectively.
There were large increases in the heating and cooling loads of the BIPV and TI24 models compared to the results of the CL24 model. Moreover, while the reduction of the heating and cooling loads in the former two models was low in Case 4, the LE24 model had a smaller increase in its heating and cooling loads than the CL24 model did; therefore, the overall reduction in the heating and cooling loads increased.
Our final analysis considered the reductions in heating and cooling loads based on changes caused by lighting, office equipment, and occupancy on the internal loads (Figure 14).
For all window models, the heating load decreased and the cooling load increased as the internal loads increased. A comparison of Case 1 (10 W/m2; 0.11 person/m2) and Case 4 (25 W/m2; 0.25 person/m2) revealed that the decrease amount of heating load of the CL24, BIPV, TI24, and LE24 models in Case 4 are 994 kWh, 3579 kWh, 3052 kWh, and 1065 kWh comparing to Case 1, respectively, whereas their increase amount of cooling load are 19,566 kWh, 16,833 kWh, 17,265 kWh, and 19,498 kWh, respectively.
A comparison of the BIPV and TI24 models with the CL24 model showed that there were large decreases in heating load and small increases in cooling load in the former, leading to increase in reduction of the heating and cooling loads. In Case 4, the reduction of the heating load in the BIPV, TI24, and LE24 models comparing to CL24 was 33,611 kWh, 30,156 kWh, and 8691 kWh, respectively.
Thus far, we have examined the changes in the heating and cooling loads of the window models and compared the energy reduction of other window models to CL24 according to changes in the four operating variables of operation time, heating and cooling temperature settings, entrance air infiltration, and internal heat load.
As the operation time increased, all the window models showed a similar rate of increase for their heating and cooling loads, indicating that the reduction in the heating and cooling loads of other models increased relative to CL24.
As heating temperature increased, the heating loads of the BIPV and TI24 models increased compared with those of the CL24 model and a decrease in the reduction in the heating and cooling loads. When the cooling temperature was lowered the reductions in the heating and cooling loads of the BIPV, TI24, and LE24 models increased compared to the CL24 model.
When air infiltration from the entrance door increased, the heating load of all the window models also increased, although the BIPV and TI24 models had higher growth rates than that of the CL24 model. The cooling load decreased in the CL24 and LE24 models and increased slightly in the BIPV and TI24 models. Therefore, it is clear that increases in air infiltration from the entrance door decreased the reduction in the heating and cooling loads in the BIPV and TI24 models compared to the CL24 model. However, this reduction increased in the LE24 model.
When the internal heat load increased, the heating load decreased and the cooling load increased in all the window models. The BIPV and TI24 models showed large decreases in their heating load compared to CL24, whereas increases in the cooling load were small. This resulted in an overall increase in the reduction of the heating and cooling loads.
Based on these results, operational management of the heating temperature and air infiltration is necessary to increase the reduction of the heating and cooling loads via the BIPV model. For the temperature settings, a building energy management system is essential and can be expected to enable efficient management in the future. Previous studies have demonstrated that the air infiltration from the entrance door can be reduced greatly by installing revolving doors, vestibules, and air curtains [36]. Therefore, with efficient operation management and improvements in the facility, the BIPV model will have a higher reduction in the heating and cooling loads compared to the other window models.

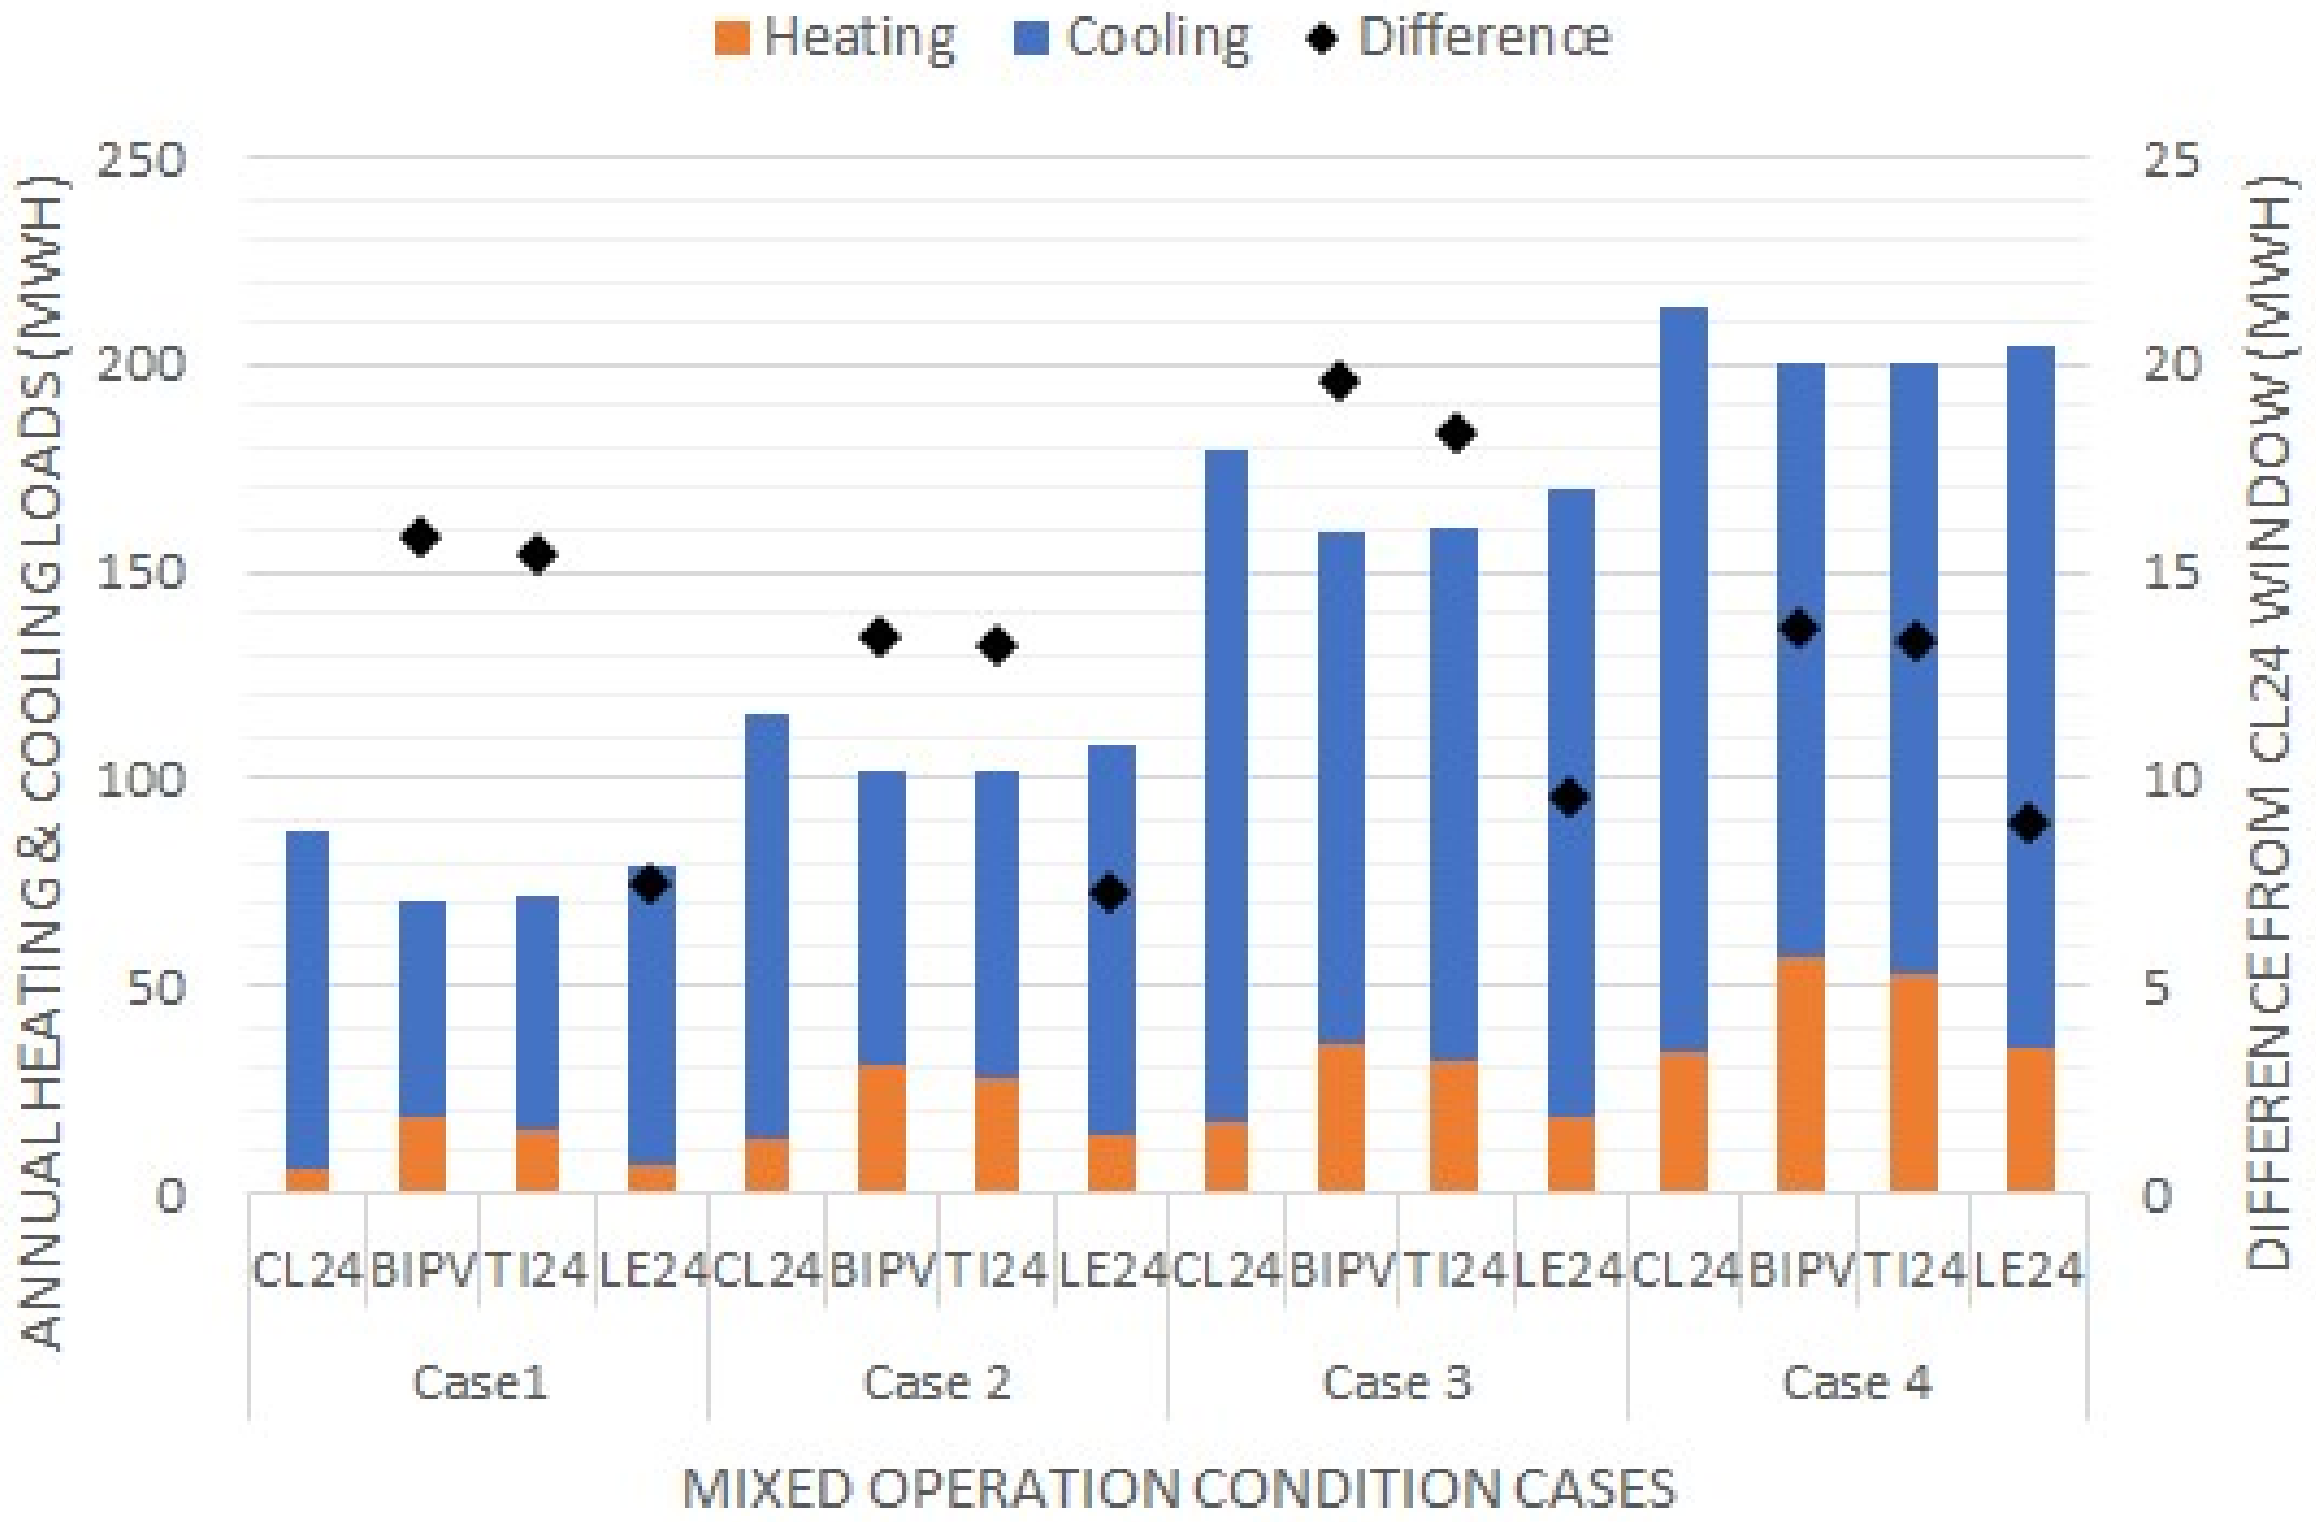
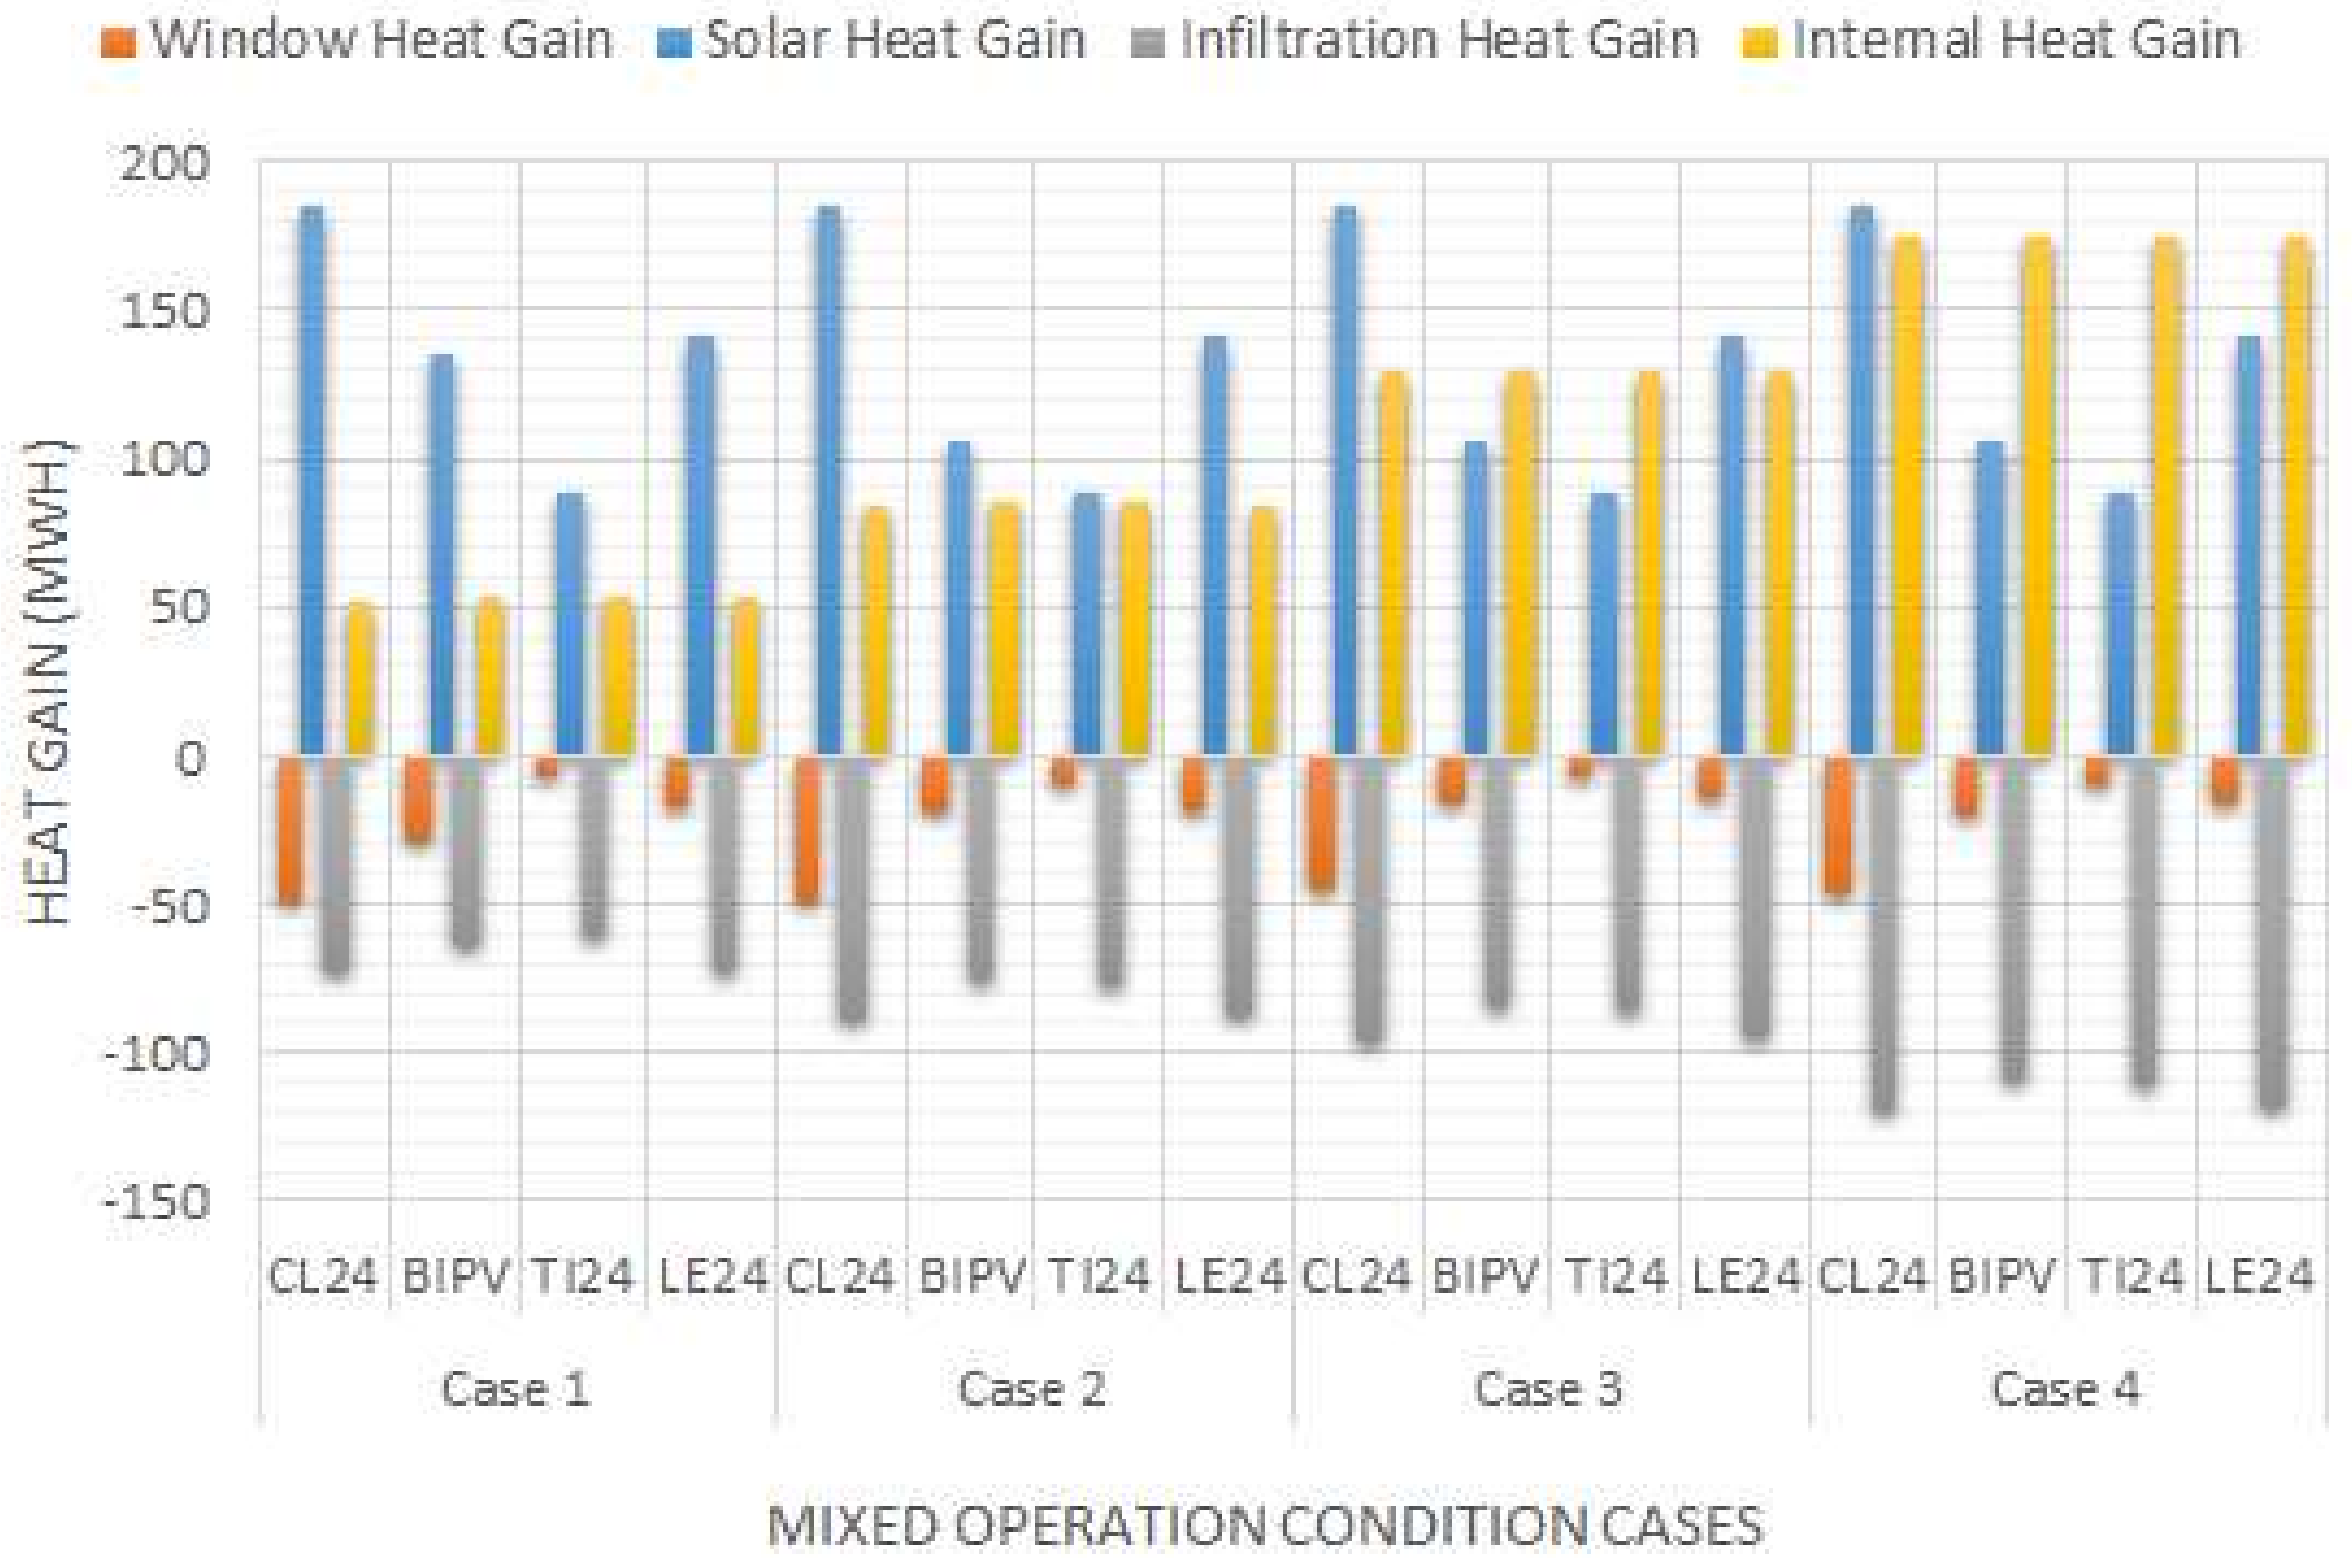
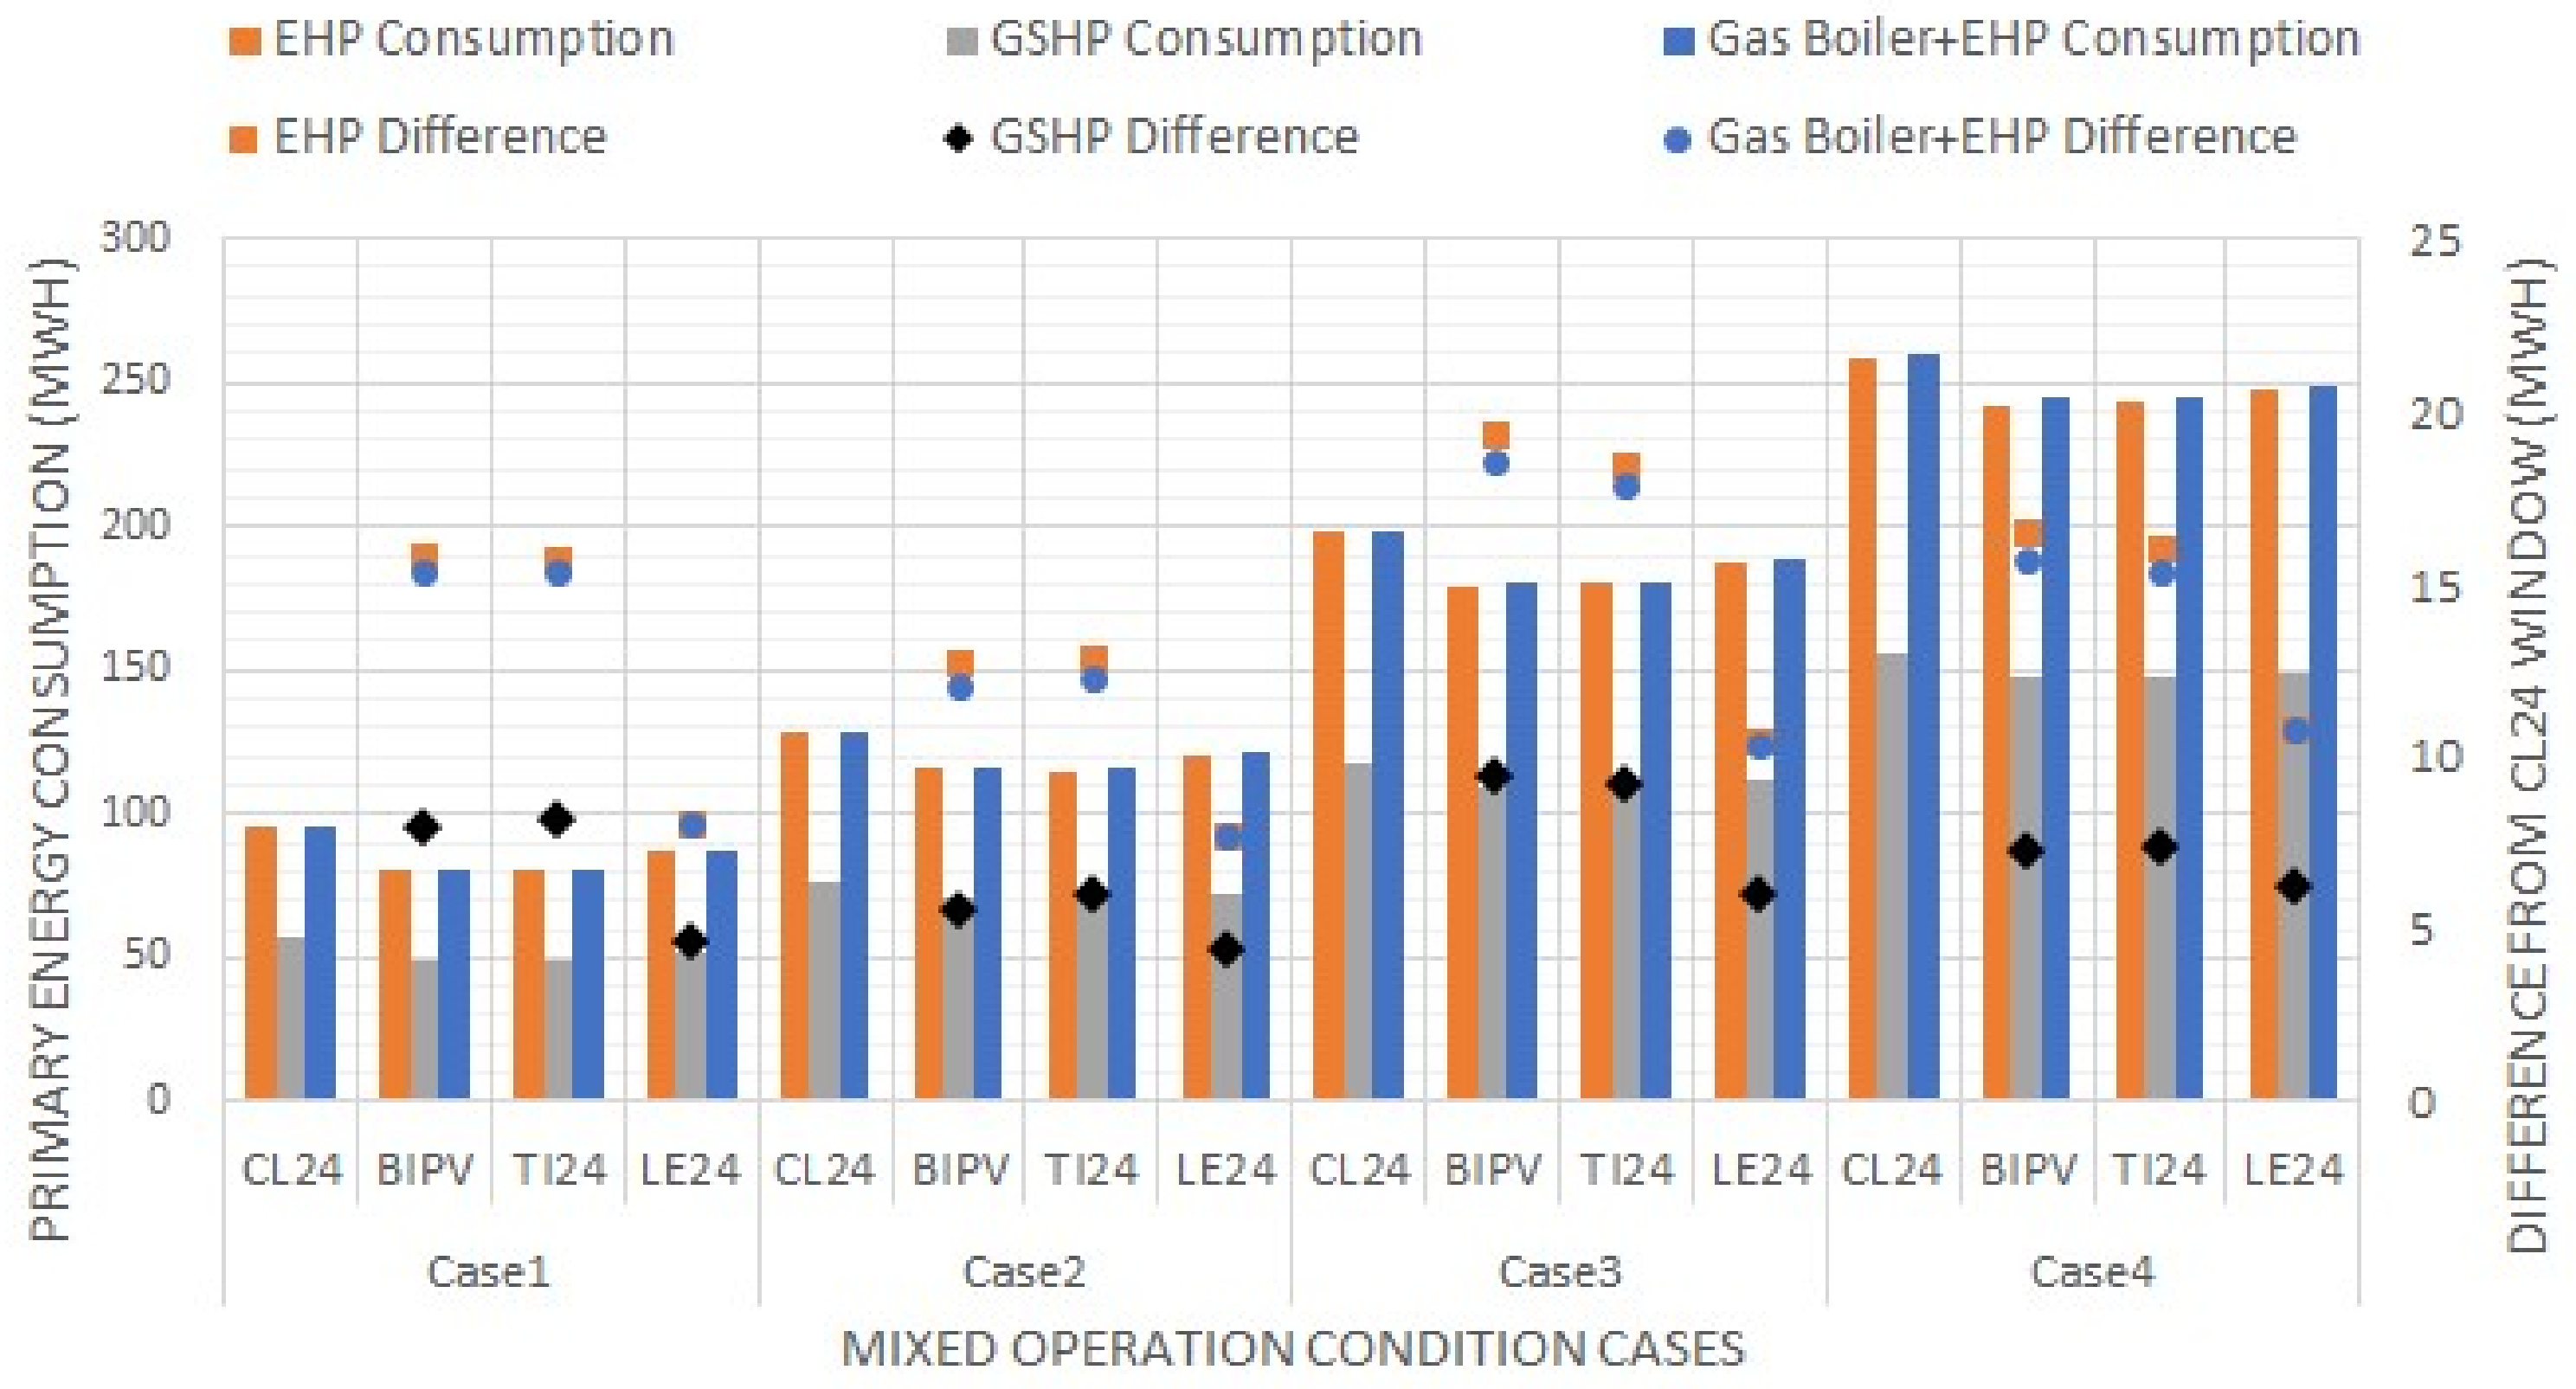
3.5. Heating and Cooling Energy Consumption for the Mixed Operating Conditions

In this section, we compare annual heating and cooling loads under combined operating conditions and analyze the primary energy consumption according to the heating and cooling equipment used.
We first created a combined set of conditions in which all operating conditions increased as the heating and cooling loads increased. Cases 1–4 in Table 6 show that the heating and cooling loads for all conditions tended to an increase; thus, all operating conditions were combined in the same case number.
The mixed operating conditions in Case 1 thus used the following variables: an operation time of 09:00–17:00 local time (8 h); heating and cooling temperatures of 20 °C and 26 °C, respectively; air infiltration from the entrances of 0.5 ACH; lighting equipment use of 10 W/m2, and occupant power use of 0.11 person/m2. Other cases were constructed in the same way.
The results from the simulation are shown in Figure 15. In all the cases for all the window models, the heating and cooling loads increased. Both the operation time and the heating and cooling temperatures increased the heating and cooling loads, whereas an increase in the air infiltration increased the heating load. Increases in the internal loads decreased the heating load and increased the cooling load. A comparison of Cases 1–4 revealed that even when the internal heat gain was increased more than the heat loss from infiltration, the heating load still increased. This can be attributed to the large impact of the increase in heating temperature (Figure 16). An examination of the variations in the heating and cooling loads for each case revealed that the heating load increased the most in Cases 2 and 4, in which the heating temperature setting increased by 2 °C. The cooling load increased the most in Case 3, in which the cooling temperature setting decreased by 2 °C. The reduction in the heating and cooling loads were low in Cases 2 and 4, which had larger heating loads than the other cases did.
For the LE24 model, the reduction in the heating and cooling loads showed a slight increase compared to the CL24 model. Consequently, the amount of energy saved by the LE24 model in Cases 3 and 4 was larger than achieved by the BIPV and TI24 models for the same cases.
The heating and cooling loads of the building were converted to energy by the heating and cooling equipment; therefore, energy consumption varies with the performance of the equipment [37]. In addition, if the energy sources are different, they must be converted to a primary energy source to enable accurate comparisons.
This study applied and analyzed the EHP, ground source heat pump (GSHP), and boiler + EHP configuration currently used in many office buildings.
The coefficients of performance (COP) of each piece of heating and cooling equipment were determined on the basis of research on Korean climate conditions.
Heating and cooling EHPs have recently become widely used as the equipment used to generate power for office buildings. In this study, we applied the COP of EHP in the Daegu region determined through the simulation while considering Korean climate conditions [38]. We then applied the COP of a GSHP, obtained by simulating an office building [39]. A gas boiler and cooling EHP combination are also very widely used conventionally in office buildings. Therefore, regulations on promoting the supply of high-efficiency energy equipment, as set by the South Korean government, were used to measure gas boiler heat efficiency [40]. The EHP was analyzed using the cooling COP, which is the same as that used for heating and cooling EHPs (Table 7).
EHPs and GSHPs use electricity, but the gas boiler + EHP system uses electricity and gas. The energy consumption of all heating and cooling equipment was then converted to primary energy and the different usages were compared. The primary energy conversion factor proposed in the Korean Government Regulation on the Energy Efficiency Rating Certification System for Buildings [41] was used for this purpose (Table 8).
The energy consumptions of the three heating and cooling systems (EHP, GSHP, and gas boiler + EHP), were then converted into primary energy and were compared (Figure 17).
In Figure 15 and Figure 17, which show the heating and cooling loads and the heating and cooling energy consumption, respectively, both the EHP and GSHP have higher cooling COPs than heating COPs. Therefore, there was a larger decrease in power consumption in the CL24 and LE24 models, which have higher cooling load ratios than the other models. Accordingly, the primary energy reduction of other window models (as shown in Figure 17) was lower than the reduction of heating and cooling loads relative to CL24, as shown in Figure 15.
For the BIPV model, the heating and cooling loads were reduced by 15,881 kWh, 12,735 kWh, 19,318 kWh, and 16,576 kWh, respectively, for each of the four cases; the highest reduction was noted in Case 3. The TI24 model also showed the highest reduction in Case 3, whereas the LE24 model showed the highest reduction in Case 4.

4. Conclusions

This study simulated three different window models—CL24, a clear glass double-layer window; TI24, a heat-absorbing double-layer window; and LE24, a low-e glass double-layer window—to investigate the effects of a-Si BIPV windows on the heating and cooling energy performance of an office building under temperate Korean conditions. We also analyzed the heating and cooling loads and actual energy consumption of the building according to changes in operation time, heating and cooling temperatures, air infiltration from the entrances, and internal heat load, as these four operating conditions affect the use of energy to heat and cool the buildings. The results are summarized below.
(1) The simulation conducted under baseline operating conditions showed that the cooling load in the CL24 window model predicted 93.5% of the annual heating and cooling loads, indicating that the power load is dominated by energy used for cooling. Therefore, in other window models with low solar heat gain coefficients, the annual heating and cooling loads decreased based on reductions in the solar heat gain. The BIPV, TI24, and LE24 models showed heating and cooling load reductions of 18.1%, 17.5%, and 8.3%, respectively, compared to the CL24 model.
(2) When the operation time increased under the baseline operating conditions, all the window models had higher growth rates for cooling load compared to heating load. All the window models demonstrated increases in the amount of energy saved, following the rise in the heating and cooling loads, compared to the CL24 model.
(3) When the heating and cooling temperature settings were changed in the baseline operating conditions, the heating and cooling loads for all window models increased more when the cooling temperature dropped than when the heating temperature rose. On the contrary, raising the heating temperature had a larger impact on the reduction of the heating and cooling loads.
(4) Increased air infiltration from entrance doors caused an increase in the heating load of all the window models under the baseline operating conditions. The BIPV and TI24 models, in particular, showed large increases in heating load compared to the CL24 model, whereas the reduction of the heating and cooling loads in the former decreased significantly.
(5) Three heating and cooling systems were used—EHP, GSHP, and gas boiler + EHP—and their energy consumptions were converted to primary energy. All the simulated window models showed a gradual decline in the reduction of the primary energy consumption, compared to the CL24 model, whereas the actual decline was highest for the BIPV and TI24 models in Case 3 and the LE24 model in Case 4.
This study, the BIPV model using a-Si module was compared with other window models under various operating conditions. The results confirm that the BIPV model attains a high heating and cooling energy reduction even when the operating conditions are changed. In addition, analysis of various operating conditions shows that the amount by which energy consumption is reduced in the case of air infiltration from the entrances and rises in heating temperature decreases significantly when the BIPV windows are used. Therefore, we expect that the effect of heating and cooling using BIPV windows can improve energy reduction through efficient designs and controls focusing on these factors.
Previous studies analyzed energy performance by focusing on types of semitransparent photovoltaics (STPV), construction designs, and climate conditions, with operating conditions set differently according to regional characteristics. The result of this study showed that operating conditions exert significant influence on the heating or cooling performance of STPVs in a temperate climate. Therefore, the results of this study suggest the need to analyze operating conditions and construction conditions in detail in future evaluations and analyses of STPV performance.

Author Contributions

H.J.A. developed the concept and framework for study, carried out the simulation, and wrote the initial manuscript. Y.S.A. collected data for the simulation and office building performance and built the building model for the simulation. J.H.Y. and E.H. verified the scholastic merit of the paper, carried out a critical review of its structure and content, and supervised the analysis and findings of this study. All authors discussed the results and contributed to the final manuscript.

Funding

This research was supported by the Technology Development Program to Solve Climate Changes of the National Research Foundation (NRF) funded by the Ministry of Science, ICT & Future Planning of the Republic of Korea (No. NRF -2016M1A2A2936758).

Conflicts of Interest

The authors declare no conflict of interest.

References

  1. Nejat, P.; Jomehzadeh, F.; Taheri, M.M.; Gohari, M.; Majid, M.Z.A. A global review of energy consumption, CO2 emissions and policy in the residential sector (with an overview of the top ten CO2 emitting countries). Renew. Sustain. Energy Rev. 2015, 43, 843–862. [Google Scholar] [CrossRef]
  2. Korean Ministry of Land, Infrastructure and Transport. Zero Energy Building Certification System; Korean Ministry of Land, Infrastructure and Transport: Sejong City, Korea, 2017.
  3. United States Department of Energy. A Common Definition for Zero Energy Buildings; United States Department of Energy: Washington, DC, USA, 2015.
  4. Soares, N.; Bastos, J.; Pereira, L.D.; Soares, A.; Amaral, A.R.; Asadi, E.; Rodrigues, E.; Lamas, F.B.; Monteiro, H.; Lopes, M.A.R.; et al. A review on current advances in the energy and environmental performance of buildings towards a more sustainable built environment. Renew. Sustain. Energy Rev. 2017, 77, 845–860. [Google Scholar] [CrossRef] [Green Version]
  5. Kapsalakia, M.; Leala, V.; Santamouris, M. A methodology for economic efficient design of Net Zero Energy Buildings. Energy Build. 2012, 55, 765–778. [Google Scholar] [CrossRef]
  6. Polly, B.; Kutscher, C.; Macumber, D.; Schott, M.; Pless, S.; Livingood, B.; Geet, O.V. From Zero Energy Buildings to Zero Energy Districts. In Proceedings of the 2016 American Council for an Energy Efficient Economy Summer Study on Energy Efficiency in Buildings, Pacific Grove, CA, USA, 21–26 August 2016. [Google Scholar]
  7. Azadian, F.; Radzi, M.A.M. A general approach toward building integrated photovoltaic systems and its implementation barriers: A review. Renew. Sustain. Energy Rev. 2013, 22, 527–538. [Google Scholar] [CrossRef] [Green Version]
  8. United States Department of Energy. Building-Integrated Photovoltaics(BIPV): Analysis and US Market Potential; United States Department of Energy: Washington, DC, USA, 1995.
  9. Quesada, G.; Rousse, D.; Dutil, Y.; Badache, M.; Halle, S. A comprehensive review of solar facades. Opaque solar facades. Renew. Sustain. Energy Rev. 2012, 16, 2820–2832. [Google Scholar] [CrossRef]
  10. Attoye, D.E.; Aou, K.A.T.; Hassan, A. A Review on Building Integrated Photovoltaic Façade Customization Potentials. Sustainability 2017, 9, 2287. [Google Scholar] [CrossRef]
  11. Shukla, A.K.; Sudhaka, R.K.; Baredar, P. Recent advancement in BIPV product technologies: A review. Energy Build. 2017, 140, 188–195. [Google Scholar] [CrossRef]
  12. Biyik, E.; Araz, M.; Hepbasli, A.; Shahrestani, M.; Yao, R.; Shao, L.; Essah, E.; Oliveira, A.; Caño, T.D.; Rico, E.; et al. A key review of building integrated photovoltaic (BIPV) systems. Eng. Sci. Technol. Int. J. 2017, 20, 833–858. [Google Scholar] [CrossRef]
  13. Hwang, T.; Kang, S.; Kim, J.T. Optimization of the building integrated photovoltaic system in office buildings—Focus on the orientation, inclined angle and installed area. Energy Build. 2012, 46, 92–104. [Google Scholar] [CrossRef]
  14. Jayathissa, P.; Jansen, M.; Heeren, N.; Nagy, Z.; Schlueter, A. Life cycle assessment of dynamic building integrated photovoltaics. Sol. Energy Mater. Sol. Cells 2016, 156, 75–82. [Google Scholar] [CrossRef]
  15. Aaditya, G.; Mani, M. Climate-responsive integrability of building-integrated photovoltaics. Int. J. Low Carb Tech. 2013, 8, 271–281. [Google Scholar] [CrossRef]
  16. Ng, P.K.; Mithraratne, N.; Kua, H.W. Energy analysis of semi-transparent BIPV in Singapore buildings. Energy Build. 2013, 66, 274–281. [Google Scholar] [CrossRef]
  17. Radhi, H. Energy analysis of facade-integrated photovoltaic systems applied to UAE commercial buildings. Sol. Energy 2010, 84, 2009–2021. [Google Scholar] [CrossRef]
  18. Chae, Y.T.; Kim, J.; Park, H.; Shin, B. Building energy performance evaluation of building integrated photovoltaic (BIPV) window with semi-transparent solar cells. Appl. Energy 2014, 129, 217–227. [Google Scholar] [CrossRef]
  19. James, P.A.B.; Jentsch, M.F.; Bahaj, A.S. Quantifying the added value of BiPV as a shading solution in atria. Sol. Energy 2009, 83, 220–231. [Google Scholar] [CrossRef]
  20. Didoné, E.L.; Wagner, A. Semi-transparent PV windows: A study for office buildings in Brazil. Energy Build. 2013, 67, 136–142. [Google Scholar] [CrossRef]
  21. Zhang, W.L.; Lu, L.; Peng, J.Q.; Song, A.T. Comparison of the overall energy performance of semi-transparent photovoltaic windows and common energy-efficient windows in Hong Kong. Energy Build. 2016, 128, 511–518. [Google Scholar] [CrossRef]
  22. Peng, J.Q.; Curcijac, D.C.; Lu, L.; Selkowitzc, S.E.; Yang, H.X.; Mitchell, R. Developing a method and simulation model for evaluating the overall energy performance of a ventilated semi-transparent photovoltaic double-skin facade. Prog. Photovolt. 2016, 24, 781–799. [Google Scholar] [CrossRef]
  23. Olivieri, L.; Caamano-Martín, E.F.; Moralejo-Vazquez, F.J.; Martín-Chivelet, N.; Olivieri, F.; Neila-Gonzalez, F.J. Energy saving potential of semi-transparent photovoltaic elements for building integration. Energy 2014, 76, 572–583. [Google Scholar] [CrossRef] [Green Version]
  24. Cornaro, C.; Basciano, G.; Puggioni, V.; Pierro, M. Energy Saving Assessment of Semi-Transparent photovoltaic Modules Integrated into NZEB. Buildings 2017, 7. [Google Scholar] [CrossRef]
  25. Liao, W.; Xu, S. Energy performance comparison among see-through amorphous silicon PV (photovoltaic) glazings and traditional glazings under different architectural conditions in China. Energy 2015, 83, 267–275. [Google Scholar] [CrossRef]
  26. Lee, K.; Yoo, H.; Levermore, G.J. Generation of typical weather data using the ISO Test Reference Year (TRY) method for major cities of South Korea. Build. Environ. 2010, 45, 956–963. [Google Scholar] [CrossRef]
  27. Heo, Y. Bayesian Calibration of Building Energy Models for Energy Retrofit Decision-Making Under Uncertainty. Doctoral dissertation, Georgia Institute of Technology, Atlanta, GA, USA, 2011. [Google Scholar]
  28. Kim, S.T.; An, Y.S. Final Report of an Empirical Study on the Transparent Thin Film BIPV System; Kolon Global Co.: Incheon, Korea, 2012. [Google Scholar]
  29. Yoon, J.H.; Song, J.H.; Lee, S.J. Practical application of building integrated photovoltaic (BIPV) system using transparent amorphous silicon thin-film PV module. Sol. Energy 2011, 85, 723–733. [Google Scholar] [CrossRef]
  30. Yoon, J.H.; Shim, S.R.; An, Y.S.; Lee, K.H. An Experimental Study on the Annual Surface Temperature Characteristics of Amorphous Silicon BIPV Window. Energy Build. 2013, 62, 166–175. [Google Scholar] [CrossRef]
  31. Lee, H.M.; Yoon, J.H.; Kim, S.C.; Shin, U.C. Operational power performance of south-facing vertical BIPV window system applied in office building. Sol. Energy 2017, 145, 66–77. [Google Scholar] [CrossRef]
  32. EnergyPlus. EnergyPlus Engineering Reference. In The Reference to EnergyPlus Calculation. Available online: http://www.energyplus.gov (accessed on 31 September 2018).
  33. Winkelmann, F.C. Modeling windows in EnergyPlus. In Proceedings of the 7th International IBPSA Conference, Rio di Janeiro, Brazil, 13–15 August 2001. [Google Scholar]
  34. American Society of Heating, Refrigerating and Air-Conditioning Engineers, Inc. ASHRAE Standard 90.1 2016; American Society of Heating, Refrigerating and Air-Conditioning Engineers, Inc.: Atlanta, GA, USA, 2016. [Google Scholar]
  35. Karlsson, N. Air Infiltration through Building Entrances. Master’s Thesis, Chalmers University of Technology, Goteborg, Sweden, 2013. [Google Scholar]
  36. Lim, J.H.; Jo, J.H.; Lim, J.H.; Lee, B.Y. Research Review on the Infiltration Measurement and Calculation for the Building Entrance Door and Comparing Infiltration rate. J. KIAEBS 2013, 7, 135–142. [Google Scholar]
  37. Evola, G.; Margani, G. Renovation of apartment blocks with BIPV: Energy and economic evaluation in temperate climate. Energy Build. 2016, 130, 794–810. [Google Scholar] [CrossRef]
  38. Kang, E.C. A Study on Annual Performance Evaluation for Building Integrated Air to Air Heat Pump System. Doctoral dissertation, Chungnam National University, Daejun, Korea, 2015. [Google Scholar]
  39. Sohn, B.H.; Kwon, H.S. Performance Prediction on the Application of a Ground-Source Heat Pump (GSHP) System in an Office Building. Korean J. Air-Cond. Refrig. Eng. 2014, 26, 409–415. [Google Scholar] [CrossRef]
  40. The Korean Ministry of Trade, Industry and Energy. Regulation on Promoting the Supply of High-efficiency Energy Equipment; The Korean Ministry of Trade, Industry and Energy: Gwacheon, Korea, 2018.
  41. The Korean Ministry of Trade, Industry and Energy. Regulation on the Energy Efficiency Rating Certification System for Buildings; The Korean Ministry of Trade, Industry and Energy: Gwacheon, Korea, 2017.
Figure 1. Outer and inner surfaces of an office building using amorphous (a)-Si building-integrated photovoltaic (BIPV) windows.
Sustainability 10 04856 g001
Figure 2. Specifications of the a-Si photovoltaic (PV) module used in this study.
Sustainability 10 04856 g002
Figure 3. EnergyPlus simulation model (A) and perspective view (B).
Sustainability 10 04856 g003
Figure 4. Photovoltaic (PV) power generated on south- and east-facing a-Si BIPV windows.
Sustainability 10 04856 g004
Figure 5. Monthly power consumption measured in the office building.
Sustainability 10 04856 g005
Figure 6. Measured vs. simulated data of power consumed by lighting and equipment.
Sustainability 10 04856 g006
Figure 7. Measured vs. simulated data for monthly power consumption.
Sustainability 10 04856 g007
Figure 8. Monthly heating and cooling load at baseline operating conditions.
Sustainability 10 04856 g008
Figure 9. Annual heating and cooling loads at baseline operating conditions.
Sustainability 10 04856 g009
Figure 10. Heat gain (loss) at base operating conditions: (A) window heat gain and (B) solar heat gain.
Sustainability 10 04856 g010
Figure 11. Heating and cooling load for operation time cases.
Sustainability 10 04856 g011
Figure 12. Heating and cooling load for temperature setting cases.
Sustainability 10 04856 g012
Figure 13. Heating and cooling load for entrance air infiltration cases.
Sustainability 10 04856 g013
Figure 14. Heating and cooling loads given changes in internal load.
Sustainability 10 04856 g014
Figure 15. Heating and cooling loads for cases of mixed operation conditions.
Sustainability 10 04856 g015
Figure 16. Annual heat gains in cases of mixed operation conditions.
Sustainability 10 04856 g016
Figure 17. Primary energy consumption of different heating and cooling systems.
Sustainability 10 04856 g017
Table 1. Specifications of the office building studied.
LocationDaegu, Korea (35.84° N, 128.62° E)
Purpose of the buildingSales, corporate space
Total area (m2)3944.2
Floors 3–5Area (m2)682.8
Public zone (m2)175.5
Office zone (m2)507.2
Total stories1 underground floor, 5 above ground
Table 2. U-value of exterior wall and roof.
DivisionMaterialU-Value
Exterior wall6 mm metal cladding + 87 mm Polystyrene + 13 mm gypsum board0.354
Roof19 mm asphalt + 122 mm Polystyrene + 13 mm fiber board0.252
Table 3. Internal loads of the simulation building model.
Load TypeZoneValue
Light (W/m2)Public zone3
Office zone4
Equipment (W/m2)Office zone6
Occupancy (m2/person)Office zone9
Table 4. Properties of glass used for comparison of window models.
CLa-SiTILE
IGDB NameGeneric CLEAR Not included KCC SOLAR 6T Generic LoE CLEAR
Thickness (mm) 61066
Conductivity (W/m·K)0.9001.0001.0000.900
Solar transmittance0.7750.0810.3750.600
Outside solar reflectance0.0710.2220.0540.170
Inside solar reflectance0.0710.203 0.0540.220
Visible transmittance0.8810.0820.7020.840
Outside visible reflectance0.0800.100.0700.055
Inside visible reflectance0.0800.1660.0700.078
Infrared (IR) transmittance0.0000.0000.0000.000
IR outside emissivity0.8400.8400.8370.840
IR inside emissivity0.8400.8400.8370.100
Table 5. Specifications of the double-layer window models used in the simulation.
WindowTypeConfigurationU-ValueSolar Heat Gain CoefficientTvis
CL24Clear glazingClear + clear2.6850.7030.781
BIPVWindow model applied to actual office building: mixture of ASI28 + CL24
TI24Heat-absorbing glazingTinted + clear2.6870.4350.618
LE24Low-emissivity (low-e) glazingSingle low-e + clear1.7710.5680.745
ASI28a-Si glazinga-Si (10 mm) + clear2.6620.1890.073
Table 6. Proposed cases for simulating building operating conditions.
Variable Case 1 Case 2 Case 3 Case 4
Operation time09:00–17:00
(8 h)
09:00–18:00
(9 h)
08:30–18:30
(10 h)
08:30–19:30
(10 h)
Temperature setting Heating: 20 °C
Cooling: 26 °C
Heating: 22 °C
Cooling: 26 °C
Heating: 22 °C
Cooling: 24 °C
Heating: 24 °C
Cooling: 24 °C
Entrance air Infiltration (ACH) 0.51.01.52.0
Internal load Lights/equip.: 10 W/m2
Occupants: 0.11 person/m2
Lights/equip.: 15 W/m2
Occupants: 0.15 person/m2
Lights/equip.: 20 W/m2
Occupants: 0.20 person/m2
Lights/equip.: 25 W/m2
Occupants: 0.25 person/m2
Table 7. Coefficients of performance (COP) of heating and cooling systems.
Heating and Cooling SystemHeating COPCooling COP
Heating and cooling electric heat pumps (EHPs)2.272.51
Ground source heat pump3.374.28
Gas boiler + cooling EHP0.882.51
Table 8. Primary energy conversion factors for Korea.
Energy SourcePrimary Energy Conversion Factor
Fuel1.1
Electricity2.75
District heating0.728
District cooling0.937

