Review of the Transit Accessibility Concept: A Case Study of Richmond, Virginia
_Chen.png)
1
Urban and Regional Studies and Planning Program, L. Douglas Wilder School of Government and Public Affairs, Virginia Commonwealth University, Richmond, VA 23284, USA
2
Department of Urban Planning and Design, Xi’an Jiaotong-Liverpool University, Suzhou 215123, China
Sustainability 2018, 10(12), 4857; https://0-doi-org.brum.beds.ac.uk/10.3390/su10124857
Submission received: 24 October 2018
/
Revised: 10 December 2018
/
Accepted: 11 December 2018
/
Published: 19 December 2018
(This article belongs to the Special Issue Sustainable Urban Land Use and Transportation)
Abstract
:This study reviews the transit accessibility concept and describes its empirical application in Richmond, Virginia, USA. The transit accessibility concept involves multiple components. Each component has several measures; the selection of which measure to use depends on unique local circumstances. Geographic Information Systems (GIS) and statistical tools are utilized in this study. It has been found that, although the Greater Richmond Transit Company (GRTC) provides a reasonably good transit service inside Richmond City, its existing hub-and-spoke transit system is not aligned well with new and complex travel patterns (including suburb-to-suburb travel patterns), and thus needs to be restructured in the near future.
1. Introduction
In the existing transportation literature, accessibility has become a very important concept with diverse definitions, measurements, and evaluation criteria. Compared to the concept of mobility, the concept of accessibility is more inclusive, capturing both land use and transportation effects.
In general, due to its speed, flexibility, and convenience, automobiles provide a higher level of accessibility than transit. However, due to various legal mandates and sustainable development requirements, transit is still an important mode that cannot be neglected. In particular, transit accessibility to jobs (i.e., journey to work) is of critical importance in alleviating poverty of transit-captive riders. The welfare to work policy has become a hot button issue after the enactment of the Personal Responsibility and Work Opportunity Reconciliation Act of 1996 (PRWORA) by the U.S. Congress, which has elicited numerous scholarly publications. One of the major challenges to meeting PRWORA’s legal mandates is how to connect welfare recipients to the labor market. Many transportation studies have found that transportation inaccessibility to jobs has hindered the employability and income levels for the poor in general and for welfare recipients in particular [1,2,3,4,5,6,7,8].
Currently, there are scores of transit accessibility indices, each of which has different data requirements, methodological approaches, strengths/weaknesses, and application areas. Although there are plenty of studies on transit accessibility in the literature, the following research areas still need to be strengthened: first, the relationship among different transit accessibility indices should be more carefully examined. Otherwise, different transit accessibility indices may yield starkly different results. For example, according to Tomer et al. (2011), the Richmond metropolitan area in Virginia ranks very low (95/100) in the U.S. metropolitan regions in terms of share of working-age residents with access to transit [9]. However, the Greater Richmond Transit Company (GRTC), which is the major transit operator in the Richmond region, has been recognized as one of the most efficient transit companies in North America by the American Public Transportation Association (APTA). These two findings seem contradictory and must be carefully examined in order to comprehend their differences. In particular, it is unclear how APTA defined the concept of transit efficiency. Second, compared to spatial dimension, temporal dimension of transit accessibility has relatively lightly been studied and thus requires a special attention. Finally, both the supply side and the demand side of transit accessibility need to be considered simultaneously. This paper seeks to address all these three areas.
Following the above introduction, this paper contains an additional three sections: Section 2 conducts a literature review of the transit accessibility concept, with an emphasis placed on transit’s job access capability; Section 3 describes the empirical application of three major transit accessibility indices and one newly developed index in Richmond, Virginia, USA; and Section 4 draws conclusions.
2. Literature Review
Accessibility is a measure of “the ease with which activities at one place may be reached from another via a particular travel mode” [10]. There exists a close relationship among mobility, proximity, connectivity, and accessibility [11]. In this literature review, the terms “accessibility” and “access” are used interchangeably, even though “accessibility” normally refers to a location, whereas “access” is more related to an individual.
2.1. Classification of Transit Accessibility
Transit accessibility can be classified along different dimensions or into different categories, such as:
By destinations’ activity types: access to jobs or employment; access to shopping; access to schools; access to recreation and entertainment; and many others;
By spatial dimensions: access to/egress from transit stops (called local accessibility or system accessibility); and line-haul travel between a boarding transit stop and an alighting transit stop (called network accessibility or system-facilitated accessibility) [12,13,14];
By temporal dimensions: peak hour or period accessibility; and off-peak hour or period accessibility [15];
By components: land use; transportation; temporal; and individual components [16]. Both land use components and transportation components include supply side and demand-side. The value of a transit accessibility measure depends not only on its accuracy in capturing spatial-temporal coverage, but also on its ability to capture activity demand. The land use component also considers demand potential and competition effects [17].
Furthermore, one can also calculate time-averaged accessibility, person-weighted accessibility, cumulative opportunity accessibility, and others [18]. When calculating the weighted average of accessibility, following Levinson and Kumar (1994), the nearby destinations are normally given more weight [19].
2.2. Measuring Local Transit Accessibility
Spatially, local transit accessibility means the ease of accessing transit stops or routes from either a trip origin or a trip destination.
According to Bhat et al. (2006), estimation of local spatial transit accessibility primarily involves two steps: Step 1: identifying service area; and Step 2: identifying population served. Both steps involve the use of Geographic Information System (GIS) technology [12].
Though seemingly straightforward, the actual calculating process can be quite tricky. For example, a service area buffer could be built around a transit stop (point feature) or along a transit route (line feature). Transit stop buffers seem to make more sense, because people get on and off only at a transit stop. The buffering distance could be based on either the straight line (i.e., Euclidean distance), or the network distance (i.e., Manhattan distance). Determining service area population could be based on the area ratio, network ratio, or distance decay approaches [15,20,21,22,23,24]. Each approach would yield different results.
By utilizing the bus, train and ferry data provided by the Auckland Regional Transport Authority, New Zealand, Mavoa et al. (2012) calculated a Public Transit and Walking Accessibility Index (PTWAI), which quantifies potential access from land parcels to destinations by the means of public transit and walking modes [25].
In addition to spatial dimension, temporal dimension is also critically important to consider. Unfortunately, most studies thus far have been completed on the spatial dimension, rather than the temporal dimension, of transit accessibility, due to data availability. Local temporal transit accessibility reinforces transit availability from the time’s perspective, the calculation process of which is relatively more complex. For example, Ryus et al. (2000) came up with the transit level-of-service (TLOS) indicator which is equal to the product of the % of the people in zone j with access to transit stop and the % of the time the transit service is available within an hour. TLOS is thus measured by % of person-minutes served for zone j by stop i [23]. Polzin et al. (2002) defined “temporally weighted service availability of route i during service period p”, which involves three factors: (1) service frequency of route i in period p; (2) tolerable wait time on route i in period p; and (3) fraction of daily travel demand that falls within period p [15]. From this author’s point of view, this is perhaps one of the few studies that really take into account the travel demand’s time-of-day distribution, reflecting the relative value of the transit service.
With regard to the evaluation of transit service quality, “Transit Capacity and Quality of Service Manual (TCQSM)” suggests the simultaneous consideration of the spatial and temporal dimensions of transit service. The following factors should be included: (1) transit service frequency or headway; (2) transit service span; and (3) transit service area [26].
Developed in London, U.K., the Public Transport Accessibility Level (PTAL) index takes into consideration both the spatial and temporal dimensions [27,28] by: (1) calculating the scheduled waiting time (SWT); (2) a mode-specific reliability factor to generate the average waiting time (AWT). Total access time = AWT + Initial Walk Time from any point to a transit access point.
Farber et al. (2014) studied the issue of public transit access from each Cincinnati census block to the nearest Cincinnati supermarkets (Ohio) utilizing the General Transit Feed Specification (GTFS) data and ArcGIS tools. The transit network data came from the Southwest Ohio Regional Transit Authority (SORTA) and the Transit Authority of Northern Kentucky (TANK) [29].
The job accessibility measure can also take the form of zonal-level gravity-type indicator [30]:
where:
- Oj = the number of jobs in TAZj;
- Cij = the network distance between TAZi and TAZj;
- β = 0.1.
2.3. Measuring Network Transit Accessibility
This is typically used in the route- or system-level analysis, measuring the line-haul connectivity between two transit stops.
Hillman and Pool (1997) proposed an indicator of aggregated total transit travel time that considers the transit travel time of each segment between an origin-destination (O-D) pair [27]. Based on their work, Schoon et al. (1999) further came up with an accessibility index (AI) which compares travel times of different modes between an O-D pair without applying any weights [33].
Fu et al. (2005) compared transit travel time with auto travel time, and apply the time period-specific travel demand as weights. The weighted travel times for all time periods are then summed together to yield all-day travel demand [34].
Koskinen et al. (2005) calculated the individual measures for each O-D pair, which considers several factors: transit travel time components, transit/auto travel time ratio, speed, headway, boarding figure, and service coverage [35].
Bhat et al. (2006) took the utility-based approach to developing transit accessibility indices (TAI), which includes two steps: (1) O-D Specific Transit Accessibility Measure (TAM); and (2) Aggregation of Transit Accessibility Measures [12].
Alam (2009) proposed a transit accessibility to jobs index from any origin TAZi to any destination TAZj, which equals: (1) the sum of total transit travel time, total car travel time, highway distance between TAZi and TAZj as the crow flies; (2) weighted by the sum of population, population density, jobs, job density, and other factors [36].
Using interzonal commuting pattern data, Widener et al. (2013) devised an indicator to measure the access levels to food vendors in the Cincinnati region [37].
2.4. Measuring Composite Transit Accessibility
In addition to the above individual transit accessibility measures, there are other composite measures as well. For instance, the Local Index of Transit Availability (LITA) integrates three transit service-related factors: route coverage, frequency, and capacity. Utilizing data provided by the Sacramento-based Local Government Commission, Rood (1998) calculated three scores of route coverage, frequency, and capacity. Each score is then standardized across all the traffic analysis zones to give a measure of accessibility. The final LITA score is the average of the three standardized scores, plus 5, ranging from 1 to 10 [38].
Based on their literature review, Mamun et al. (2011) chose three methods of measuring accessibility, and then proposed weighting factors for individual method to come up with a composite measure for a case study in Meriden, Connecticut [39].
2.5. A Special but Important Case: Measuring Transit Accessibility to Jobs
There are many ways to measure job accessibility, depending on unique local circumstances [40,41,42].
Conceptually, employment connectivity models have three subsystems: worker, mode of transport, and job. Each subsystem has spatial and non-spatial attributes which influence the overall accessibility [43]. Wang and Chen (2015) examined the degree of spatial autocorrelation, or geographic dependency, between census block groups [44].
In the study of Owen and Levinson [18,45], transit accessibility to jobs is calculated minute by minute during the 7:00–9:00 a.m. morning peak period as a potential departure time and can be used in estimating the aggregate commute mode share. The technical report of “Access across America: Transit 2014” estimates the transit accessibility to jobs in the top 46 most populous American metropolitan areas (note: due to data issues, a few metropolitan areas were excluded, such as Jacksonville, Memphis, Oklahoma City, and Richmond) using transit schedules in January 2014 [45].
It is also recognized that modeling job accessibility requires a more detailed look at socioeconomic factors which impact employability and a more narrowly defined spatial scale which focuses on employment centers and the associated attributes linked to employee selection such as educational attainment level, skill level, and reliability of prospective employees. Redressing the issues of accessibility requires the inclusion of transit dependability as well as connectivity [43].
Despite the above efforts and progresses made in measuring transit accessibility to jobs, some scholars remain dubious about its effects. They feel that transit may be a poor choice in providing access to jobs. For example, Thompson (1997) used data in Dade County, Florida to conduct a transit accessibility study which did not demonstrate a strong relationship between public transit accessibility and employment locations [46].
Sanchez (1999) conducted a comparative study on labor participation rates of Portland and Atlanta. Using average annual weeks worked (by the 1990 U.S. Census) as indicators of labor participation rates, he compares the labor participation rates for residents living within walking distances of transit stops to those for residents not living within walking distances in Portland and Atlanta, respectively. Transit access was calculated for both whites and nonwhites. His study results did not yield the finding that improving public transit access would yield better urban employment [47].
According to [48], while many scholars concurred that transit is important in alleviating poverty and unemployment issues, current transit access to job opportunities remains uneven among different social groups [2,49,50,51]. Thus far, while few case studies empirically support the notion that transit accessibility has a strong and positive correlation with employment [52,53], many studies actually revealed little or no association between transit accessibility and employment [3,54,55,56].
3. Empirical Application of Transit Accessibility Indices in Richmond, Virginia
This section demonstrates an empirical application of selected transit accessibility indices in Richmond, Virginia.
3.1. Richmond City: Facts at a Glance
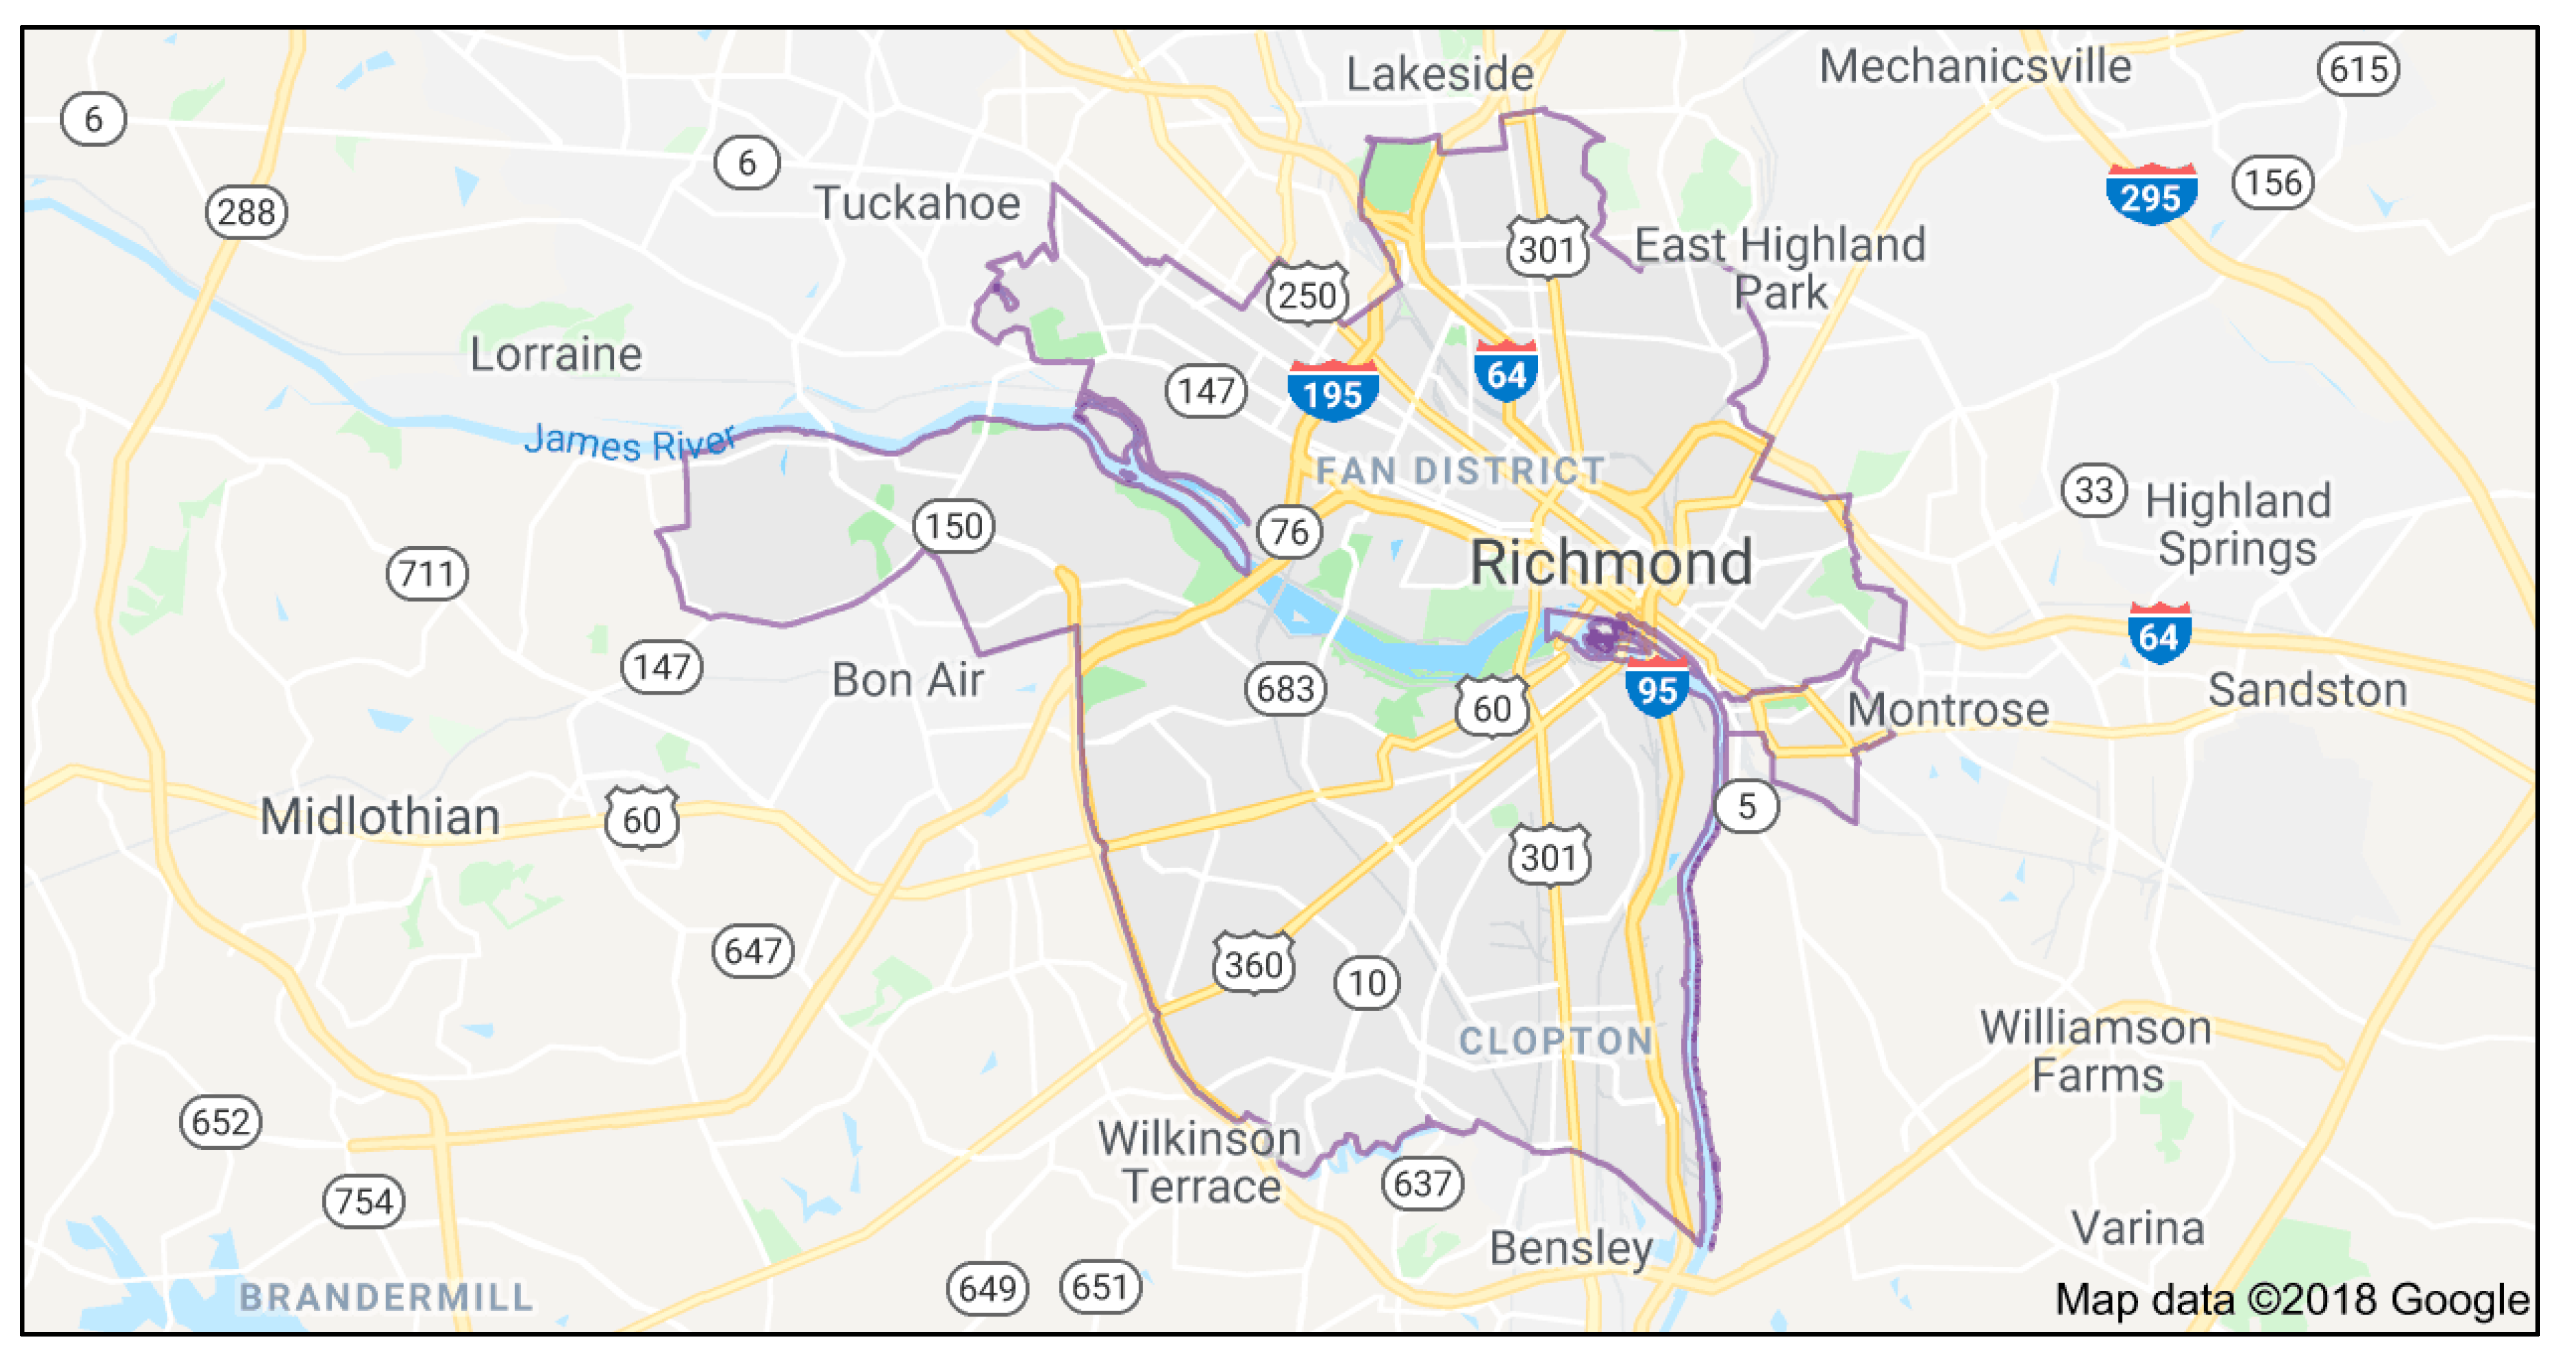
As the capital city of the state of Virginia, with a total population of 204,214 in 2010, Richmond City is located at the intersection of I-95 and I-64 freeways (Shown in Figure 1), which is approximately 100 miles south of Washington, D.C.
Within the boundary of Richmond City, the majority of the population is clustered around the Central Business District (CBD), and the Fan District and Museum District to the west of CBD. The population density distribution in Richmond City is illustrated in Figure 2 [58].
Compared to other Virginian cities, Richmond is a relatively low-income city. According to the 2012–2016 American Community Survey 5-year estimated data, in 2016, the median household income for the Richmond City residents was $41,187, with 25.4% of them living below the poverty threshold set by the federal government, whereas the Virginian average was $66,149 with a 11.4% average poverty rate [59].
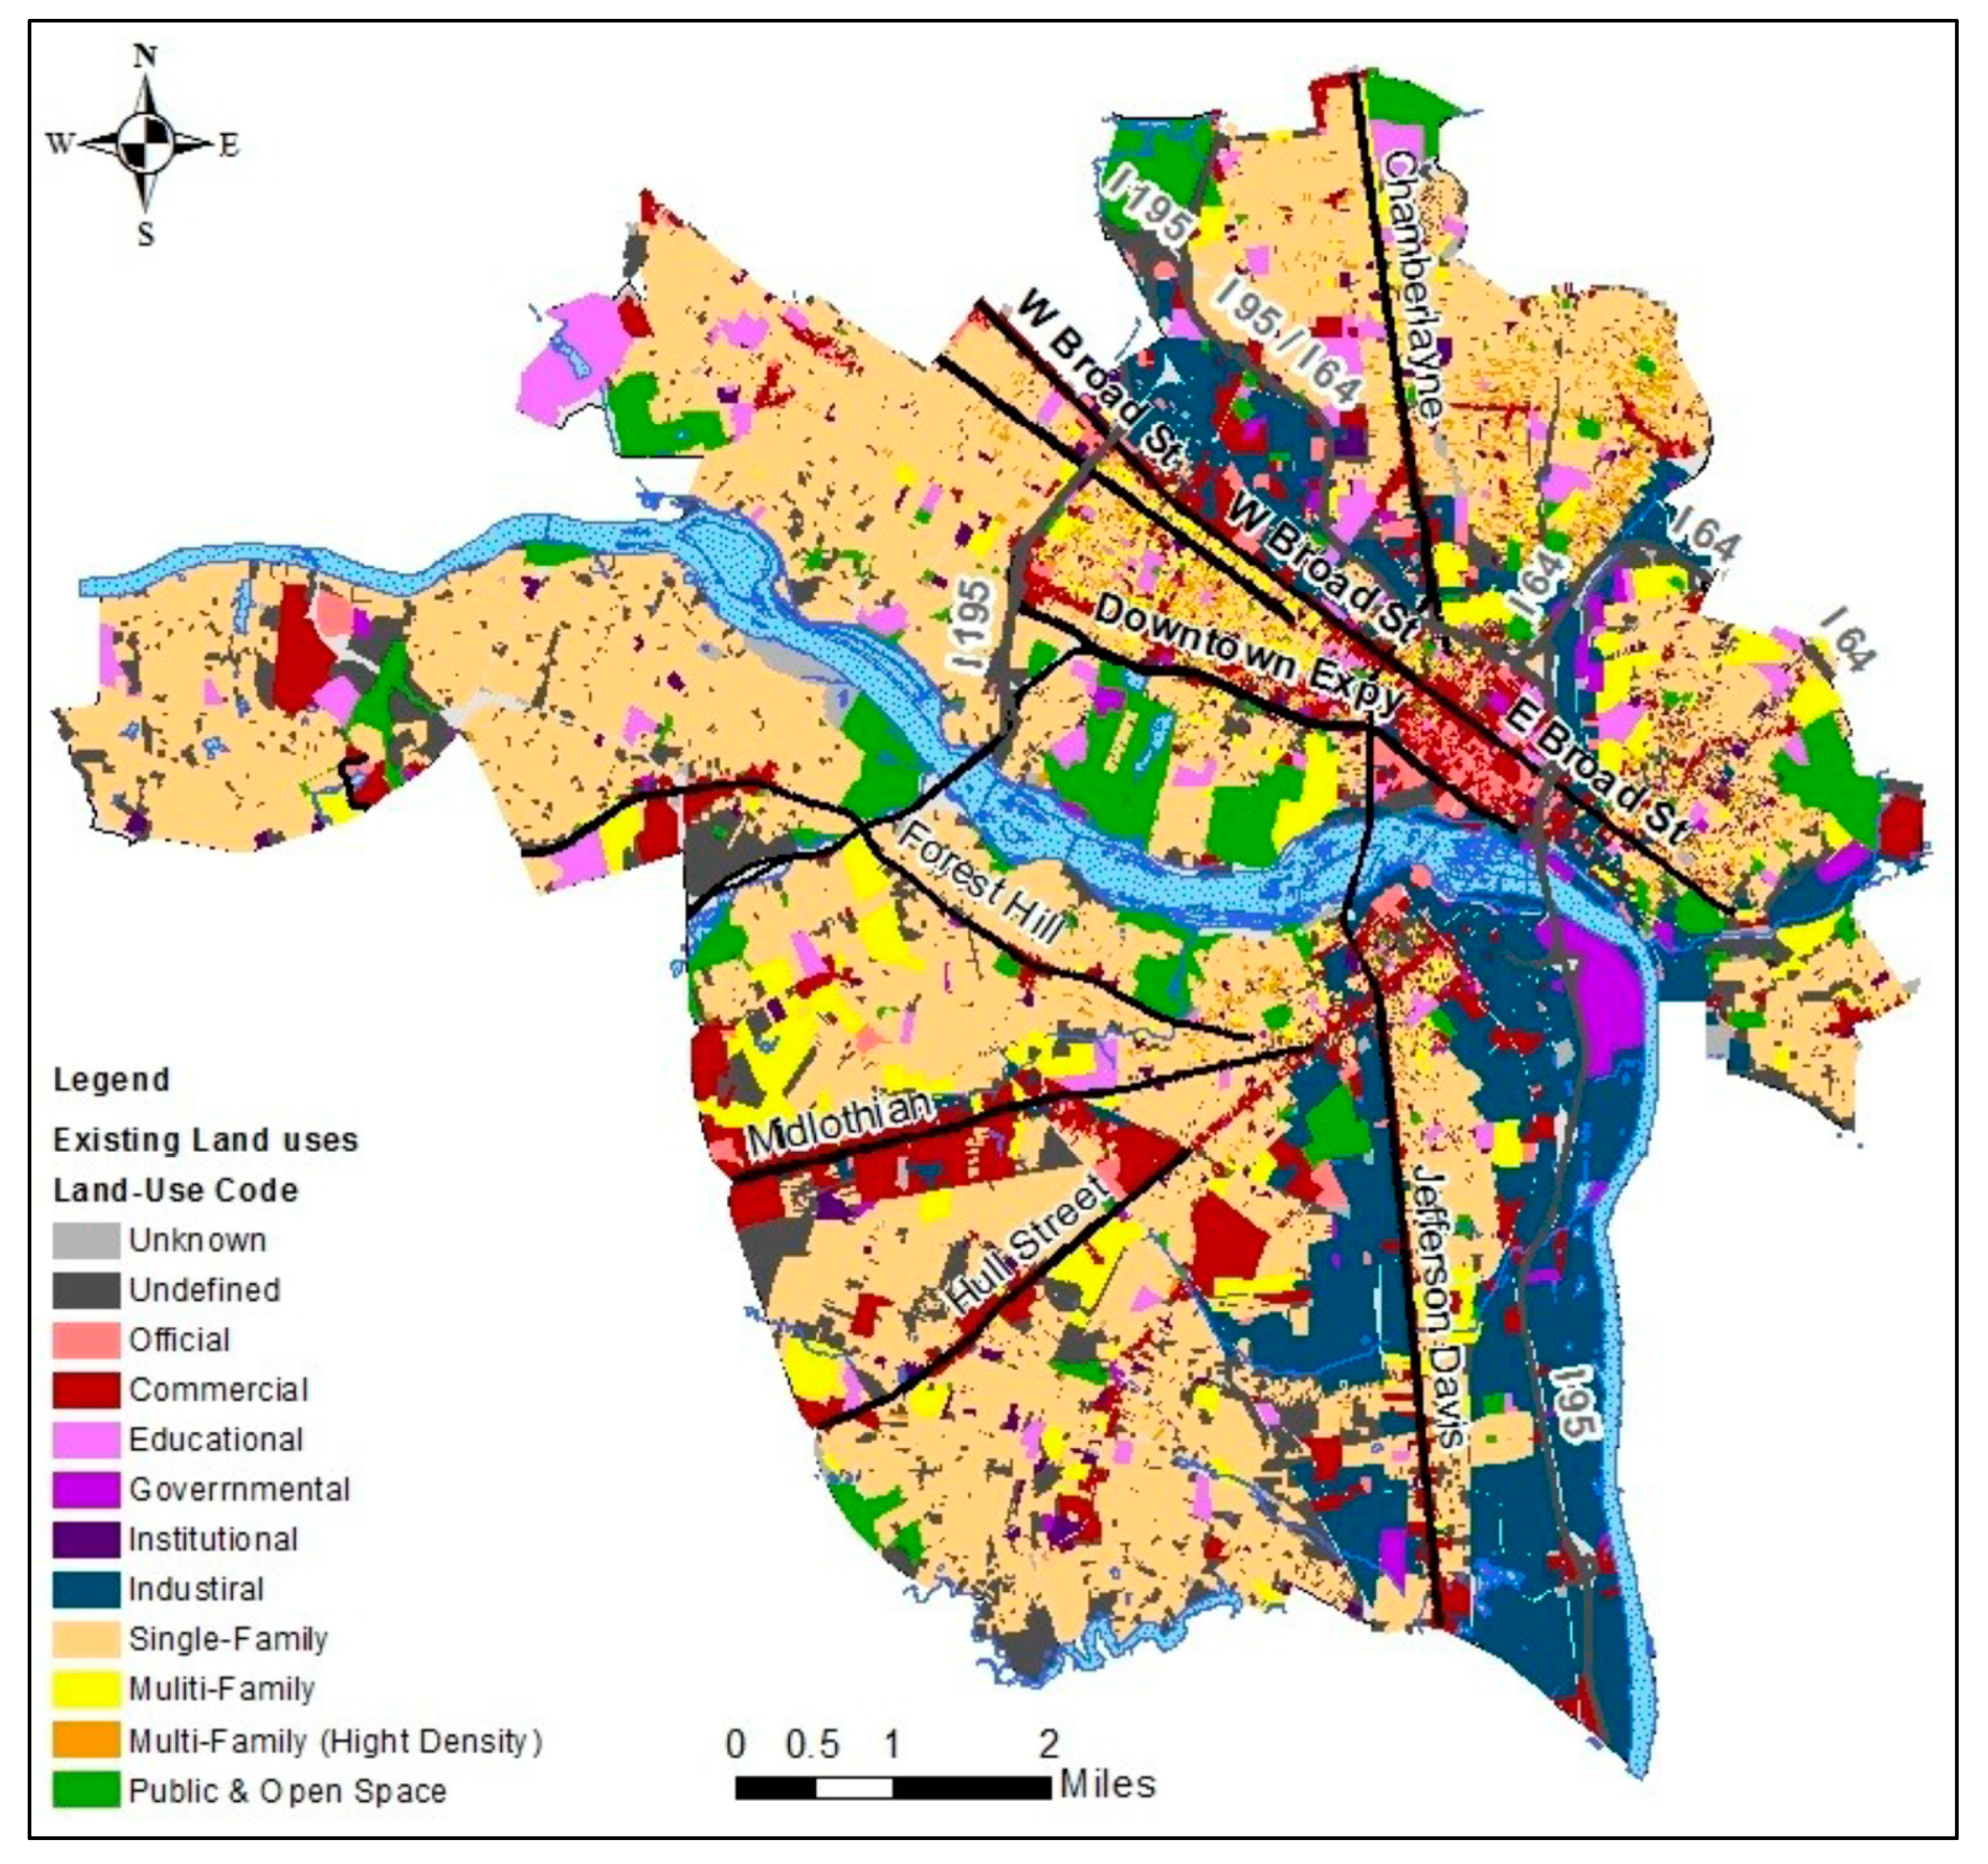
As shown in Figure 3, downtown Richmond has mostly commercial and office land uses. Throughout the city, the commercial land uses are located along several major corridors, such as West and East Broad Streets, Belvidere Boulevard, I-95, I-64, and I-195. On the south side of the city, the commercial functions are found primarily along Midlothian Turnpike, Hull Street, and Jefferson Davis Highway. Most industrial and residential land uses are found outside of the downtown area.
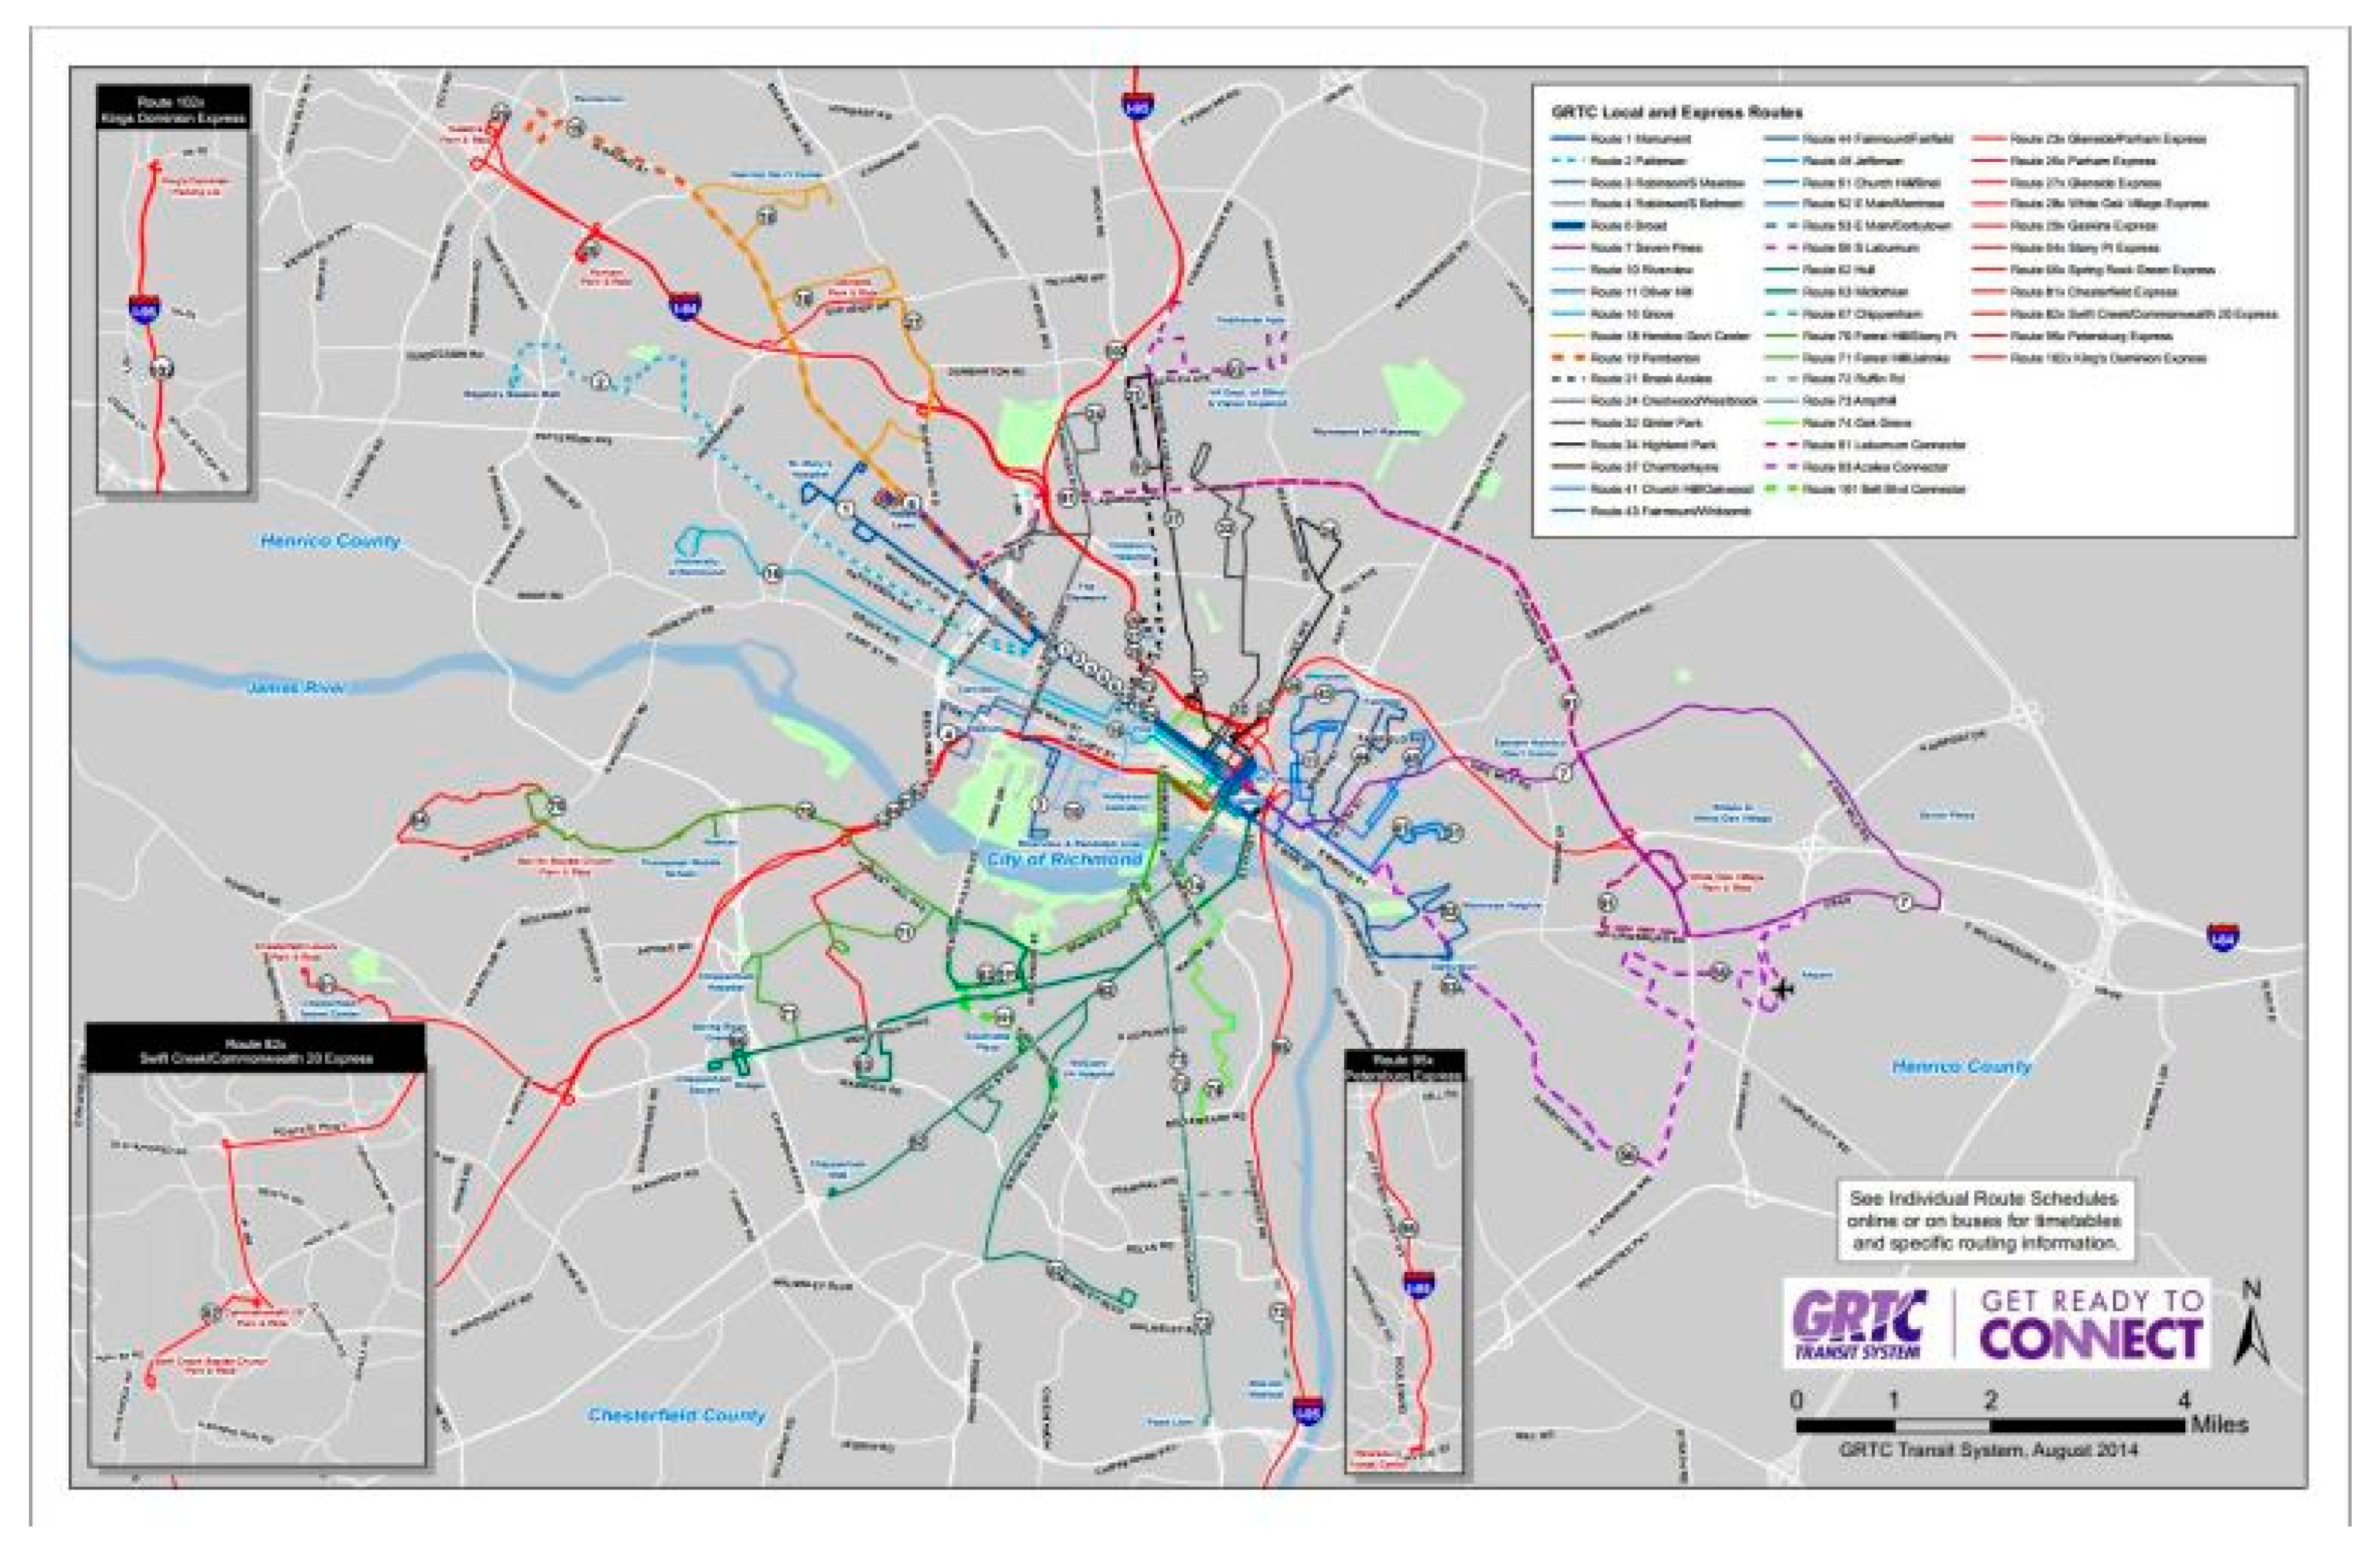
According to Chen and Suen (2010), the Greater Richmond Transit Company (GRTC), possessing the service area of 227 mile2 and 449,572 residents, is the major transit operator serving the Richmond region. In particular, Richmond City, which is the central city of the Richmond region, has more than 80% of the GRTC ridership. GRTC’s hub-and-spoke fixed-route bus service network consists of a fleet of about 186 buses travelling over 36 routes within the City of Richmond, Counties of Henrico, Chesterfield, and City of Petersburg. Most bus routes are downtown-bound [60].
According to Tomer et al. (2011), the vast majority of the low-skilled jobs in the Richmond metropolitan region (63% of a total of 215,564 jobs) are not accessible via transit, which is provided by the Greater Richmond Transit Company (GRTC). Within a quarter mile buffer of the four major transportation corridors (Route 1, Route 60, Route 250, and Route 360) in the Richmond Region, there are 71,400 low-skilled (Tier 1) jobs that are currently not serviced by GRTC [61] and the Richmond metropolitan area ranks No. 95 out of the 100 metropolitan areas in the U.S. in terms of share of working-age residents with access to transit [9]. Transit’s inaccessibility to jobs has apparently aggravated the severity of the existing poverty crisis.
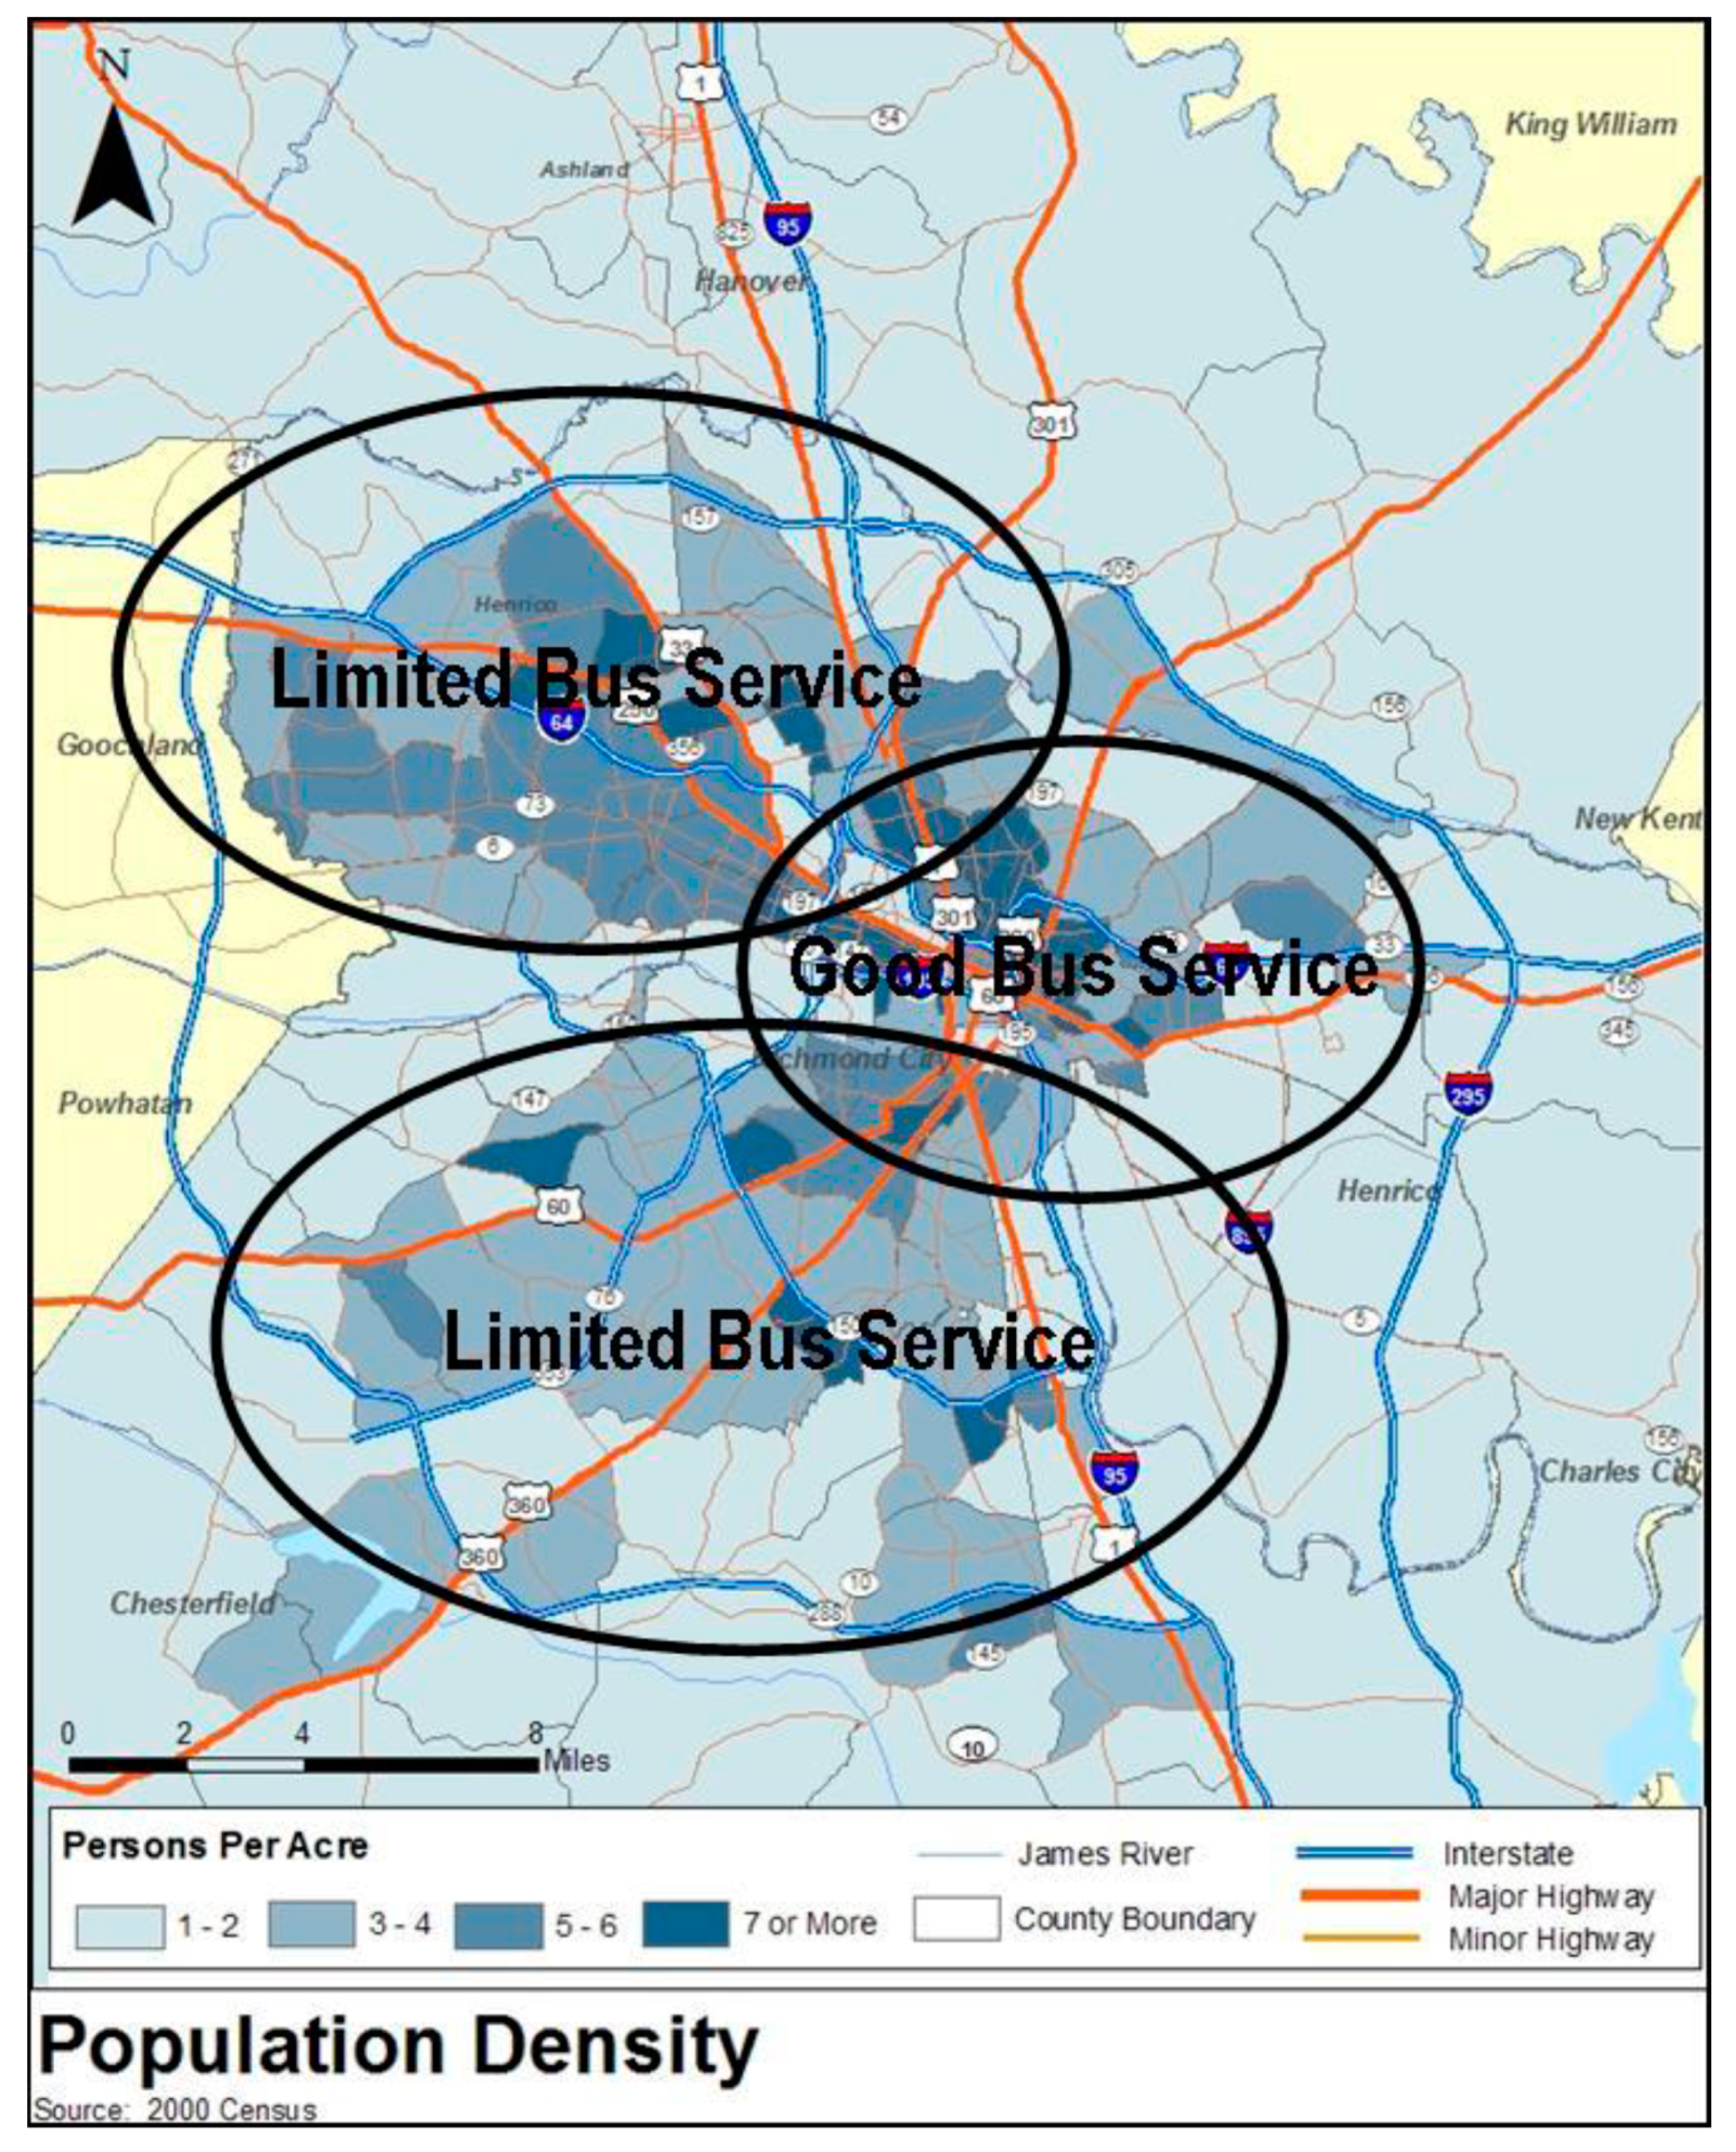
Moreover, Richmond’s transit system operation has the following severe issues: (1) an increasing incompatibility of the existing hub-and-spoke transit network with the future travel pattern due to the on-going suburbanization movement and increasing suburb-to-suburb travels (Figure 4); (2) lack of transit services in some high transit-demand areas (Figure 5); (3) absence of high-capacity transit facilities along key corridors except Broad Street; and (4) limited funding/jurisdictional support for upgrading transit services. Because of these issues, the transit modal share has been declining in Richmond. According to the Richmond Regional Planning District Commission (2008), the number of commuters that drove alone to work rose from 78% modal share in 1990 to 82% modal share in 2000. Meanwhile, the percentage of public transit use declined from 4% in 1990 to 2% in 2000 [58].
3.2. Transit Accessibility Indices Used
Based on the literature review and data availability, this study selects and applies the following three existing transit accessibility indices to the traffic analysis zones (TAZs) within Richmond City as a starting point of calculation:
In addition, as a contribution to the existing literature, this paper develops a new transit accessibility index, TransitTimeStand, which is derived from the walk-to-bus transit skims (i.e., transit travel time) from the Richmond/Tri-Cities model of Virginia Department of Transportation (VDOT). For all TAZs within Richmond City, the following list of variables are used:
- 1_Ride_T: sum of total in-bus time from one TAZ to all other TAZs;
- 2_Wait_T: sum of total waiting times from one TAZ to all other TAZs;
- 3_Walk_T: sum of total walking times from one TAZ to all other TAZs;
- Total_T = 1_Ride_T + 2_Wait_T + 3_Walk_T;
- TransitTimeStand: standardized score of Total_T.
After calculating the TAZ-specific standardized scores of walk-to-bus transit skims (TransitTimeStand), this paper conducts a regression analysis between this dependent variable (TransitTimeStand) and other explanatory variables. Based on the existing data availability, the six explanatory variables are included as independent variables. Table 1 shows the list of variables and their definitions.
Finally, this section will also calculate the correlational relationship among these four TAZ-based transit accessibility indices (LITA, TCQSM, Time-of-Day-Based Transit Accessibility Analysis Tool, and TransitTimeStand).
3.3. Calculation Processes and Results
3.3.1. LITA Calculation
As stated above, LITA combines three aspects of service: route coverage (spatial availability), frequency (temporal availability), and capacity (comfort and convenience) [38]. They are calculated for Richmond City as follows:
First, route coverage score is determined by the number of bus stops in a TAZ divided by its land area in square miles. Within the boundary of Richmond City, there are 216 TAZs (based on the old 2000 census geography) and 1,583 GRTC local bus stops;
Second, frequency score is defined as the total daily number of buses traversing the zone. GRTC currently has 37 local bus routes traversing the City, with a total of 1,988 daily trips (bus frequencies);
Third, capacity score is measured by per capita seat-miles, which is calculated as total daily seats on a transit line [which is vehicle capacity (34 seats/bus is assumed for an average GRTC bus) multiplied by number of vehicles per day] multiplied by route-miles of transit line in zone, which is then divided by the sum of the total resident population plus employment. In other words, per capita bus capacity = total seat miles/person.
The overall LITA score is the average of the three standardized scores plus 5.5, which is added to the overall score so that the score is positive and has a range of values from 1 to 10.
Figure 6 shows that downtown Richmond has the most bus transit services, followed by major corridors radiating out from the downtown area. Bus services are generally lacking in the outlying west and southwest portions of Richmond City.
3.3.2. Transit Capacity and Quality of Service Manual (TCQSM)
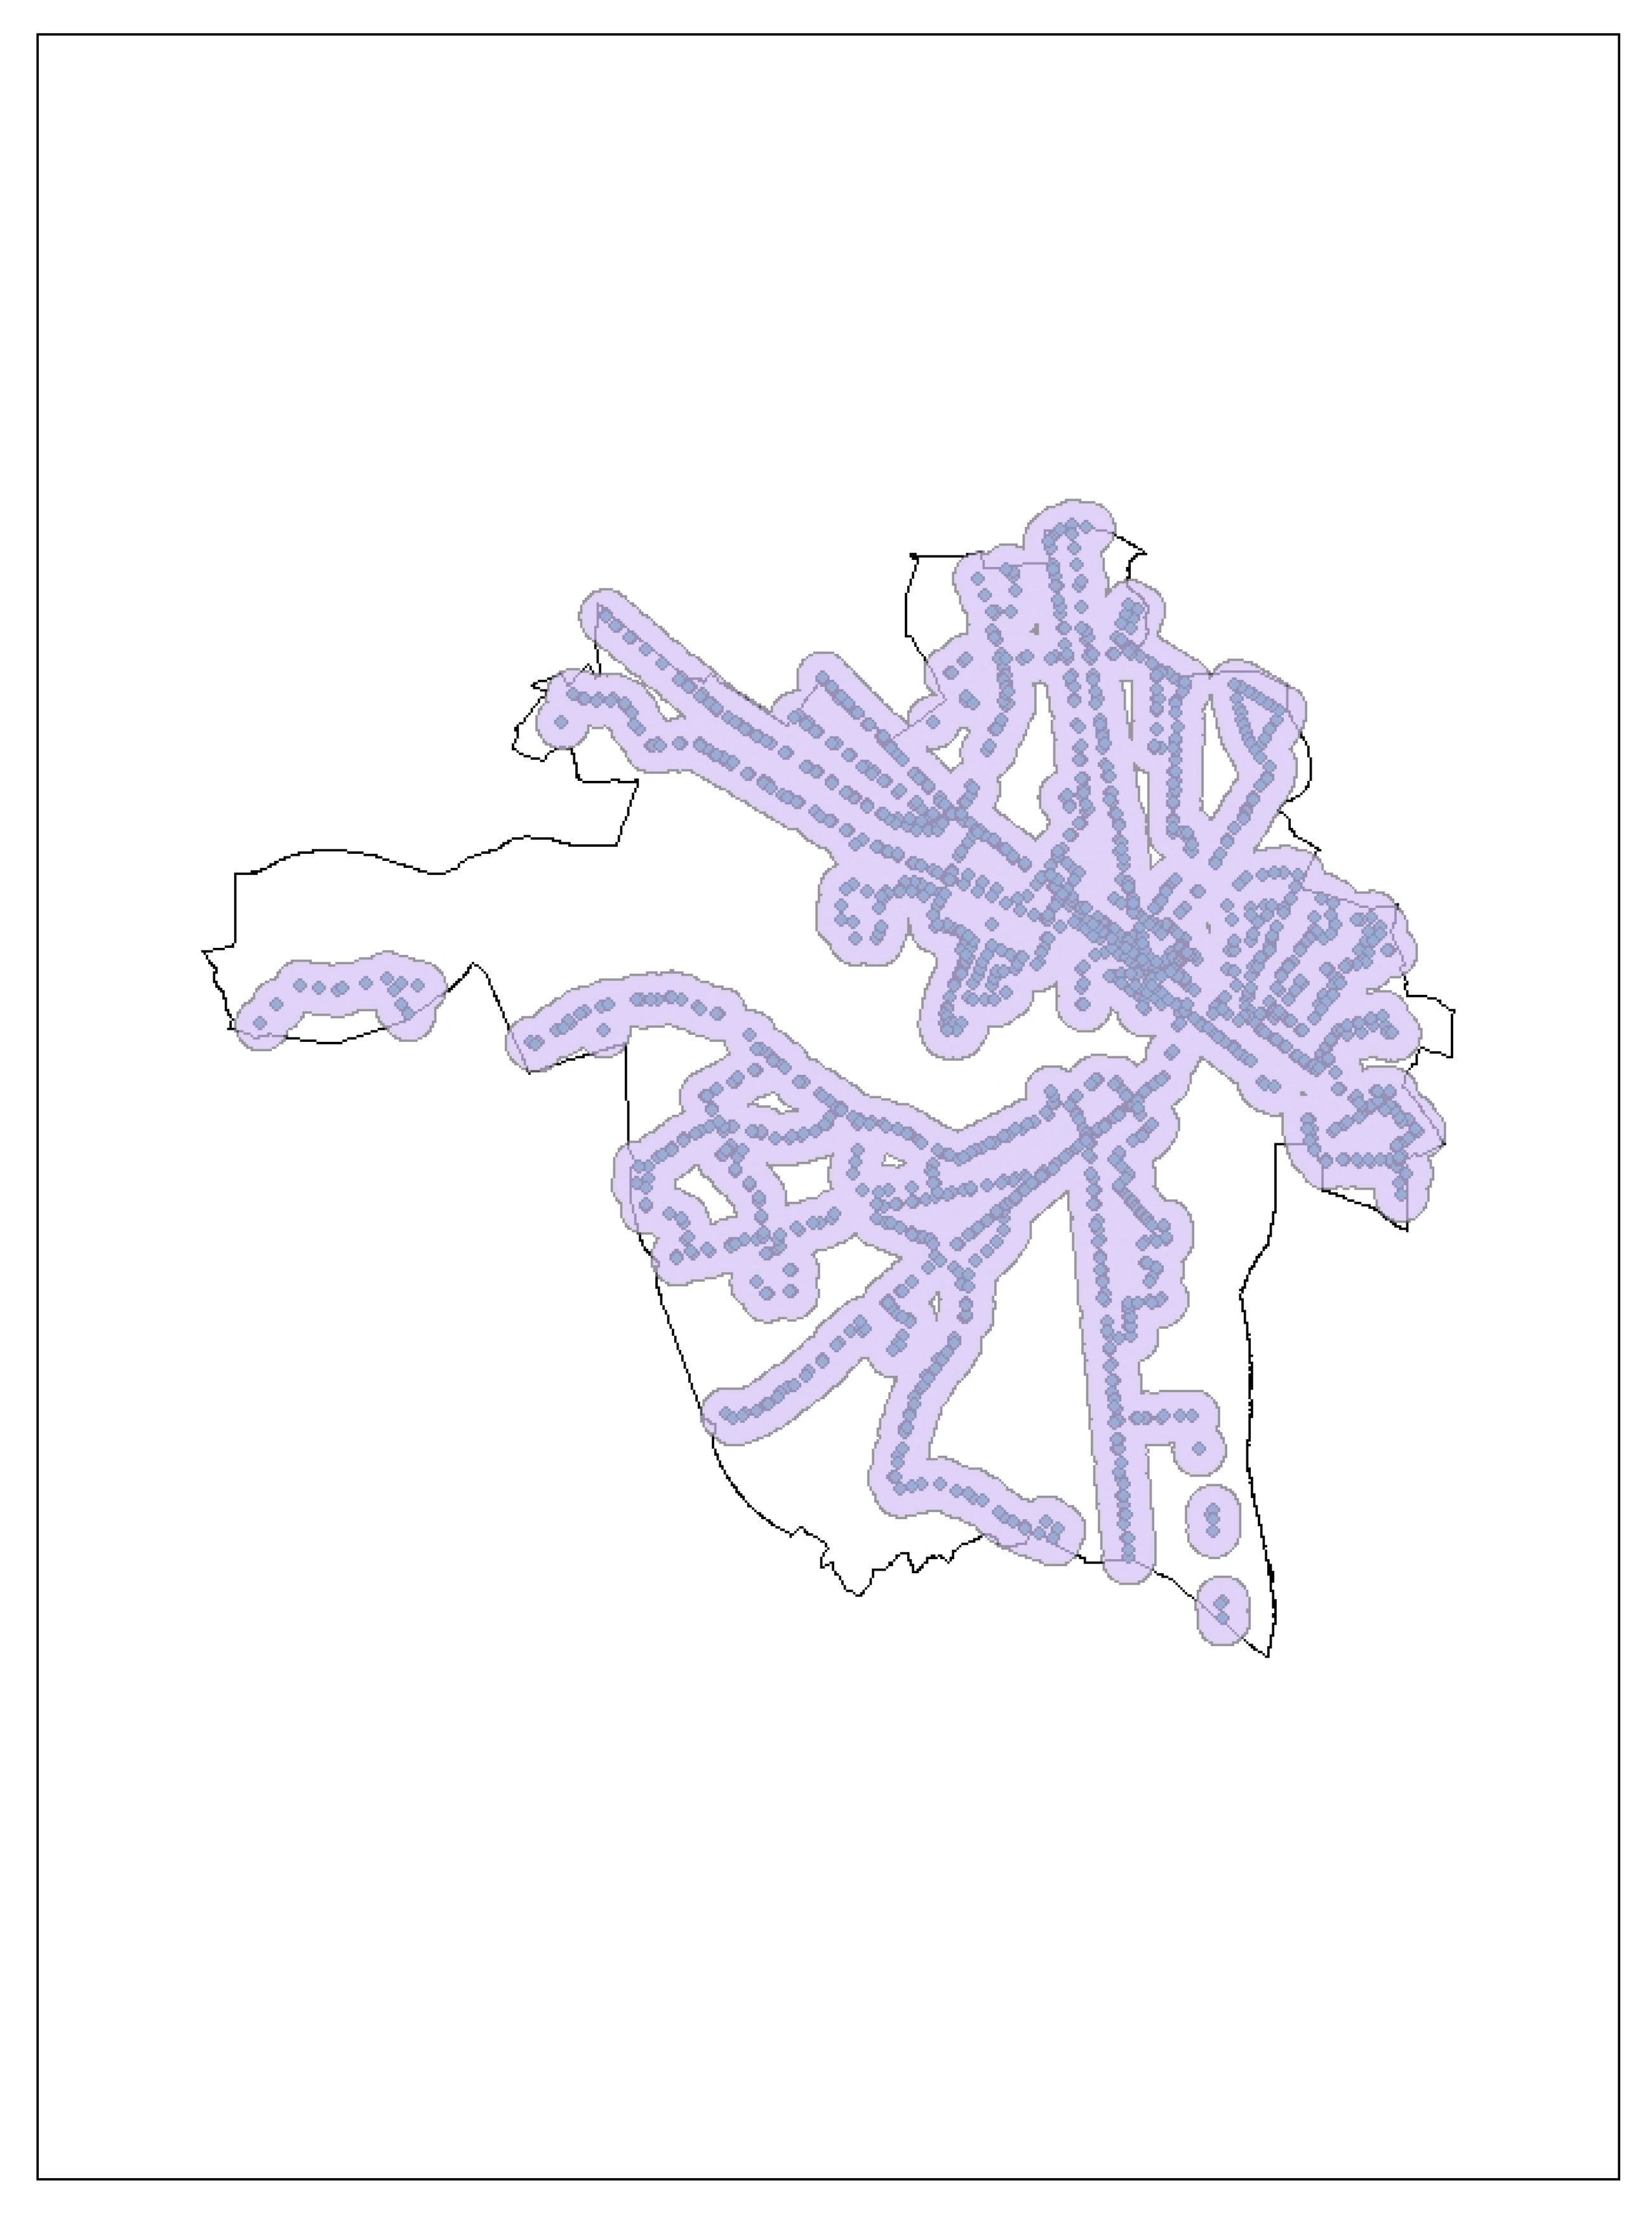
According to Kittelson and Associates, Inc. (2003), the TCQSM method involves two steps: Step 1 is to determine spatial coverage area and transit-supportive area; Step 2 is to calculate their ratio. ArcGIS 10.1 software is used to do this [26].
Figure 7 shows the list of GRTC bus stops and their 0.25 mile buffers located within the City of Richmond. The total buffered area is 41.0279 mi2, which is about 65.6% of the total Richmond City area (62.5 mi2).
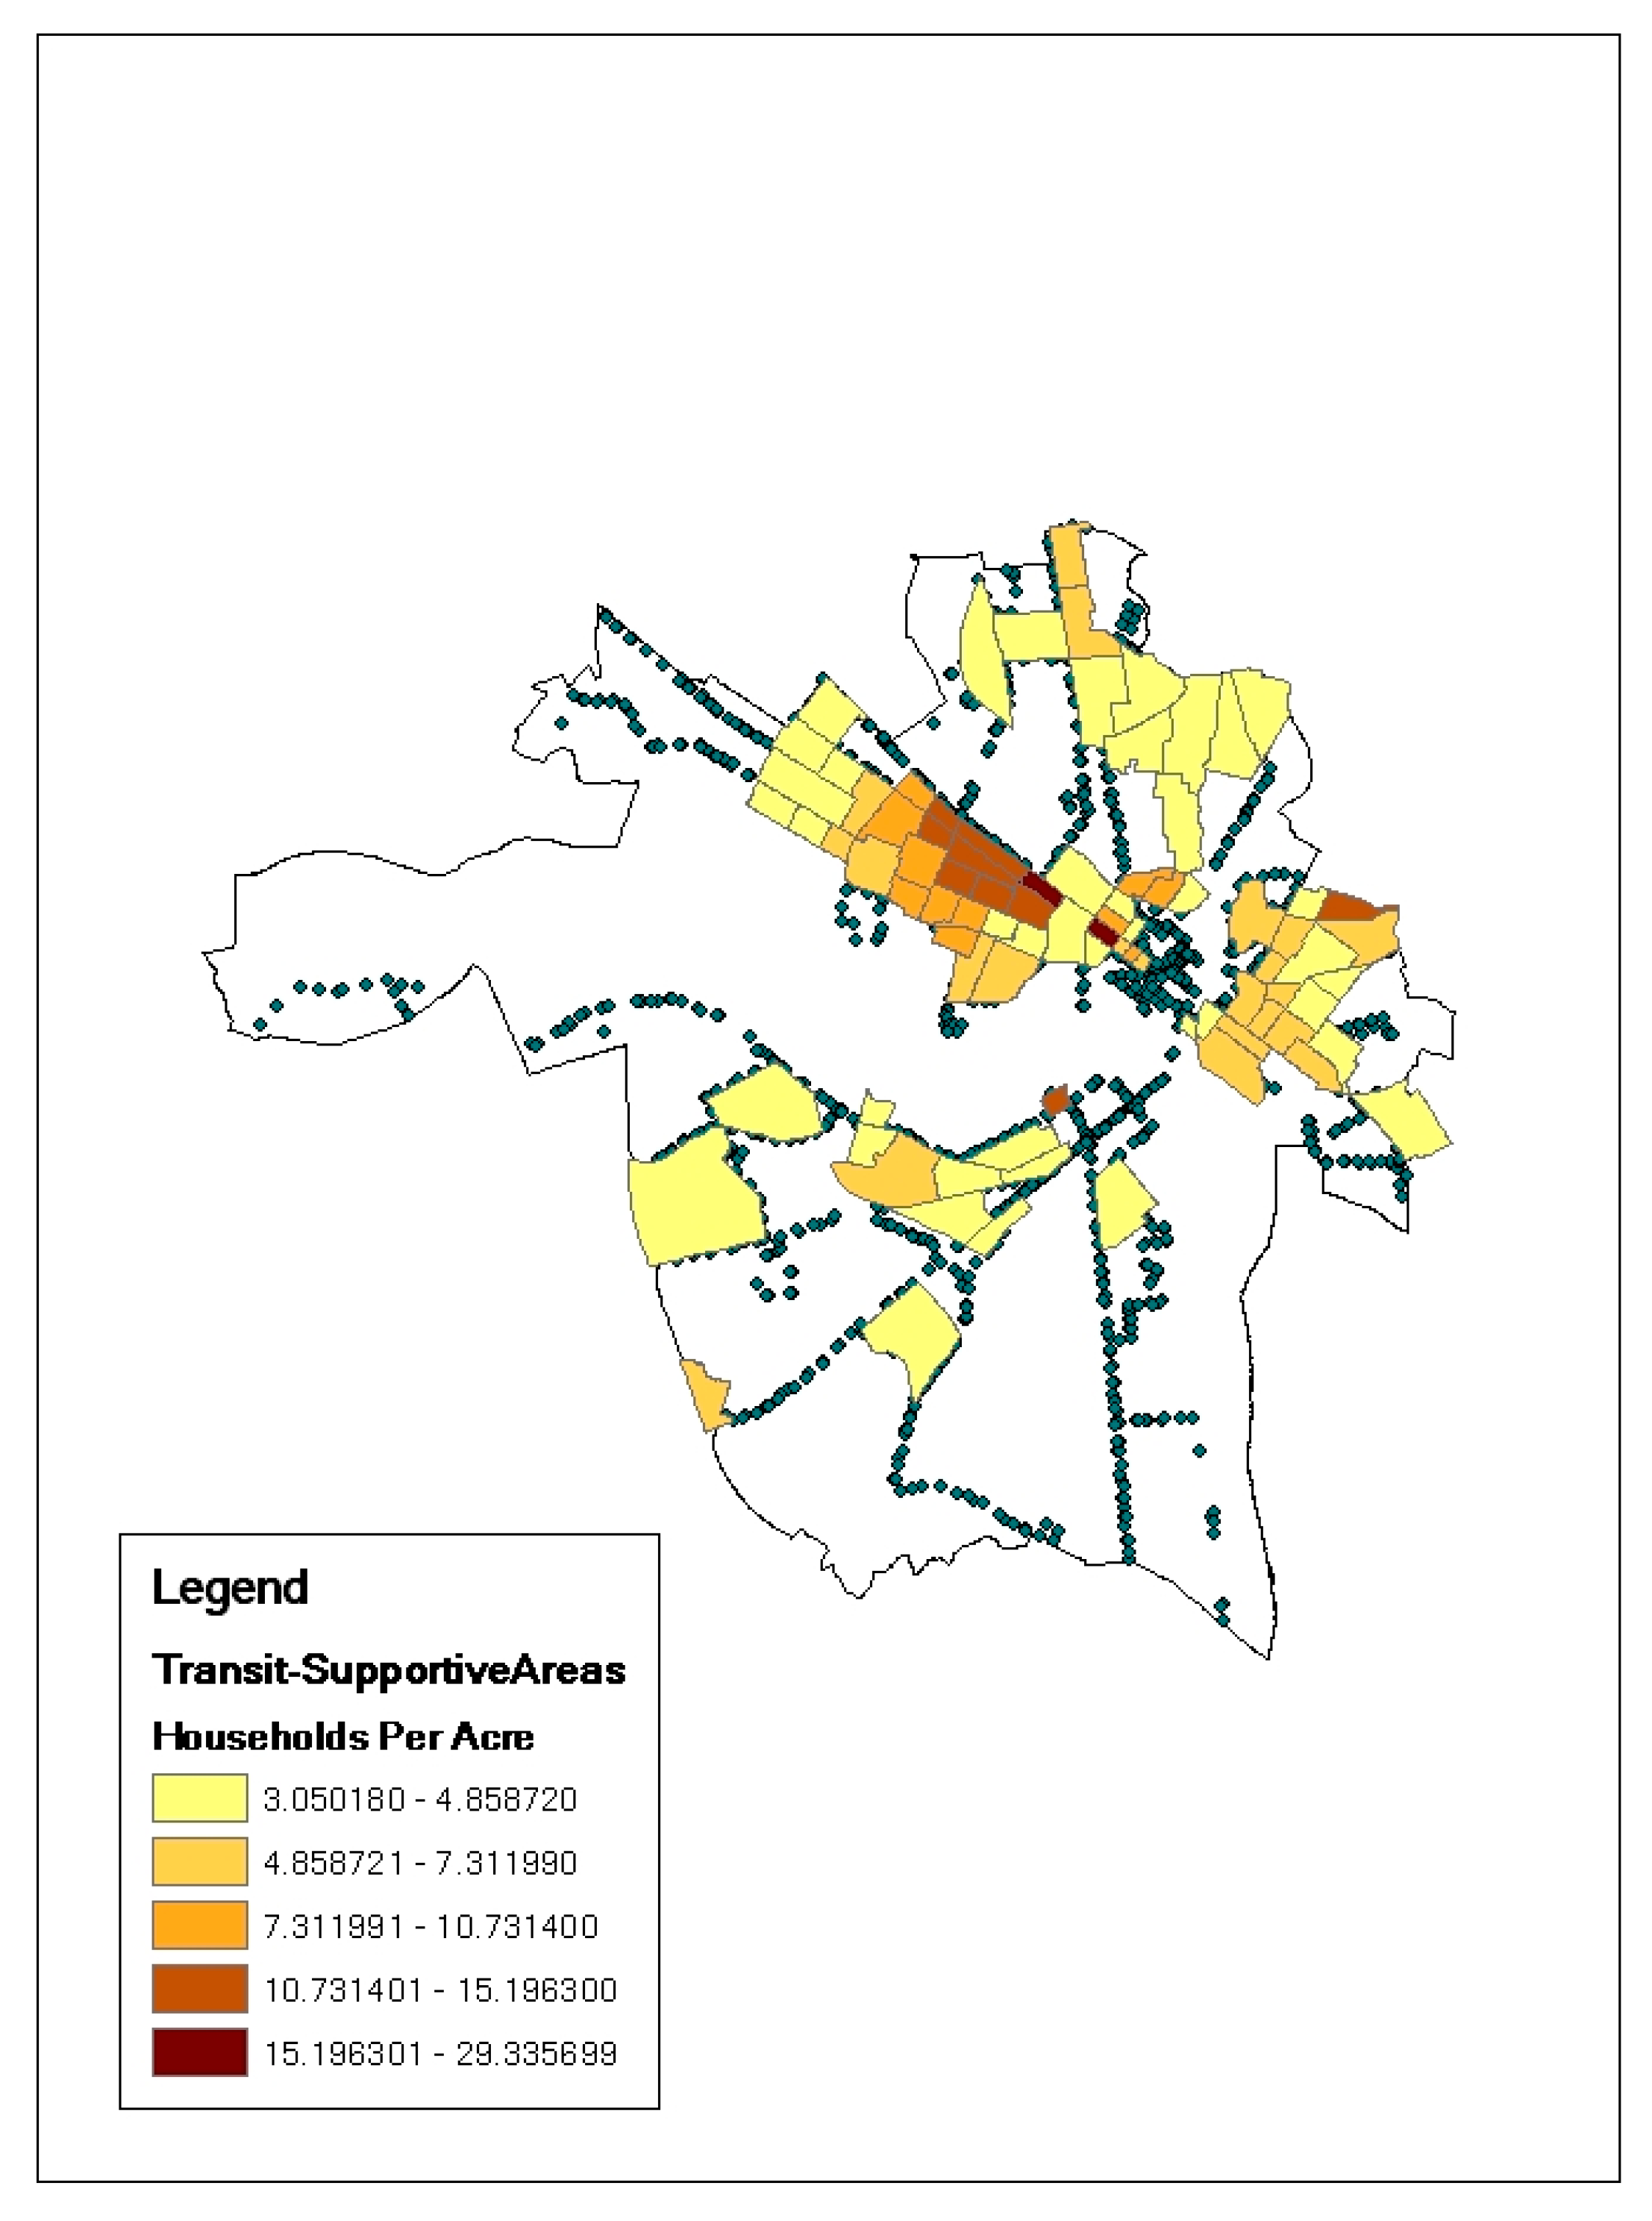
Following [62], this study uses the household density of 3.0 or more households per acre as a threshold for transit-supportive area (TSA). See Figure 8 for details. The number of households is divided by area to obtain the household density (households per acre). Those TAZs with a household density of 3.0 or more households per acre are selected to form the total transit-supportive area (TSA), which is 14.689165 mi2.
In ArcGIS, intersecting TSA with the buffered area to get TSA serviced is 14.171845 mi2. %TSA served = 14.171845 mi2/14.689165 mi2= 0.964782. Transit LOS = A. However, if using the actual walking distance, the intersected area would be 12.72 mi2. %TSA served = 12.72 mi2/14.689165 mi2= 0.866. Transit LOS = B. Please note that there is a difference between using Euclidean distance and actual walking distance.
Using the TCQSM method to do the calculation leads to the conclusion that Richmond City has adequate transit services, which seems to contradict the findings of [9].
3.3.3. Time-of-Day Tool
Polzin et al. (2002) developed a time-of-day-based transit accessibility analysis tool with a case study application in Tampa, Florida. The transit accessibility indicator proposed by Polzin et al. (2002) is the daily trips per capita in each traffic analysis zone (TAZ) that are exposed to transit service [15].
This paper uses the same methodology as that developed by Polzin et al. (2002) to do the calculation for the Richmond area. As illustrated in Figure 9, total daily trips per capita exposed to transit service are highest in the downtown Richmond area and along major corridors.
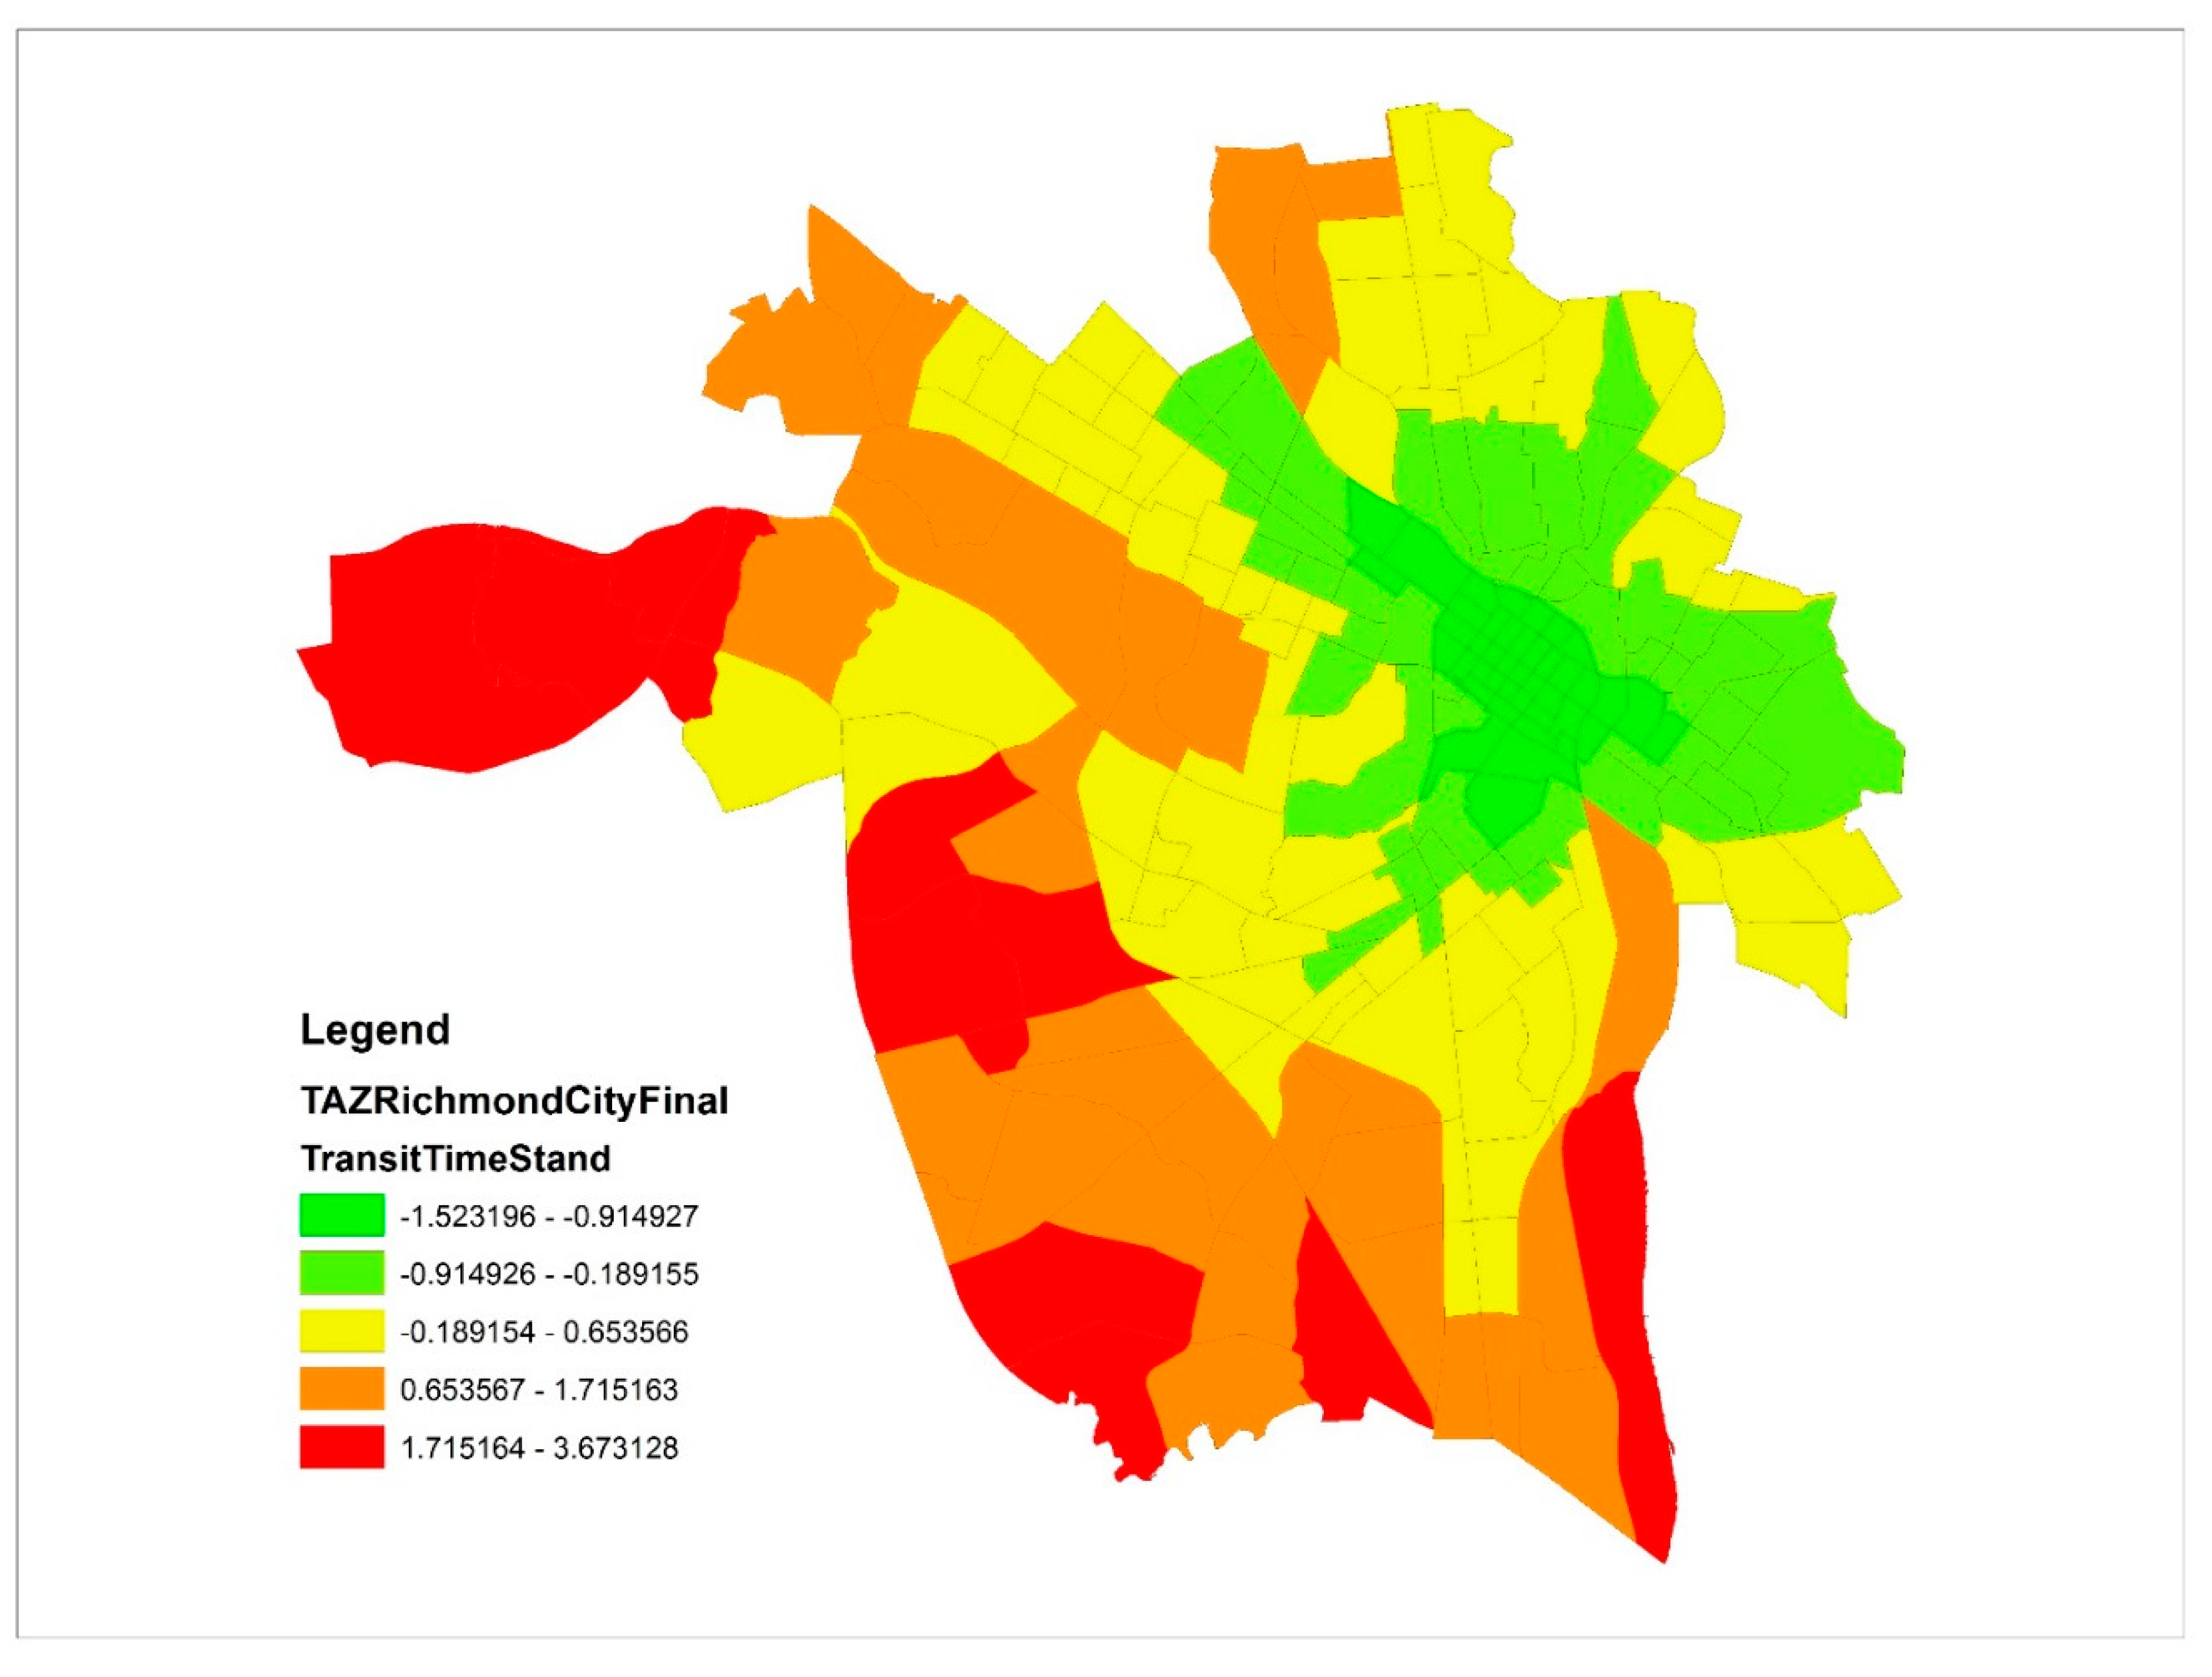
3.3.4. New Transit Skim-Based Accessibility Index
Figure 10 shows the standardized scores of the transit skim time across all TAZs. It is apparent that downtown Richmond and its vicinity areas have much lower standardized scores of transit skims than those of the rest of the City, clearly demonstrating the higher concentration of transit services and shorter transit travel times (higher transit accessibility) in these areas.
The regression results of transit skims and other explanatory variables shown in Table 2 and Table 3 clearly reveal the following facts:
First, all independent variables have the expected coefficient signs, meaning that population density, household density, employment density, bus route mile density and CBD location have negative impacts on total transit travel time, whereas auto density has positive impacts on total transit travel time.
Second, of all independent variables, CBD location and bus route mile density have the most significant negative impacts on total transit travel time, demonstrated by higher t-test scores. This suggests that the transit supply factors are generally more important than the transit demand factors in the Richmond area.
3.3.5. Correlation Analysis among the Transit Accessibility Indices
Significant at the 0.01 level (2-tailed), the correlation coefficients among the three LITA component indices [Bus Stop Densities (variable BStopDen), Daily Bus Frequencies (variable DayBFreq), and Daily Bus Capacities (variable DayBCapa)], Overall LITA index (variable OverallLITA), and Time-of-Day transit accessibility index [Daily Trip Exposure Per Capita (variable DTripExpoPerCap)], and standardized transit skim (variable TransitTimeStand) are calculated and shown in Table 3. Since TCQSM calculation results and its associated transit LOS are only calculated for those qualified TAZs with more than 3 households per acre, rather than for all TAZs as other indices do, TCQSM index is not included in the correlation analysis.
Table 4 reveals the following facts:
First, since the overall LITA index is the average of three component indices plus 5, it is not surprising that the overall LITA index is highly correlated with these three component indices.
Second, of three component indices, BStopDen and DayBFreq are highly correlated, but DayBCapa is not correlated with the other two indices at all.
Third, it is interesting to note that DTripExpoPerCap is highly correlated with BStopDen, DayBFreq, and OverallLITA, but not DayBCapa. Therefore, DayBCapa is a relatively independent variable.
Fourth, TransitTimeStand is inversely related to the other indices because the lower the total transit time, the better the accessibility.
4. Summary of Findings and Conclusions
Through this empirical study, it has been found that:
First, transit accessibility indices can be classified in different ways, for example: by destinations’ activity types; by spatial dimensions; by temporal dimensions; and by components. Due to data limitation, a large body of literature has been completed on spatial rather than temporal dimensions of transit accessibility, which is understandable. Both statistical and GIS tools can be utilized in the calculation process, with census block being the smallest geographic unit and minute being the smallest time unit. Of course, no single transit accessibility index is perfect and able to capture all effects. In addition, only a few empirical studies actually find positive employment effects of transit accessibility. Therefore, this research area demands a much more in-depth theoretical and empirical exploration.
Second, Richmond, Virginia is currently facing both poverty and transit crisis issues. It is believed that transit’s inaccessibility to jobs has aggravated the severity of the existing poverty crisis. For this reason, this study has an important policy implication: Improving the poor’s employment rate and income level through the betterment of transit accessibility to jobs.
Third, this paper has utilized four transit accessibility indices [three existing indices (LITA, TCQSM, and Time-of-Day Tool) and one new transit skim-based accessibility index] to do calculation and correlational analysis. Methodologically, the Time-of-Day Tool is the most complex one due to its consideration of the temporal dimension. Regardless of the index used, downtown Richmond is shown to have the best transit accessibility. LITA and TCQSM results seem to confirm that the areas with the highest levels of transit accessibility exist not only in the downtown area, but also along the major transit corridors radiating out from the downtown area. Meanwhile, the results from the new transit skim-based accessibility index show that transit accessibility gets worse with the increase in distance from the downtown area. These two patterns somewhat resemble Hoyt’s sector model of urban sociology and Burgess’s concentric zone model described in the textbook of human geography [63]. According to economist Homer Hoyt (1939), a city may develop in a series of sectors, not rings; different areas attract different activities by environmental factors or by chance, and as the city grows, activities within it grow outward in a wedge shape from the Central Business District (CBD) [64]. Based on human ecology theory, introduced by economist Ernest Burgess and applied to Chicago in 1925, the concentric zone model depicts urban land usage in concentric rings: (1) The center with the central business district; (2) The transition zone of mixed residential and commercial uses or the zone of transition; (3) Working-class residential homes (inner suburbs); (4) Better quality middle-class homes (outer suburbs); and (5) Commuter zone [65].
Fourth, the regression analysis indicates that CBD location and bus route mile density have the most significant negative impacts on total transit travel time. This highlights the importance of transit supply factors in the Richmond area. Considering the increase in suburb-to-suburb journey-to-work travels, it would be better to provide more circumferential transit services to connect the different transit corridors radiating out from downtown Richmond.
Funding
This research was funded by the National Natural Science Foundation of China grant number 71774133.
Acknowledgments
I would like to express my gratitude for the research assistance received from April Ni’mary, the former urban planning graduate student of Virginia Commonwealth University. In addition, I also want to sincerely acknowledge the technical guidance of Guoqiang Shen of the University of Texas at Arlington. I am solely responsible for any potential errors contained in this paper.
Conflicts of Interest
The author declares no conflict of interest.
References
- Blumenberg, E. On the way to work: Welfare participants and barriers to employment. Econ. Dev. Q. 2002, 16, 314–325. [Google Scholar] [CrossRef]
- Blumenberg, E.; Manville, M. Beyond the Spatial Mismatch: Welfare Recipients and Transportation Policy. J. Plan. Lit. 2004, 19, 182–205. [Google Scholar] [CrossRef]
- Cervero, R.; Sandoval, O.; Landis, J. Transportation as a stimulus of welfare-to-work-Private versus public mobility. J. Plan. Educ. Res. 2002, 22, 50–63. [Google Scholar] [CrossRef]
- Danziger, S.; Corcoran, M.; Danziger, S.; Heflin, C.M.; Kalil, A.; Levine, J.; Rosen, D.; Seefeldt, K.S.; Siefert, K.; Tolman, R.M. Barriers to the employment of recipients. In Prosperity for All? The Economic Boom and African Americans; Cherry, R., Rodgers, W.M., III, Eds.; Russell Sage: New York, NY, USA, 2000. [Google Scholar]
- Ong, P. Car ownership and welfare-to-work. J. Policy Anal. Manag. 2002, 21, 239–252. [Google Scholar] [CrossRef] [Green Version]
- Ong, P. Work and car ownership among welfare recipients. Soc. Work Res. 1996, 2, 255–262. [Google Scholar] [CrossRef]
- Ong, P.; Blumenberg, E. Job access, commute and travel burden among welfare recipients. Urban Stud. 1998, 35, 77–93. [Google Scholar] [CrossRef]
- Raphael, S.; Stoll, M. Can Boosting Minority Car Ownership Rates Narrow Inter-Racial Employment Gaps? Joint Center for Poverty Research: Chicago, IL, USA, 2000. [Google Scholar]
- Tomer, A.; Kneebone, E.; Puentes, R.; Berube, A. Missed Opportunity: Transit and Jobs in Metropolitan America; Metropolitan Policy Program at Brookings: Washington, DC, USA, 2011. [Google Scholar]
- Liu, S.; Zhu, X. An integrated GIS approach to accessibility analysis. Transp. GIS 2004, 8, 45–62. [Google Scholar] [CrossRef]
- Levine, J.; Grengs, J.; Shen, Q.; Shen, Q. Does accessibility require density or speed? a comparison of fast versus close in getting where you want to go in US metropolitan regions. J. Am. Plan. Assoc. 2012, 78, 157–172. [Google Scholar] [CrossRef]
- Bhat, C.R.; Bricka, S.; La Mondia, J.; Kapur, A.; Guo, J.Y.; Sen, S. Metropolitan Area Transit Accessibility Analysis Tool; TxDOT Project 0-5178-P3; Texas Department of Transportation: Austin, TX, USA, 2006. [Google Scholar]
- Lei, T.L.; Church, R.L. Mapping transit-based access: Integrating GIS, routes and schedules. Int. J. Geogr. Inf. Sci. 2010, 24, 283–304. [Google Scholar] [CrossRef]
- Lei, T.; Chen, Y.; Goulias, K.G. Opportunity-Based Dynamic Transit Accessibility in Southern California: Measurement, Findings, and Comparison with Automobile Accessibility. Transp. Res. Rec. 2012, 2276, 26–37. [Google Scholar] [CrossRef]
- Polzin, S.; Pendyala, R.; Navari, S. Development of time-of-day-based transit accessibility analysis tool. Transp. Res. Rec. 2002, 1799, 35–41. [Google Scholar] [CrossRef]
- Geurs, K.T.; van Wee, B. Accessibility evaluation of land use and transport strategies: Review and research directions. J. Transp. Geogr. 2004, 12, 127–140. [Google Scholar] [CrossRef]
- Shen, Q. Location characteristics of inner-city neighborhoods and employment accessibility of low-wage workers. Environ. Plan. B Plan. Des. 1998, 25, 345–365. [Google Scholar] [CrossRef]
- Owen, A.; Levinson, D.M. Access across America: Transit 2014 Methodology; Final Report Prepared for Center for Transportation Studies; University of Minnesota: Minneapolis, MN, USA, 2014. [Google Scholar]
- Levinson, D.M.; Kumar, A. Multimodal trip distribution: Structure and application. Transp. Res. Rec. 1994, 1466, 124–131. [Google Scholar]
- Hsiao, S.; Lu, J.; Sterling, J.; Weatherford, M. Use of geographic information system. For analysis of transit pedestrian access. Transp. Res. Rec. 1997, 1604, 50–59. [Google Scholar] [CrossRef]
- Murray, A.T.; Davis, R. Equity in regional service provision. J. Reg. Sci. 2001, 41, 577–600. [Google Scholar] [CrossRef]
- O’Neill, W.A.; Ramsey, R.D.; Chou, J. Analysis of transit service areas using Geographic. Information Systems. Transp. Res. Rec. 1992, 1364, 131–138. [Google Scholar]
- Ryus, P.; Ausman, J.; Teaf, D. Development of Florida’s transit level-of-service indicator. Transp. Res. Rec. 2000, 1731, 123–129. [Google Scholar] [CrossRef]
- Zhao, F.; Chow, L.-F.; Li, M.-T.; Gan, A.; Ubaka, I. Forecasting Transit Walk Accessibility: A Regression Model Alternative to the Buffer Method; Transportation Research Board Annual Meeting CD-ROM: Washington, DC, USA, 2003. [Google Scholar]
- Mavoa, S.; Witten, K.; McCreanor, T.; O’Sullivan, D. GIS based destination accessibility via public transit and walking in Auckland. J. Transp. Geogr. 2012, 20, 15–22. [Google Scholar] [CrossRef]
- Kittelson and Associates, Inc. Transit Capacity and Quality of Service Manual, 2nd ed.; TCRP Project 100; TRB, National Research Council: Washington, DC, USA, 2003. [Google Scholar]
- Hillman, R.; Pool, G. GIS-based innovations for modeling public transport accessibility. Traffic Eng. Control 1997, 38, 554–559. [Google Scholar]
- Kerrigan, M.; Bull, D. Measuring accessibility: A public transport accessibility index. In Proceedings of the Seminar B PTRC Summer Annual Meeting, Bath, UK, 14–18 September 1992; pp. 245–256. [Google Scholar]
- Farber, S.; Morang, M.Z.; Widener, M.J. Temporal variability in transit-based accessibility to supermarkets. Appl. Geogr. 2014, 53, 149–159. [Google Scholar] [CrossRef]
- Diao, M. Selectivity, spatial autocorrelation and the valuation of transit accessibility. Urban Stud. 2015, 52, 159–177. [Google Scholar] [CrossRef]
- Zhang, M. Exploring the relationship between urban form and nonwork travel through time use analysis. Landsc. Urban Plan. 2005, 73, 244–261. [Google Scholar] [CrossRef]
- Hansen, W. How accessibility shapes land use. J. Am. Inst. Plan. 1959, 25, 73–76. [Google Scholar] [CrossRef]
- Schoon, J.G.; McDonald, M.; Lee, A. Accessibility indices: Pilot study and potential use in strategic planning. Transp. Res. Rec. 1999, 1685, 29–38. [Google Scholar] [CrossRef]
- Fu, L.; Saccomanno, F.; Xin, Y. A new performance index for evaluating transit quality of service. In Proceedings of the 84th Annual Meeting of Transportation Research Record, Washington, DC, USA, 9–13 January 2005. [Google Scholar]
- Koskinen, V.; Sarkka, T.; Blomqvist, P. Measuring scheduled travel time and service availability factors of a fixed route transit system. In Proceedings of the 84th Annual Meeting of Transportation Research Board, Washington, DC, USA, 9–13 January 2005. [Google Scholar]
- Alam, B.M. Transit accessibility to jobs and employment prospects of welfare recipients without cars. Transp. Res. Rec. 2009, 2110, 78–86. [Google Scholar] [CrossRef]
- Widener, M.J.; Farber, S.; Neutens, T.; Horner, M.W. Using urban commuting data to calculate a spatiotemporal accessibility measure for food environment studies. Health Place 2013, 21, 1–9. [Google Scholar] [CrossRef] [PubMed] [Green Version]
- Rood, T. The Local Index of Transit Availability: An Implementation Manual; Local Government Commission: Sacramento, CA, USA, 1998.
- Mamun, S.A.; Lownes, N.E. An Aggregated Public Transit Accessibility Measure. J. Public Transp. 2011, 14, 69–87. [Google Scholar] [CrossRef]
- Kawabata, M.; Shen, Q. Job accessibility as an indicator of auto-oriented urban structure: A comparison of Boston and Los Angeles with Tokyo. Environ. Plan. B Plan. Des. 2006, 33, 115–130. [Google Scholar] [CrossRef]
- Harris, B. Accessibility: Concepts and applications. J. Transp. Stat. 2001, 4, 15–30. [Google Scholar]
- Handy, S.L.; Niemeier, D.A. Measuring accessibility: An exploration of issues and alternatives. Environ. Plan. A 1997, 29, 1175–1194. [Google Scholar] [CrossRef]
- Cheng, J.; Bertolini, L. Measuring urban job accessibility with distance decay, competition and diversity. J. Transp. Geogr. 2013, 30, 100–109. [Google Scholar] [CrossRef]
- Wang, C.-H.; Chen, N. A GIS-based spatial statistical approach to modeling job accessibility by transportation mode: Case study of Columbus, Ohio. J. Transp. Geogr. 2015, 45, 1–11. [Google Scholar] [CrossRef]
- Owen, A.; Levinson, D.M. Modeling the commute mode share of transit using continuous accessibility to jobs. Transp. Res. Part A Policy Pract. 2015, 74, 110–122. [Google Scholar] [CrossRef] [Green Version]
- Thompson, G.L. How Ethnic/Racial Groups Value Transit Accessibility: Modeling Inferences from Dade County. In Proceedings of the Annual Meeting of the Association of Collegiate Schools of Planning, Ft. Lauderdale, FL, USA, 8 November 1997. [Google Scholar]
- Sanchez, T.W. The connection between public transit and employment. J. Am. Plan. Assoc. 1999, 65, 284–296. [Google Scholar] [CrossRef]
- Tilahun, N.; Fan, Y. Transit and job accessibility: An empirical study of access to competitive clusters and regional growth strategies for enhancing transit accessibility. Transp. Policy 2014, 33, 17–25. [Google Scholar] [CrossRef]
- Fan, Y. The planner’s war against spatial mismatch lessons: Learned and ways forward. J. Plan. Lit. 2012, 27, 153–169. [Google Scholar] [CrossRef]
- Rast, J. Transportation Equity and Access to Jobs in Metropolitan Milwaukee; The University of Wisconsin-Milwaukee Center for Economic Development: Madison, WI, USA, 2004. [Google Scholar]
- Sen, A.; Metaxatos, P.; Sööt, S.; Thakuriah, V. Welfare reform and spatial matching between clients and jobs. Pap. Reg. Sci. 1999, 78, 195–211. [Google Scholar] [CrossRef]
- Kawabata, M. Job access and employment among low-skilled autoless workers in US metropolitan areas. Environ. Plan. A 2003, 35, 1651–1668. [Google Scholar] [CrossRef]
- Ong, P.M.; Houston, D. Transit, employment and women on welfare. Urban Geogr. 2002, 23, 344–364. [Google Scholar] [CrossRef]
- Bania, N.; Leete, L.; Coulton, C. Job access, employment and earnings: Outcomes for welfare leavers in a US urban labour market. Urban Stud. 2008, 45, 2179–2202. [Google Scholar] [CrossRef]
- Sanchez, T.W.; Shen, Q.; Peng, Z.-R. Transit mobility, jobs access and low-income labour participation in US metropolitan areas. Urban Stud. 2004, 41, 1313–1331. [Google Scholar] [CrossRef]
- Thakuriah, P.; Metaxatos, P. Effect of residential location and access to transportation on employment opportunities. Transp. Res. Rec. 2000, 1726, 24–32. [Google Scholar] [CrossRef]
- Richmond City map. Available online: https://www.google.com/search?safe=strict&source=hp&ei=MVn_W46JBMu4gge374WABA&q=Richmond+City+map&btnK=Google+Search&oq=Richmond+City+map&gs_l=psy-ab.3..0l2j38l4j0i22i10i30j0i22i30l3.5511.9314..9805...0.0..1.198.1326.18j1......0....1..gws-wiz.....0..0i131.rq_NQpCZSPQ (accessed on 18 December 2018).
- Ma, Y.-S.; Chen, X. Geographical and Statistical Analysis on the Relationship between Land-Use Mixture and Home-Based Trip Making and More: Case of Richmond, Virginia. J. Urban Reg. Anal. 2013, 5, 5–44. [Google Scholar]
- American FactFinder. Available online: https://factfinder.census.gov/faces/nav/jsf/pages/community_facts.xhtml (accessed on 18 December 2018).
- Chen, X.; Suen, I.-S. Richmond’s Journey-to-Work Transit Trip-Making Analysis. Manag. Res. Pract. 2010, 2, 234–248. [Google Scholar]
- Richmond Regional Planning District Commission. Mayor’s Anti-Poverty Commission: Poverty and Access to Jobs; Richmond Regional Planning District Commission: Richmond, VA, USA, 2012. [Google Scholar]
- Pushkarev, B.S.; Zupan, J.M. Public Transportation and Land Use Policy; Indiana University Press: Blumington, IN, USA, 1977. [Google Scholar]
- Rubenstein, J.M. The Cultural Landscape: An Introduction to Human Geography, 11th ed.; Pearson Prentice Hall: Upper Saddle River, NJ, USA, 2013. [Google Scholar]
- Hoyt, H. The Structure and Growth of Residential Neighborhoods in American Cities; Federal Housing Administration: Washington, DC, USA, 1939.
- Burgess, E.W. The Growth of the City: An Introduction to a Research Project. In The City; Park, R.E., Burgess, E.W., McKenzie, R.D., Eds.; University of Chicago Press: Chicago, IL, USA, 1925; pp. 47–62. [Google Scholar]
Figure 1.
Locational Map of Richmond City [57].
Figure 1.
Locational Map of Richmond City [57].

Figure 2.
Population density distribution in Richmond City. Source: [58].
Figure 2.
Population density distribution in Richmond City. Source: [58].

Figure 3.
Existing land use in Richmond City. Source: [58].
Figure 3.
Existing land use in Richmond City. Source: [58].

Figure 4.
Greater Richmond Transit Company bus route map. Source: [60].
Figure 4.
Greater Richmond Transit Company bus route map. Source: [60].

Figure 5.
Bus service and population density in the GRTC service area. Source: [60].
Figure 5.
Bus service and population density in the GRTC service area. Source: [60].

Figure 6.
Overall LITA scores.

Figure 7.
GRTC spatial coverage area.

Figure 8.
GRTC transit-supportive area (TSA).

Figure 9.
Total daily trips per capita exposed to transit service.

Figure 10.
Standardized scores of transit skim time.


Table 1.
Definition of variables.
| Variable Name | Definition and Their Hypothesized Effects on Total Transit Travel Time |
|---|---|
| Dependent variable: | |
| TransitTimeStand | Standardized score of total transit travel time |
| Independent variables: | |
| TPOPDensity | Total population/acre. The higher the population density, the more developed the transit services, the shorter the transit time |
| HHDensity | Households/acre. The higher the household density, the more developed the transit services, the shorter the transit time |
| TEMPDensity | Total employment/acre. The higher the employment density, the more developed the transit services, the shorter the transit time |
| AutoDensity | Autos/acre. The higher the auto density, the less developed the transit services, the longer the transit time |
| RMileDensity | Bus route miles/acre. The more developed the transit services, the shorter the transit time |
| CBD | A dummy variable showing if the TAZ is located inside the Central Business District (CBD) or not. 1 = Yes, 0 = No. If a TAZ is located inside the CBD, it is most likely that its transit time will be shorter. |
Table 2.
Model summary.
| Model | R | R Square | Adjusted R Square | Std. Error of the Estimate | Change Statistics | ||||
|---|---|---|---|---|---|---|---|---|---|
| R Square Change | F Change | df1 | df2 | Sig. F Change | |||||
| 1 | 0.631 a | 0.398 | 0.381 | 0.78694022 | 0.398 | 23.030 | 6 | 209 | 0.000 |
a Predictors: (Constant), CBD, AutoDensity, TEMPDensity, RMileDensity, TPOPDensity, HHDensity.
Table 3.
Coefficients.
| Model | Unstandardized Coefficients | Standardized Coefficients | t | Sig. | |
|---|---|---|---|---|---|
| B | Std. Error | Beta | |||
| 1 (Constant) | 0.497 | 0.096 | 5.171 | 0.000 | |
| TPOPDensity | −0.022 | 0.019 | −0.177 | −1.175 | 0.241 |
| HHDensity | −0.022 | 0.044 | −0.086 | −0.500 | 0.618 |
| TEMPDensity | −0.003 | 0.002 | −0.115 | −1.540 | 0.125 |
| AutoDensity | 0.028 | 0.031 | 0.089 | 0.898 | 0.370 |
| RMileDensity | −0.079 | 0.024 | −0.254 | −3.272 | 0.001 |
| CBD | −0.702 | 0.145 | −0.322 | −4.842 | 0.000 |
Table 4.
Correlation coefficients among existing transit accessibility indices. **. Correlation is significant at the 0.01 level (2-tailed). *. Correlation is significant at the 0.05 level (2-tailed).
Table 4.
Correlation coefficients among existing transit accessibility indices. **. Correlation is significant at the 0.01 level (2-tailed). *. Correlation is significant at the 0.05 level (2-tailed).
| Correlations | |||||||
|---|---|---|---|---|---|---|---|
| BStopDen | DayBFreq | DayBCapa | OverallLITA | DTripExpoPerCap | TransitTimeStand | ||
| BStopDen | Pearson Correlation | 1 | 0.678 ** | 0.122 | 0.802 ** | 0.685 ** | −0.596 ** |
| Sig. (2-tailed) | 0.000 | 0.074 | 0.000 | 0.000 | 0.000 | ||
| N | 216 | 216 | 216 | 216 | 216 | 216 | |
| DayBFreq | Pearson Correlation | 0.678 ** | 1 | 0.221** | 0.846 ** | 0.902 ** | −0.606 ** |
| Sig. (2-tailed) | 0.000 | 0.001 | 0.000 | 0.000 | 0.000 | ||
| N | 216 | 216 | 216 | 216 | 216 | 216 | |
| DayBCapa | Pearson Correlation | 0.122 | 0.221 ** | 1 | 0.598 ** | 0.311 ** | −0.161 * |
| Sig. (2-tailed) | 0.074 | 0.001 | 0.000 | 0.000 | 0.018 | ||
| N | 216 | 216 | 216 | 216 | 216 | 216 | |
| OverallLITA | Pearson Correlation | 0.802** | 0.846 ** | 0.598 ** | 1 | 0.846 ** | −0.607 ** |
| Sig. (2-tailed) | 0.000 | 0.000 | 0.000 | 0.000 | 0.000 | ||
| N | 216 | 216 | 216 | 216 | 216 | 216 | |
| DTripExpoPerCap | Pearson Correlation | 0.685 ** | 0.902 ** | 0.311 ** | 0.846 ** | 1 | −0.641 ** |
| Sig. (2-tailed) | 0.000 | 0.000 | 0.000 | 0.000 | 0.000 | ||
| N | 216 | 216 | 216 | 216 | 216 | 216 | |
| TransitTimeStand | Pearson Correlation | −0.596 ** | −0.606 ** | −0.161 * | −0.607 ** | −0.641 ** | 1 |
| Sig. (2-tailed) | 0.000 | 0.000 | 0.018 | 0.000 | 0.000 | ||
| N | 216 | 216 | 216 | 216 | 216 | 216 | |
© 2018 by the author. Licensee MDPI, Basel, Switzerland. This article is an open access article distributed under the terms and conditions of the Creative Commons Attribution (CC BY) license (http://creativecommons.org/licenses/by/4.0/).
Share and Cite
MDPI and ACS Style
Chen, X. Review of the Transit Accessibility Concept: A Case Study of Richmond, Virginia. Sustainability 2018, 10, 4857. https://0-doi-org.brum.beds.ac.uk/10.3390/su10124857
AMA Style
Chen X. Review of the Transit Accessibility Concept: A Case Study of Richmond, Virginia. Sustainability. 2018; 10(12):4857. https://0-doi-org.brum.beds.ac.uk/10.3390/su10124857
Chicago/Turabian StyleChen, Xueming (Jimmy). 2018. "Review of the Transit Accessibility Concept: A Case Study of Richmond, Virginia" Sustainability 10, no. 12: 4857. https://0-doi-org.brum.beds.ac.uk/10.3390/su10124857
Note that from the first issue of 2016, this journal uses article numbers instead of page numbers. See further details here.