1. Introduction
Impact assessments for policy support in the areas of energy, food, the sustainable management of natural resources (e.g., water), the use of biomass, and climate change are partly based on projections delivered by models. Integrated assessment modelling approaches usually have a limited focus on these topics, and current approaches cannot adequately take into account these different contexts [
1]. Moreover [
1] states that “there is little clarity on how models should be evaluated and compared, both with individual disciplines and as components of larger integrated assessment modelling”. Energy and climate policies are widely supported by impact assessments [
2,
3,
4,
5]. Policies have had to widen the scope of their main objectives to take account new challenges, such as climate change, which, in turn, should also be informed by model outputs [
6]. With sectoral policies (e.g., energy, water, and agriculture) becoming more and more interrelated, policy coherence is becoming paramount, achieving synergies among energy policies to the benefit of other policies (e.g., agriculture, climate, water, land). The availability and use of (renewable and non-renewable) energy is increasingly being linked with other natural resources (water, land, and food), and the coherent system of interlinkages between natural resources is also called the “nexus” [
7].
The nexus concept aims to develop a holistic and comprehensive understanding of how the use of energy interacts with the provision and consumption of food and water, all within the context of a changing climate. The introduction of the nexus concept in policy support has three features [
8]:
Interlinkages between natural resources (i.e., water, energy, food, land and climate) are taken into account, trade-offs among them are made explicit, and potential synergies are exploited.
Natural resources are managed sustainably and in an integrated manner. The optimization of food production, for example, might cause trade-offs with other natural resources (e.g., energy, water and land). The nexus concept allows us to seek for synergies and overcome trade-offs.
Governance processes, including policy coherence, are an essential part of the nexus concept. Policy coherence is an attribute of policy that reduces conflicts and exploits synergies within and across policy areas at different spatial scales [
9]. One may argue in favor of interlinkages between resources, but the lack of policy coherence has the risk of trade-offs from inadequate decision-making. Governance processes could be targeted on different objectives, including resource efficiency and circular economy. Resource efficiency (e.g., producing more of a given service, while using fewer natural resources), for example, is a major policy area in EU, but circular economy could also be linked to the nexus.
Transdisciplinary research approaches, where practitioners work with the scientific community, are needed to implement the nexus concept. This includes using state-of-the-art scientific approaches and integrating the involvement of stakeholders from policy, business, and civil-society organisations. The current paper integrates different modelling approaches (using the E3ME model and system dynamics modelling with causal loops) with knowledge from local experts (representing business and policy) to incorporate energy and resource efficiency targets with the nexus concept.
The objective of this paper is two-fold. Firstly, a modelling tool is proposed to help to assess various policies from a nexus perspective. The global E3ME model provides detailed outputs for energy aspects of the nexus. The knowledge arising from such a model is presented with interaction mechanisms through complexity science methods (i.e., system dynamics modelling). The second objective is to apply such a modelling tool to specific cases with a view to integrate energy and resource efficiency by identifying sector drivers, relevant key policies, and how sectors and policies interact [
10].
The paper introduces the nexus concept that integrates energy and resource efficiency for policy assessment. The analysis includes three subsequent steps:
Key energy and economic indicators for three case studies (Latvia, The Netherlands, and southwest UK) are proposed using an existing macroeconomic model, providing detailed outputs for specific aspects of the nexus with a focus on energy and climate. The E3 (energy–environment–economy) macroeconomic model is well placed to provide a detailed analysis of the macroeconomic impacts of energy policy. The outcomes of a baseline scenario are compared with a two-degree C scenario.
In addition to the detailed outputs for specific aspects of the nexus, the paper makes explicit which synergies could be created between the energy sector and other parts of the water–food–land–climate nexus. In addition, trade-offs are noticed between the nexus sectors and policies that could potentially enhance coherence among the nexus sectors.
The macroeconomic modelling approach does not allow full integration of the nexus concept for policy assessment. System dynamics modelling (SDM) is therefore proposed as a methodology to analyze, study, and manage complex systems, especially when formal analytical methods do not exist or are hard to apply.
2. Materials and Methods
2.1. Terminology Used in this Paper
Efficient use of the resource energy enables the economic output to increase while reducing energy use. Modelling tools are available to assess the resource efficiency, notably the economic impact of investments in the energy sector as well as climate and energy policies. They provide detailed outputs for specific aspects of the nexus of energy and climate. The energy model presented in this paper, E3ME, is a global energy, environment, and economy model. It does not fully capture the nexus sectors, largely ignoring their interactions with water, food, and land. However, resource efficiency in energy also depends on the availability and use of other resources (e.g., water, food, land and climate). Alternative approaches are proposed to integrate the outputs from models like E3ME with other numerical approaches. Such so-called complexity science approaches are adopted for interactive development with stakeholder participation, and presented in the next section.
Three case studies are implemented to test the nexus concept integrating energy and resource efficiency for policy assessments. By working with stakeholders (from policy, business, and civil society organisations), these case studies (e.g., Latvia, The Netherlands, and southwest UK) adopt transdisciplinary approaches that are driven by their needs.
2.2. Selection of Case Studies
Three case studies were selected, which are all part of an ongoing (2016–2020) EU-funded project “Sustainable Integrated Management for the nexus of water–land–food–energy–climate for a resource efficient Europe” (SIM4NEXUS). SIM4NEXUS uses advanced integration methodologies based on SDM to bridge the knowledge gap related to the complex interactions between the nexus. Three case studies with similar objectives (low-carbon economy and/or increasing renewable energy use) were selected. They were implemented to showcase this methodology as a test bed for achieving resource efficiency through successful policy initiatives.
The three case studies draw on transdisciplinary research methods, with knowledge partners working with end-users (policy makers, business, small and medium-sized enterprises (SMEs), and civil society organisations) and adopting participatory approaches. The case studies respect the data security rules according to the General Data Protection Regulation (GDPR) 2016/679 of the European Parliament and of the Council from 27 April 2016 on the protection of natural persons with regard to the processing of personal data and the free movement of such data.
The information was collected through 15 semi-structured interviews with representatives from the private sector, policy, and civil society (case of The Netherlands), and each case study was organized as a workshop (with approximately 15 participants) to discuss the critical issues at stake and to identify synergies between the nexus sectors.
2.3. Complexity Science Approaches
Complexity science approaches are used to combine existing energy knowledge models (e.g., E3ME) with interaction mechanisms. The application of such approaches to policy assessments provides a means of exploring the effects of various types (legal, political, business, and financial) of spatial and temporal drivers and constraints on the behavior of society. System dynamics is used as a holistic approach to nexus decision and policy making. SDM links the main feedback mechanisms (loops and iterations), breaking down problems into sub-systems and submodels. In a way, this is similar to the conceptual thinking of non-programmers, as reflected by conceptual models. Each SDM model consists of (i) stocks/compartments (levels-state variables), (ii) connectors (arrows), (iii) flows or influences (rates), (iv) converters (auxiliaries/parameters), and (v) decision processes (priorities, allocation and relations) [
10,
11].
2.4. E3ME Model
E3ME is a macroeconomic model that is applied for a variety of regions and is continually updated and maintained [
12]. It is used to assess the linkages between the economy and energy systems, and their impacts on environmental emissions.
The E3ME model integrates energy systems with the economy and so is very suitable for assessing policies that affect energy demand and supply. The model has been used to provide policy makers with information regarding different energy policy options, for example, in several related Impact Assessments for the European Commission, including for the 2030 climate and energy framework and the Energy Efficiency Directive [
3]. The model is able to provide a wide range of results at a disaggregated level, including changes to energy demand, electricity supply, and emissions as well as a range of macroeconomic and sectoral economic indicators.
The economic structure of E3ME is based on the system of national accounts, with further linkages to energy demand and environmental emissions. E3ME is based on a post-Keynesian, demand-driven framework, which sets it aside from the more standard computable general equilibrium (CGE) approach [
13,
14]. Assumptions common to CGE models, such as perfect knowledge and rational behavior, are replaced with equations based on real-world relationships, as determined by the historical data. The financial sector is a key part of the system [
15].
E3ME’s historical database covers the period 1970–2016, and the model projects forward annually to 2050. The econometric specifications of E3ME give the model a strong empirical grounding. E3ME uses a system of error corrections, allowing short-term dynamic (or transition) outcomes, moving towards a long-term trend. The dynamic specifications are important when considering short and medium-term analysis (e.g., up until 2020) and rebound effects, which are included as standard in the model’s results (see [
16]).
The labor market is also covered in detail, including both voluntary and involuntary unemployment. In total, there are 33 sets of econometrically estimated equations, also including the components of the gross domestic product (GDP) (consumption, investment, international trade), prices, energy demand, and material demand. Each equation set is disaggregated by country and by sector.
The main dimensions of E3ME are:
Fifty-nine countries—all major world economies, the EU28, and candidate countries plus groupings of other countries’ economies;
Seventy industry sectors for EU countries and 44 industry sectors for non-EU countries, based on standard international classifications;
Forty-three consumer expenditure categories for EU countries and 28 for non-EU countries;
Twenty-three different fuel users of 12 different fuel types; and
Fourteen types of airborne emission (where data are available), including the six greenhouse gases monitored under the Kyoto Protocol.
The most recent applications of E3ME [
17,
18] assess the impacts of a global set of policies that are designed to limit temperature change to 2 °C. The modelling approach is more generally described in [
19]. The model manual provides an overview of the model’s structure [
12,
20].
The E3ME model is used in the paper to provide detailed information about the impacts of a transition towards two-degree on the energy part of the nexus. The model does not explicitly cover the other nexus components; however, some model results can be used to infer potential impacts in other components of the nexus. For example, the demand for bioenergy and food consumption are represented in E3ME; however, changes to these model outcomes allows us to infer potential changes to land-use and water demand.
3. Results
3.1. The Baseline and Two-Degree Scenario
A baseline scenario was introduced to represent the current trends of the systems being modelled. It was assumed not to include future policies, but only the ones implemented up until the base year of the analysis. Energy consumption for the coming two decades, for example, was assumed to follow the same annual growth rate of the recent past (e.g., 5 years). The E3ME baseline for the EU was calibrated to the PRIMES Reference scenario 2016 [
21]. The PRIMES Reference scenario focuses on the EU energy system, transport, and greenhouse gas (GHG) emission developments, including specific sections on emission trends not related to energy and on the various interactions among policies in these sectors. The Reference Scenario is used by the European Commission (DG Energy) as a benchmark of current policy and market trends. For non-EU regions, the E3ME model uses the International Energy Agency’s World Energy Outlook (IEA WEO) Current Policy Scenario (CPS) for 2016 [
22]. The CPS takes into account only those policies for which implementing measures had been formally adopted as of mid-2016.
In the two-degree scenario, all baseline policies are included. In addition to the baseline policies, the following additional energy and climate mitigation polices have also been added:
Moderate carbon prices levels (see
Table 1), usually collected as a tax, which are set at a global level but applied on a national basis.
Exogenous improvements to energy efficiency in final use sectors (such as households and buildings, but also other industry sectors, as outlined by information taken from the International Energy Agency World Energy Outlook 450ppm scenario (IEA 450ppm), except for road transport which is covered separately below. The rates of improvement are derived from the IEA 450PPM scenario.
The required investment is funded through public programs, using the revenues from the carbon pricing. This means that all revenues raised from the carbon tax or emissions trading scheme are used by the government to finance energy efficiency investments. Within each country, if there is any shortfall in (carbon) revenue, other taxes (split evenly between VAT, income taxes, and labor costs) are increased to meet the cost of investment.
Power sector: A combination of feed-in-tariffs and direct subsidies are implemented to promote the uptake of renewables, in particular, wind and solar power (see below). Some assumptions are made about increased availability of storage or demand management to support the increase in intermittent power technologies.
Decarbonization of the road transport sector using policies to encourage the uptake of electric vehicles, including registration taxes. Introduction of biofuel mandates is also required in some countries.
A biofuel mandate is applied to aviation, possibly to the extent that about 18% of aviation fuel will be derived from biofuels by 2050.
The following sections summarize the macroeconomic and energy impacts of the policies implemented above.
3.1.1. Impacts on GDP
The GDP impacts of moving towards the two-degree target were positive in all case studies as compared with baseline levels (
Table 2).
Table 2 captures the overall GDP impact of the transition to a low carbon system. All case studies are expected to benefit from the additional investment in energy efficiency and, in most cases, power generation (increased support for renewables) as well as a lower dependency on fossil fuel imports (as is the case in Latvia, for example) and lower fossil fuel costs on what is still being imported.
Here, it is important to note that while the energy efficiency investment is paid for in the year it is made, the power generation investment is paid for over the lifetime of the plant. This means that some of the investment will still be paid for beyond 2050.
3.1.2. Impact on Energy Consumption
The policies specifically concerned with electricity generation lead to a substantial decrease in the use of coal for power generation and increased used of renewables, in particular, solar and wind. Some electricity generation based on gas is expected to remain, mainly as back-up to ensure grid stability. The energy efficiency policies, particularly those targeting buildings (both residential and offices) are expected to lead to a decrease in demand for electricity and, in particular, gas. In road transport, the increased support for electric vehicles is expected to lead to higher demand for electricity in this sector by 2050. As such, total primary energy consumption would be expected to decrease with the two-degree scenario compared to the baseline (
Table 3).
Table 3 highlights the changes in the energy systems resulting from the decarbonization policies: a transition to a low carbon system, lower energy use, and what is used is mainly from renewable sources.
As expected, fossil fuel primary energy consumption is expected to decrease considerably, as it is the primary target of policies implemented across the countries (e.g., higher carbon prices, higher support for renewable technologies and policies encouraging the uptake of more efficient or alternative-fuel vehicles). Nonfossil fuel primary energy consumption is expected to increase in most case studies, but this is dependent on the level of energy efficiency uptake in each country. For example, in Latvia, the nonfossil fuel primary energy consumption is projected to increase by 2030 followed by a sharp decrease, reaching a 7.5% reduction by 2050 (as compared to the baseline). Bioenergy consumption is expected to increase in the scenario compared to baseline in the EU28, The Netherlands, and in the UK. The rate of increase is expected to slow down closer to 2050, as most bioenergy used in road transport will be replaced by electric vehicles. A somewhat different pattern is observed in Latvia where the bioenergy consumption is expected to increase by 2030 and then reverse to a decrease by 8.9% below the baseline consumption by 2050. However, this increase may lead to further pressures on land-use.
Table 4 summarizes final electricity demand results for the case studies.
Electricity demand in the two-degree scenario is affected by three main trends: (1) higher energy efficiency which contributes to a decrease in demand for electricity; (2) household switch from gas to electricity appliances as they are more efficient, which increases the demand for electricity, and (3) increased uptake of electric vehicles, which again is expected to lead to increased demand. Depending on the scale of the three effects mentioned above, electricity demand is expected to decrease or increase in each case. Generally, a substantial decrease compared to baseline is predicted to occur by 2030, with the rate of decrease slowing down afterwards as the electric vehicle uptake increases.
As expected, emissions are predicted to substantially decrease in the two-degree scenario compared to baseline in all case studies (
Table 5), while
Table 6 summarizes baseline CO
2 emission trends.
By policy design, the two-degree scenario is more energy-efficient compared to the baseline. There are number of energy efficiency policies that ensure energy savings, while the policies specifically implemented in the road transport sector are design to lead to encourage the uptake of more efficient vehicles. In E3ME, it is difficult to determine the impacts that these may have on land-use and water demand, as these components are not explicit in the model. It is likely that the higher demand for biofuels may cause pressure with respect to food production. Another convert that may impact land-use and food production is the increase in consumer demand predicted by the model. The increased economic activity because of the additional investment in renewables and energy efficiency, is expected to lead to increased consumer expenditure (see
Table 7).
In particular, EU28 expenditure on food, drink and tobacco is expected to increase by 2.6% in 2050 compared to baseline, indicating that food production in EU and imports are also expected to increase. This increase in food demand combined with higher bioenergy requirements are expected to put more pressure on land.
3.2. The Energy Policies Covered in the Case Studies
Countries and regions implement different strategies involving the integration of energy and resource efficiency, and these largely vary depending on policy targets and related measures. The main energy policies are summarized for the three case studies in Latvia, The Netherlands, and southwest UK. The opinions presented in this section largely draw from interviews with policy makers and civil society organizations, complemented by a review of grey literature including national assessments.
3.2.1. Latvia
Latvia has a high potential for renewable energy but remains largely dependent on imported fossil fuels and electricity. Thus, energy security is of a key concern and ensuring the energy supply, competitiveness, energy efficiency, and the use of renewable energy are the main energy challenges for the coming years. The country aims to reach at least an 80% reduction in GHG emissions by 2050 in comparison to 1990. The intermediate target to be reached by 2040 is increasing the carbon sequestration to fully cover the total amount of anthropogenic GHG emissions of the country and to achieve carbon neutrality [
23]. About 30% of electricity is imported, and hydro-power is by far the predominant renewable energy source in electricity production in Latvia. Renewable energy regarding the production of heat in centralized systems is fully dominated (share of 97%) by biomass wood fuel.
3.2.2. The Netherlands
The Netherlands has the potential for the use of renewable energy sources like wind, solar, and biomass. Hydropower generation is limited and does not have a high potential for use. Biomass is seen as the major primary renewable energy source as it can substitute the use of large-scale fossil fuels, like coal and oil. However, the use of biomass as a renewable energy source does not necessarily contribute to the reduction of greenhouse gas emissions. Moreover, the supply of biomass is insufficient for large-scale energy production in the Netherlands, and it has to be imported from other EU member states, like Sweden and Latvia. Another important aspect is that energy efficiency will increase gradually over time.
In 2015, 5.6% of total energy was generated from renewable resources [
24]. Nearly two-thirds of this renewable energy was generated from biomass. Biomass produced in the Netherlands is composed of waste (35%), wood from various sources (39%), and biogas from manure and sewage waste (13%). There is potential to increase the production of biomass in the Netherlands from 80 PJ in 2015 [
24] to a maximum of 200 PJ [
25].
With existing measures on the energy transition towards renewable energy, the share of renewable energy in total energy use is expected to be 16.7% in 2023 [
24]. Between 2020 and 2023, the production of renewable energy is predicted to increase by 30% due to major investments in large-scale wind power at sea and solar energy. The energy generated with biomass is predicted to increase slightly between 2020 and 2023 because of the restrictions to physical capacity of cofiring and financial capacity in the renewable energy subsidies [
24].
In October 2017, the Dutch government agreed to reduce GHG emissions by 2050 by 80–95% compared to the 1990 level [
26]. Their ambition, presented in the Climate Law, is that the Netherlands should achieve the Paris targets by 2030. Greenhouse gas emissions, therefore, need to be reduced by 49% by 2030 compared to the level of emissions in 1990. Biomass is one of the major sources of renewable energy, but it should be combined with particular forms of carbon storage. A major public debate regarding the options for large-scale storage of carbon remains to be launched. There is resistance in society regarding storage on land, and storage at sea is considered. The government has already urged to shut down large coal power plants in 2030 at the latest. Most electricity producers owning a coal power facility are now considering switching to biomass. As there is not sufficient biomass produced in the Netherlands that can be used in large electricity producing facilities, biomass has to be imported on a large-scale.
Five mitigation and adaptation options were explored to achieve a low-carbon economy in the Netherlands by 2050 [
27]): (i) the electrification of energy, (ii) the production of carbon neutral energy, (iii) energy saving, (iv) the use of renewable energy sources, such as wind power, solar power, and energy from biomass, and (v) carbon capture and storage (CCS). The report argues that a mix of all these measures is necessary to reach policy targets. However, it is undefined as to which policy mix is required to transform the economy into a low-carbon economy. All of these technological measures will have different consequences for GHG emissions and the production and use of energy and food as well as for water and land. These technological options will have socioeconomic consequences. Moreover, policies and socioeconomic interventions can contribute to the reduction of GHG emissions. These societal consequences and their cost-effectiveness have not yet been evaluated. For instance, energy saving can be realised by replacing energy-intensive technologies with less energy-intensive technologies or, in some cases, by energy neutral technologies.
3.2.3. Southwest UK
The primary energy challenge is one of economics, with primary energy consumption estimated to decrease in the two-degree scenario compared to the baseline. The economic regulators of the UK utility sectors have been instructed by the government to minimize the unit cost of all utilities to domestic customers, while at the same time requiring an increase in service level, resilience, and environmental performance [
28]. This has been aggravated by the general tendency toward time inconsistency in strategic planning at the government and utility levels [
29].
The southwest is the chosen location for the next major nuclear energy installation, which will potentially act as a bottleneck that limits the capacity of the transmission/distribution network to accept more renewable energy generation. However, this situation may be mitigated by reinforcement of the network [
30].
3.3. Synergies and Trade-Offs in the Case Studies between Energy and the Nexus of Water–Food–Land–Climate
This section presents an overview of interlinkages between energy and the nexus sectors water, food, land, and climate. Interviews with stakeholders were held in the three case studies (Latvia, The Netherlands, and southwest UK), including policy, business, research and civil society organizations.
3.3.1. Latvia
There are synergies between energy supply and the use of wood-based fuels for heat production and hydro-power for electricity production. Already in 2001, the share of renewable energy sources (RES) based energy accounted for 34% of the total energy supply. Latvia will reach a 40% share of energy from renewable sources in gross final consumption in 2020. The main challenges in the RES sector relate to the efficient utilization of historically developed sources, i.e., wood-based biomass and hydro-power and to ensure energy diversification through the application of other renewable energy sources (e.g., wind, solar, other types of biomass).
There are potential conflicts regarding the use of renewable energy (mainly bioethanol and biodiesel) in the transport sector. It is still underdeveloped in Latvia and constitutes less than 3% of the total use (2016) as compared with the 10% target to be reached by 2020. The transport sector is obliged to sell petrol and diesel blended with biofuels, and there are tax regulation mechanisms [
31]. While the sustainability criteria for biofuels have been set, there is no obligation to sell blends only with biofuels corresponding to the sustainability criteria. There are also no exemptions for applications for reduced excise duty tax for all biofuels. Amendments in legislation may overcome such trade-offs between energy resources, land management, and climate policies.
The use of solid biomass (e.g., wood fuels) for energy production potentially creates synergy with climate mitigation, but, at the same time, puts pressure on forests in regard to biodiversity, sequestration of carbon, and competition with the production of wood-based products with high added-value. On top of this, wood is also exported both as wood timber and as a fuel for combustion plants. Continuation of averting the share of renewable energy sources from domestic use may intensify the pressure on forests to ensure the production capacity of raw materials. Moreover, the growth of energy plants may compete with arable land to be used for food production as well as affect water quality in water bodies from the application of fertilizers and pesticides.
Replacing fossil fuels with biofuels helps to reduce GHG emissions from the transport sector. However, the production processes need to change to keep this energy source feasible. The supply of energy crops (e.g., rapeseed) is increasing, and this is foreseen to remain in the coming years. This however may result in indirect land-use change (biofuels compete for land for food production). Unfolding a potential of the second generation biofuels could be the way forward, but the following conditions have to be assessed: availability of resources for production (e.g., biodegradable waste), technological readiness level, affordability of investments.
Installed technologies for energy production from RES help to reduce GHG emissions, but the use of solar panels and wind turbines for power generation, etc., involves direct impacts on land, such as the removal of vegetation and soil and alterations to topography. At the same time, meteorological conditions directly govern the actual outputs of thermal solar panels, photovoltaics, and wind turbines. Currently, wind and solar energy do not play important roles in the energy balance in Latvia, although recent developments show a good prospect for penetration of the respective technologies at a broader scale.
3.3.2. The Netherlands
Based on the literature review and stakeholder consultation, the main nexus challenges related to the use of biomass for energy generation are as follows [
32]:
Biomass should be produced and collected sustainably, which means without harm to food availability and biodiversity [
25], although such biomass is scarce in the Netherlands (and also is imported);
Large-scale application of biomass for energy production will affect the availability and quality of land, water, food, and energy and will affect the climate;
There is debate as to whether the use of biomass for energy generation contributes to a net reduction in GHG emissions or not. This is only feasible if biomass use for energy is combined with carbon capture and storage. The sustainability criteria for biomass are also under debate [
31].
In addition, biomass has a negative image because it is often associated with the use of coal for energy production (cofiring) and with large-scale deforestation. It is also associated with land grabbing and competition with local food production;
In addition, there are knowledge gaps between politicians and the public about the diversity of biomass and the best application of these different types.
The increase in the use of solid biomass for energy production creates a synergy with climate change, although this is mainly effective if biomass for energy production is combined with carbon capture and storage (see [
33]). However, the supply of solid biomass that can replace the use of fossil fuels for energy production is significantly larger than the amount of solid biomass that can be produced in the Netherlands. An increase in land-use for the generation of solid biomass would require a large share of mainly agricultural land, which then would replace food production (meat and food crops).
More recently, [
34] showed that renewable energy production, such as solar or wind power, also requires land in order to produce carbon neutral electricity at a large-scale. Given that land is already scarce in the Netherlands, the land requirements of solar and wind power might restrict the application of these types of renewable energy.
Biomass has multiple applications. It can be used for energy production, but the chemical sector also tries to green their resources for production, so there is competition for biomass as well (see [
33]).
3.3.3. Southwest UK
A major trade-off to be explored is centered on the aim of energy decarburization, and the prioritization of either nuclear or renewable energy, which have both been identified as low-carbon solutions [
35]. The southwest region of the UK has England’s largest natural supply of wind and solar energy, with the greatest installed capacity [
36]. The southwest peninsula also has the most accessible offshore renewable resources in England, including wave, tidal, and wind power, which are largely unexploited. The conflict arises as the southwest has additionally been chosen as the location for the next major nuclear energy installation. Nuclear energy, while excellent at providing very consistent baseload output, has a very limited ability to respond rapidly to fluctuations in demand. This is incongruent with the government’s objective of creating a flexible energy network and the intermittent nature of renewables, which fluctuate with the available resource. Further, the baseload output of the nuclear energy station will potentially act as a bottleneck that limits the capacity of the transmission/distribution network to accept more renewable energy generation. It is believed that the grid capacity challenge can be mitigated by reinforcement of the network but at significant capital cost [
30]. For nuclear and renewables to coexist in the southwest, there is a greatly heightened need for mechanisms to attenuate the temporal disparities between supply and demand and increase the network capacity [
37]. To compound the complexity of the problem, at a national level, both new nuclear and renewables are subsidized via the same funding mechanism “Contracts for Difference”, and they access the same budgetary resources [
38]. Therefore, both economic and technical dimensions play a role in the trade-off between nuclear and renewable energy.
Synergies with water management are created through raw water resources, providing the opportunity for hydro-power generation. This option is suitable for the region, although new plants have high capital costs, and the economically viable resources are largely being fully exploited.
Synergies could also be created by changing land-use and water management practices. Upstream catchment management and paid ecosystem services, for example, would improve the surface water quality and reduce the energy demands from drinking water treatment. A pioneer demonstration program of rewetting moorlands and improving farming practices has potential benefits for surface water quality and biodiversity [
39]. However, there might be challenges to establish and maintain such paid ecosystem agreements [
40]. Similarly, synergies could be established through sustainable urban drainage systems (SUDS), reducing surface flood risks, sewer flood risk, and sewer storm flow [
41]. This would reduce wastewater pumping and treatment and, consequently, energy demand. Southwest water has an engagement program with local authorities and housing developers in regard to the implementation of SUDS. The main barriers to full exploitation are due to the high capital cost for retrofit, and complex issues surrounding the responsibility of ownership and maintenance. Also, there is a significant challenge since economic benefits are not usually seen by those financing SUDs and/or payback periods can be long and difficult to calculate [
42].
There are potential synergies from water to land and energy, since the anaerobic digestion of sewage sludge generates methane gas that is suitable for energy use, and composted sludge cake from anaerobic digestion of sludge is rich in phosphates and nitrogen [
43]. When disposed to agricultural land, composted sludge cake can provide valuable fertilizer, offsetting the need for fertilizers from other sources and reducing energy consumption. Sludge passed to anaerobic digestion remains at a relatively low proportion within the southwest, and the majority of sludge is ‘limed’, which is of lower agricultural value. The main barriers to further exploitation are the logistic challenge of sludge transport to centralized anaerobic digested treatment and the capital costs to build a treatment plant.
Synergies between water and energy could be created by improving the resilience or security of the energy supply. Energy supply in the southwest UK is critical to the water services in this region. It would improve the resilience and security of water, but high capital costs are a barrier to further exploitation.
Large land resources are suitable for the onshore production of wind energy. Such synergies from land to energy can be deployed on land also used for cattle and crop cultivation. So far, most economically viable resources are being exploited, and further development remains limited due to planning restrictions and the grid connection capacity [
44].
3.4. System Dynamics Modelling as a Methodology of Integration
3.4.1. A Methodology of Integration
System dynamics modelling (SDM) was introduced as a methodology to take into consideration the interactions generated in the nexus of water, land, energy, food and climate. It merges top-down and bottom-up approaches. The top-down learning draws from the E3ME model with expert validated decisions and how they are implemented in such a modelling framework. The bottom-up learning focuses on new relations between systems drawn from expert knowledge and participatory approaches with local stakeholders. Causal loops were introduced to integrate knowledge and create causal feedback mechanisms, offering a holistic approach to the nexus. An additional advantage of such causal loops is that they are fully transparent and hence, can be easily understood by nonexperts and therefore, be suitable for interactive development with stakeholders.
The SDM was used in the Latvia case to focus on low-carbon development by respecting thresholds for greenhouse gas emissions and increased use of RES. Interlinkages are presented between water, land (e.g., forestry), food (e.g., agriculture), and energy production from RES and fossil sources. The SDM in the Netherlands focused on competing claims regarding the use of biomass for the bio-economy, including food, fiber, feedstock for the chemical and manufacturing industry, and energy. Imports of biomass were included as well. The sustainability aspects of biomass use were also taken into account. The SDM was used in the UK to enable detailed scenario-based analysis and eventually also support both business planning and stakeholder engagement. Resource efficiency and de-carbonization were the two main objectives, and the two key metrics to track performance were the total CO2 emissions and the ratio between the total resources supplied by each nexus sector (including energy) and those directly consumed by societal demand.
3.4.2. Energy Sector Submodel in Southwest UK
The energy sector submodel seeks to examine the balance between supply and demand within the regions of electrical and thermal energy. In this study, all forms of renewable energy generation within the southwest region were included as were all forms of fossil fuel and grid electricity import.
The energy sector submodel is the most notable example of a supply-led philosophy, replacing the more common demand-led philosophy seen elsewhere within the nexus SDM (see
Figure 1).
The supply-led approach was used to account for the nature of renewable energy generation, which is largely driven by resource availability. For example, photovoltaic solar energy can only be generated during daylight hours, and output is governed by light intensity. In its current state, the distribution network operator (DNO) conducts a very limited generation curtail of renewable energy suppliers to balance supply and maintains the network capacity. This, however, is projected to increase dramatically in the coming years as DNOs switch to a distribution system operator model, whereby they become responsible for balancing arrangements. The SDM, therefore, provides an opportunity to examine strategies for enhancing the utilization of renewable energy generation by including load and generation curtailment and dynamic network capacity controls.
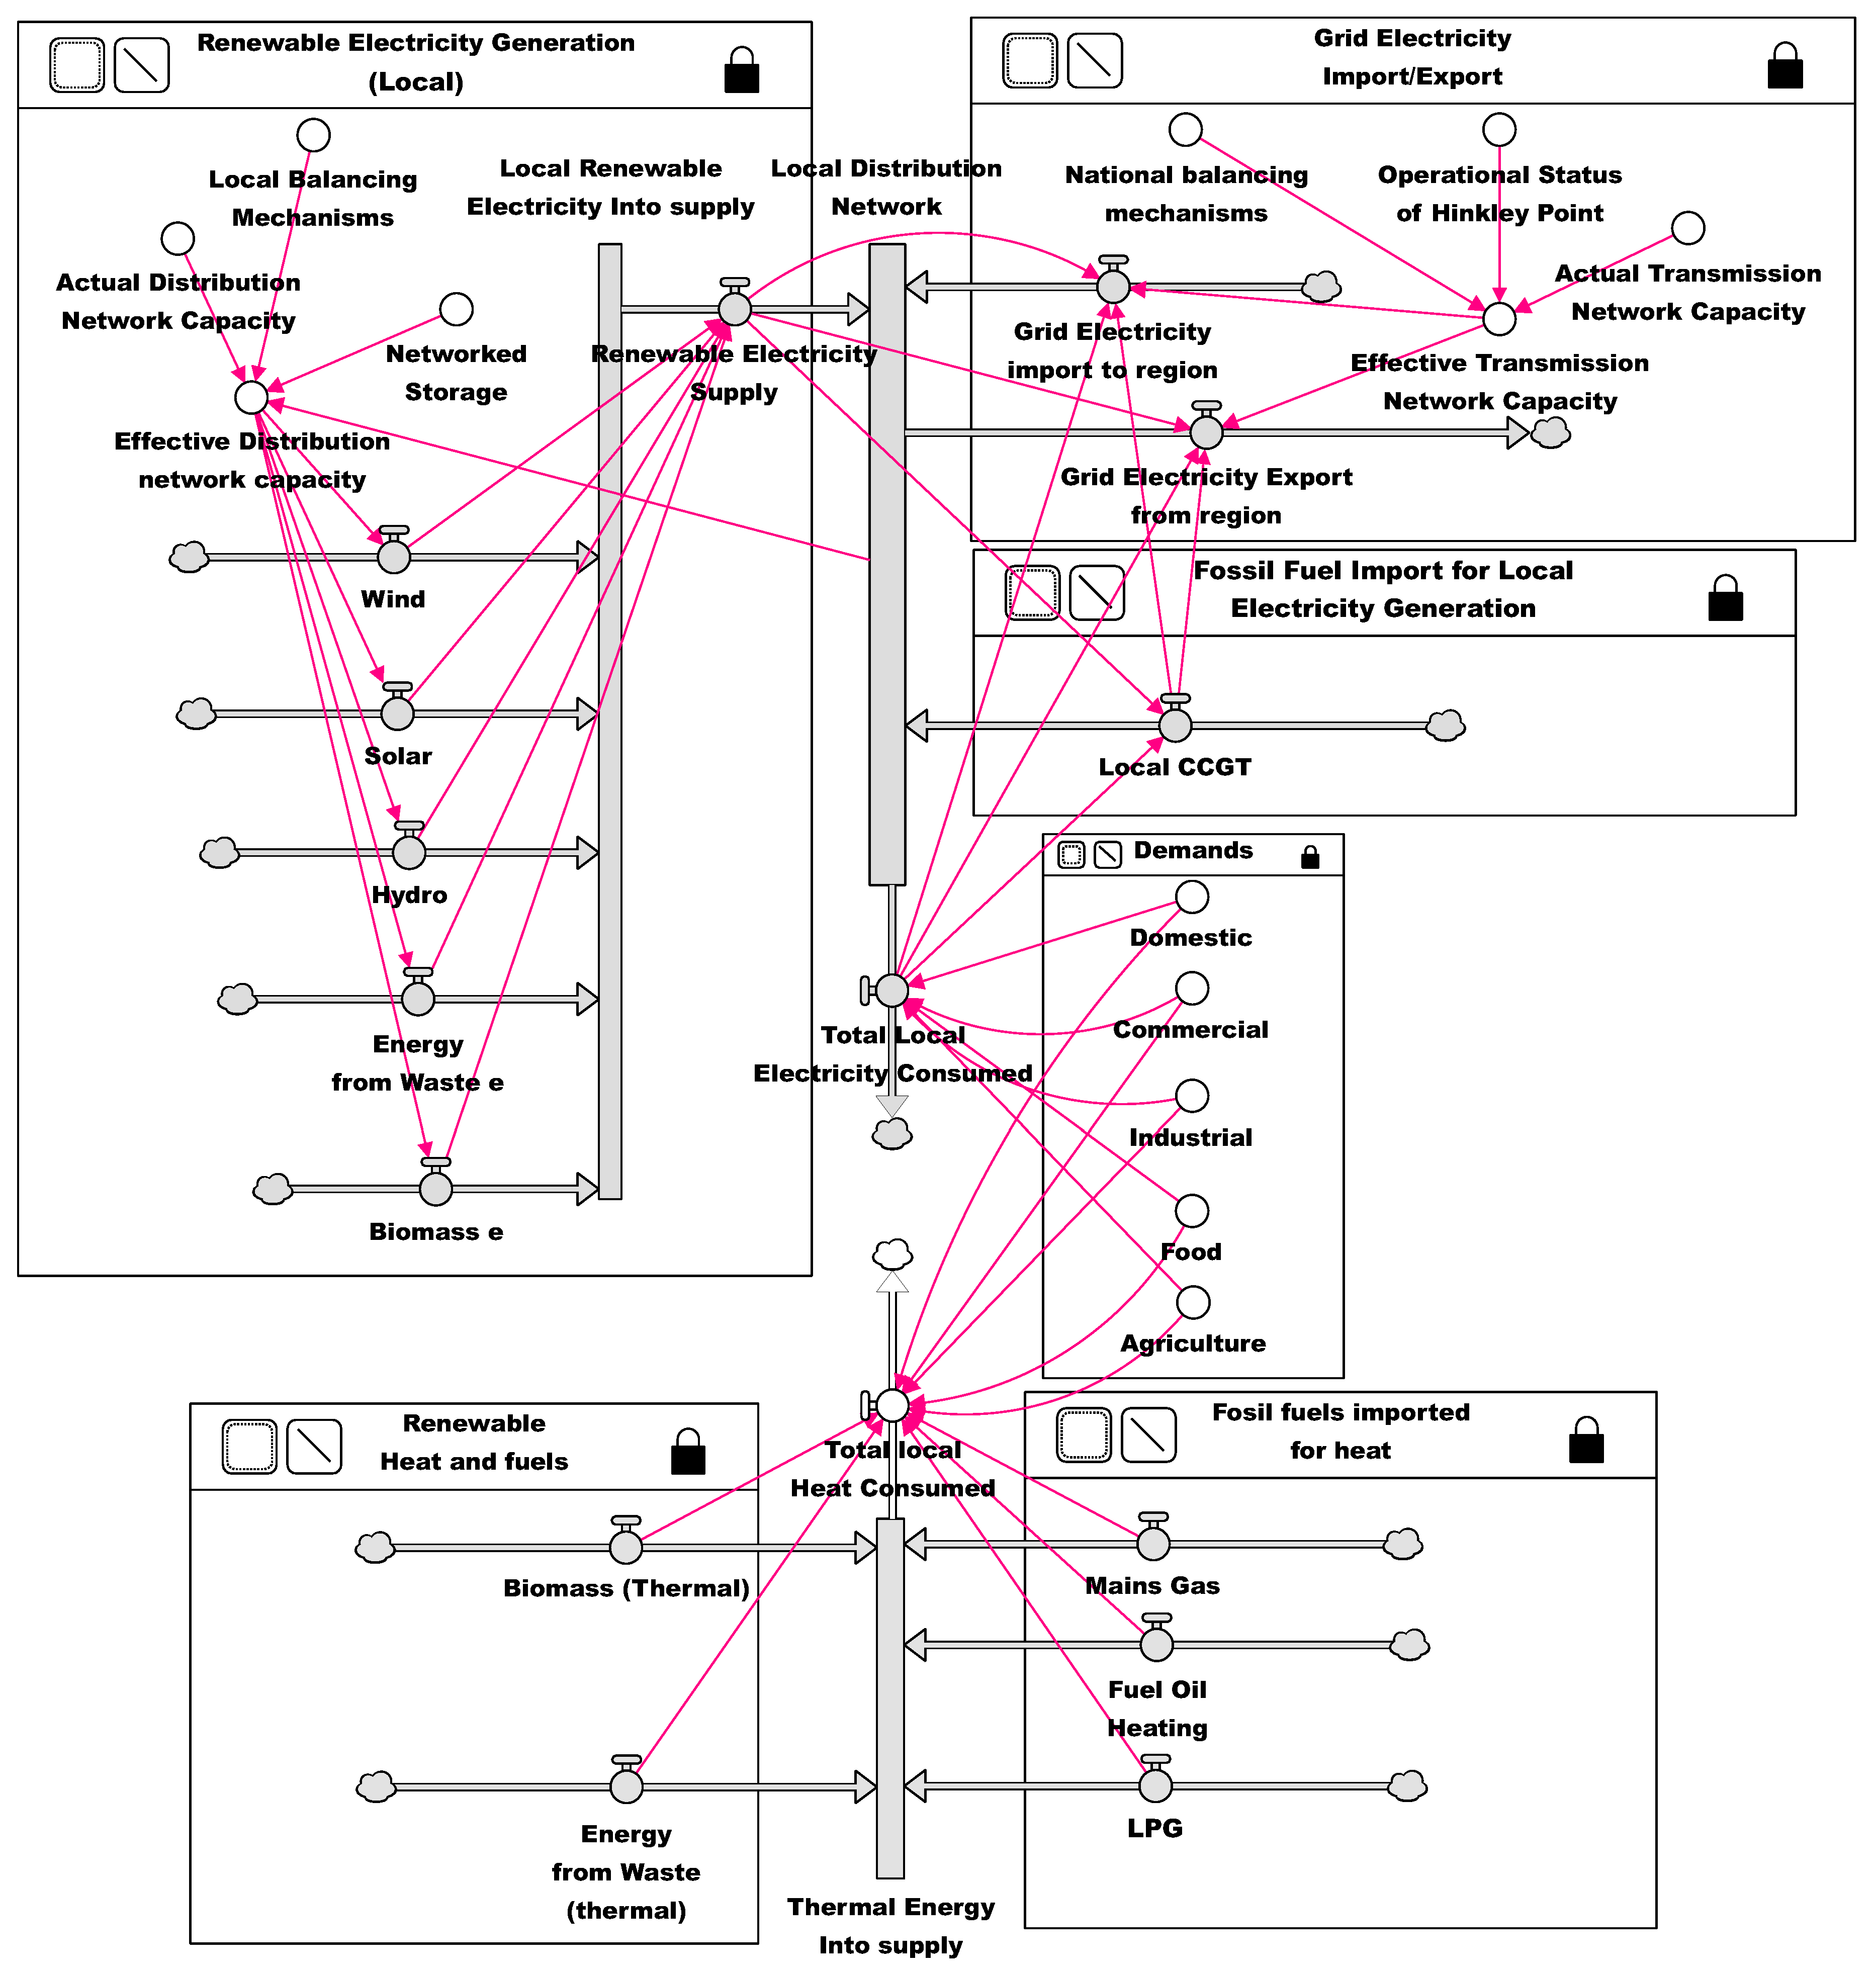
A renewable generation local module is part of the energy sector submodel (see
Figure 2). The model nominally assumes that all renewable energy generated by the available resources is supplied into the local distribution network without curtailment or constraint by offtake demand. This situation is only possible while renewable energy generation is nominally lower than demand and while sufficient capacity within the distribution network exists.
It is worth noting that major constraints within the distribution and transmission networks do exist and are the major limiting factors in the development of generating new capacity within the region. The model therefore includes network capacity coefficients as management variables. This takes the form of an Actual Network Capacity and an Effective Network Capacity, which is driven by coefficients for Network Storage and the presence of Local Balancing Mechanisms (dynamic supply/demand activities). The objective of these variables is to seek to identify the benefits (in terms of increased utilization of renewables) of increasing capacity within the distribution network or implementing generation curtailment. All forms of renewable energy generation are connected to the Local Renewable Electricity into Supply stock and are described in terms of Available Resources, Installed Capacity, and Capacity Factor. This approach enables all three variables to change over time. In the case of Available Resources, this may change as a result of climate change or land-use restrictions. Installed capacity describes the total megawatt generating capacity of all aggregated assets of that type; policies to deploy renewables will impact this variable directly. The capacity factor describes the relationship between actual generation and potential generation of the asset; therefore, with improved efficiency or different management philosophy, the capacity factor may improve or decline over time. At present, it is not clear if this approach is too complex; it may become easier to use a purely data driven method that relies entirely on the thematic models to provide volume of energy generated by technology type.
4. Discussion and Conclusions
This paper introduced the nexus concept in relation to achieving resource efficiency in Europe through three specific cases in Latvia, The Netherlands and southwest UK. In these three specific cases, which were used as examples, a macroeconomic model E3ME was applied, allowing for the estimation of energy demands for a baseline scenario and the two-degree scenario. The outcomes were compared with the use of system dynamics modelling, a complexity science methodology where feedback loops and interactions between various nexus components are implemented in the conceptual model.
Traditional modelling approached (e.g., E3ME) do not take into account the direct and indirect linkages between energy and related resources (e.g., water, land, food and climate). Also, the existing modelling capacity of E3ME) does not implement impacts of land-use and water demand, as follows:
There might be numerous technical opportunities for the water sector to synergies with the objective of the energy sector (generating energy, reducing or controlling demand) but their feasibility is challenged by the high capital costs, especially in the case of the southwest of the UK, as detailed in
Section 3.3.3. Similar to this, nonengineering, management-based solutions that address land-use practices offer multi-partied benefits to land, water, and energy, but they are contractually complex, again as detailed in
Section 3.3.3.
The energy and chemical sectors compete for sustainable biomass. The penetration of alternative fuels in the transport sector has implications to land-use and agriculture. Cross-sectoral interactions in the economy and with future land-use patterns are barely covered in the current modelling capacity, which makes traditional models like E3ME less likely to implement these aspects in regions where these aspects are important (e.g., for Latvia, as detailed in
Section 3.3.1).
Land-use implications could create synergies with energy demand. The lower demand for energy and increased use of renewables has implications for land-use in the sense that if some energy is produced domestically (e.g., coal mines), these may be closed, and the land may become available. Moreover, reduced demand for energy may also translate in fewer power plants being required, so again, this would have implications for land-use. Similarly, land is required for the supply of renewable energy, including biomass, wind, and solar power.
The diversity of biomass and its particular applications: Generally (with the exception of hydro and bioenergy), renewables are less water-intensive than conventional power plants. The scenarios presented in this paper do encourage the uptake of solar and wind, which have very small water requirements so are likely to have less pressure on water availability. However, the increased demand for food and bioenergy would likely lead to increased use of water/land resources, so the interesting question is here is: which impact is larger? This particular linkage is significant for the Netherlands and Latvia.
In principle, energy is a critical resource, and the existing modelling capacity enables the projection of energy demand and related emissions of greenhouse gases. Energy saving and investments to finance improvements in energy efficiency are key components to substantially decrease energy-related emissions. Water and land have a limited focus in the current energy modelling tools, such as E3ME. It is also hard to estimate the deviations in the two-degree scenario with regard to land-use and water demand, as detailed in
Section 3.1.2. However, the availability of such resources is critical to resource efficiency, strengthening a transition to a low-carbon economy with an increase in non-renewable energy sources (e.g., for the Netherlands and the southwest of the UK).
Water is an important resource. For power generation, for example, water use requirements will reduce over time, because of increased renewables and less water being needed for cooling. However, increased bioenergy and food demand will probably require more water. Land can be an important source for renewable energy supply, as is currently debated in the Netherlands. An increase in renewable energy generation requires land for either wind and solar power, or for biomass production.
Integrating the knowledge from existing modelling (e.g., E3ME) with System Dynamics Modelling approaches will allow the nexus concept to be implemented in policy assessments integrating energy and related natural resources. This approach does merge learning from well-established modelling tools (e.g., E3ME) with expert knowledge from participatory approaches, leading to integrated conceptual approaches, as detailed in
Figure 1 and
Figure 2 for the southwest UK.
In general, the efficient use of energy resources needs to be supported by policies and decision-making. In this context, the nexus concept provides integrated knowledge for cross-sectoral decision-making and planning, with an explicit focus on biophysical, socioeconomic, and policy interactions across sectors (including trade-offs and synergies), leading to more efficient strategies for a resource efficient Europe. Such aspects are given high priority by the stakeholders in the three case studies (e.g., Latvia, The Netherlands and Southwest UK) with an interest in climate and renewable energy and can be taken into account through SDM.
Author Contributions
F.B. and L.V.-L. worked on the concept and methodology for this paper. F.B. wrote the paper with contributions from L.V.-L., E.A., I.B., V.L., and M.G., E.A. wrote the part on the E3ME model. I.B. analyzed the case study on Latvia, V.L. analyzed the case study on the Netherlands, and M.G. analyzed the case study on southwest UK. I.B. drafted the text for Latvia, V.L. drafted the text on the Netherlands, and M.G. drafted the text on southwest UK.
Funding
The work described in this paper was conducted within the project SIM4NEXUS. This project received funding from the European Union’s Horizon 2020 research and innovation programme under Grant Agreement No 689150 SIM4NEXUS. This paper and the content included in it do not represent the opinion of the European Union, and the European Union is not responsible for any use that might be made of its content.
Acknowledgments
The authors thank three anonymous reviewers whose comments contributed to significantly improve the quality of this paper.
Conflicts of Interest
The authors declare no conflicts of interest. The funders had no role in the design of the study; in the collection, analyses, or interpretation of data; in the writing of the manuscript, and in the decision to publish the results.
References
- Kling, C.L.; Arritt, R.W.; Calhoun, G.; Keiser, D.A. Integrated assessment models of the food, energy, and water Nexus: A review and an outline of research needs. Annu. Rev. Resour. Econ. 2017, 9, 143–163. [Google Scholar] [CrossRef]
- Climate Strategies. The EU’s 2030 Climate and Energy Framework and Energy Security. London, UK. Available online: https://bit.ly/2qj3Sjp (accessed on 30 October 2018).
- European Commission. The Macroeconomic and other Benefits of Energy Efficiency (EED Directive). Study for the European Commission, Directorate-General for Energy, Contract No. ENER/C3/2013-484/03/FV2015-523 under the Multiple Framework Service Contract ENER/C3/2013-484. Available online: https://bit.ly/2mf0jux (accessed on 31 October 2018).
- Cambridge Econometrics. Employment Effects of Selected Scenarios from the Energy Roadmap 2050. Report was Carried under a Specific Contract within DG ENER’s Framework Contract ENER A2 360-2010 Regarding Impact Assessment and Evaluations (Ex-Ante, Intermediate and Ex-Post). Available online: https://bit.ly/2DeYkyy (accessed on 31 October 2018).
- European Commission. Commission Staff Working Document Impact Assessment, Accompanying the document “Proposal for a Directive of the European Parliament and of the Council amending Directive 2012/27/EU on Energy Efficiency”; European Commission: Brussels, Belgium, 2016. [Google Scholar]
- National Grid PLC. Future Energy Scenarios. National Grid PLC: Warwick, UK. Available online: https://ngrid.com/2CPquzf (accessed on 30 October 2018).
- UNECE. Deployment of Renewable Energy: The Water-Energy-Food-Ecosystem Nexus Approach to Support the Sustainable Development Goals. Geneva, United Nation Economic Commission for Europe. Available online: https://bit.ly/2DaMkhR (accessed on 30 October 2018).
- Brouwer, F.; Avgerinopoulos, G.; Fazekas, D.; Laspidou, C.; Mercure, J.-F.; Pollitt, H.; Ramos, E.P.; Howells, M. Energy modelling and the Nexus concept. Energy Strategy Rev. 2018, 19, 1–6. [Google Scholar] [CrossRef]
- Munaretto, S.; Witmer, M. Water-Land-Energy-Food-Climate Nexus: Policies and Policy Coherence at European and International Scale; Netherlands Environmental Assessment Agency (PBL): The Hague, The Netherlands, 2017. [Google Scholar]
- Sušnik, J.; Chew, C.; Domingo, X.; Mereu, S.; Trabucco, A.; Evans, B.; Vamvakeridou-Lyroudia, L.; Savić, D.A.; Laspidou, C.; Brouwer, F. Multi-Stakeholder Development of a Serious Game to Explore the Water-Energy-Food-Land-Climate Nexus: The SIM4NEXUS Approach. Water 2018, 10, 139. [Google Scholar] [CrossRef]
- Trabucco, A.; Sušnik, J.; Vamvakeridou-Lyroudia, L.; Evans, B.; Masia, S.; Blanco, M.; Roson, R.; Sartori, M.; Alexandri, E.; Brouwer, F.; et al. Water-Food-Energy Nexus under Climate Change in Sardinia. Proceedings 2018, 2, 609. [Google Scholar] [CrossRef]
- Cambridge Econometrics. E3ME: Out Global Macro-econometric Model. Available online: https://bit.ly/2LkkWPF (accessed on 17 December 2018).
- Lavoie, M. Post-Keynesian Economics: New Foundations; Edward Elgar: Cheltenham, UK; Northampton, MA, USA, 2014; ISBN 978-1-84720-483-7. [Google Scholar]
- King, J.E. Advanced Introduction to Post Keynesian Economics; Edward Elgar: Cheltenham, UK; Northampton, MA, USA, 2015; ISBN 978-1-78254-842-3. [Google Scholar]
- Pollitt, H.; Mercure, J.-F. The role of money and the financial sector in energy-economy models used for assessing climate and energy policy. Clim. Policy 2017, 18, 184–197. [Google Scholar] [CrossRef]
- Barker, T.; Dagoumas, A.; Rubin, J. The macroeconomic rebound effect and the world economy. Energy Effic. 2009, 2, 411–427. [Google Scholar] [CrossRef]
- Mercure, J.-F.; Pollitt, H.; Viñuales, J.E.; Edwards, N.R.; Holden, P.B.; Chewpreecha, U.; Salas, P.; Sognnaes, I.; Lam, A.; Knobloch, F. Macroeconomic impact of stranded fossil fuel assets. Nat. Clim. Chang. 2018, 8, 588–593. [Google Scholar] [CrossRef]
- Holden, P.B.; Edwards, N.R.; Ridgwell, A.; Wilkinson, R.D.; Fraedrich, K.; Lunkeit, F.; Pollitt, H.; Mercure, J.-F.; Salas, P.; Lam, A.; et al. Climate—Carbon cycle uncertainties and the Paris Agreement. Nat. Clim. Chang. 2018, 8, 609–613. [Google Scholar] [CrossRef]
- Mercure, J.-F.; Pollitt, H.; Bassi, A.M.; Viñuales, J.E.; Edwards, N.R. Modelling complex systems of heterogeneous agents to better design sustainability transitions policy. Glob. Environ. Chang. 2016, 37, 102–115. [Google Scholar] [CrossRef]
- Mercure, J.-F.; Pollitt, H.; Edwards, N.R.; Holden, P.B.; Chewpreecha, U.; Salas, P.; Lam, A.; Knobloch, F.; Vinuales, J.E. Environmental impact assessment for climate change policy with the simulation-based integrated assessment model E3ME-FTT-GENIE. Energy Strategy Rev. 2018, 20, 195–208. [Google Scholar] [CrossRef]
- European Commission. EU Reference Scenario 2016—Energy, Transport and GHG Emissions Trends to 2050. Brussels, European Commission, Directorate-General for Energy, Directorate-General for Climate Action and Directorate-General for Mobility and Transport. Available online: https://ec.europa.eu/energy/sites/ener/files/documents/20160713%20draft_publication_REF2016_v13.pdf (accessed on 10 August 2018).
- IEA. World Energy Outlook 2013. OECD/IEA: Paris, France. Available online: https://www.iea.org/publications/freepublications/publication/WEO2013.pdf (accessed on 10 August 2018).
- Prūse, I. Developments Related to Low Carbon Development Strategy 2050 and Climate Change Adaptation Strategy 2030 (in Latvian). Available online: https://bit.ly/2PJEwW6 (accessed on 10 August 2018).
- Schoots, K.; Hekkenberg, M.; Hammingh, P. Nationale Energieverkenning 2017. ECN, Amsterdam/Petten, ECN-O-17-018. 2017. Available online: https://bit.ly/2EydEHx (accessed on 17 December 2018).
- Planbureau voor de Leefomgeving. Biomass: Wishes and Limitations. Planbureau voor de Leefomgeving: The Hague, The Netherlands. Available online: https://themasites.pbl.nl/biomass/ (accessed on 17 December 2018).
- VVD, CDA, D66, ChristenUnie. Vertrouwen in de Toekomst; Regeerakkoord 2017–2021 VVD, CDA, D66 en ChristenUnie. Den Haag. Available online: https://bit.ly/2i1wmgo (accessed on 10 September 2018).
- PBL. Opties voor Energie-en Klimaatbeleid; Netherlands Environmental Assessment Agency (PBL): The Hague, The Netherlands, 2016; Available online: https://bit.ly/2ao3d7n (accessed on 10 September 2018).
- OFGEM. Our Strategy for Regulating the Future Energy System. 2017. Available online: https://www.ofgem.gov.uk/system/files/docs/2017/08/our_strategy_for_regulating_the_future_energy_system.pdf (accessed on 24 August 2018).
- Fankhauser, S. A Practitioner’s Guide to a Low-Carbon Economy: Lessons from the UK. Centre for Climate Change Economics and Policy (CCCEP). Available online: http://www.lse.ac.uk/GranthamInstitute/wp-content/uploads/2014/03/PP_low-carbon-economy-UK.pdf (accessed on 24 August 2018).
- Western Power Distribution. South West 132kV Network Capacity Restriction UPDATE March 2016. Available online: https://www.westernpower.co.uk/docs/connections/Generation/Generation-capacity-map/Distributed-Generation-EHV-Constraint-Maps/WPD-Southwest-network-capacity-restriction.aspx (accessed on 24 August 2018).
- RES LEGAL Europe. Available online: http://www.res-legal.eu/search-by-country/latvia (accessed on 10 August 2018).
- Linderhof, V.; Polman, N.; Selnes, T.; Witmer, M.; Munaretto, S.; Susnik, J. The Main Nexus Challenges in ‘The Netherlands’. Deliverable 5.2 for The Netherlands. Available online: https://bit.ly/2O53uyW (accessed on 1 September 2018).
- Strengers, B.; Eerens, H.; Smeets, W.; van den Born, G.J.; Ros, J. Negatieve Emissies: Technisch Potentieel, Realistisch Potentieel en Kosten voor Nederland; Planbureau voor de Leefomgeving: The Hague, The Netherlands, 2018; Available online: https://bit.ly/2Me6Wpf (accessed on 1 September 2018).
- Van Zalk, J.; Behrens, P. The spatial extent of renewable and non-renewable power generation: A review and meta-analysis of power densities and their application in the U.S. Energy Policy 2018, 123, 83–91. [Google Scholar] [CrossRef]
- Department of Energy & Climate Change (DECC). Overarching National Policy Statement for Energy (EN-1). Available online: https://assets.publishing.service.gov.uk/government/uploads/system/uploads/attachment_data/file/47854/1938-overarching-nps-for-energy-en1.pdf (accessed on 24 August 2018).
- Regen. Renewable Energy. A Local Progress Report for England 2016. Available online: https://www.regen.co.uk/wp-content/uploads/2016_Progress_Report_2016-1.pdf (accessed on 24 August 2018).
- Western Power Distribution. DSO-Transition-Strategy. 2017. Available online: https://www.westernpower.co.uk/docs/About-us/Our-business/Our-network/Strategic-network-investment/DSO-Strategy/DSO-Transition-Strategy.aspx (accessed on 18 December 2018).
- Department of Energy & Climate Change (DECC). Annual Energy Statement. 2014. Available online: https://assets.publishing.service.gov.uk/government/uploads/system/uploads/attachment_data/file/371388/43586_Cm_8945_print_ready.pdf (accessed on 24 August 2018).
- South West Water. Annual Report and Financial Statements. 2014. Available online: https://www.southwestwater.co.uk/globalassets/document-repository/annual-reports/sww_annual_report___financial_statements_2014.pdf (accessed on 24 August 2018).
- Water LIFE. Opportunities and Barriers to Using Payments for Ecosystem Services and Supply Chain Measures. Participatory Research in WaterLIFE Demonstration Catchments. Available online: https://www.catchmentbasedapproach.org/media/attachments/2017/07/03/09_complete_opps_barriers_pes.pdf (accessed on 18 December 2018).
- Zhou, Q. A review of sustainable urban drainage systems considering the climate change and urbanization impacts. Water 2014, 6, 976–992. [Google Scholar] [CrossRef]
- Ossa-Moreno, J.; Smith, K.; Mijic, A. Economic analysis of wider benefits to facilitate SuDS uptake in London, UK. Sustain. Cities Soc. 2017, 28, 411–419. [Google Scholar] [CrossRef]
- Wiechmann, B.; Dienemann, C. Sewage Sludge Management in Germany. Umweltbundesamt, 2013. Available online: https://www.umweltbundesamt.de/sites/default/files/medien/378/publikationen/sewage_sludge_management_in_germany.pdf (accessed on 24 August 2018).
- Distribution Future Energy Scenarios A generation and demand study Technology Growth Scenarios to 2032 Wester Power Distribution & Regen SW 2018. Available online: https://bit.ly/2Gnekkx (accessed on 17 December 2018).
© 2018 by the authors. Licensee MDPI, Basel, Switzerland. This article is an open access article distributed under the terms and conditions of the Creative Commons Attribution (CC BY) license (http://creativecommons.org/licenses/by/4.0/).

 ,
, 

