Analysis of Blue and Green Water Consumption at the Irrigation District Scale


1
State Key Laboratory of Hydrology-Water Resources and Hydraulic Engineering, Hohai University, Nanjing 210098, China
2
College of Hydrology and Water Resources, Hohai University, Nanjing 210098, China
3
College of Water Conservancy and Hydropower Engineering, Hohai University, Nanjing 210098, China
*
Author to whom correspondence should be addressed.
Sustainability 2018, 10(2), 305; https://0-doi-org.brum.beds.ac.uk/10.3390/su10020305
Submission received: 5 December 2017
/
Revised: 9 January 2018
/
Accepted: 23 January 2018
/
Published: 24 January 2018
(This article belongs to the Special Issue Impacts of Climate Change on Hydrology, Water Quality and Ecology)
Abstract
:The concepts of virtual water and water footprint bring a new perspective for water management. Previous studies mainly focus on one type of water and the relationship between water footprint and water availability. In this study, three indicators were proposed to show water consumption and the influences of virtual water flows at the Hetao irrigation district, China, during 2001–2010, considering both blue and green water. Results indicate that the ratio of blue water footprint and blue water availability was 0.642 in 2010 and the value for green water was 0.148, coefficients on contribution of regional production on consumption in other areas were about 0.9, and coefficients on influences of trades from other regions to the district on regional water consumption were 0.528 (blue water) and 0.433 (green water), respectively. Government should promote water pricing policies that can encourage the adoption of irrigation technologies and water-saving practices. Besides, the adjustment of the crop sowing date or the cultivation of new varieties may be helpful in using more rainfall. Lastly, a compensation mechanism for virtual water export should be built in the future, and virtual water importing can be advocated. Before actions are taken, the possible influences and related constraints should be considered.
1. Introduction
Affected by both human activities and climate changes, water problems including the conflicts between water demand and supply have become more and more severe [1,2]. Consequently, a large number of studies have been conducted to solve these problems, and many different methods were involved [3,4,5,6,7]. The concepts of virtual water and water footprint were introduced in the early 1990s and 2000s, respectively, which demonstrate the trade and appropriation of water resources and different water sources (local or that from the external areas) and water types (blue water, green water, or grey water) [8]. Many different indicators based on these two concepts have been proposed to relieve global, national, or regional water problems. Mekonnen and Hoekstra assessed the global blue water scarcity (the ratio of blue water footprint to total blue water availability) on a monthly basis at a high spatial resolution (30 × 30 arc min) and found that two-thirds of the global population live under conditions of severe water scarcity at least one month of the year [9]. The same indicator was also used to evaluate the water consumption in China and the Yellow River basin [10,11]. Twenty-three of 30 studied Chinese provinces had at least moderate water stress [10], and the Yellow River basin faced moderate to severe blue water scarcity seven months (January–July) per year [11]. In our previous study, blue water scarcity at an irrigation district including the production, consumption, and water transfer perspectives were built to analyze the water problems regionally [12]. The blue water scarcity in the Hetao irrigation district was 0.491, indicating a high blue water stress level. The environmental influences and opportunity costs of green water were significantly different from those of blue water. Schyns et al. reviewed and classified about 80 indicators for green water availability and green water scarcity and discussed how to develop operational green water scarcity indicators [13]. Besides, studies for regional water management from the perspective of green water were also conducted by Falkenmark, and the green water scarcity was presented in four different types (dry climate, droughts, dry spells, and man-made green water scarcity) according to the reasons why green water can be scare [14]. Both blue and green water should be studied to provide information for the improvement of regional water management. In addition, indicators showing both the negative and positive influences brought by the virtual water flows between a certain area and its external areas, such as the blue water scarcity index and others [15,16], should also be included in the framework to analyze regional water resources, considering the fact that water transfer has become increasing common. However, studies combined the water footprints and virtual water flows considering both blue and green water are few.
In this study, three indicators are applied to show (a) how much water resources were consumed, (b) the contribution of regional production for the consumption in other areas, and (c) the influences of trade from other regions to the irrigation district on regional water consumption. The Hetao irrigation district, the largest gravity-fed irrigation district in Asia, is used as a case-study, and the analysis is based on a 10-year period (2001–2010). In this study, the influences of water footprints and virtual water flows on regional water resources are included in a framework, considering both blue and green water simultaneously. This study provides a comprehensive analysis for regional water problems and could be helpful in forming better water management practices.
2. Materials and Methods
2.1. Case Study Area
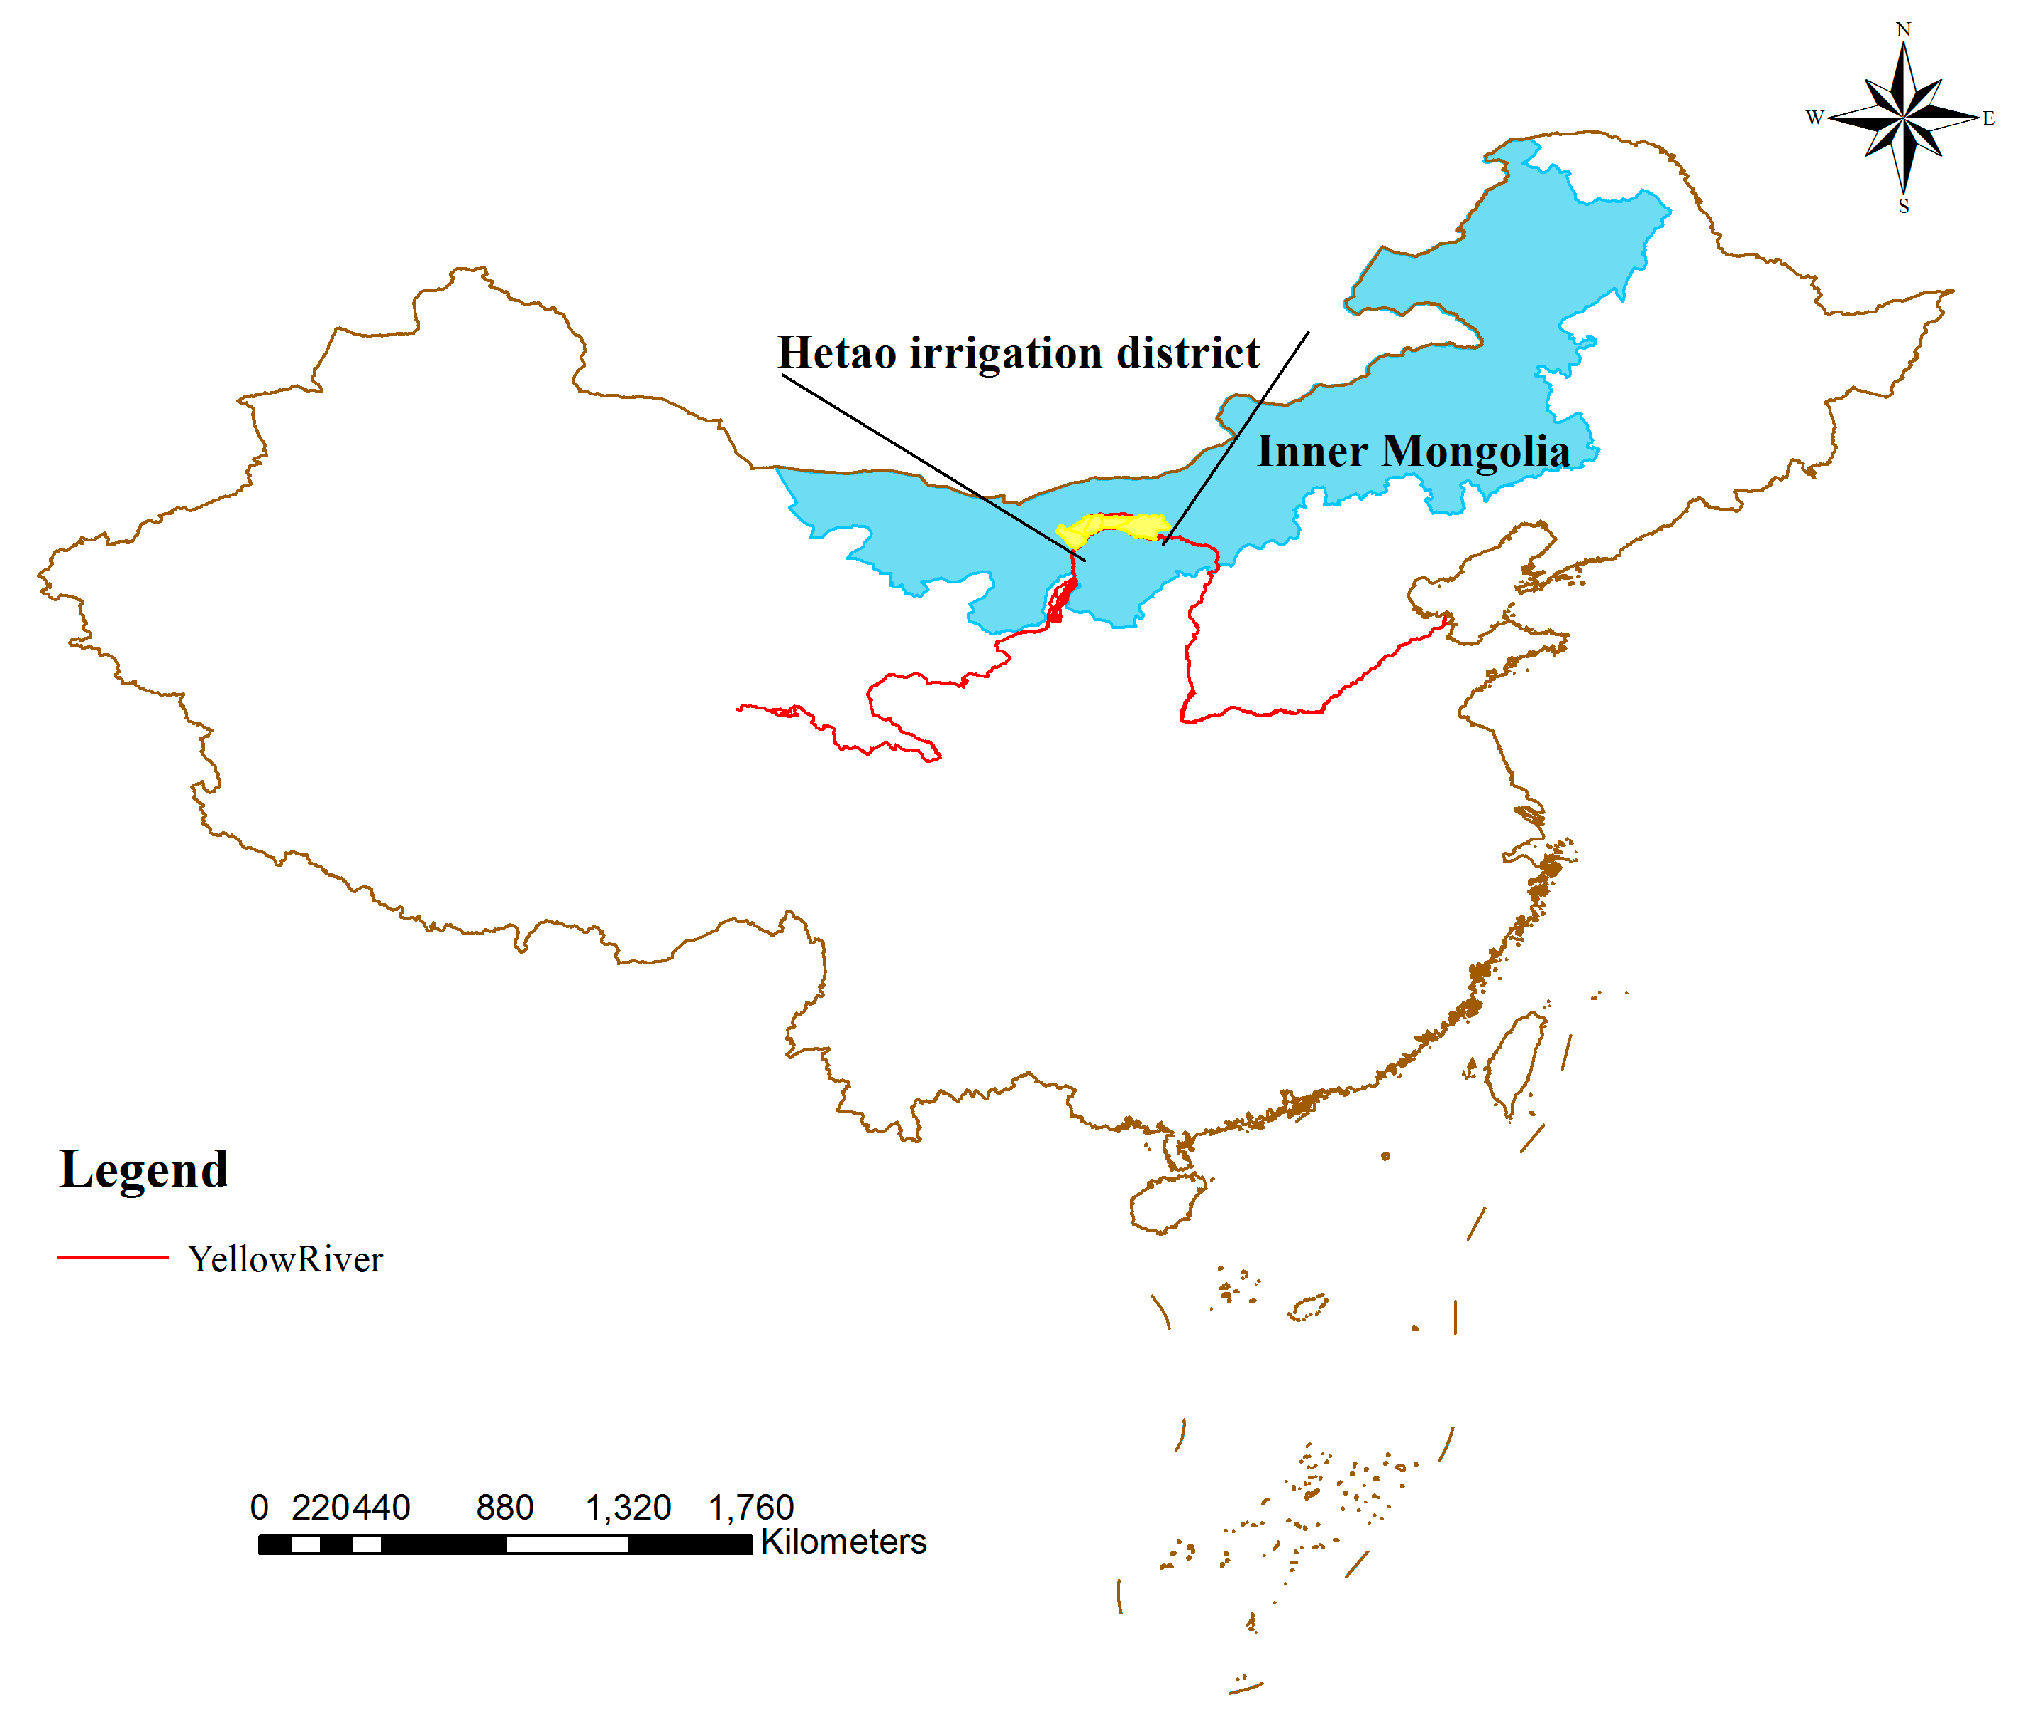
The Hetao irrigation district is located in western Inner Mongolia, China (40°13′–42°28′ N, 105°12′–109°53′ E), with an irrigated area of 5.74 × 10⁵ ha (Figure 1). It has five counties: Qianqi, Wuyuan, Linhe, Hanghou, and Dengkou. The Hetao irrigation district provides a significant contribution to China’s food security, and about 1/3 of its land is occupied by crops [12,17]. Rainfall in this district is scarce (about 130–215 mm/year) and erratically distributed [18], and water diversions from the external areas (mainly from the Yellow River) present a fluctuating but decreasing trend in recent years, which have constrained its development.
2.2. Methods
In this study, three coefficients were built to evaluate water resources consumption at the irrigation district scale. Both blue and green water resources were considered in the study area, as well as the influences from other areas. Three kinds of products were included: crops (rice, wheat, corn, potato, sunflower, sugarbeet, tomato, watermelon, and muskmelon), other agricultural products (pork, beef, mutton, and milk), and industrial products (cement, coal, and paper). The three coefficients (C1, C2, and C3) for each county of the irrigation were calculated as follows:
where is the water footprint of regional production (m3/year), and its calculation methods are listed according to the product category, as well as , , and . is the regional available water resources (m3/year), it includes surface and groundwater for blue water resources, meaning regional precipitation for green water. is the regional virtual water export (m3/year), is regional virtual water import (m3/year), and is the regional water footprint of consumption (m3/year).
C1 indicates how much of the water resources were consumed regionally for production; a similar indicator was used by Hoekstra et al. [8,19] and Liu et al. [12]. The value of C2 represents the contribution of regional production for the consumption in other areas, and a similar indicator was used to analysis the water situation for China [20] and for a global assessment [21]. C3 shows the influences of trades from other regions to the irrigation district on regional water consumption [22,23].
2.2.1. Crops
(1) Water footprint of production
where is water footprint of production for crops (m3/year), is virtual water content for crop (m3/kg), is production for crop (kg/year), and is the kinds of crops.
where is green virtual water content for crop (m3/kg) and is blue virtual water content for crop (m3/kg).
was calculated as follows [24]:
where the factor 10 converts water depths (mm) into water volumes per unit land surface area (m3/ha), is the accumulation from the data of crop planting to the data that crop harvest, and is yield for crop (kg/ha). and are the effective precipitation and precipitation within a 10-day period for crop respectively (mm). In this study, the CROPWAT model was used to calculate based on the above equation which was proposed by the Soil Conservation Service of the United States Department of Agriculture [24].
was calculated based on our previous studies [25,26].
where is the total irrigation water consumed in the irrigation district (m3/year), is the proportion of irrigation water consumed by crop to the total irrigation water consumed by the irrigation district, is irrigation water use (m3/year), is irrigation water consumption ratio which was based on the study of Nakayama [27], is the evapotranspiration of water during the growth period of crop (mm), is the effective precipitation during the growth period of crop (mm), and is sown area for crop (ha).
(2) Water footprint of consumption
where is water footprint of consumption for crops (m3/year) and is the volume of consumption for crop (kg/year).
(3) Virtual water flows
where is virtual water flows related to crops trades (m3/year), is the volume of trade for crop (kg/year), and it was calculated based on our previous study [26], which was based on surpluses and deficits. A surplus occurred if the production volume of a certain product was larger than its consumption, and a deficit occurred if the consumption volume was larger than its production. In this study, all regional product surpluses were assumed to be exported to other areas, and all product deficits were assumed to be met by importing. A similar method has been applied in previous studies [28,29,30].
In this study, the green water consumption for other agricultural products and industrial products were not included which was mainly due to the lack of data. An accurate determination of the values of water consumption for any single product (other agricultural products or industrial products) in a small area such as the Hetao irrigation district is currently difficult. Therefore, we considered those products for which data was readily available.
2.2.2. Other Agricultural Products
(1) Water footprint of production
where is water footprint of production for other agricultural products (m3/year) and is water footprint of production for agriculture (m3/year).
where is agricultural water use (m3/year) and is agricultural water consumption ratio. More than 90% of agricultural water was used for irrigation [27], thus the was assumed equal to .
(2) Water footprint of consumption
where is the water footprint of consumption for other agricultural products (m3/year), is the part of water footprint of agricultural production that is consumed regionally (m3), and is the part of water footprint of crop production that consumed regionally (m3/year). Due to the fact that more than 90% of agricultural water was used for crop production [27], the following relationship was assumed in this study:
could be calculated as follows:
(3) Virtual water flows
where is virtual water flows related to the trades of other agricultural products (m3/year). It represents the difference between virtual water exports and imports. Thus, a positive indicates net virtual water exports, and a negative one indicates net virtual water imports.
2.2.3. Industrial Products
(1) Water footprint of production
Where is water footprint of production for industrial products (m3/year), is industrial water use (m3/year), and is industrial water consumption ratio, which was based on the study of Liu et al. [31].
(2) Water footprint of consumption
where is the water footprint of consumption for industrial products (m3/year), is the part of the water footprint of production of industrial products that is consumed regionally(m3/year), and is the virtual water import related to the trades of industrial products(m3/year). The volume of industrial product transfer was calculated using the methodology based on surpluses and deficits [26]. Simultaneously, we assumed that the volume of blue water resources embedded in the industrial production was proportional to its value. This has been widely used in life cycle assessment, and the relative significance of different products could be demonstrated clearly [28,29,30]. The method was promoted by Hoekstra et al. for the research on water footprint [8]. Thus, and can be calculated as follows:
where is the living expenditure for consumption of industrial products (Yuan/year) and is the sale revenue of industrial products (Yuan/year).
(3) Virtual water flows
where is virtual water flows for industrial products (m3/year). A positive indicates net virtual water exports, and a negative one indicates net virtual water imports.
2.3. Data Sources
Monthly meteorological data (precipitation, temperature, wind speed, relative humidity, and hours of sunshine) was from the China Meteorological Data Sharing Service System [32]. Agricultural data (crop yield and area sown) was obtained from Hetao Irrigation District Agricultural Statistical Data [33]. Data on surface water, groundwater, and water withdrawals in the agricultural sector, industrial sector, and for irrigation were obtained from the Bayan Nur Water Resources Bulletin [34]. Social and economic data (population, product consumption per capita, the sale revenue of industrial products, and living expenditure due to the consumption of industrial products) was from the Bayan Nur Statistical Yearbook and Inner Mongolia Statistical Yearbook [35].
3. Results and Discussion
3.1. C1
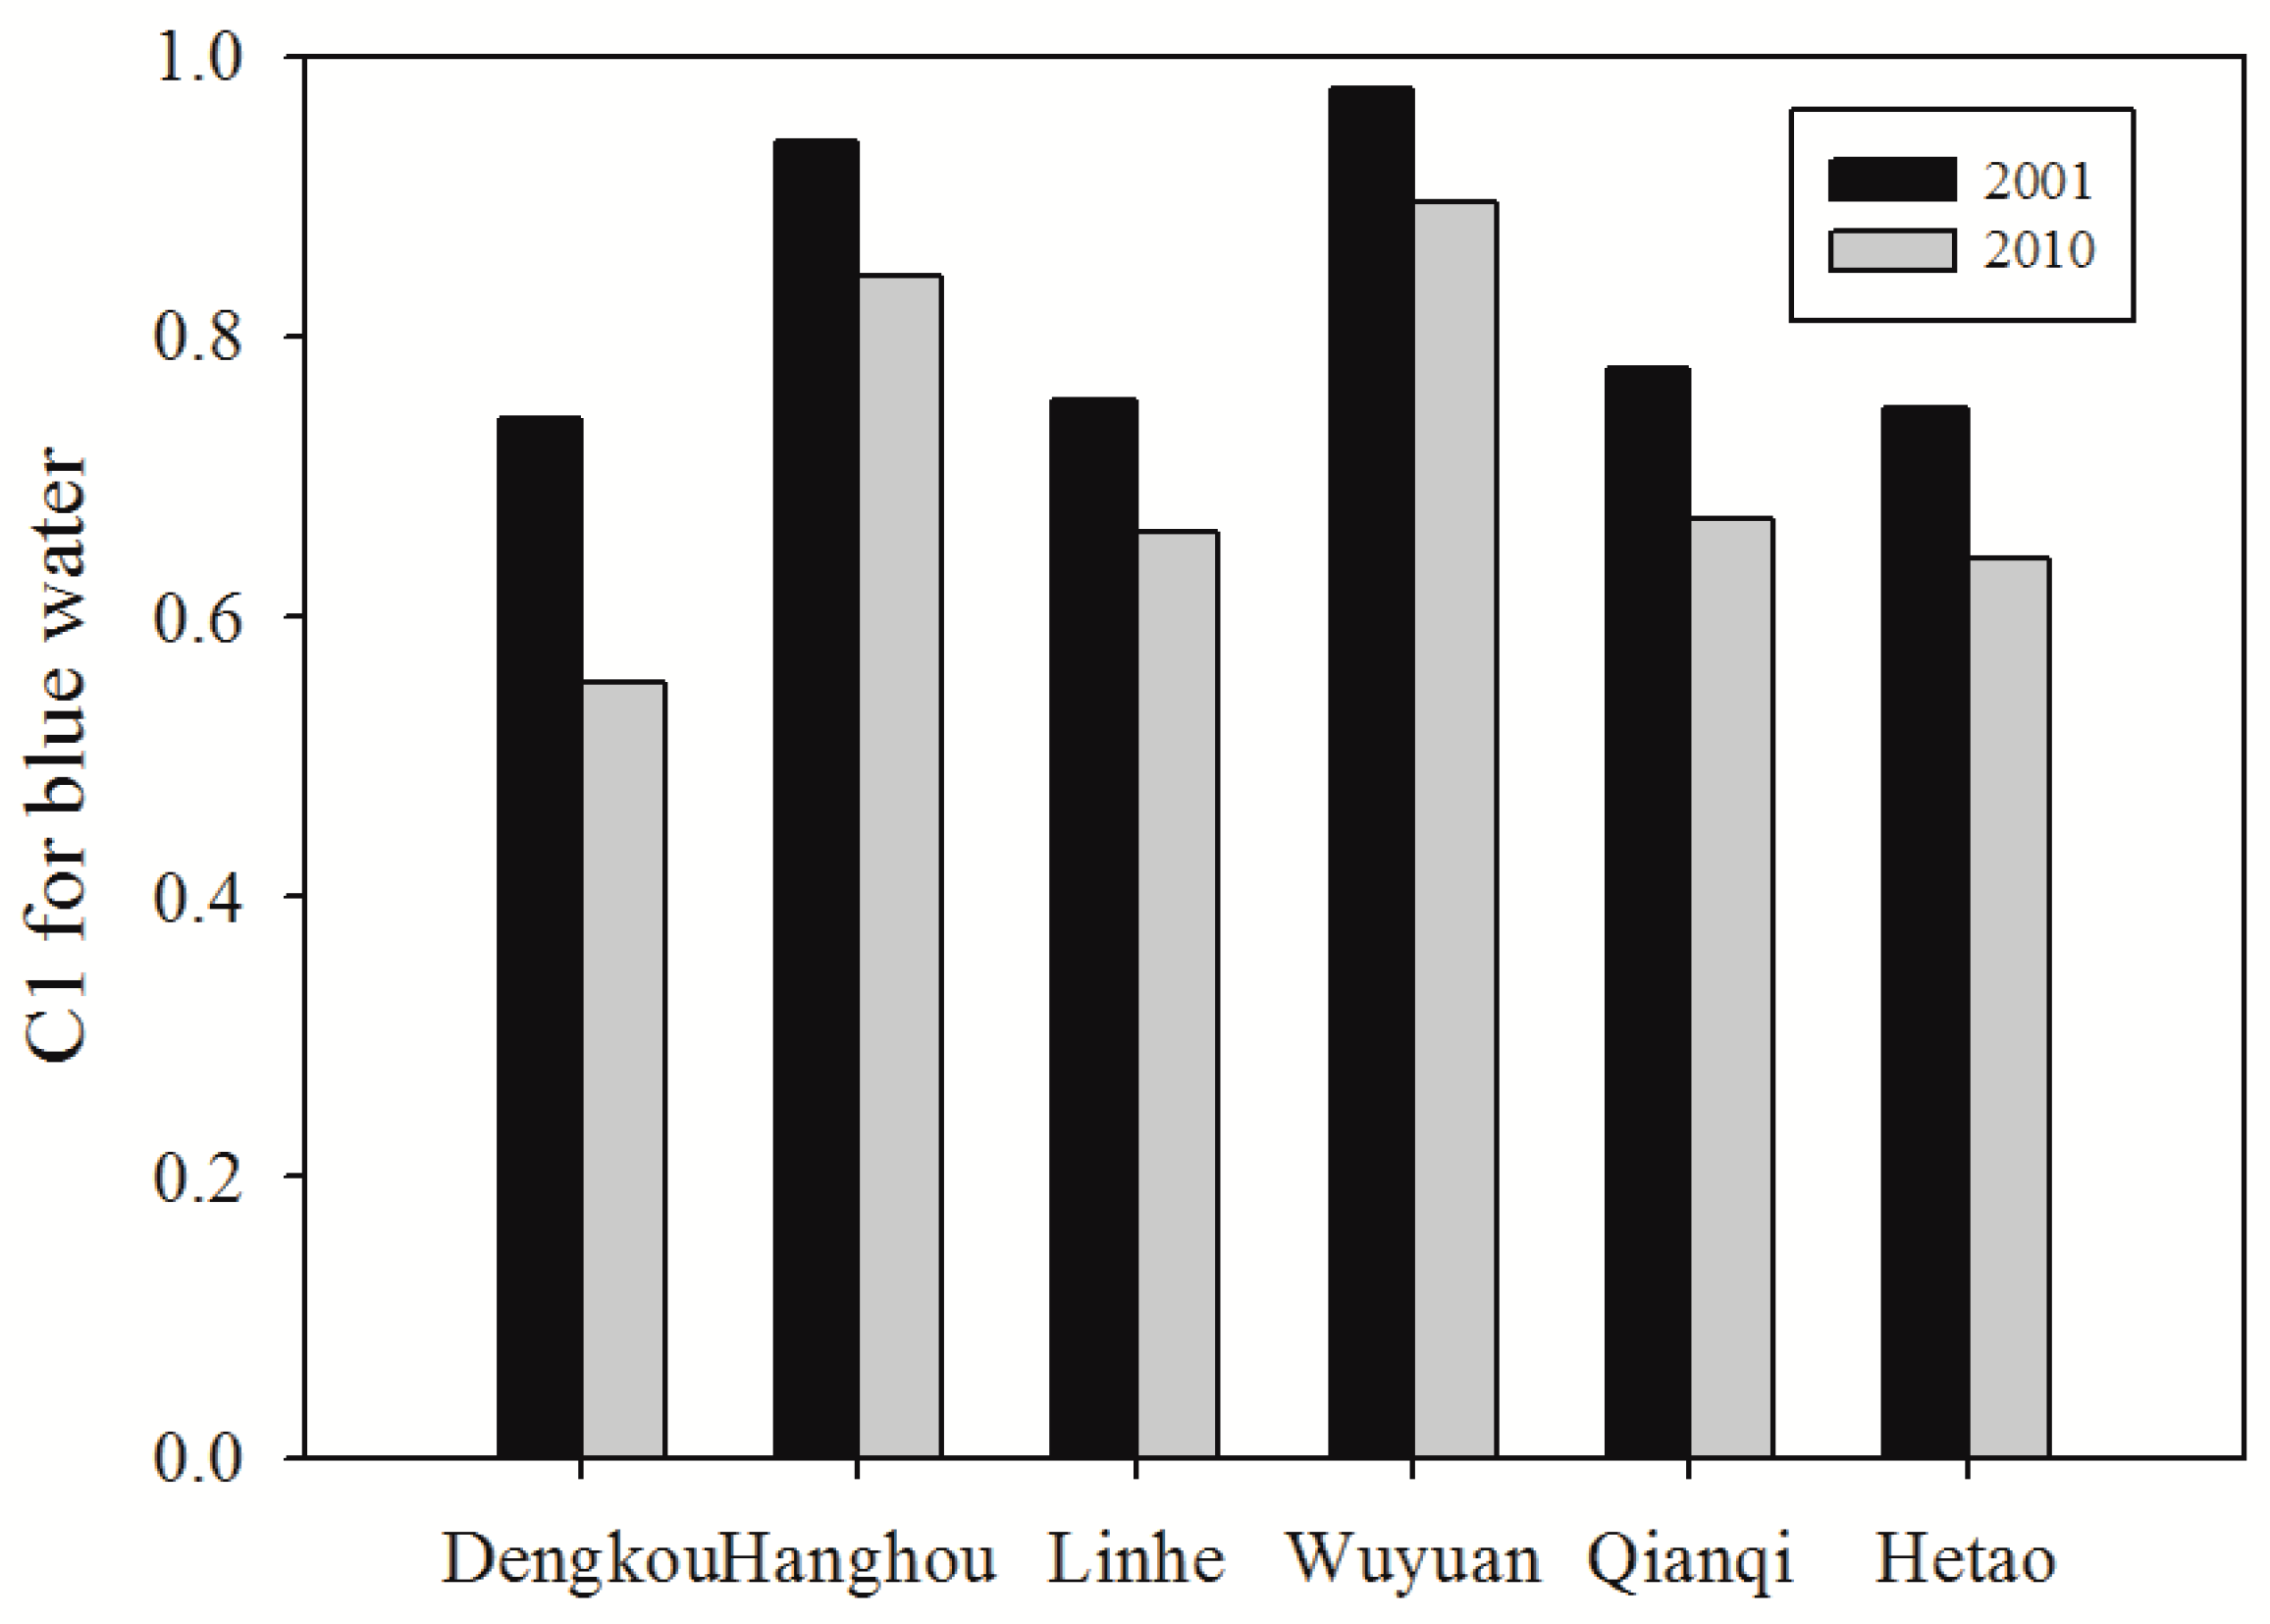
In 2001, the value of C1 for blue water in the Wuyuan (0.977) was the largest, followed by Hanghou (0.940), and that in the Dengkou was the smallest (0.742) (Figure 2). In 2010, the values of C1 for blue water were smaller than those in 2001, and the largest and smallest ones were 0.896 in Wuyuan and 0.554 in Dengkou, respectively. For the Hetao irrigation district, the value of C1 for blue water decreased from 0.749 in 2001 to 0.642 in 2010. Water price for irrigation in the Hetao irrigation district was 0.053 Yuan/m3 in 2012, which was much lower than its real value [36,37], and traditional flood irrigation is still very common, with an irrigation efficiency of 0.42 [38]. As a result, a large volume of blue water resources was consumed in the agricultural products’ production, which contributed to a high C1 for the study area (Figure 2). The overexploitation of blue water resources could also be seen at other regions. Schyns et al. analyzed the ratio of groundwater consumption and groundwater availability of Jordan, and they found that the former was nearly double the latter [22]. Zoumides et al. showed that the blue water scarcity was more than 1.0 in 11 years during the period of 1995–2009 in Cyprus, while in the assumed scenario of no blue water exports, the average index would have been 0.98 [15]. Mekonnen and Hoekstra found that about two-thirds of the global population (4.0 billion people) live under conditions of severe water scarcity (the monthly blue water footprint was more than twice of the monthly blue water availability) at least one month of the year [9]. Overexploitation might result in damages to global and regional sustainable development in the long run [39], while the situation will not change in the recent future. Consequently, water-saving technologies, the full-cost water price, and other measures that can contribute to decreasing blue water consumption should be adapted in the Hetao irrigation district, which was one of the most important producing areas of China. The implementation of water pricing policies could encourage the adoption of irrigation technologies and water-saving practices, which could be seen in southern European countries [40], California [41], and Spain [42]. While some constraints, such as the inadequate monitoring infrastructure, a lack of political will to impose the new water prices, an ageing and poorly trained farm population, small farm size, and low level of farm investment, should be considered at the same time [43,44,45,46].
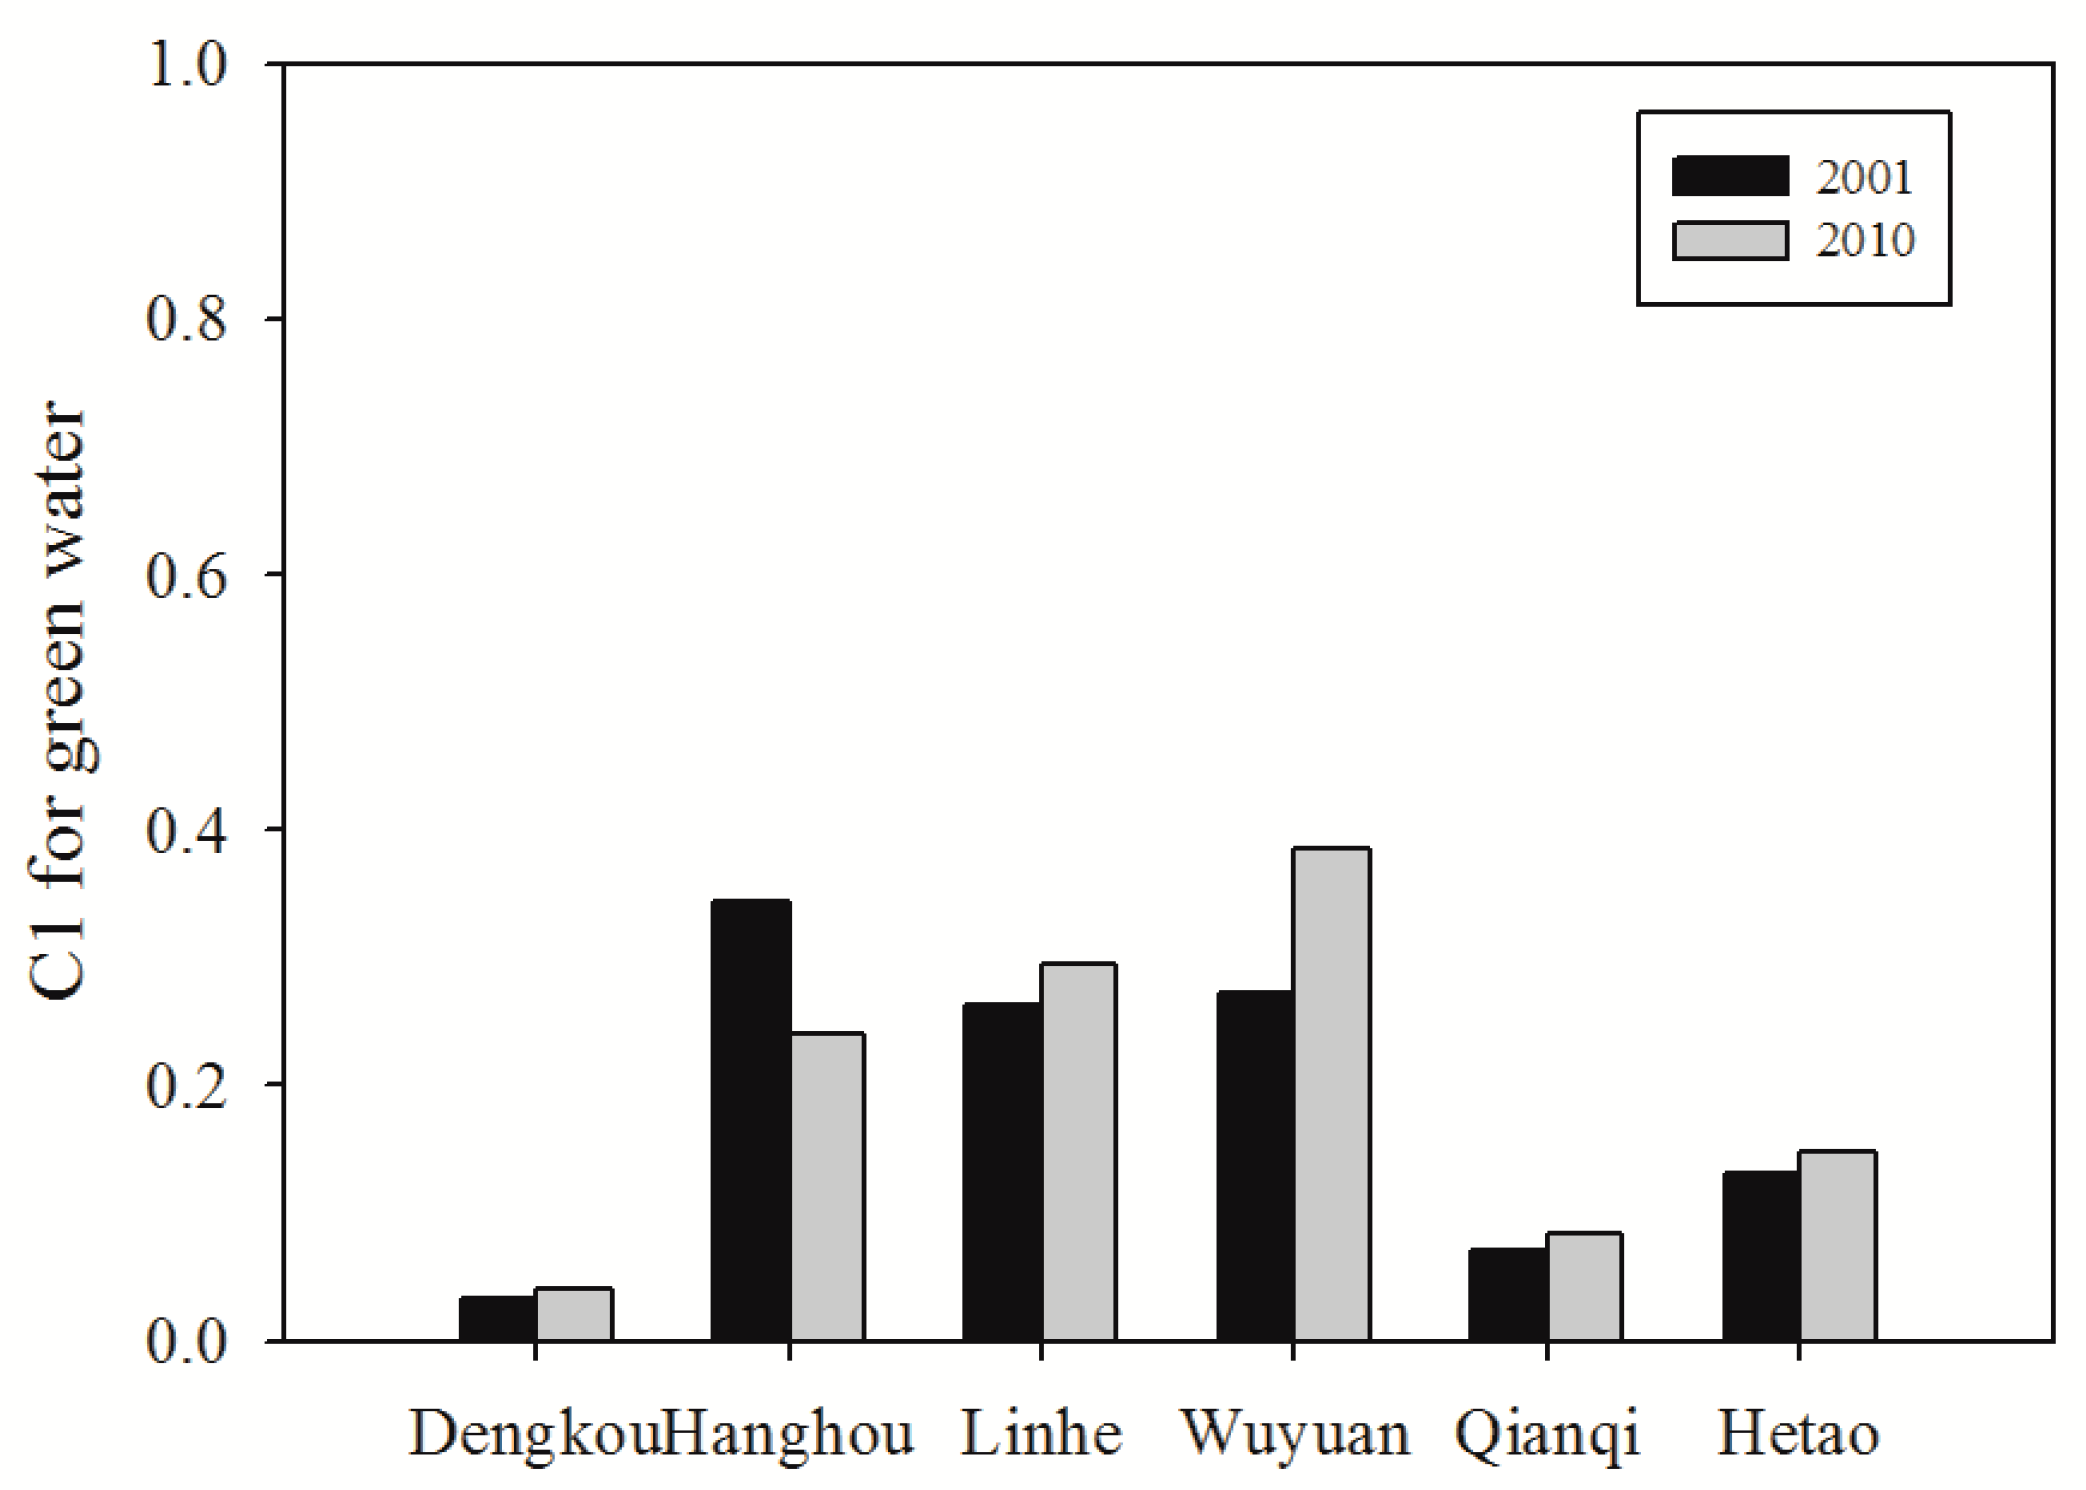
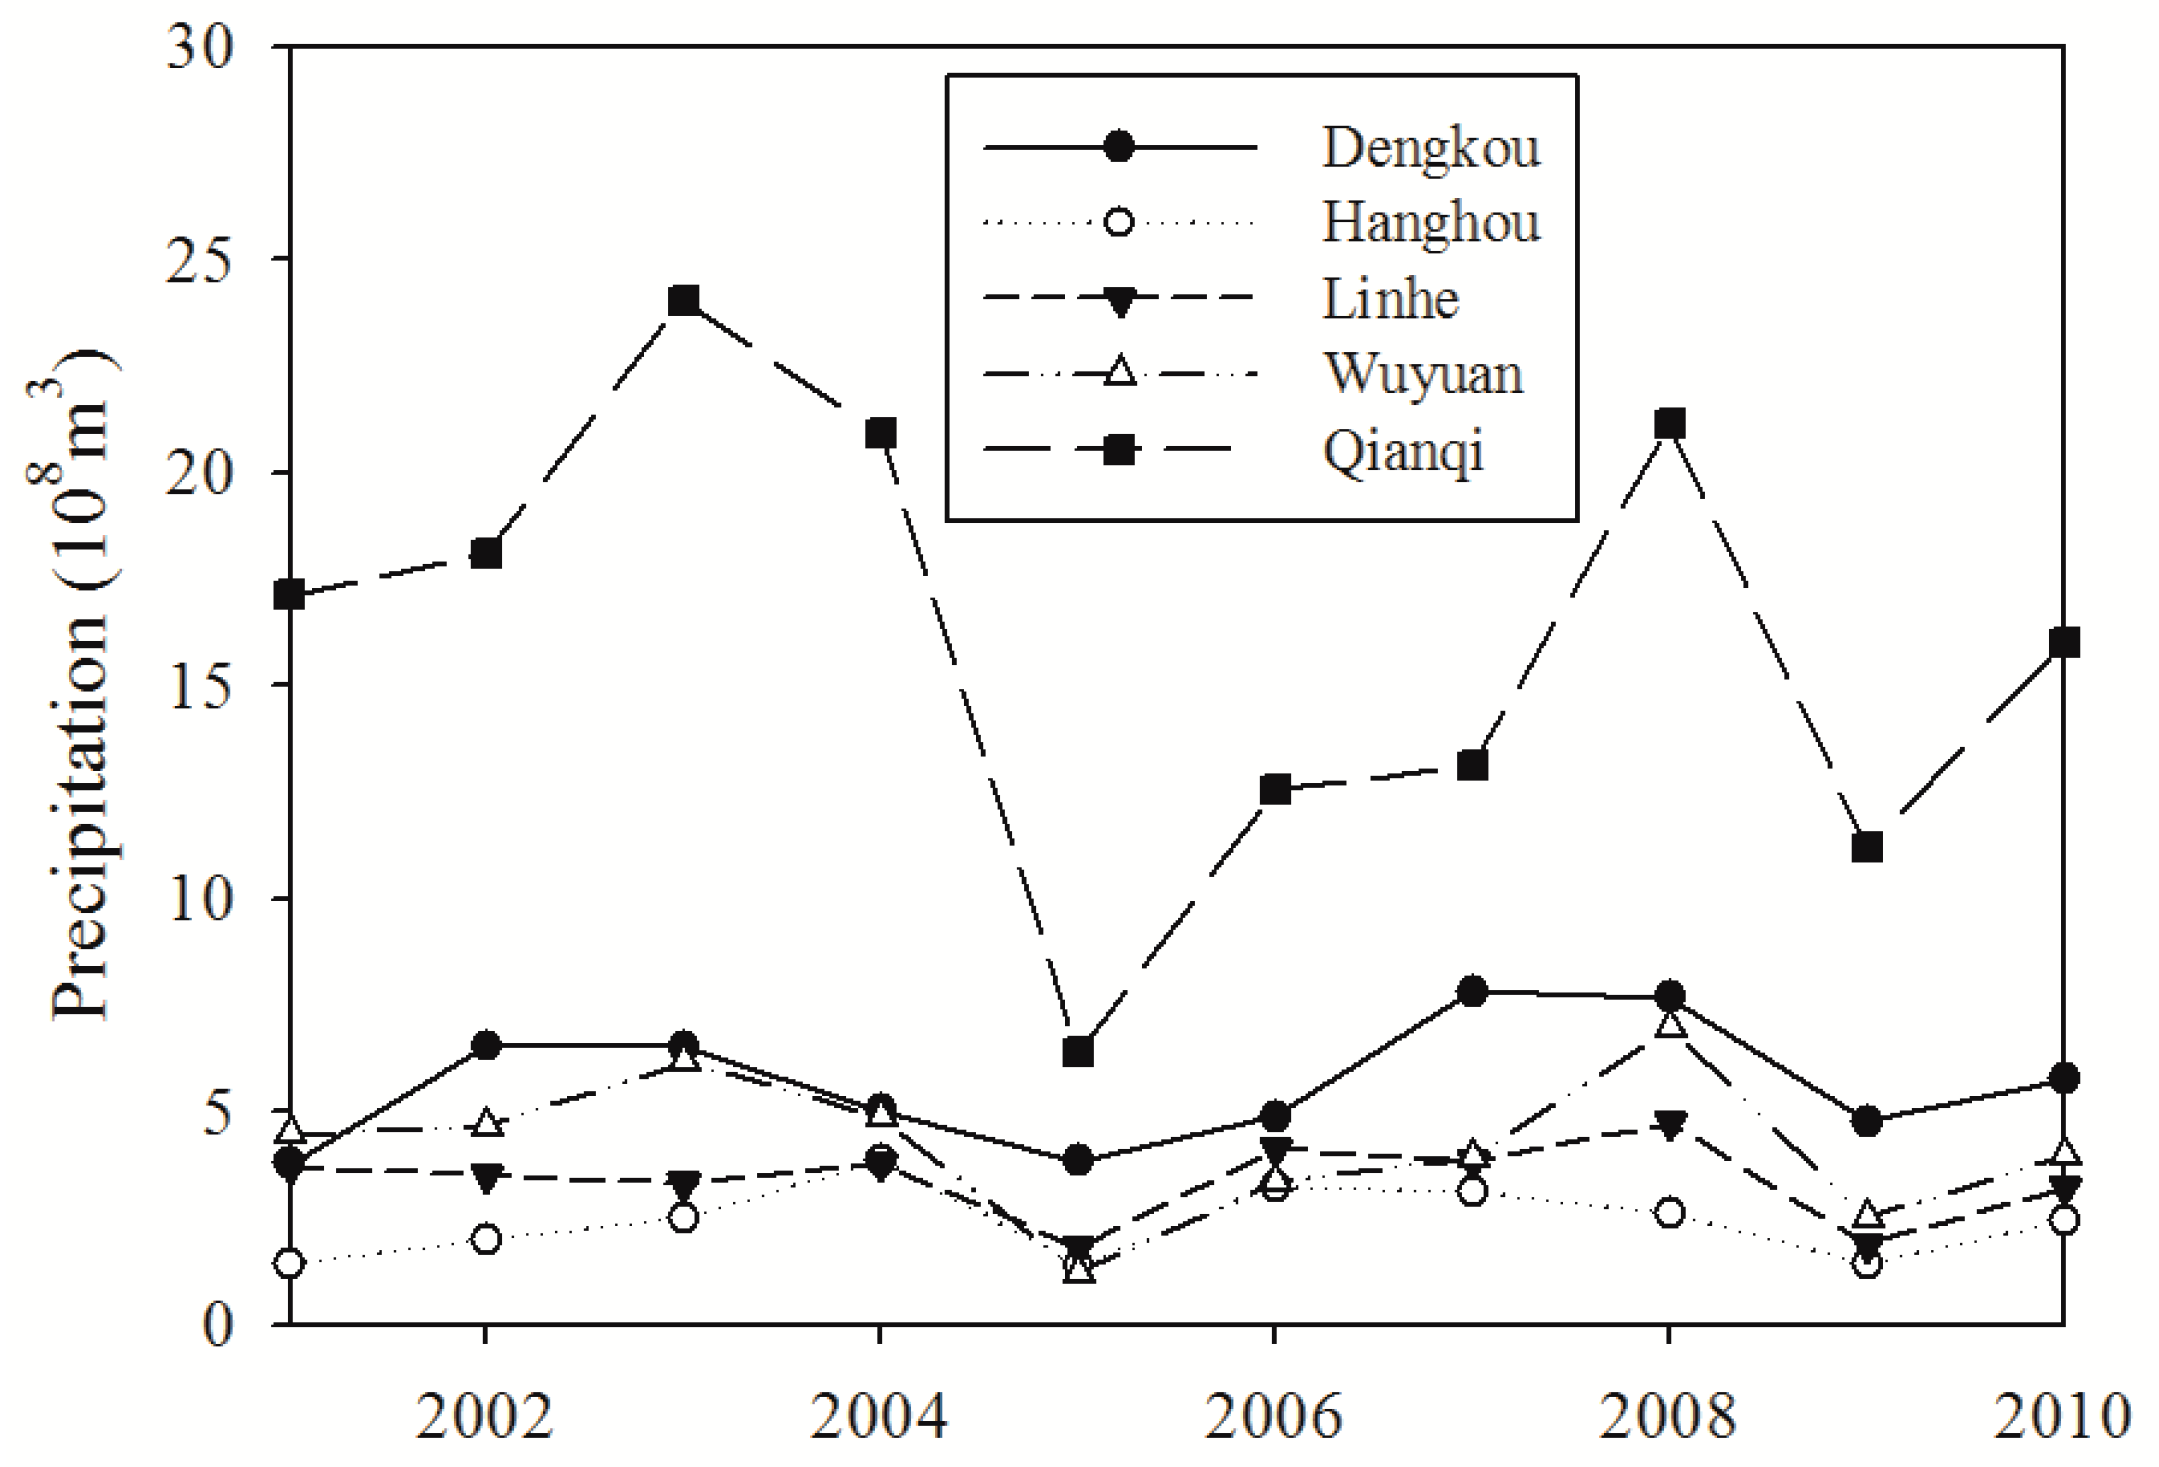
Compared with the C1 for blue water, the values of C1 for green water were much smaller in the study areas and the values were 0.131 and 0.148, respectively, for the Hetao irrigation district in the years of 2001 and 2010 (Figure 3). For the five counties, the values of C1 for green water ranged from 0.033 in Dengkou to 0.344 in Hanghou in 2001 and from 0.041 in Dengkou to 0.386 in Wuyuan in the 2010. The value of C1 for green water in 2010 was larger than that in 2001 for the four counties of this district, and the largest difference was 0.115 for Wuyuan. Since blue water is generally scarcer, when exporting regions use green water, they incur a lower opportunity cost while holding other factors constant [47,48]. Furthermore, green water use has relatively few negative environmental externalities as there is generally only a small difference between the evapotranspiration from crop fields, and that takes place in the presence of natural vegetative cover. In contrast, blue water use has the potential for causing severe environmental problems including water depletion, salinization, water logging, or soil degradation [49,50]. However, the C1 for green water was much smaller (0.148 in 2010) than that for blue water in this district (Figure 3), which was mainly related to the significant fluctuation of precipitation during the study period (Figure 4). During the study period, the largest precipitation in the Hetao irrigation district was 4.31 × 10⁹ m3 in 2008, and the smallest was 1.46 × 10⁹ m3 in 2005. The former was about triple of the latter. Falkenmark analyzed the regional water scarcity from the perspective of green water consumption, and her study showed that during the crop growing season, blue water accounts for only 16% of global consumptive water use, whereas green water accounts for 84% at the global level, and blue water may be added through irrigation to achieve green water security under conditions of deficiency [14]. The significance of green water was also presented by Schyns et al., Veettil and Mishra, and Quinteiro et al. [13,51,52]. Consequently, measures such as the adjustment of crop sowing date or the cultivation of new varieties may be helpful in using more rainfall in the Hetao irrigation district, while factors such as daily climate measurements, crop phenology, soils, and others should be taken into account.
3.2. C2
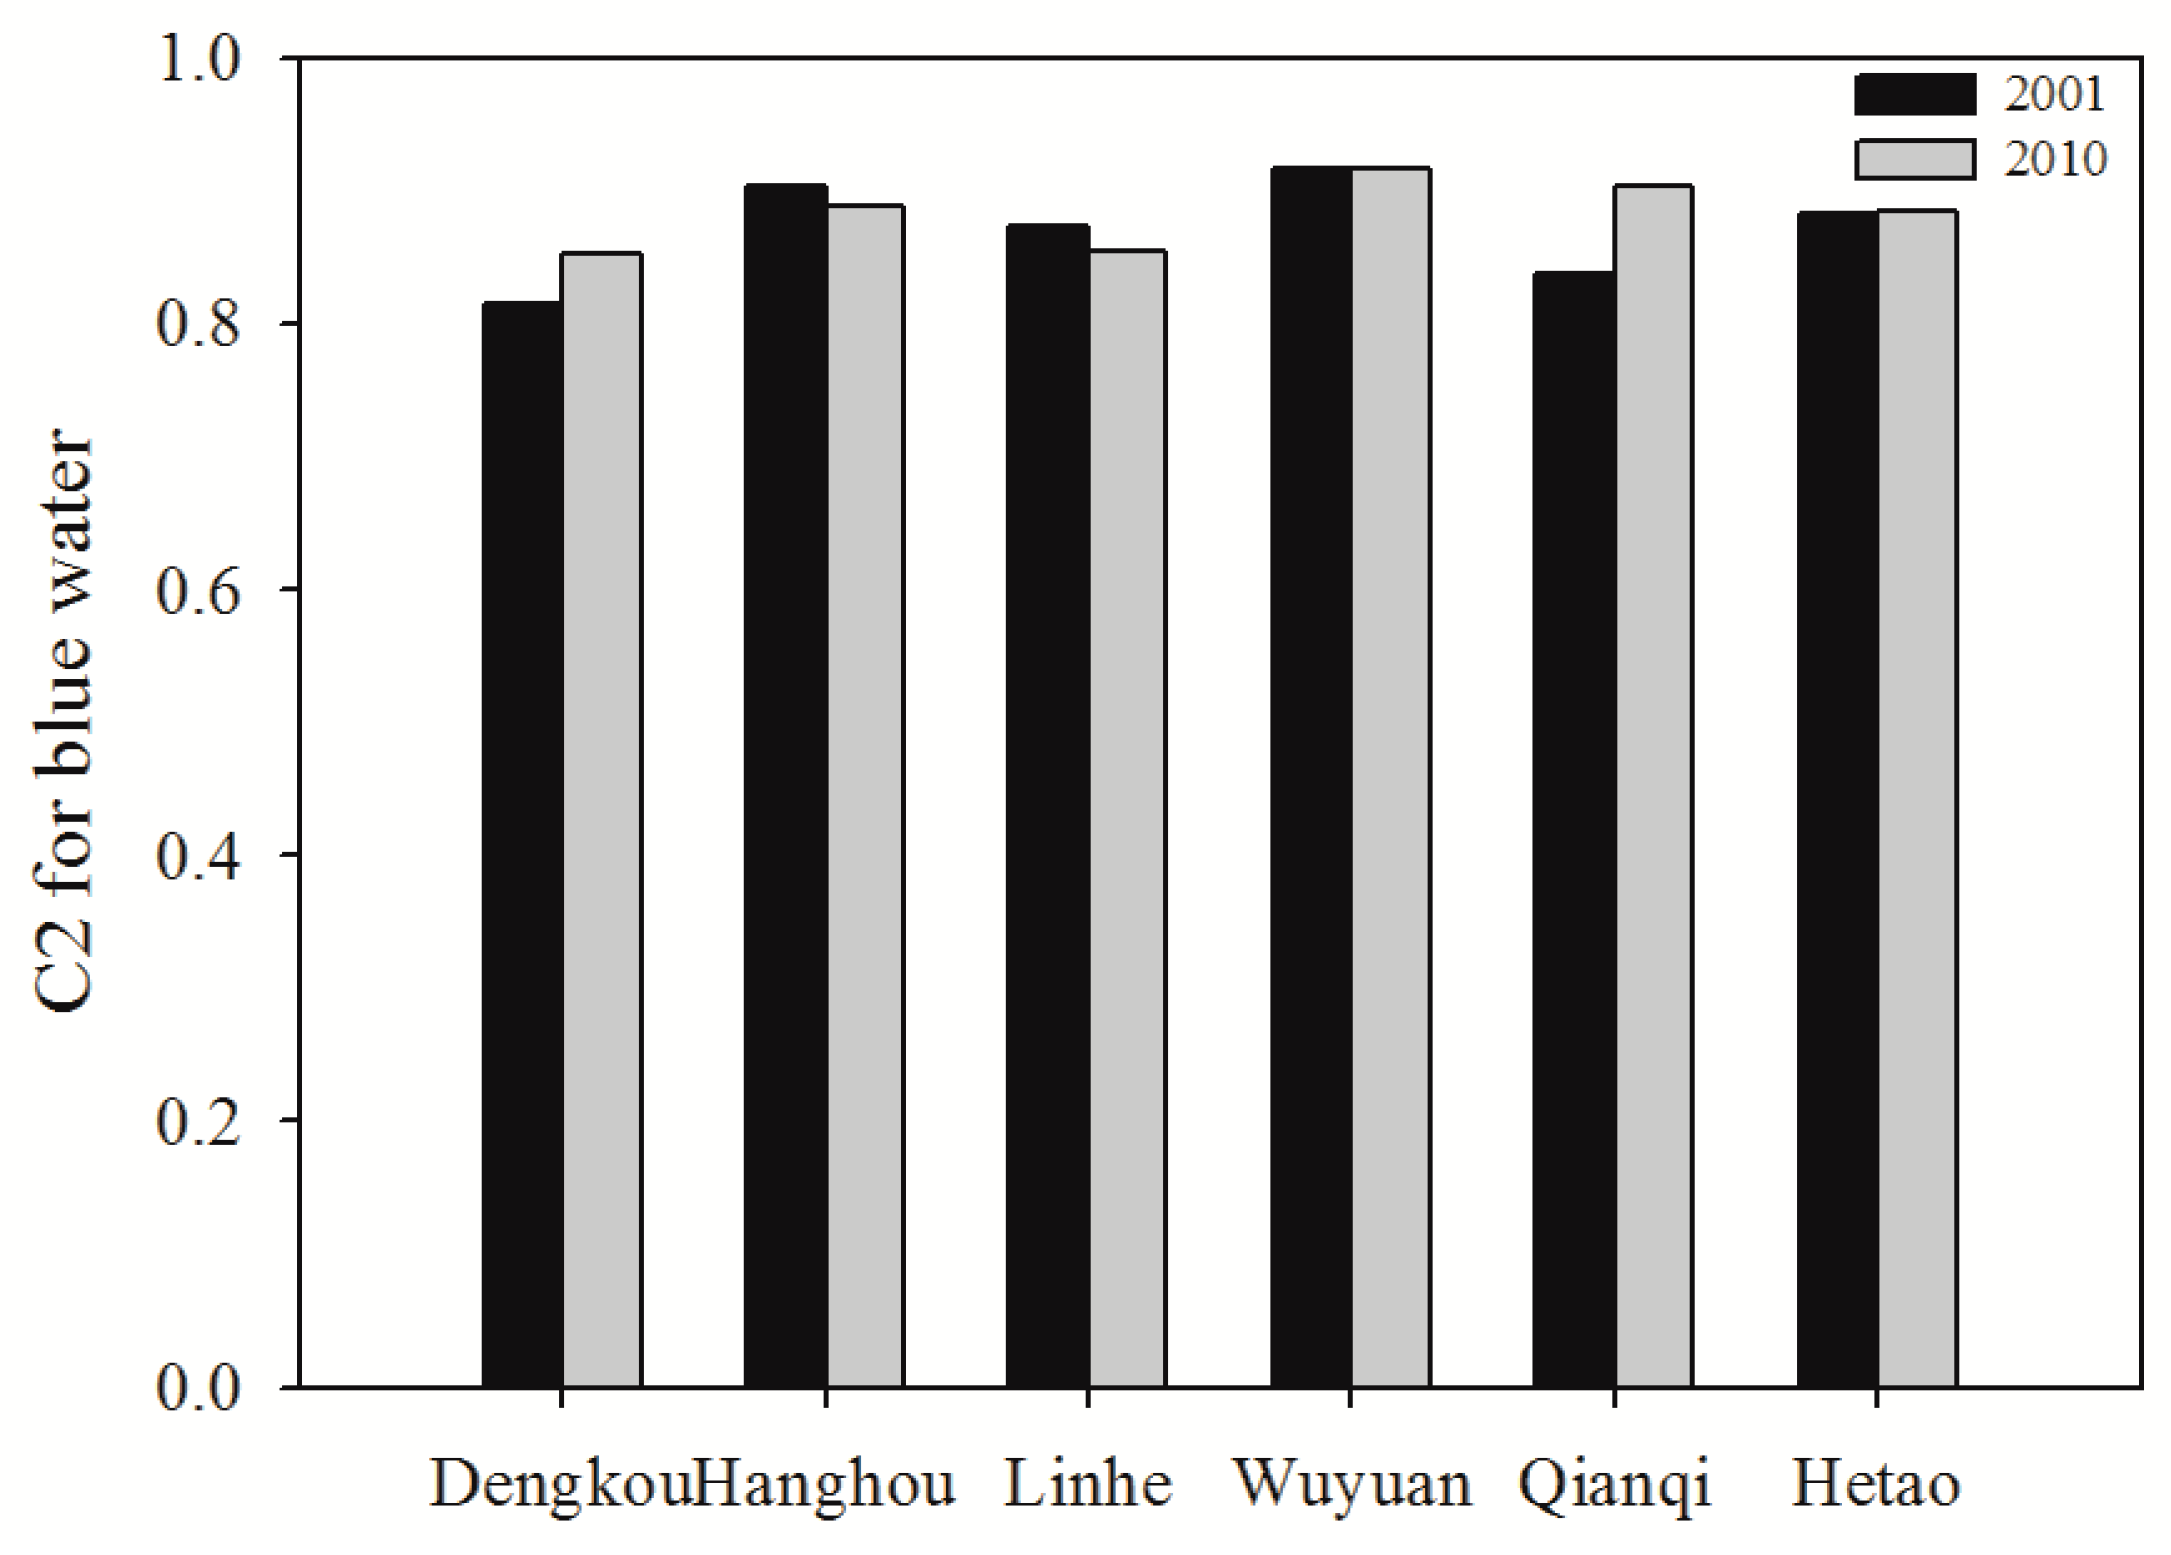
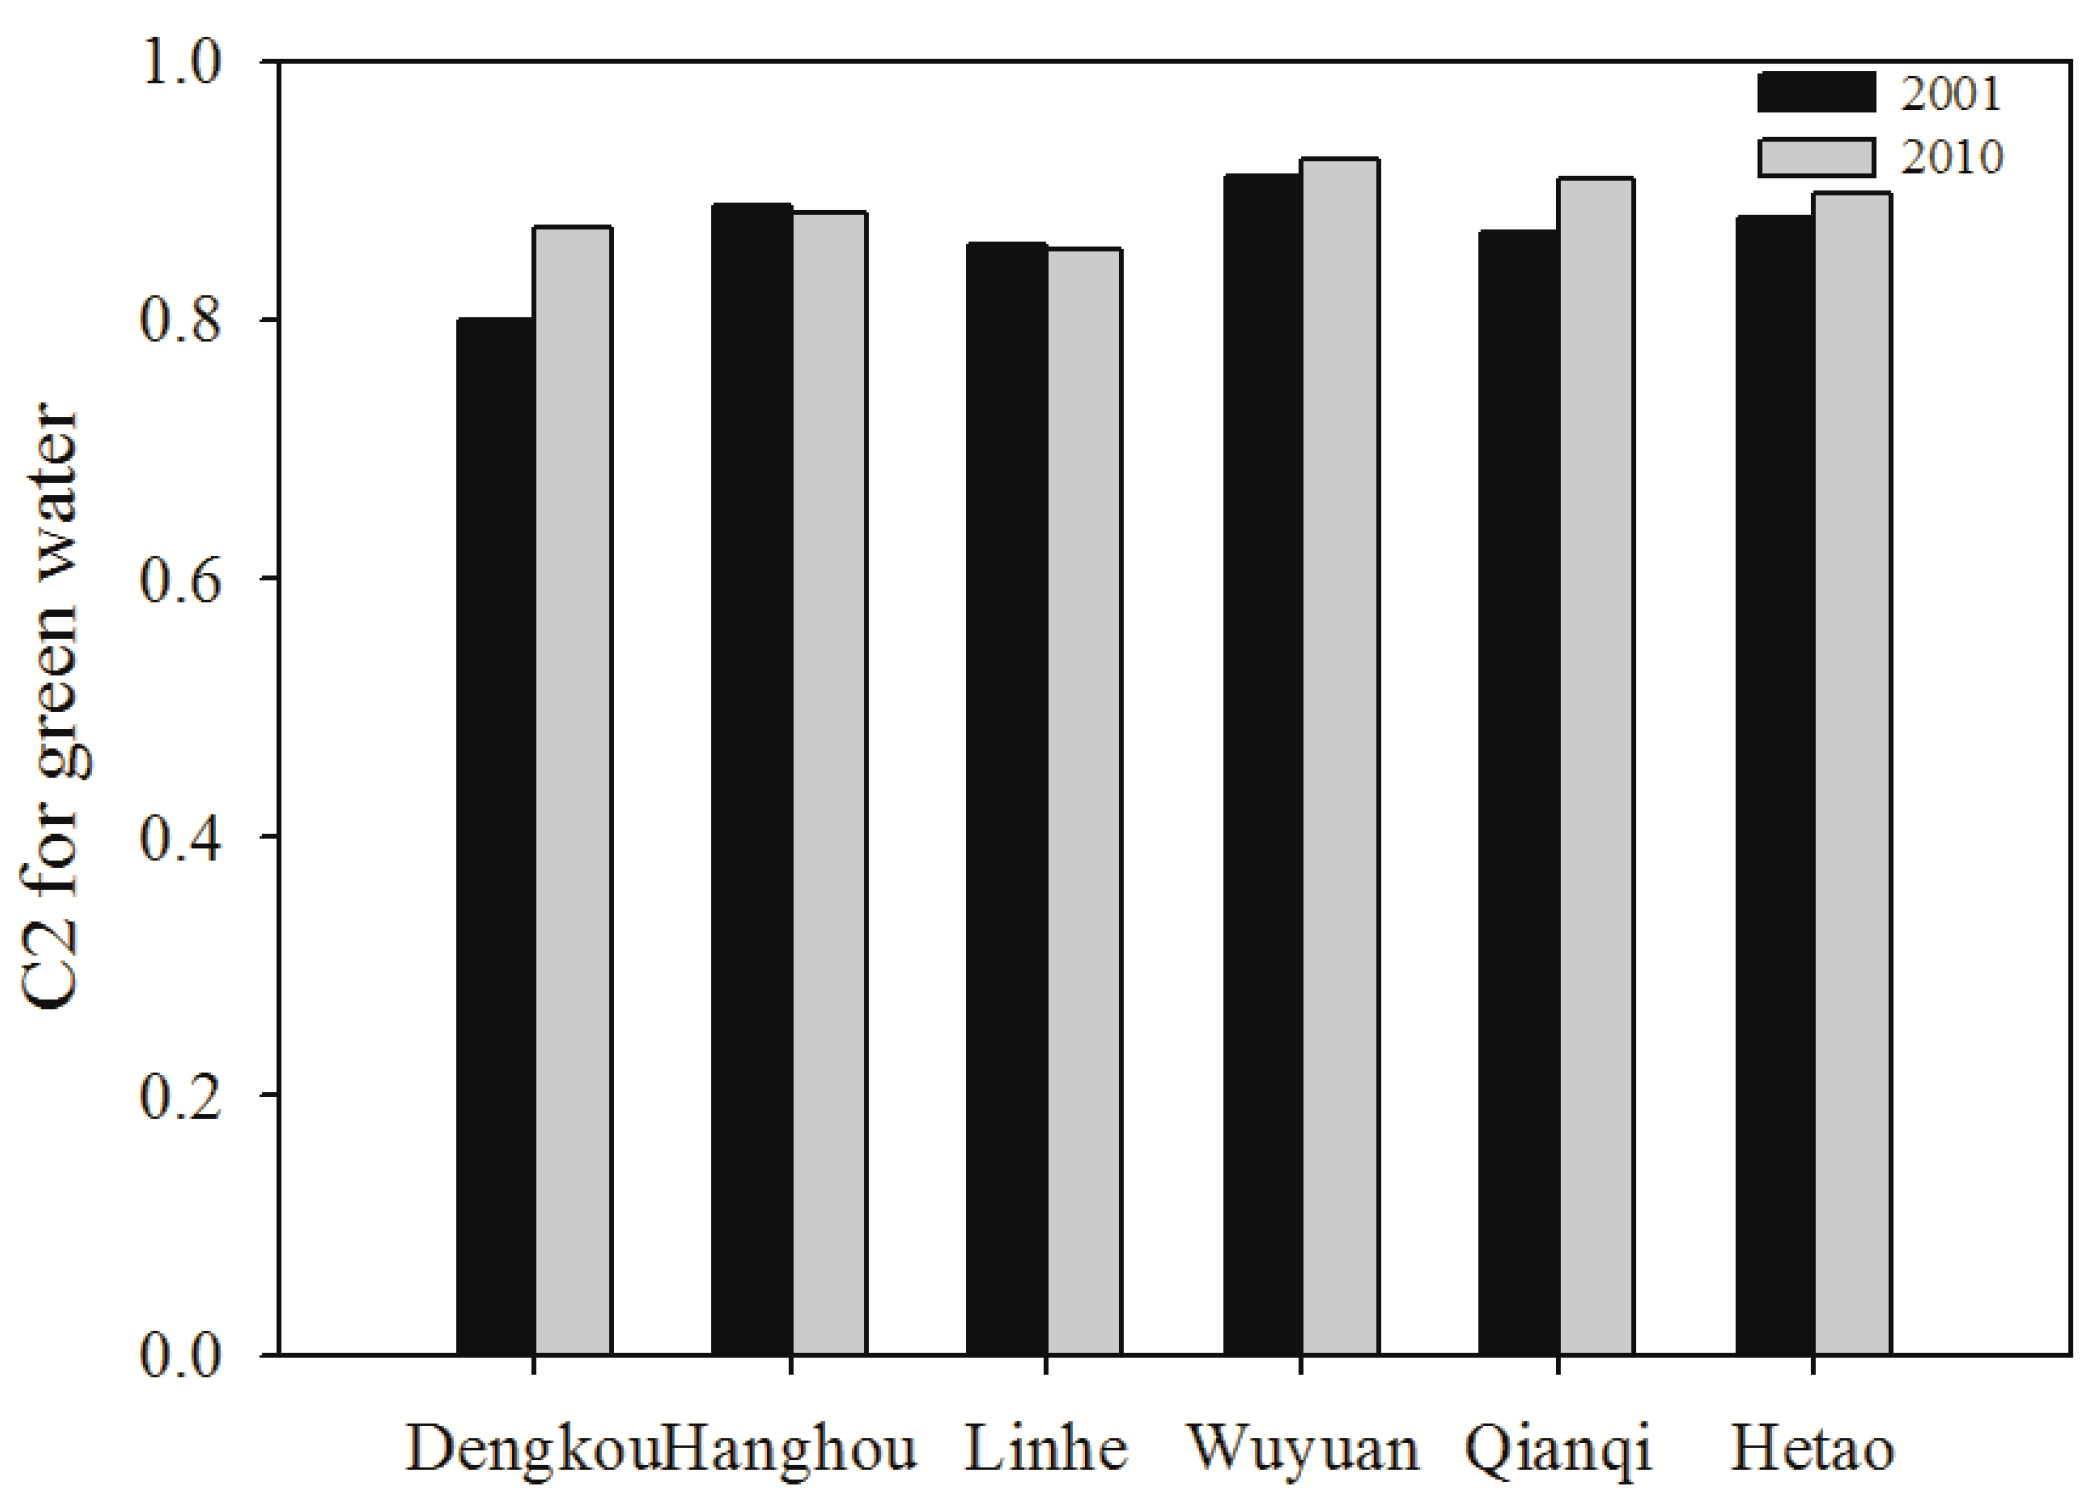
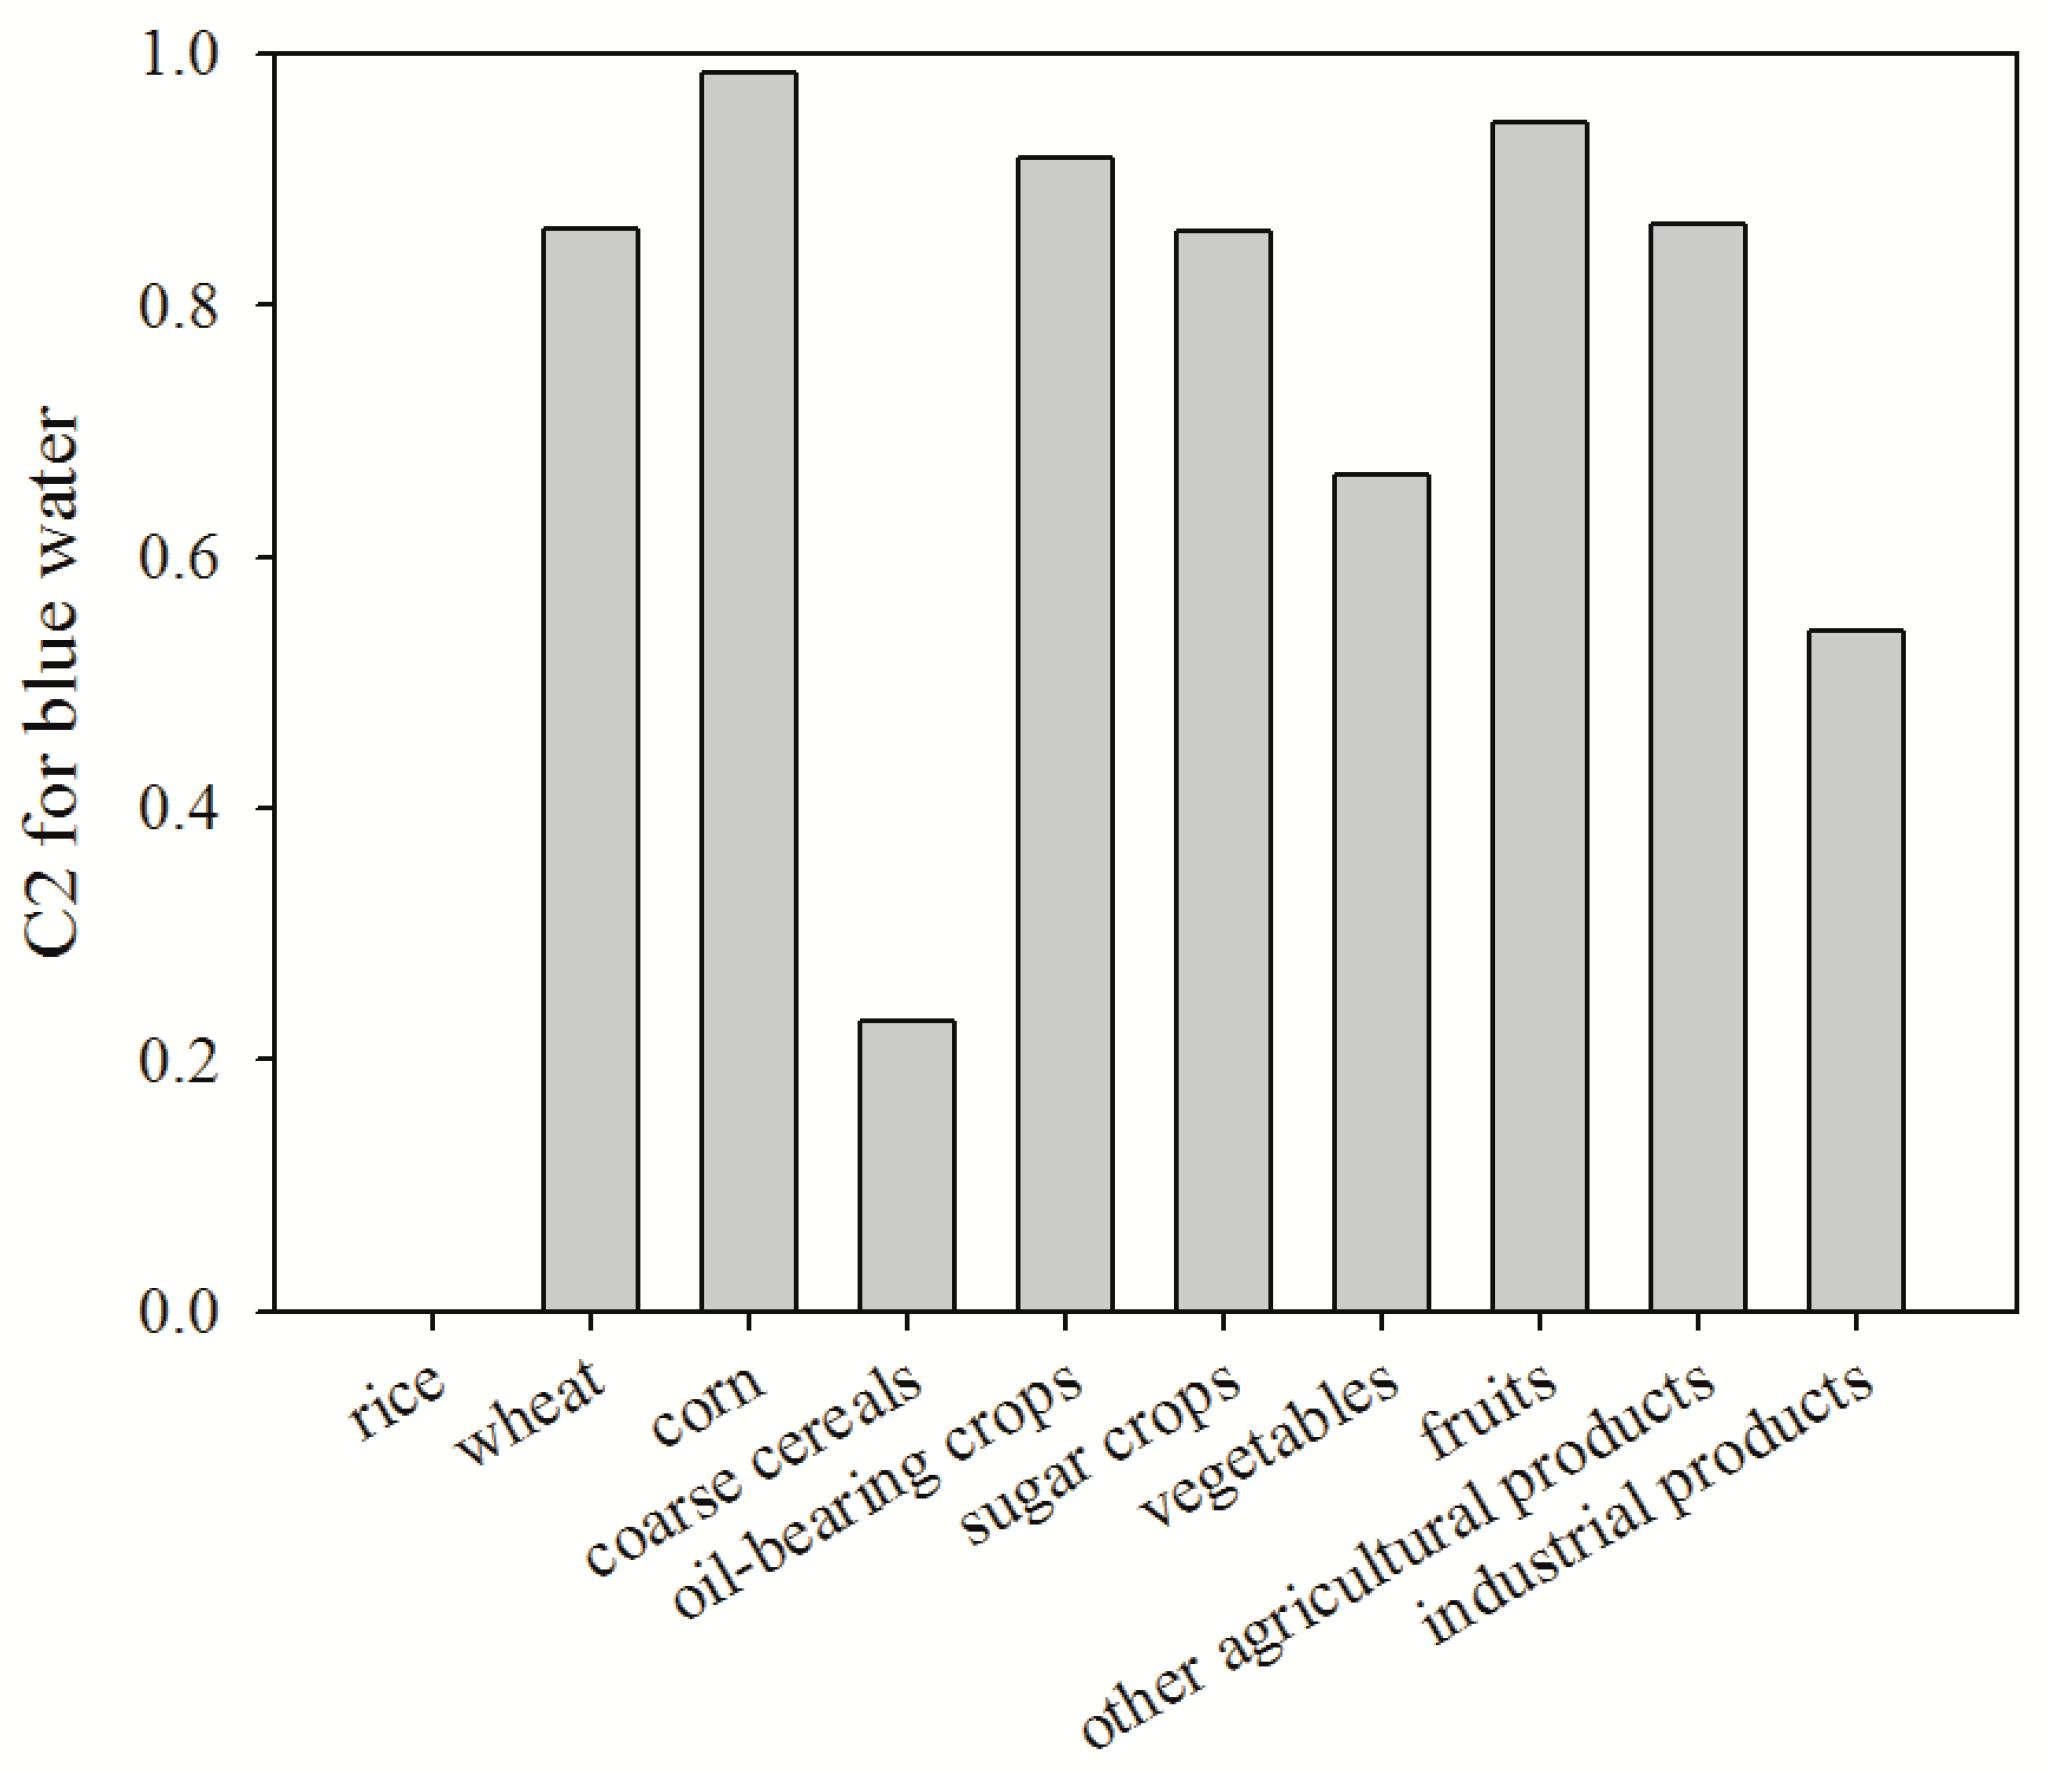
As can be seen from Figure 5, the average value of C2 for blue water in the 2001 was 0.882, and it was 0.885 in 2010 for the irrigation district. For the five counties, the differences were small. In 2001, the values of C2 for the blue water ranged from 0.816 in Dengkou to 0.916 in Wuyuan, and in 2010, it varied from 0.854 to 0.918. The average value of C2 for green water for the Hetao irrigation district was 0.879 in 2001, and the value in 2010 was 0.019 larger than that (Figure 6). Compared with the values of C2 for green water among counties, we find that Wuyuan was the region with the largest value (0.911) in 2001, and Dengkou was the region with the smallest one (0.800). For 2010, the largest (0.925) and smallest C2 for green water (0.855) were observed in the Wuyuan and Linhe, respectively. Due to the increasing trade of products, the virtual water flows should be considered in the regional water management. Nearly 90% of blue and green water consumption in the Hetao irrigation district was exported to other areas (Figure 5 and Figure 6), which was mainly due to the trade of agricultural products (Figure 7). Kummu et al. found that among the 2.6 billion people who live in chronically or occasional water-scarce regions, 55% of them have to rely on international trade to reach the reference diet, while for 24%, domestic trade is enough [53]. The significance of virtual water trade was also illustrated by Schmitz et al. [54]. The water embedded in exported products means more water consumption for the regional government [55,56].
Compensation for the large volume of virtual water exports in regions including the Hetao irrigation district should be given in the near future, and this should not be limited to financial compensation [36]. Small on-site rainwater harvesting technologies including green rooftops, porous pavements, and green lands, have been successfully implemented to harvest rainwater in most regions of the world [57]. Moreover, a number of approaches to integrate rainwater harvesting technologies exist in developed and developing countries, such as water sensitive urban design in Australia [58], best management practices and low impact development in USA [59], the building research establishment environmental assessment method and sustainable urban drainage systems in the UK [60], and the sponge city construction and development in China [61]. All these technologies have contributed to the saving of blue water and relieving regional water scarcity. Besides, the decrease of virtual water content for those products with large value of C2 could also make a contribution to regional water management.
3.3. C3
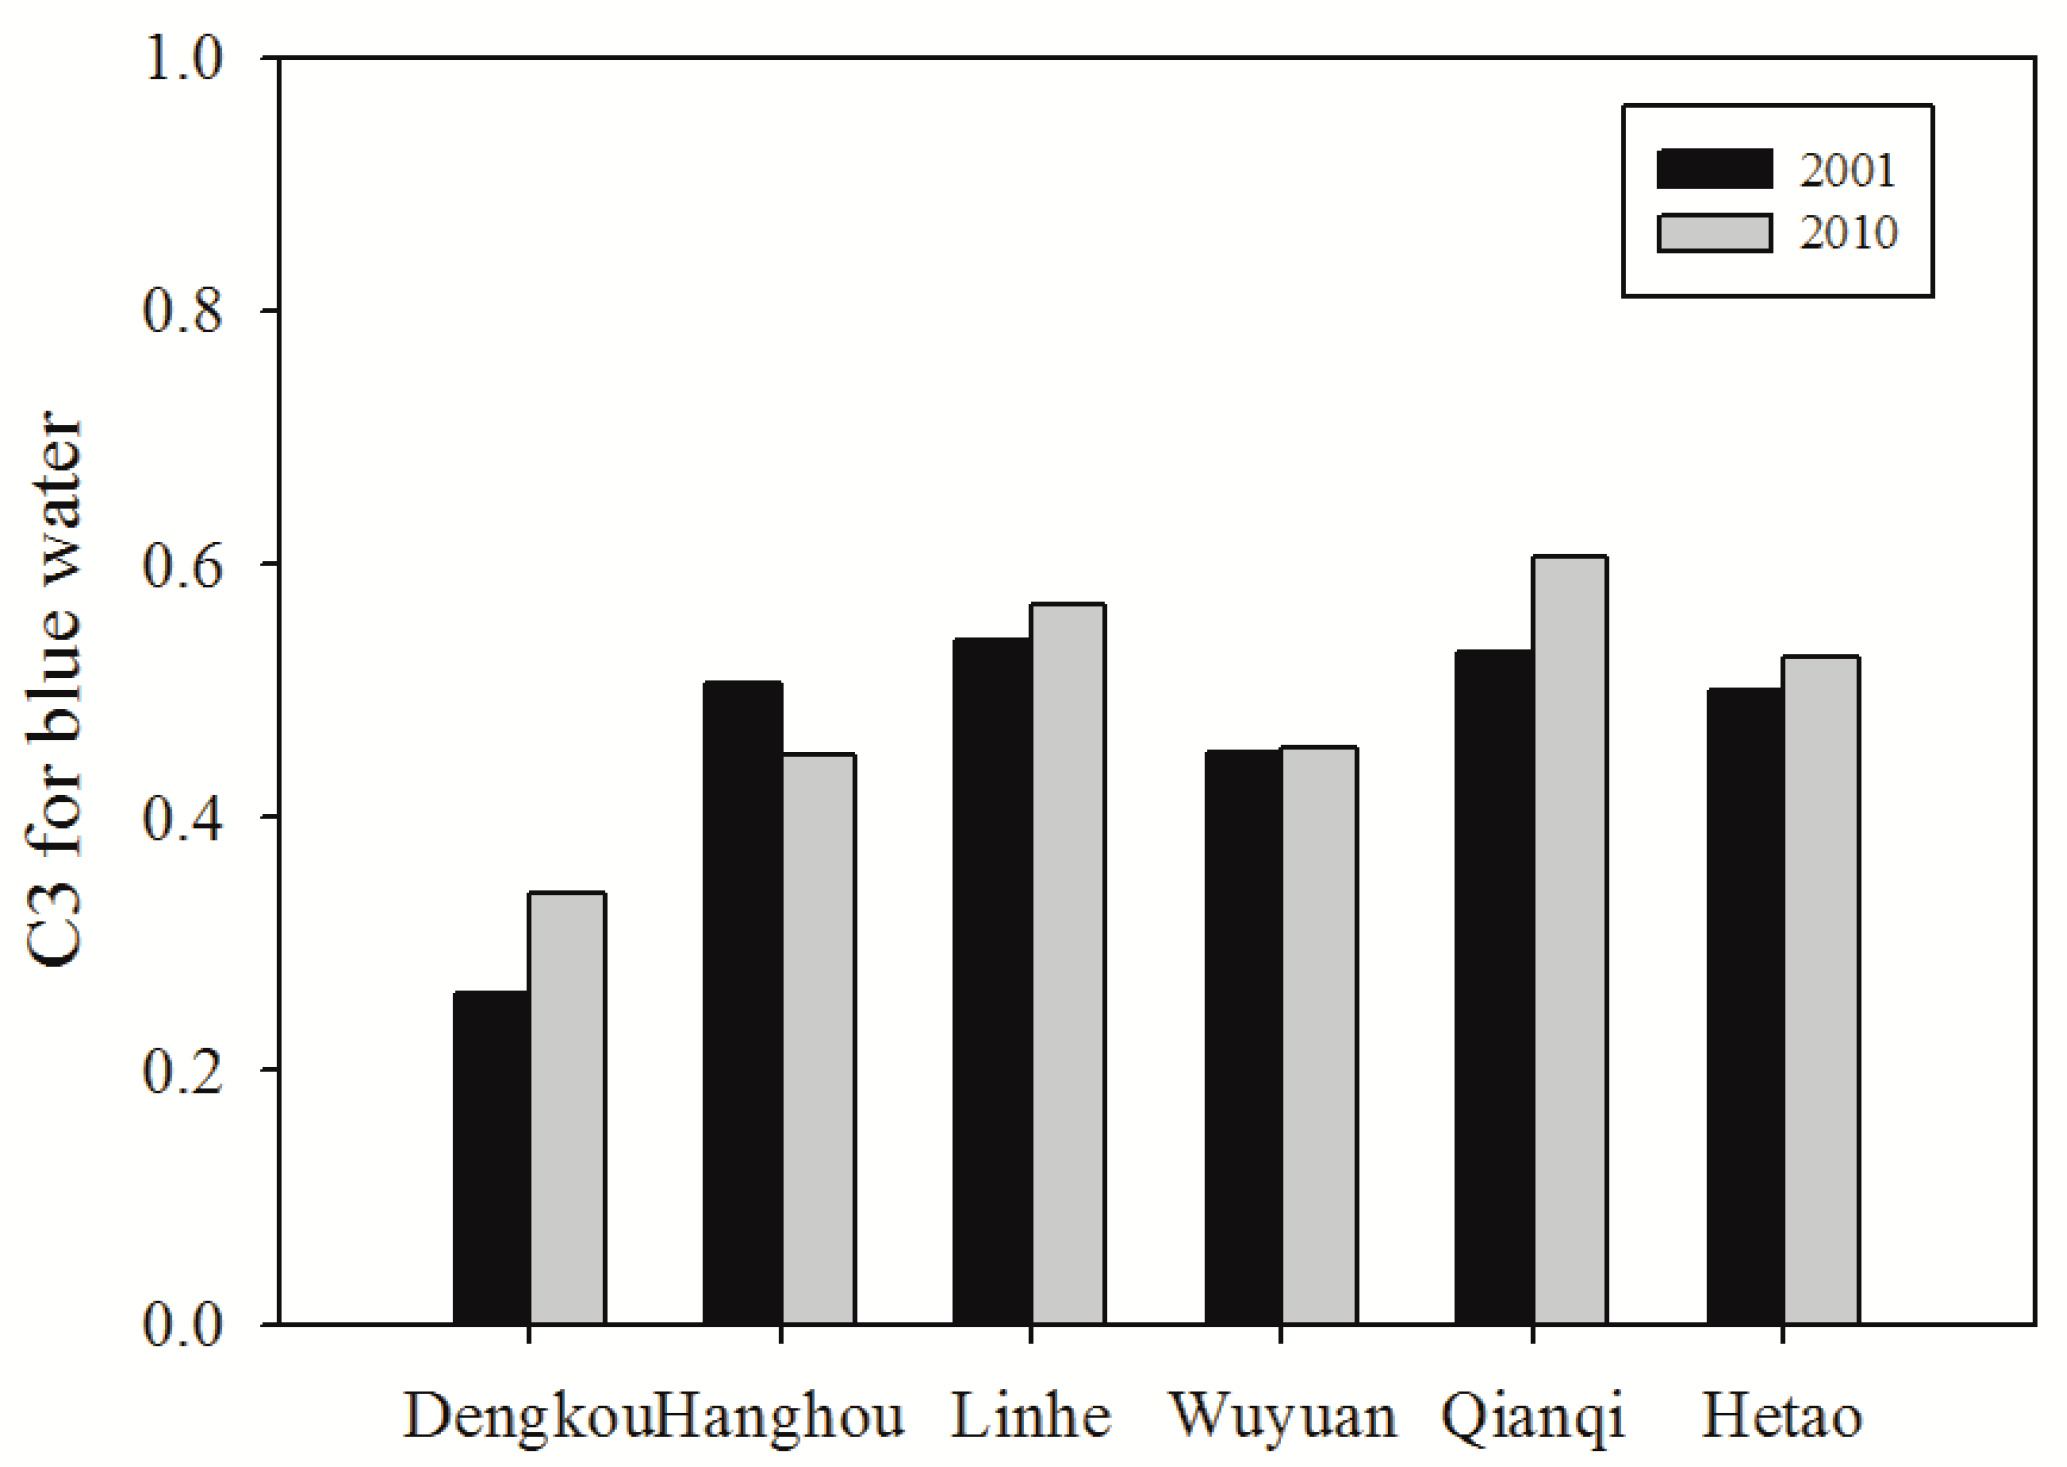
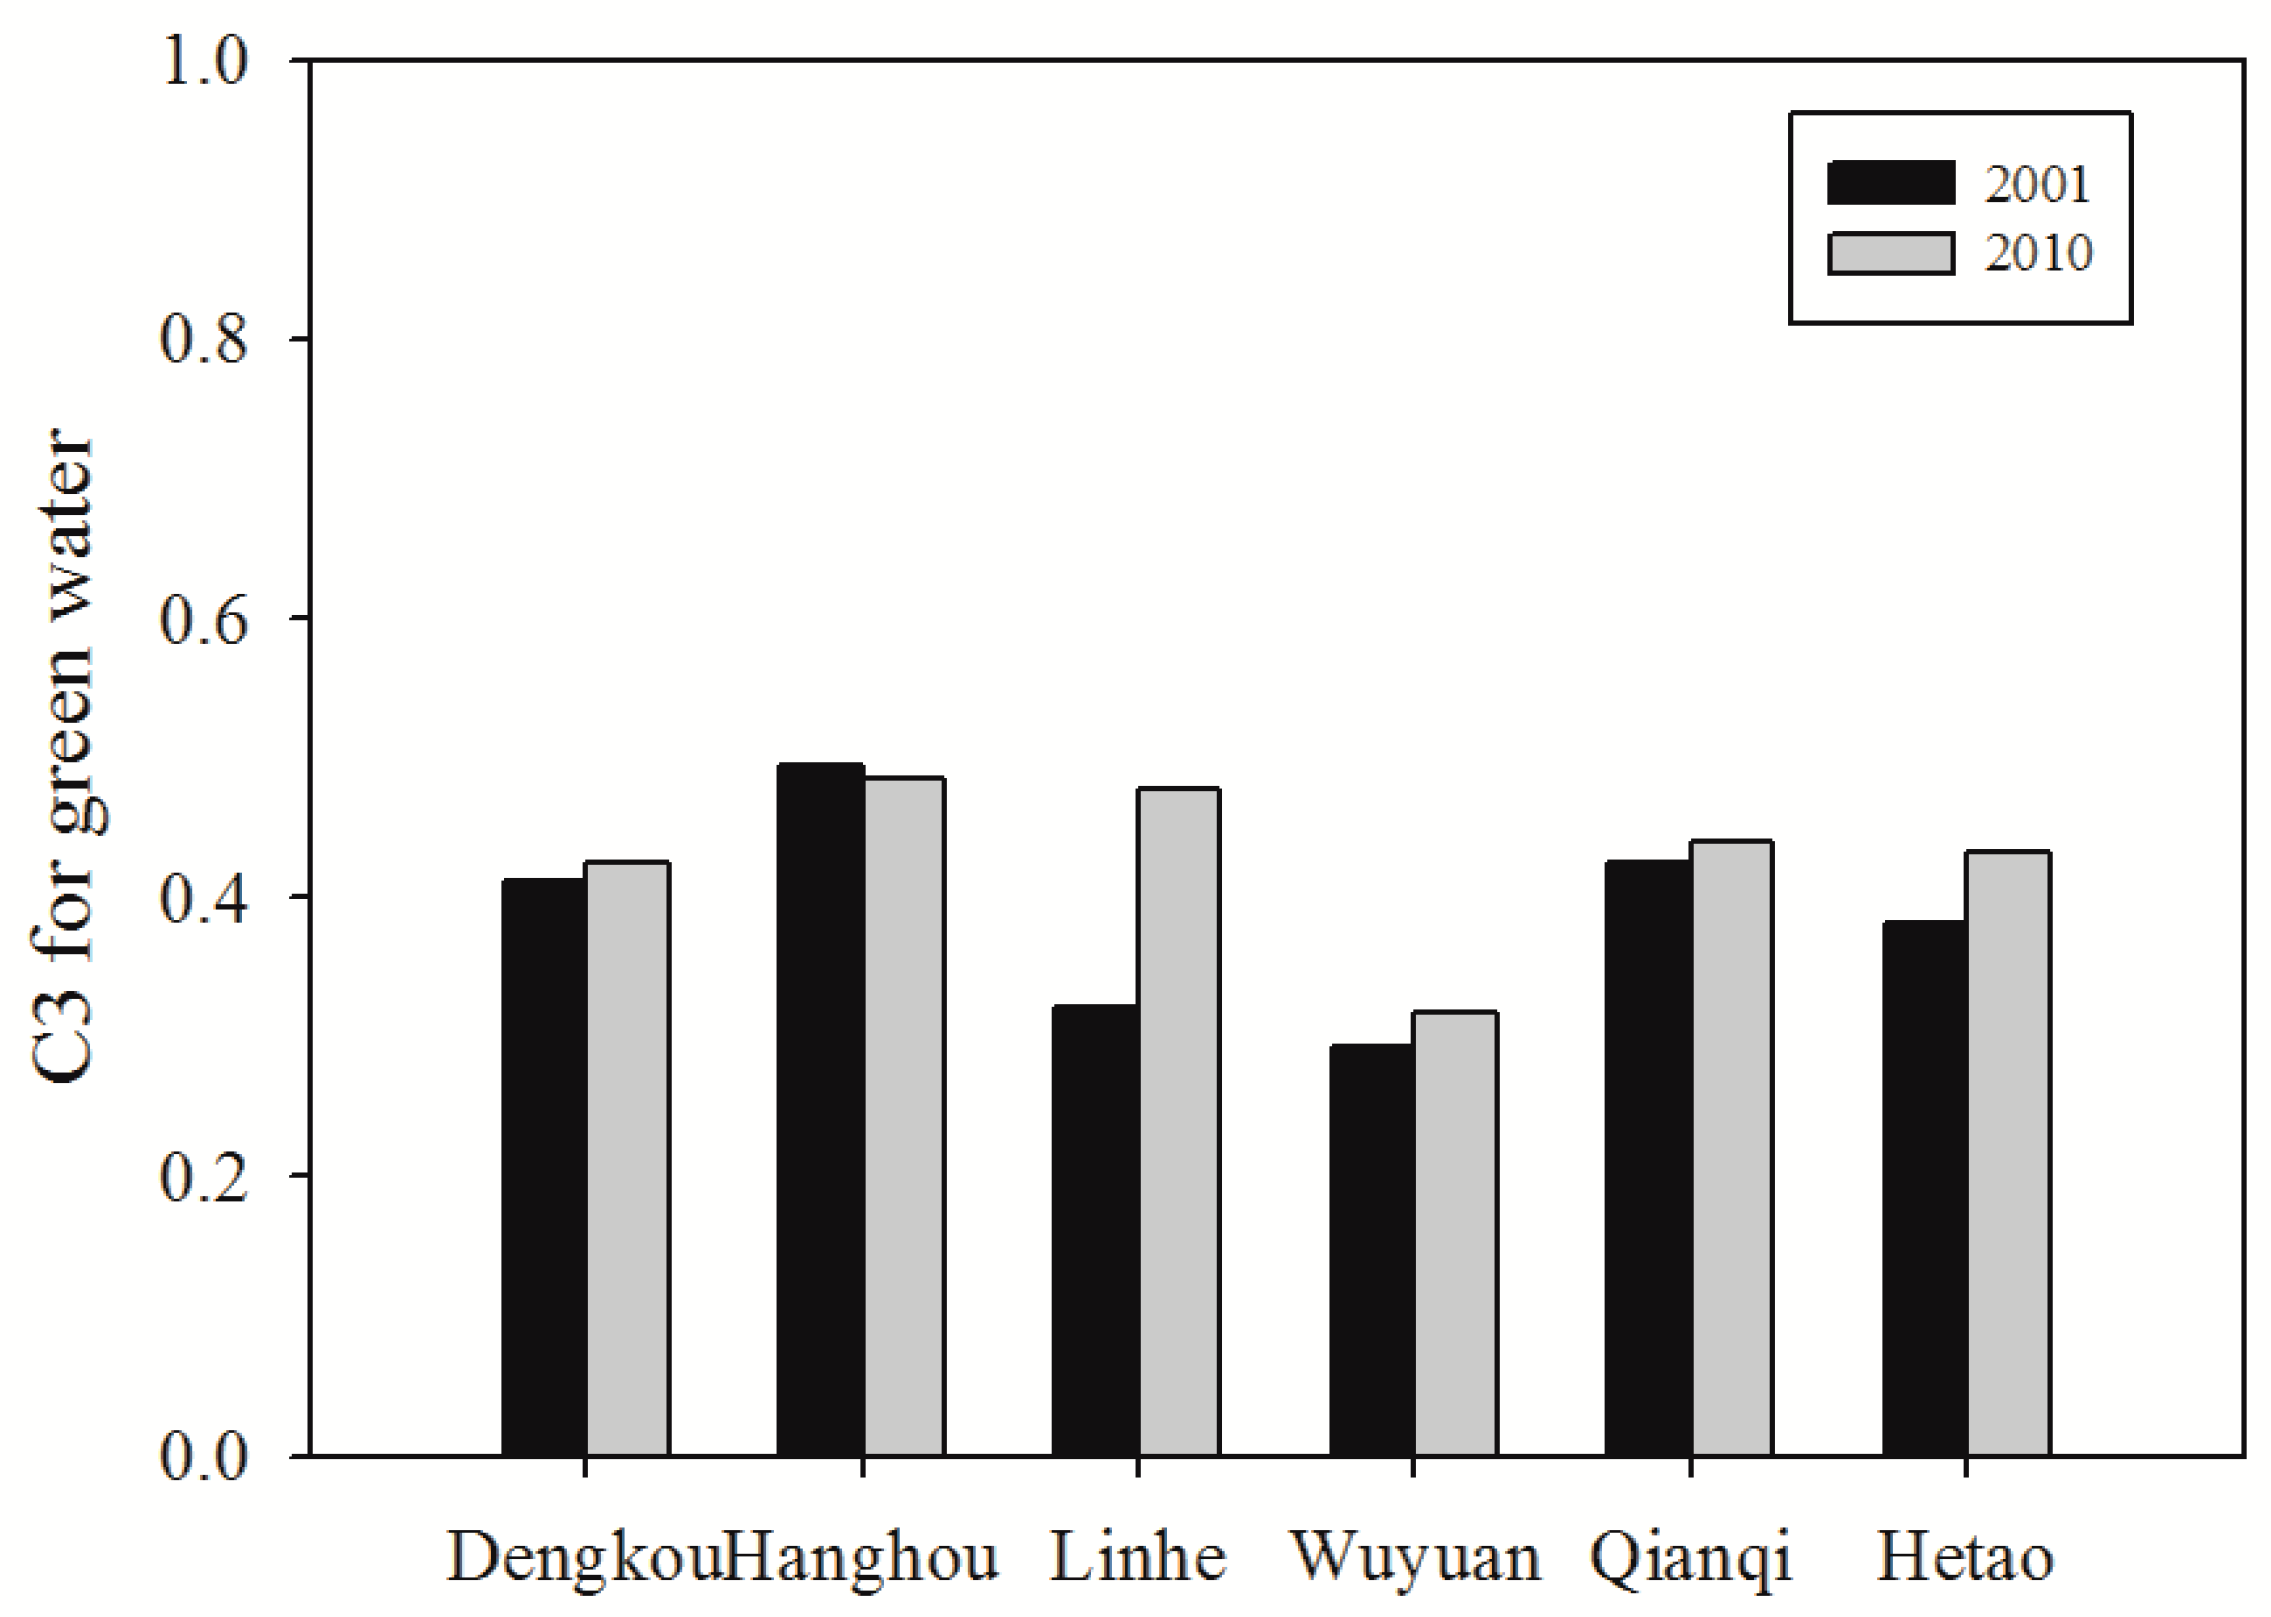
The values of C3 for blue water were much smaller than those of C2 for blue water (Figure 8). In 2001, Linhe was the county with the largest value of C3 for blue water (0.539), and Dengkou was the county with the smallest one (0.260). In 2010, the smallest value was also related to the county Dengkou, and the value in Qianqi was 0.266 larger than that in Dengkou. Compared with the average values in the irrigation district, we found that a difference of 0.028 was produced. In 2001, the value of C3 for green water in the Hanghou was 0.496, followed by Qianqi (0.425), and the smallest value could be seen in the Wuyuan (0.292) (Figure 9). In 2010, the largest and smallest values of C3 for green water were 0.484 in Hanghou and 0.318 in Wuyuan, respectively. The average value of C3 for green water in the Hetao irrigation district changed from 0.381 in 2001 to 0.433 in 2010. The import of virtual water means more water availability, and it plays an important role in the northeast of Brazil, the region with the highest water scarcity [62,63]. The role of virtual water import was also evaluated by Tamea et al. at the global scale [64]. However, the value of C3 was much smaller (0.528 for blue water and 0.433 for green water) than that for C2 in the study area (Figure 8 and Figure 9). With intensified water scarcity, decision makers in China may have to consider loosening their stance on the self-sufficiency principle and take advantage of virtual water import [65]. Consequently, the contribution of virtual water flows from other regions to the irrigation district on regional water consumption, especially for that related to water-intensive products, may present an increasing trend. Thus, blue water savings at a larger scale, including the study area and its trade partners, could occur with the successful application of technologies for more efficient green water utilization. In future, the import of virtual water could be advocated, while the possible influences on regional employment and many other fields should be first considered.
Apart from the study for crops, more attention has been paid recently on the evaluation of water consumption for other kinds of products. Pascale et al. assessed the water footprint for both a conventional and an organic dairy production system, and they found that green water was the most significant contributor to the total water footprint for both systems, indicating an opportunity to improve the water use efficiency [66]. The corporate water footprint of the textile industry and county-level water footprints for different cellulosic-biofuel feedstock pathways were also studied to illustrate the role of blue and green water [67,68]. In this study, only crops were included for the analysis of green water, which was mainly due to lack of data. In future assessments, green water consumption for other kinds of products should also be included to obtain a more complete picture for the water consumption at the irrigation district scale.
4. Conclusions
In this study, three indicators (C1, C2, and C3) were applied to show (a) how much water resources were consumed, (b) the contribution of regional production for the consumption in other areas, and (c) the influences of trade from other regions to the irrigation district on regional water consumption, respectively, for the Hetao irrigation district based on a 10-year period (2001–2010).
The value of C1 for blue water decreased from 0.749 in 2001 to 0.642 in 2010. The overexploitation might result in damages to regional sustainable development in the long run, and implementation of water pricing policies could encourage the adoption of irrigation technologies and water-saving practices. Some constraints, such as the inadequate monitoring infrastructure, a lack of political will, an ageing and poorly trained farm population, small farm size, and low level of farm investment, should be considered at the same time.
Compared with C1 for blue water, the values of C1 for green water were much smaller. Green water usually has a lower opportunity cost and lower environmental influences than blue water. Measures such as the adjustment of crop sowing date or the cultivation of new varieties may be helpful in using more rainfall in the Hetao irrigation district, while factors such as daily climate measurements, crop phenology, soils, and others should also be taken into account.
The values of C2 were 0.885 for blue water and 0.898 for green water in 2010. Water embedded in exported products means more water consumption for the regional government, and the compensation for virtual water export should be given in the near future but not be limited to financial compensation. Rainwater harvesting technologies have been implemented in many regions of the world, which have contributed to the saving of blue water and relieving water scarcity. Besides, the decrease of virtual water content for those products with large value of C2 could also make a contribution to regional water management.
The values of C3 for both blue and green water were much smaller than those of C2. The import of virtual water means more water availability. In future, the import of virtual water could be advocated, as decision makers of China may have to consider loosening the stance on self-sufficiency principle considering the intensified water scarcity, while the possible influences on regional employment and many other fields should be first considered.
Acknowledgments
This work was jointly supported by the National Natural Science Foundation of China (No. 51609063), the Fundamental Research Funds for the Central Universities (No. 2015B10914), the National Natural Science Foundation of China (Nos. 51609065; 51539003; 41323001; 51409218), the National Key R&D Program of China (Grant Nos. 2016YFC0402706; 2016YFC0402710), National Science Funds for Creative Research Groups of China (No. 51421006), the program of Dual Innovative Research Team in Jiangsu Province, and the Special Fund of State Key Laboratory of Hydrology-Water Resources and Hydraulic Engineering (Grant No. 20145027312).
Author Contributions
J.L. and X.C. contributed equally to this work. J.L. and X.C. conceived and designed the experiments; X.C. and B.L. performed the experiments; J.L. and X.C. analyzed the data; Z.Y. contributed reagents/materials/analysis tools; J.L. wrote the paper. All authors discussed and commented on the manuscript.
Conflicts of Interest
The authors declare no conflict of interest. The founding sponsors had no role in the design of the study; in the collection, analyses, or interpretation of data; in the writing of the manuscript, and in the decision to publish the results.
References
- Pedro-Monzonís, M.; Solera, A.; Ferrer, J.; Estrela, T.; Paredes-Arquiola, J. A review of water scarcity and drought indexes in water resources planning and management. J. Hydrol. 2015, 527, 482–493. [Google Scholar] [CrossRef]
- Vörösmarty, C.J.; McIntyre, P.B.; Gessner, M.O.; Dudgeon, D.; Prusevich, A.; Green, P.; Glidden, S.; Bunn, S.E.; Sullivan, C.A.; Liermann, C.R.; et al. Global threats to human water security and river biodiversity. Nature 2010, 467, 555–561. [Google Scholar] [CrossRef] [PubMed]
- Hanasaki, N.; Fujimori, S.; Yamamoto, T.; Yoshikawa, S.; Masaki, Y.; Hijioka, Y.; Kainuma, M.; Kanamori, Y.; Masui, T.; Takahashi, K.; et al. A global water scarcity assessment under shared socio-economic pathways-part 2: Water availability and scarcity. Hydrol. Earth Syst. Sci. 2013, 17, 2393–2413. [Google Scholar] [CrossRef]
- Veldkamp, T.I.; Wada, Y.; de Moel, H.; Kummu, M.; Eisner, S.; Aerts, J.C.; Ward, P.J. Changing mechanism of global water scarcity events: Impacts of socioeconomic changes and inter-annual hydro-climatic variability. Glob. Environ. Chang. 2015, 32, 18–29. [Google Scholar] [CrossRef] [Green Version]
- Li, B.Q.; Liang, Z.M.; Zhang, J.Y.; Wang, G. A revised drought index based on precipitation and pan evaporation. Int. J. Climatol. 2017, 37, 793–801. [Google Scholar] [CrossRef]
- Schewe, J.; Heinke, J.; Gerten, D.; Haddeland, I.; Arnell, N.W.; Clark, D.B.; Gosling, S.N. Multimodel assessment of water scarcity under climate change. Proc. Natl. Acad. Sci. USA 2014, 111, 3245–3250. [Google Scholar] [CrossRef] [PubMed] [Green Version]
- Li, B.Q.; Liang, Z.; Zhang, J.; Wang, G.; Zhao, W.; Zhang, H.; Wang, J.; Hu, Y. Attribution analysis of runoff decline in a semiarid region of the Loess Plateau, China. Theor. Appl. Climatol. 2016. [Google Scholar] [CrossRef]
- Hoekstra, A.Y.; Chapagain, A.K.; Aldaya, M.M.; Mekonnen, M.M. The Water Footprint Assessment Manual: Setting the Global Standard; Earthscan: London, UK, 2011. [Google Scholar]
- Mekonnen, M.M.; Hoekstra, A.Y. Four billion people facing severe water scarcity. Sci. Adv. 2016, 2, e1500323. [Google Scholar] [CrossRef] [PubMed]
- Zhao, X.; Liu, J.; Liu, Q.; Tillotson, M.R.; Guan, D.; Hubacek, K. Physical and virtual water transfers for regional water stress alleviation in China. Proc. Natl. Acad. Sci. USA 2015, 112, 1031–1035. [Google Scholar] [CrossRef] [PubMed]
- Zhuo, L.; Mekonnen, M.M.; Hoekstra, A.Y.; Wada, Y. Inter-and intra-annual variation of water footprint of crops and blue water scarcity in the Yellow River basin (1961–2009). Adv. Water Resour. 2016, 87, 29–41. [Google Scholar] [CrossRef]
- Liu, J.; Wang, Y.; Yu, Z.; Cao, X.; Tian, L.; Sun, S.; Wu, P. A comprehensive analysis of blue water scarcity from the production, consumption, and water transfer perspectives. Ecol. Indic. 2017, 72, 870–880. [Google Scholar] [CrossRef]
- Schyns, J.F.; Hoekstra, A.Y.; Booij, M.J. Review and classification of indicators of green water availability and scarcity. Hydrol. Earth Syst. Sci. 2015, 19, 4581–4608. [Google Scholar] [CrossRef]
- Falkenmark, M. Growing water scarcity in agriculture: Future challenge to global water security. Philos. Trans. R. Soc. A 2013, 371, 20120410. [Google Scholar] [CrossRef] [PubMed]
- Zoumides, C.; Bruggeman, A.; Hadjikakou, M.; Zachariadis, T. Policy-relevant indicators for semi-arid nations: The water footprint of crop production and supply utilization of Cyprus. Ecol. Indic. 2014, 43, 205–214. [Google Scholar] [CrossRef]
- Chouchane, H.; Krol, M.S.; Hoekstra, A.Y. Virtual water trade patterns in relation to environmental and socioeconomic factors: A case study for Tunisia. In Proceedings of the EGU General Assembly 2016, Vienna, Austria, 17–22 April 2016; p. 4997. [Google Scholar]
- Cao, X.C.; Wu, P.T.; Wang, Y.B.; Zhao, X.N.; Liu, J. Analysis on temporal and spatial differences of water productivity in irrigation districts in China. Trans. Chin. Soc. Agric. Eng. 2012, 28, 1–7. [Google Scholar]
- Ye, Z.Y.; Guo, K.Z.; Zhao, S.Y.; Xu, B. The current development and focal points in short-term water-saving agriculture in Hetao irrigation district. China Rural Water Conserv. Hydropower 2010, 6, 81–84. [Google Scholar]
- Hoekstra, A.Y.; Mekonnen, M.M.; Chapagain, A.K.; Mathews, R.E.; Richter, B.D. Global monthly water scarcity: Blue water footprints versus blue water availability. PLoS ONE 2012, 7, e32688. [Google Scholar] [CrossRef] [PubMed]
- Wu, P.T.; Wang, Y.B.; Zhao, X.N. The Report on Water Footprint of Grain Product and Regional Virtual Water Flows in China in 2014; Chinese Agricultural Press: Beijing, China, 2016. [Google Scholar]
- Kastner, T.; Erb, K.H.; Haberl, H. Rapid growth in agricultural trade: Effects on global area efficiency and the role of management. Environ. Res. Lett. 2014, 9, 034015. [Google Scholar] [CrossRef]
- Schyns, J.F.; Hamaideh, A.; Hoekstra, A.Y.; Mekonnen, M.M.; Schyns, M. Mitigating the risk of extreme water scarcity and dependency: The case of Jordan. Water 2015, 7, 5705–5730. [Google Scholar] [CrossRef]
- Antonelli, M.; Laio, F.; Tamea, S. Water resources, food security and the role of virtual water trade in the MENA region. In Environmental Change and Human Security in Africa and the Middle East; Springer: Cham, Switzerland, 2017; pp. 199–217. [Google Scholar]
- Food and Agriculture Organization, Rome. CROPWAT 8.0 Model [EB/OL]. Available online: http://www.fao.org/nr/water/infores_databases_cropwat.html (accessed on 7 May 2012).
- Sun, S.K.; Wu, P.T.; Wang, Y.B.; Zhao, X.; Liu, J.; Zhang, X. The impacts of interannual climate variability and agricultural inputs on water footprint of crop production in an irrigation district of China. Sci. Total Environ. 2013, 444, 498–507. [Google Scholar] [CrossRef] [PubMed]
- Liu, J.; Wu, P.T.; Wang, Y.B.; Zhao, X.; Sun, S.; Cao, X. Impacts of changing cropping pattern on virtual water flows related to crops transfer: A case study for the Hetao irrigation district, China. J. Sci. Food Agric. 2014, 94, 2992–3000. [Google Scholar] [CrossRef] [PubMed]
- Nakayama, T. Simulation of the effect of irrigation on the hydrologic cycle in the highly cultivated Yellow River Basin. Agric. For. Meteorol. 2011, 151, 314–327. [Google Scholar] [CrossRef]
- Ding, S.L.; Chen, P. The concerned problems for life cycle assessment. Environ. Sci. Manag. 2009, 34, 61–64. (In Chinese) [Google Scholar]
- Guo, Y.; Liu, H.C.; Guo, B. Review of key issues on product life cycle assessment. Comput. Integr. Manuf. Syst. 2014, 20, 1141–1148. (In Chinese) [Google Scholar]
- Leng, R.B. Study on Product Life Cycle 3E+S Assessment and Methodology of Decision Analysis. Ph.D. Thesis, Shanghai Jiao Tong University, Shanghai, China, 2007. (In Chinese). [Google Scholar]
- Liu, J.G.; Liu, Q.Y.; Yang, H. Assessing water scarcity by simultaneously considering environmental flow requirements, water quantity, and water quality. Ecol. Indic. 2016, 60, 434–441. [Google Scholar] [CrossRef]
- China Meteorological Administration. China Meteorological Data Sharing Service System; China Meteorological Administration: Beijing, China, 2010. Available online: http://cdc.cma.gov.cn (accessed on 7 May 2010).
- Ministry of Agriculture of the People’s Republic of China. Hetao Irrigation District Agricultural Statistical Data 2001–2010; Ministry of Agriculture of the People’s Republic of China, Chinese Agricultural Press: Beijing, China, 2011.
- Ministry of Water Resources of the People’s Republic of China. Bayan Nur Water Resources Bulletin 2001–2010; Ministry of Water Resources of the People’s Republic of China, Water Resources and Electricity Press: Beijing, China, 2011.
- National Bureau of Statistics of China. Bayan Nur Statistical Yearbook and Inner Mongolia Statistical Yearbook 2001–2010; National Bureau of Statistics of China, China Statistical Press: Beijing, China, 2011.
- Wang, Y.B.; Liu, D.; Cao, X.C.; Yang, Z.Y.; Song, J.F.; Chen, D.Y.; Sun, S.K. Agricultural water rights trading and virtual water export compensation coupling model: A case study of an irrigation district in China. Agric. Water Manag. 2017, 180, 99–106. [Google Scholar] [CrossRef]
- Wang, J.P. Study on Irrigation Water Price in Inner Mongolia Autonomous Region; Chinese Academy of Agricultural Sciences: Beijing, China, 2012. (In Chinese) [Google Scholar]
- Bai, G.S.; Zhang, R.; Geng, R.J. Integrating agricultural water-saving technologies in Hetao irrigation district. Bull. Soil Water Conserv. 2011, 31, 149–154. (In Chinese) [Google Scholar]
- Lutter, S.; Pfister, S.; Giljum, S.; Wieland, H.; Mutel, C. Spatially explicit assessment of water embodied in European trade: A product-level multi-regional input-output analysis. Glob. Environ. Chang. 2016, 38, 171–182. [Google Scholar] [CrossRef]
- Giannakis, E.; Bruggeman, A.; Djuma, H.; Kozyra, J.; Hammer, J. Water pricing and irrigation across Europe: Opportunities and constraints for adopting irrigation scheduling decision support systems. Water Sci. Technol. Water Supply 2016, 16, 245–252. [Google Scholar] [CrossRef]
- Schoengold, K.; Sunding, D.L. The impact of water price uncertainty on the adoption of precision irrigation systems. Agric. Econ. 2014, 45, 729–743. [Google Scholar] [CrossRef]
- Philip, J.; Sanchez-Choliz, J.; Sarasa, C. Technological change in irrigated agriculture in a semiarid region of Spain. Water Resour. Res. 2014, 50, 9221–9235. [Google Scholar] [CrossRef]
- Morrison, M. Encouraging the adoption of decision support systems by irrigators. Rural Soc. 2009, 19, 17–31. [Google Scholar] [CrossRef]
- Scheierling, S.M.; Young, R.A.; Cardon, G.E. Public subsidies for water-conserving irrigation investments: Hydrologic, agronomic, and economic assessment. Water Resour. Res. 2006, 42. [Google Scholar] [CrossRef]
- Genius, M.; Koundouri, P.; Nauges, C.; Tzouvelekas, V. Information transmission in irrigation technology adoption and diffusion: Social learning, extension services, and spatial effects. Am. J. Agric. Econ. 2014, 96, 328–344. [Google Scholar] [CrossRef]
- Whittenbury, K.; Davidson, P. Beyond adoption: The need for a broad understanding of factors that influence irrigators’decision-making. Rural Soc. 2009, 19, 4–16. [Google Scholar] [CrossRef]
- Hoekstra, A.Y.; Savenije, H.H.G.; Chapagain, A.K. An integrated approach towards assessing the value of water: A case study on the Zambezi basin. Integr. Assess. 2001, 2, 199–208. [Google Scholar] [CrossRef]
- Albersen, P.J.; Houba, H.E.D.; Keyzer, M.A. Pricing a raindrop in a process-based model: General methodology and a case study of the Upper-Zambezi. Phys. Chem. Earth 2003, 28, 183–192. [Google Scholar] [CrossRef]
- Clay, J.W. World Agriculture and the Environment: A Commodity-by-Commodity Guide to Impacts and Practices; Island Press: Washington, DC, USA, 2004. [Google Scholar]
- Aldaya, M.M.; Allan, J.A.; Hoekstra, A.Y. Strategic importance of green water in international crop trade. Ecol. Econ. 2010, 69, 887–894. [Google Scholar] [CrossRef]
- Veettil, A.V.; Mishra, A.K. Water security assessment using blue and green water footprint concepts. J. Hydrol. 2016, 542, 589–602. [Google Scholar] [CrossRef]
- Quinteiro, P.; Dias, A.C.; Silva, M.; Ridoutt, B.G.; Arroja, L. A contribution to the environmental impact assessment of green water flows. J. Clean. Prod. 2015, 93, 318–329. [Google Scholar] [CrossRef]
- Kummu, M.; Gerten, D.; Heinke, J.; Konzmann, M.; Varis, O. Climate-driven interannual variability of water scarcity in food production potential: A global analysis. Hydrol. Earth Syst. Sci. 2014, 18, 447–461. [Google Scholar] [CrossRef] [Green Version]
- Schmitz, C.; Lotze-Campen, H.; Gerten, D.; Dietrich, J.P.; Bodirsky, B.; Biewald, A.; Popp, A. Blue water scarcity and the economic impacts of future agricultural trade and demand. Water Resour. Res. 2013, 49, 3601–3617. [Google Scholar] [CrossRef]
- Bulsink, F.; Hoekstra, A.Y.; Booij, M.J. The water footprint of Indonesian provinces related to the consumption of crop products. Hydrol. Earth Syst. Sci. 2010, 14, 119–128. [Google Scholar] [CrossRef]
- Chapagain, A.K.; Hoekstra, A.Y.; Savenije, H.H.G. Water saving through international trade of agricultural products. Hydrol. Earth Syst. Sci. 2006, 10, 455–468. [Google Scholar] [CrossRef]
- Li, Y.; Ye, Q.; Liu, A.; Meng, F.; Zhang, W.; Wei, X.; Wang, P.; Wang, C. Seeking urbanization security and sustainability: Multi-objective optimization of rainwater harvesting systems in China. J. Hydrol. 2017, 550, 42–53. [Google Scholar] [CrossRef]
- Coutts, A.M.; Tapper, N.J.; Beringer, J.; Loughnan, M.; Demuzere, M. Watering our cities: The capacity for Water Sensitive Urban Design to support urban cooling and improve human thermal comfort in the Australian context. Prog. Phys. Geogr. 2012, 37, 2–28. [Google Scholar] [CrossRef]
- Bhaskar, A.S.; Hogan, D.M.; Archfield, S.A. Urban base flow with low impact development. Hydrol. Process. 2016, 30, 3156–3171. [Google Scholar] [CrossRef]
- Andoh, R.Y.G.; Iwugo, K.O. Sustainable Urban Drainage Systems: A UK Perspective. In Global Solutions for Urban Drainage; The American Society of Civil Engineers: Reston, VA, USA, 2004. [Google Scholar]
- Ministry of Housing and Urban-Rural Development of the People’s Republic of China. Sponge Cities Construction Technology Guides; Ministry of Housing and Urban-Rural Development of the People’s Republic of China: Beijing, China, 2014.
- Da Silva, V.D.P.R.; de Oliveira, S.D.; Hoekstra, A.Y.; Dantas Neto, J.; Campos, J.H.B.; Braga, C.C.; de Holanda, R.M. Water footprint and virtual water trade of Brazil. Water 2016, 8, 517. [Google Scholar] [CrossRef]
- Flach, R.; Ran, Y.; Godar, J.; Karlberg, L.; Suavet, C. Towards more spatially explicit assessments of virtual water flows: Linking local water use and scarcity to global demand of Brazilian farming commodities. Environ. Res. Lett. 2016, 11, 075003. [Google Scholar] [CrossRef]
- Tamea, S.; Laio, F.; Ridolfi, L. Global effects of local food-production crises: A virtual water perspective. Sci. Rep. 2016, 6, 18803. [Google Scholar] [CrossRef] [PubMed]
- Liu, J.; Savenije, H.H. Food consumption patterns and their effect on water requirement in China. Hydrol. Earth Syst. Sci. 2008, 12, 887–898. [Google Scholar] [CrossRef]
- Pascale, P.; Julio, C.; Macedo, P.; Jose, R. Water footprint accounting and scarcity indicators of conventional and organic dairy production systems. J. Clean. Prod. 2015, 93, 299–307. [Google Scholar]
- Sun, Q.; Huang, X.; Shi, L. Corporate water footprint of textile industry: Methodology and case study. Res. Environ. Sci. 2014, 27, 910–914. [Google Scholar]
- Chiu, Y.; Wu, M. Assessing county-level water footprints of different cellulosic-biofuel feedstock pathways. Environ. Sci. Technol. 2012, 46, 9155–9162. [Google Scholar] [CrossRef] [PubMed]
Figure 1.
The location of the Hetao irrigation district.

Figure 2.
Values of C1 for blue water for the Hetao irrigation district and its five counties in 2001 and 2010.
Figure 2.
Values of C1 for blue water for the Hetao irrigation district and its five counties in 2001 and 2010.

Figure 3.
Values of C1 for green water for the Hetao irrigation district and its five counties in 2001 and 2010.
Figure 3.
Values of C1 for green water for the Hetao irrigation district and its five counties in 2001 and 2010.

Figure 4.
Temporal variation of precipitation for counties in the Hetao irrigation district from 2001 to 2010.
Figure 4.
Temporal variation of precipitation for counties in the Hetao irrigation district from 2001 to 2010.

Figure 5.
Values of C2 for blue water for the Hetao irrigation district and its five counties in 2001 and 2010.
Figure 5.
Values of C2 for blue water for the Hetao irrigation district and its five counties in 2001 and 2010.

Figure 6.
Values of C2 for green water for the Hetao irrigation district and its five counties in 2001 and 2010.
Figure 6.
Values of C2 for green water for the Hetao irrigation district and its five counties in 2001 and 2010.

Figure 7.
Values of C2 for blue water for different products in the Hetao irrigation district during 2001–2010.
Figure 7.
Values of C2 for blue water for different products in the Hetao irrigation district during 2001–2010.

Figure 8.
Values of C3 for blue water for the Hetao irrigation district and its five counties in 2001 and 2010.
Figure 8.
Values of C3 for blue water for the Hetao irrigation district and its five counties in 2001 and 2010.

Figure 9.
Values of C3 for green water for the Hetao irrigation district and its five counties in 2001 and 2010.
Figure 9.
Values of C3 for green water for the Hetao irrigation district and its five counties in 2001 and 2010.

© 2018 by the authors. Licensee MDPI, Basel, Switzerland. This article is an open access article distributed under the terms and conditions of the Creative Commons Attribution (CC BY) license (http://creativecommons.org/licenses/by/4.0/).
Share and Cite
MDPI and ACS Style
Liu, J.; Cao, X.; Li, B.; Yu, Z. Analysis of Blue and Green Water Consumption at the Irrigation District Scale. Sustainability 2018, 10, 305. https://0-doi-org.brum.beds.ac.uk/10.3390/su10020305
AMA Style
Liu J, Cao X, Li B, Yu Z. Analysis of Blue and Green Water Consumption at the Irrigation District Scale. Sustainability. 2018; 10(2):305. https://0-doi-org.brum.beds.ac.uk/10.3390/su10020305
Chicago/Turabian StyleLiu, Jing, Xinchun Cao, Binquan Li, and Zhongbo Yu. 2018. "Analysis of Blue and Green Water Consumption at the Irrigation District Scale" Sustainability 10, no. 2: 305. https://0-doi-org.brum.beds.ac.uk/10.3390/su10020305
Note that from the first issue of 2016, this journal uses article numbers instead of page numbers. See further details here.