Sustainable Overall Throughputability Effectiveness (S.O.T.E.) as a Metric for Production Systems

1
Mechanical Engineering School, Pontificia Universidad Católica de Valparaíso, Valparaiso 243000, Chile
2
Department of Mechanical Engineering, Polytechnic University of Milan, Piazza Leonardo da Vinci, 32, 20133 Milano, Italy
3
Inacap Valparaiso, Universidad Tecnológica de Chile INACAP, Valparaiso 243000, Chile
*
Author to whom correspondence should be addressed.
Sustainability 2018, 10(2), 362; https://0-doi-org.brum.beds.ac.uk/10.3390/su10020362
Submission received: 22 December 2017
/
Revised: 18 January 2018
/
Accepted: 20 January 2018
/
Published: 31 January 2018
Abstract
:This paper proposes a new index for a comprehensive and systematic measurement of sustainability and throughput performance in production systems. The proposed index, called Sustainable Overall Throughput Effectiveness (S.O.T.E.), is designed on the basis of a comparison of the environmental and operational factors. Specifically, it integrates the following four dimensions: availability, utilization, performance, and environmental sustainability. The way each dimension is measured is explained and justified. This index uses the overall environmental equipment effectiveness (OEEE) index, which is based on the Overall Equipment Effectiveness (OEE) index. However, such metrics are lacking at the factory level, because OEEE, as well as the OEE, is devoted to equipment-level. Its application and potential contribution to the analysis of sustainable throughput is demonstrated through a case study in an actual crushing plant. Through examining several hypotheses concerning the relationship between operational and environmental performance, a series of useful conclusions could be raised. The main difference and advantage of the proposed S.O.T.E. is that S.O.T.E., as it is based on the Overall Throughput Effectiveness (OTE), measures factory-level sustainability and operational performance. S.O.T.E. allows us to relate the impact of the overall effectiveness of each one of the components of the index to each piece of equipment that makes a part of the production systems. Furthermore, S.O.T.E., as OTE, take into account the production system configuration (series, parallel, assembly, etc.).
1. Introduction
Since the 1980s, Overall Equipment Effectiveness (OEE) has been recognized as a fundamental indicator for measuring performance at the level of equipment [1]. Later, Hansen [2] recognized that the use of OEE allows researchers to focus on the critical success factors in any production system. More recently, Gola and Nieoczym [3] concluded that OEE provides a basis for developing and evaluating improvement strategies in different kinds of production systems. However, one of the biggest deficiencies detected in the use of the OEE is that this indicator is focused on each of the teams individually and does not take into account the configurations and relationships between each piece the equipment. The only effort to evaluate how the individual OEE (component level) affected the overall OEE (plant level) was reported by Ylipaa et al. [4]. They performed a series of Monte Carlo simulations trying to find out what was the relative importance of each factor of the OEE. More recently, Muthiah and Huang [5] proposed a new indicator, the Overall Throughput Effectiveness (OTE) that, unlike the OEE, operates at the production system level. OTE considers the production system as a whole, taking into account its taxonomy, and allowing for the calculation of, through a set of equations, the factory level performance. Along with the emergence of the OTE, other indicators appear in the literature that also aim to be useful in the measurement of system-level performance [6,7,8,9,10]. Nowadays, the incorporation of environmentally conscientious practices into manufacturing has become an enabler to every firm. All the stakeholders want assurance that their products and processes contribute to a more sustainable world. Various models and indicators have been proposed and are being used to reflect the environmental performance of production activities; among them, we can quote Ecoindicator-99, which includes, in a single value, all the emissions referred to as millipoint [11,12]. However, none of these factors consider, in an integrated manner, the operational and environmental performance in their models, and therefore cannot be considered as sustainability indicators. In fact, the present literature does not offer a common indicator that allows the evaluation of all the improvements achieved with respect to maintenance, quality, production, and environmental practices. An exception can be found in the work presented by Domingo and Aguado [13], who proposed a new OEEE indicator that brings together these aspects in a single metric. Nevertheless, due to the characteristics of the OEEE indicator, it does not allow for the assessment of the impact that each of the aspects measured at the equipment level generates at the plant level.
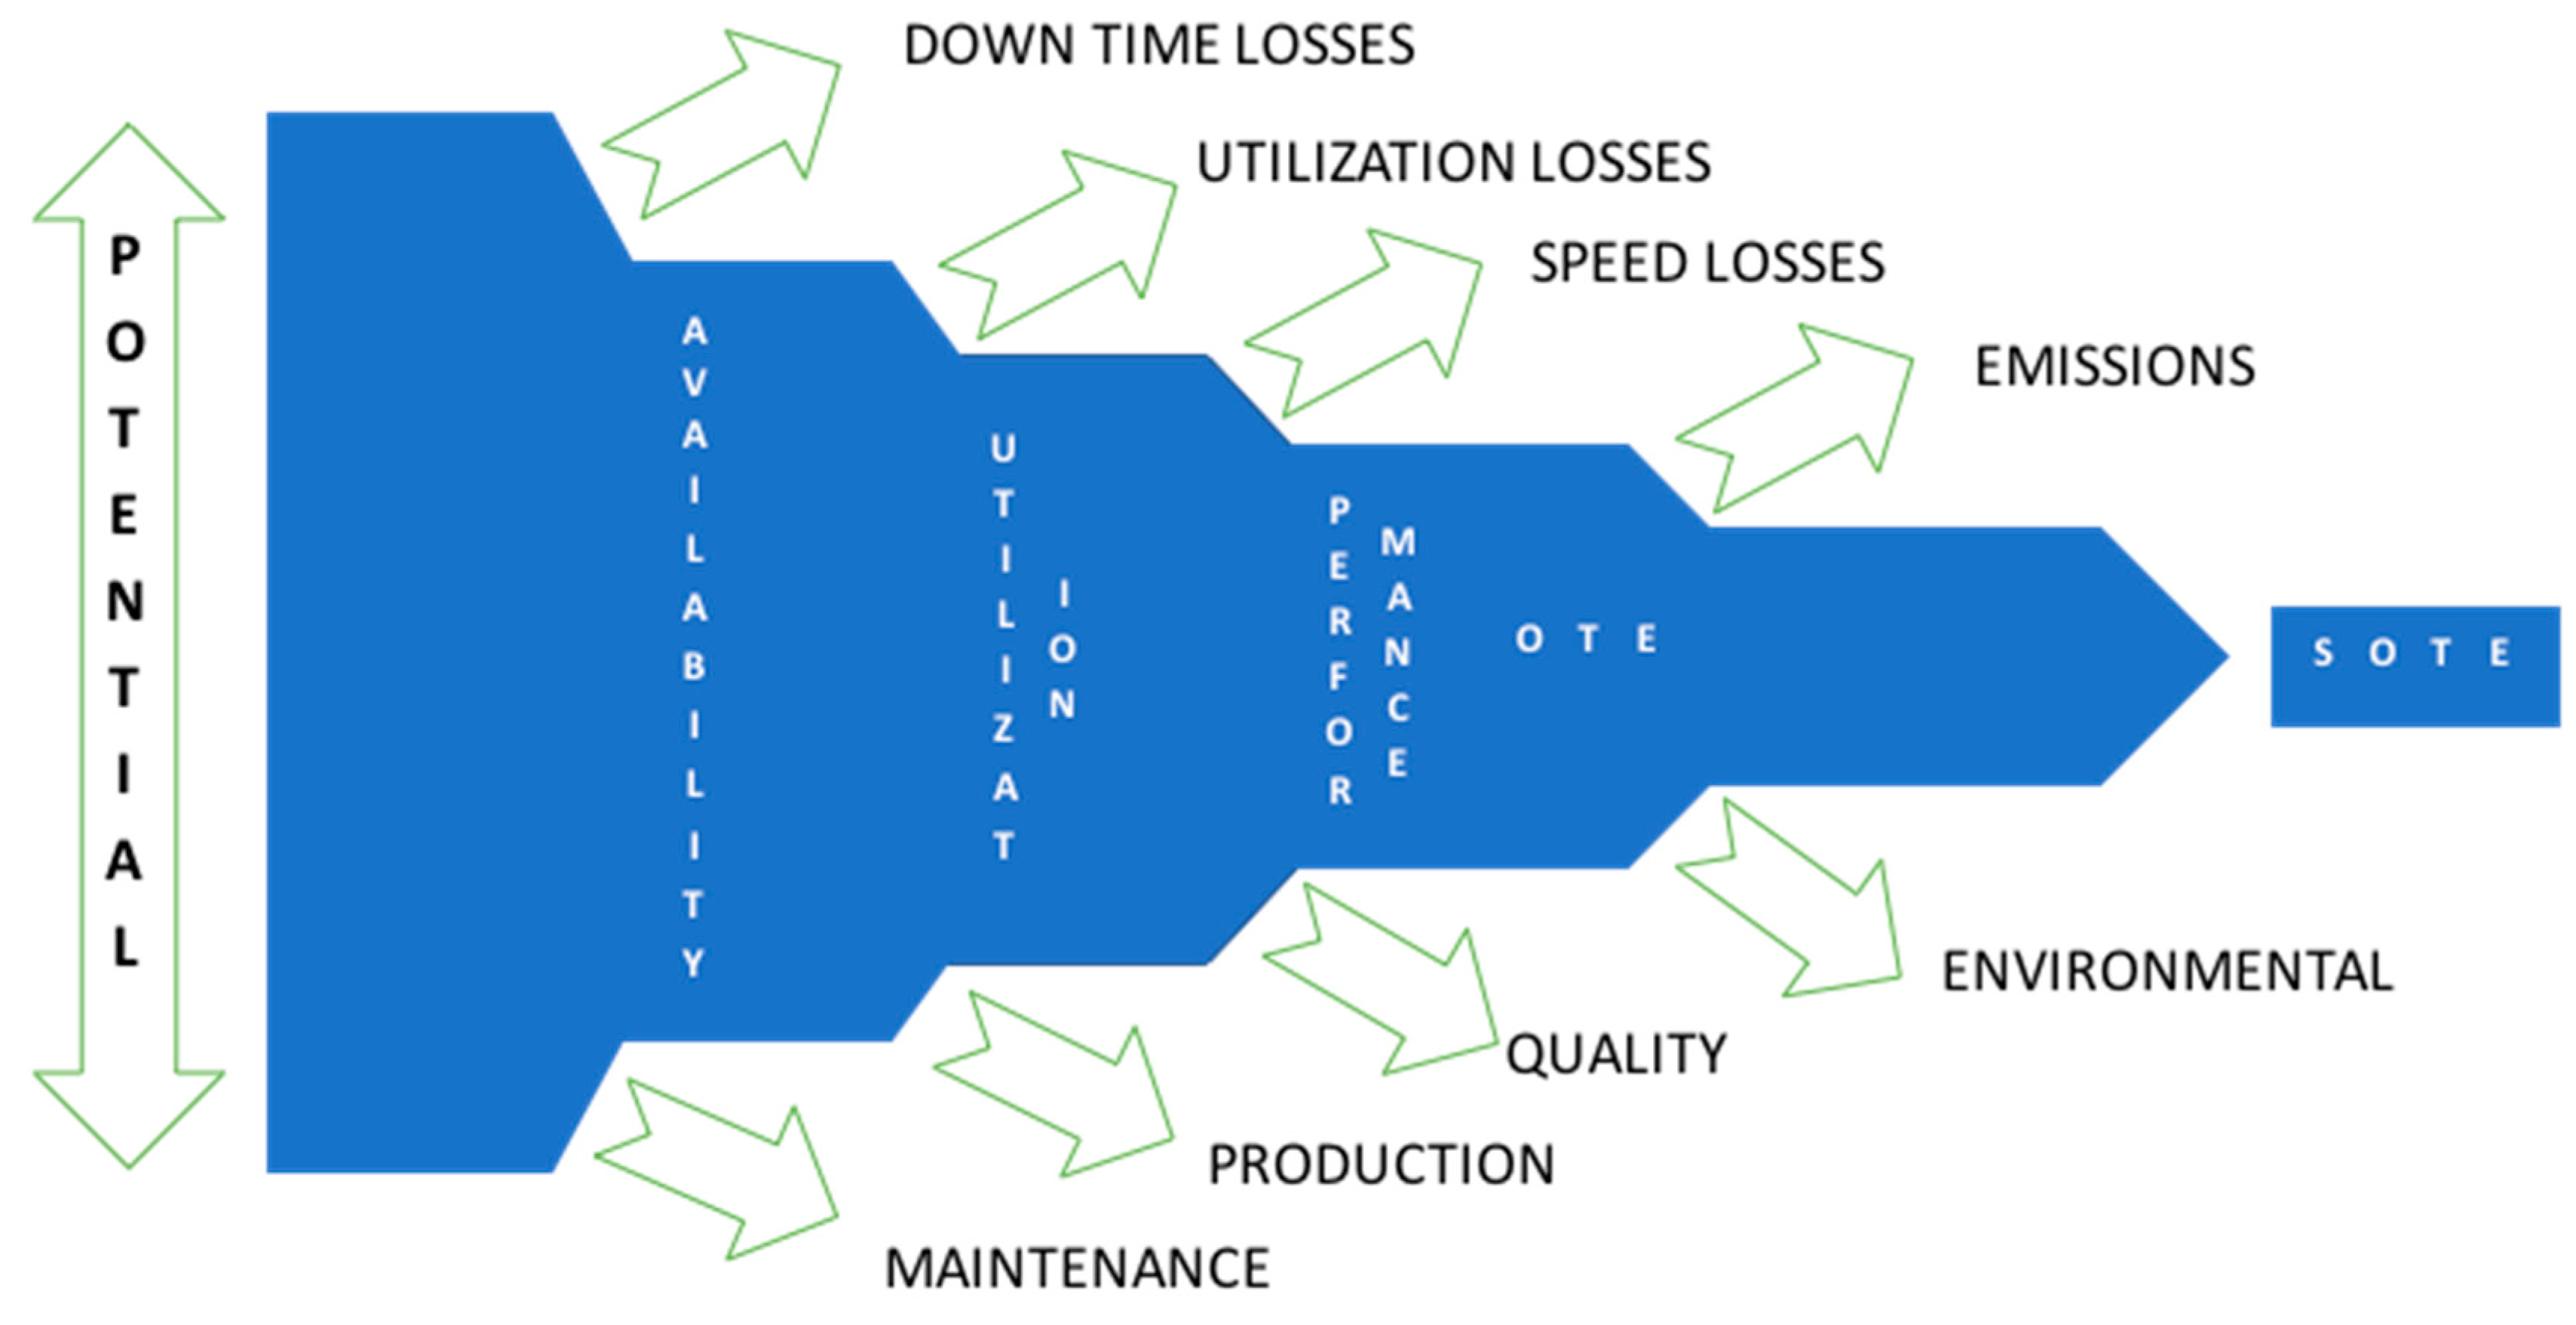
This paper aims to extend the work developed by Domingo and Aguado, incorporating the use of a new index, called Sustainable Overall Throughput Effectiveness (S.O.T.E.). This indicator has all the characteristics mentioned in the previous paragraphs: an integrated vision of the aspects related to maintenance, quality, production, and environmental, and their effects on the overall performance of the system. The proposed model is illustrated in Figure 1.
Incorporating OTE models allows the indicator proposed here to take into account the taxonomy of the production system besides the interdependent relationships among their pieces of equipment. It also allows for the evaluation of the overall sustainable performance of the throughput or, as we call it, the sustainable throughput.
2. Literature Review
2.1. Sustainability Measures
Muthu et al. [14] defined a model to quantify the environmental impact made by various textile fibers and also to position them in terms of ecological sustainability. Paju et al. [15] introduced and illustrated the application of a VSM-based assessment, termed Sustainable Manufacturing Mapping (SMM). SMM takes chosen sustainability indicators into consideration and is based on VSM, Life Cycle Assessment (LCA), and Discrete Event Simulation (DES).
In order to find out whether and how sustainable development indicators (SDI) are applied, Palme and Tillman implemented a series of field studies and performed a literature survey concerning the actual use of SDIs in Swedish organizations [16]. The main conclusion was that SDIs are frequently used in reporting but not in planning and decision making, and hence may not contribute substantially to sustainable development. One of the main aspects related to sustainability is related to air quality. Two of the main used indexes in terms of Particulate Matter are PM10 and PM2.5 that can be defined as follows [17]:
- PM10: inhalable particles, with diameters that are smaller than 10 µm.
- PM2.5: fine inhalable particles, with smaller than 2.5 µm in diameter.
The assessment of the state of air quality is normally made in accordance with the limits established by international and governmental organisms. Those assessments are based on the analysis of the data collected by the in-site monitoring stations. Most of the air quality monitoring throughout Chile is oriented towards PM10 particles. More recently, the PM2.5 standard begins to be used, seeking to use a better indicator of the air quality status. However, if we consider the mining industry, the subjacent processes register a higher contribution of coarse particulate matter [18].
The triple bottom line (TBL) has become a very useful concept to measure sustainability according to three main attributes, namely, environment, economy, and society. Those attributes have been identified as core pillars of sustainability. Several works have used the TBL concept as an attempt to measure the sustainability of different kinds of organizations, processes, and products. Mahmood et al. [19] established a relationship among the traditional OEE factors (availability, productivity, and quality) and sustainability (through the use of the TPL concept). The authors concluded that the OEE measure can be translated into manufacturing sustainability, which means that every improvement detected in the OEE metric will have an indirect and positive impact on TBL dimensions. Pires et al. [20] proposed a model supported by the TBL concept to determine and prioritize a set of attributes that lead to better maintenance performances. The authors proposed the use of Analytical Hierarchical Process (AHP) in order to determine the degree of influence that each TBL factor has into the OEE factors. Other works have pointed to analyze sustainability in logistics and supply chains structures [21,22]. Another paper that deals with sustainability in supply chains was reported by De Soete [23]. In that work, the author suggests mechanisms to embed sustainability attribute into business operational management systems, such as Material Requirement Planning (MRP), Manufacturing Execution Systems (MES), and Enterprise Resource Planning (ERPs) software.
2.2. Overall Efficiency Metrics
One of the most used and accepted indicators of efficiency is the Overall Equipment Effectiveness (OEE). Proposed by Nakajima as a way to evaluate the progress of TPM implementation initiatives, this indicator allows for the tracking of efficiency behaviour. Also, OEE is a tool to calculate efficiency at the equipment level and to measure the productivity of the equipment in relation to its maximum capacity, which is assumed to be constant over the period considered. According to Nakajima [1], the OEE can be calculated through the product of Availability Efficiency (Aeff), production performance (Peff), and quality efficiency (Qeff).
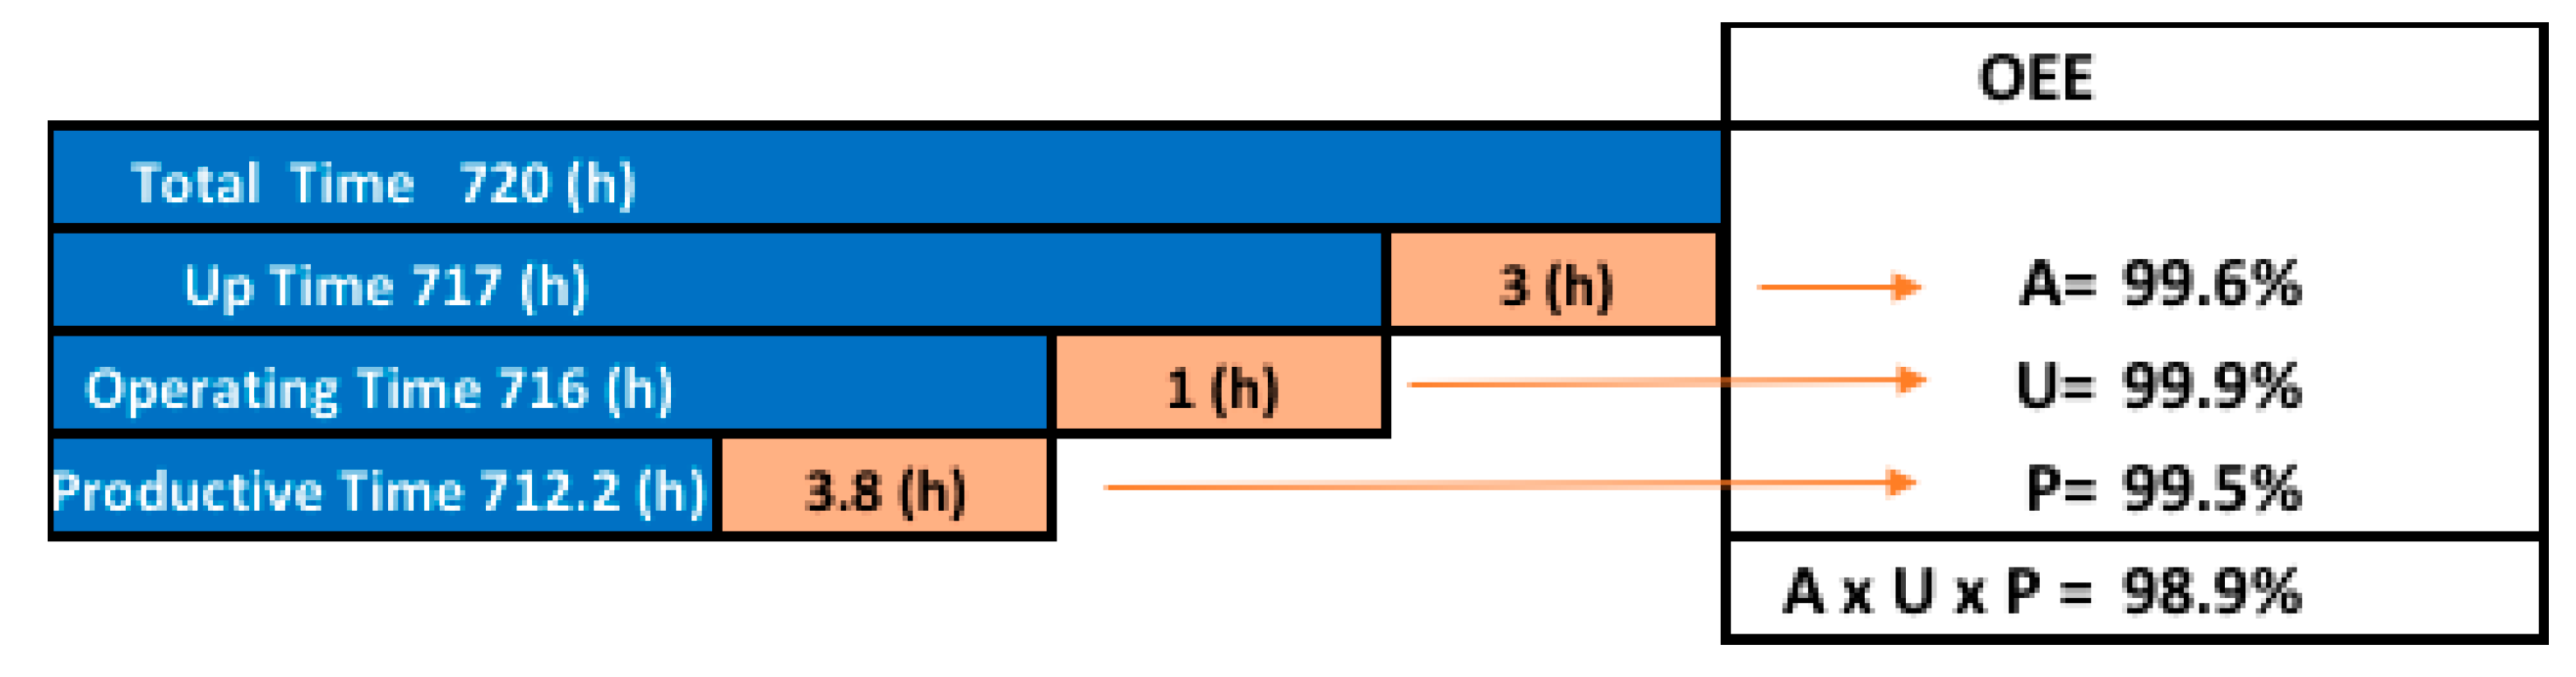
The mining industry in general lagged behind other industry sectors in adopting OEE as a good measure of performance. Some papers have been reported in the literature addressing the adaptations and utilizations of the OEE in mining operations [24,25,26,27,28,29]. Emery [26] described the application of the Total Productive Management (TPM) technique and the use of OEE in coal mining operations. Elevli and Elevli [29] tried to identify causes of time losses for shovel and truck operations. They grouped those losses into three categories, i.e., availability, performance, and quality losses. One of the most important modifications is the one that addresses the quality rate factor. According to Paraszczak [25], a more pertinent factor for mining equipment is the production efficiency. As in mining production systems, the production process is a quasi-uniform flow of bulk product, and the performance is the degree of operating relative to the nominal production rate or speed. The quality understood as the grade of the ore is substituted by other parameters that describe the net value of the product flow or production speed. Based on that idea, Samanta and Banerjee [27] proposed an adaptation of the OEE as a function of availability (A), production efficiency (P), and utilization (U) for mining equipment. Dhillon [24] proposed that OEE is a function of availability, utilization, and production index as the following equation:
OEE = A × U × P
These terms may be better understood by observing the Figure 2.
There is clear evidence that OEE applications in industry vary from one to another. Although the basis for the measurement is derived from the OEE proposed by Nakajima [1], its use has been adapted to serve specific industrial sectors. Because of that, the term OEE has been modified for other different terms: for example, overall factory effectiveness (OFE) [7], overall plant effectiveness (OPE) [8], overall throughput effectiveness (OTE) [4], production equipment effectiveness (PEE) [6], overall asset effectiveness (OAE) [8], and total equipment effectiveness performance (TEEP) [9]. Nevertheless, despite its wide use and success, OEE does not provide a global vision at the production system level, nor lessen the impact of specific equipment on overall performance.
So far, few articles have attempted to integrate aspects related to sustainability and the factors of availability, productivity, and quality considered in the conventional OEE. Aguado et al. [30] presented a model for evaluating improvements in terms of efficiency and sustainability. This model was applied successfully in an actual production system. However, according to their own authors, the results are not related to the OEE and do not differentiate the improvements obtained due to increases in sustainability in each workstation of the manufacturing process.
More recently, Domingo and Aguado [13] proposed the Overall Environmental Equipment Effectiveness (OEEE); however, this index presents the same limitations as the original OEE, that is, considering efficiency at the equipment level does not allow for evaluation at the production system level.
This proposal is based on the work carried out by Domingo and Aguado [13]. They proposed a novel indicator, OEEE, that incorporates the well-known factors of traditional OEE (Availability, Productivity, and Quality), as well as the environmental factor. However, it is worth noting that OEEE is about measuring excellence in individual equipment and its impact on the overall system. However, this is done without taking into consideration the relationships among different machines and processes.
Here, a new metric based on the Overall Throughput Effectiveness (OTE) [5] is proposed: the Sustainable Overall Throughput Effectiveness (S.O.T.E.). This indicator allows us to determine which equipment, within a production system, causes a greater effect on the Overall Sustainable Throughput. With this indicator, the effects of the individual factors, on the overall results, availability, performance, quality, and sustainability can be traced throughout the production system.
3. Overall Throughput Effectiveness
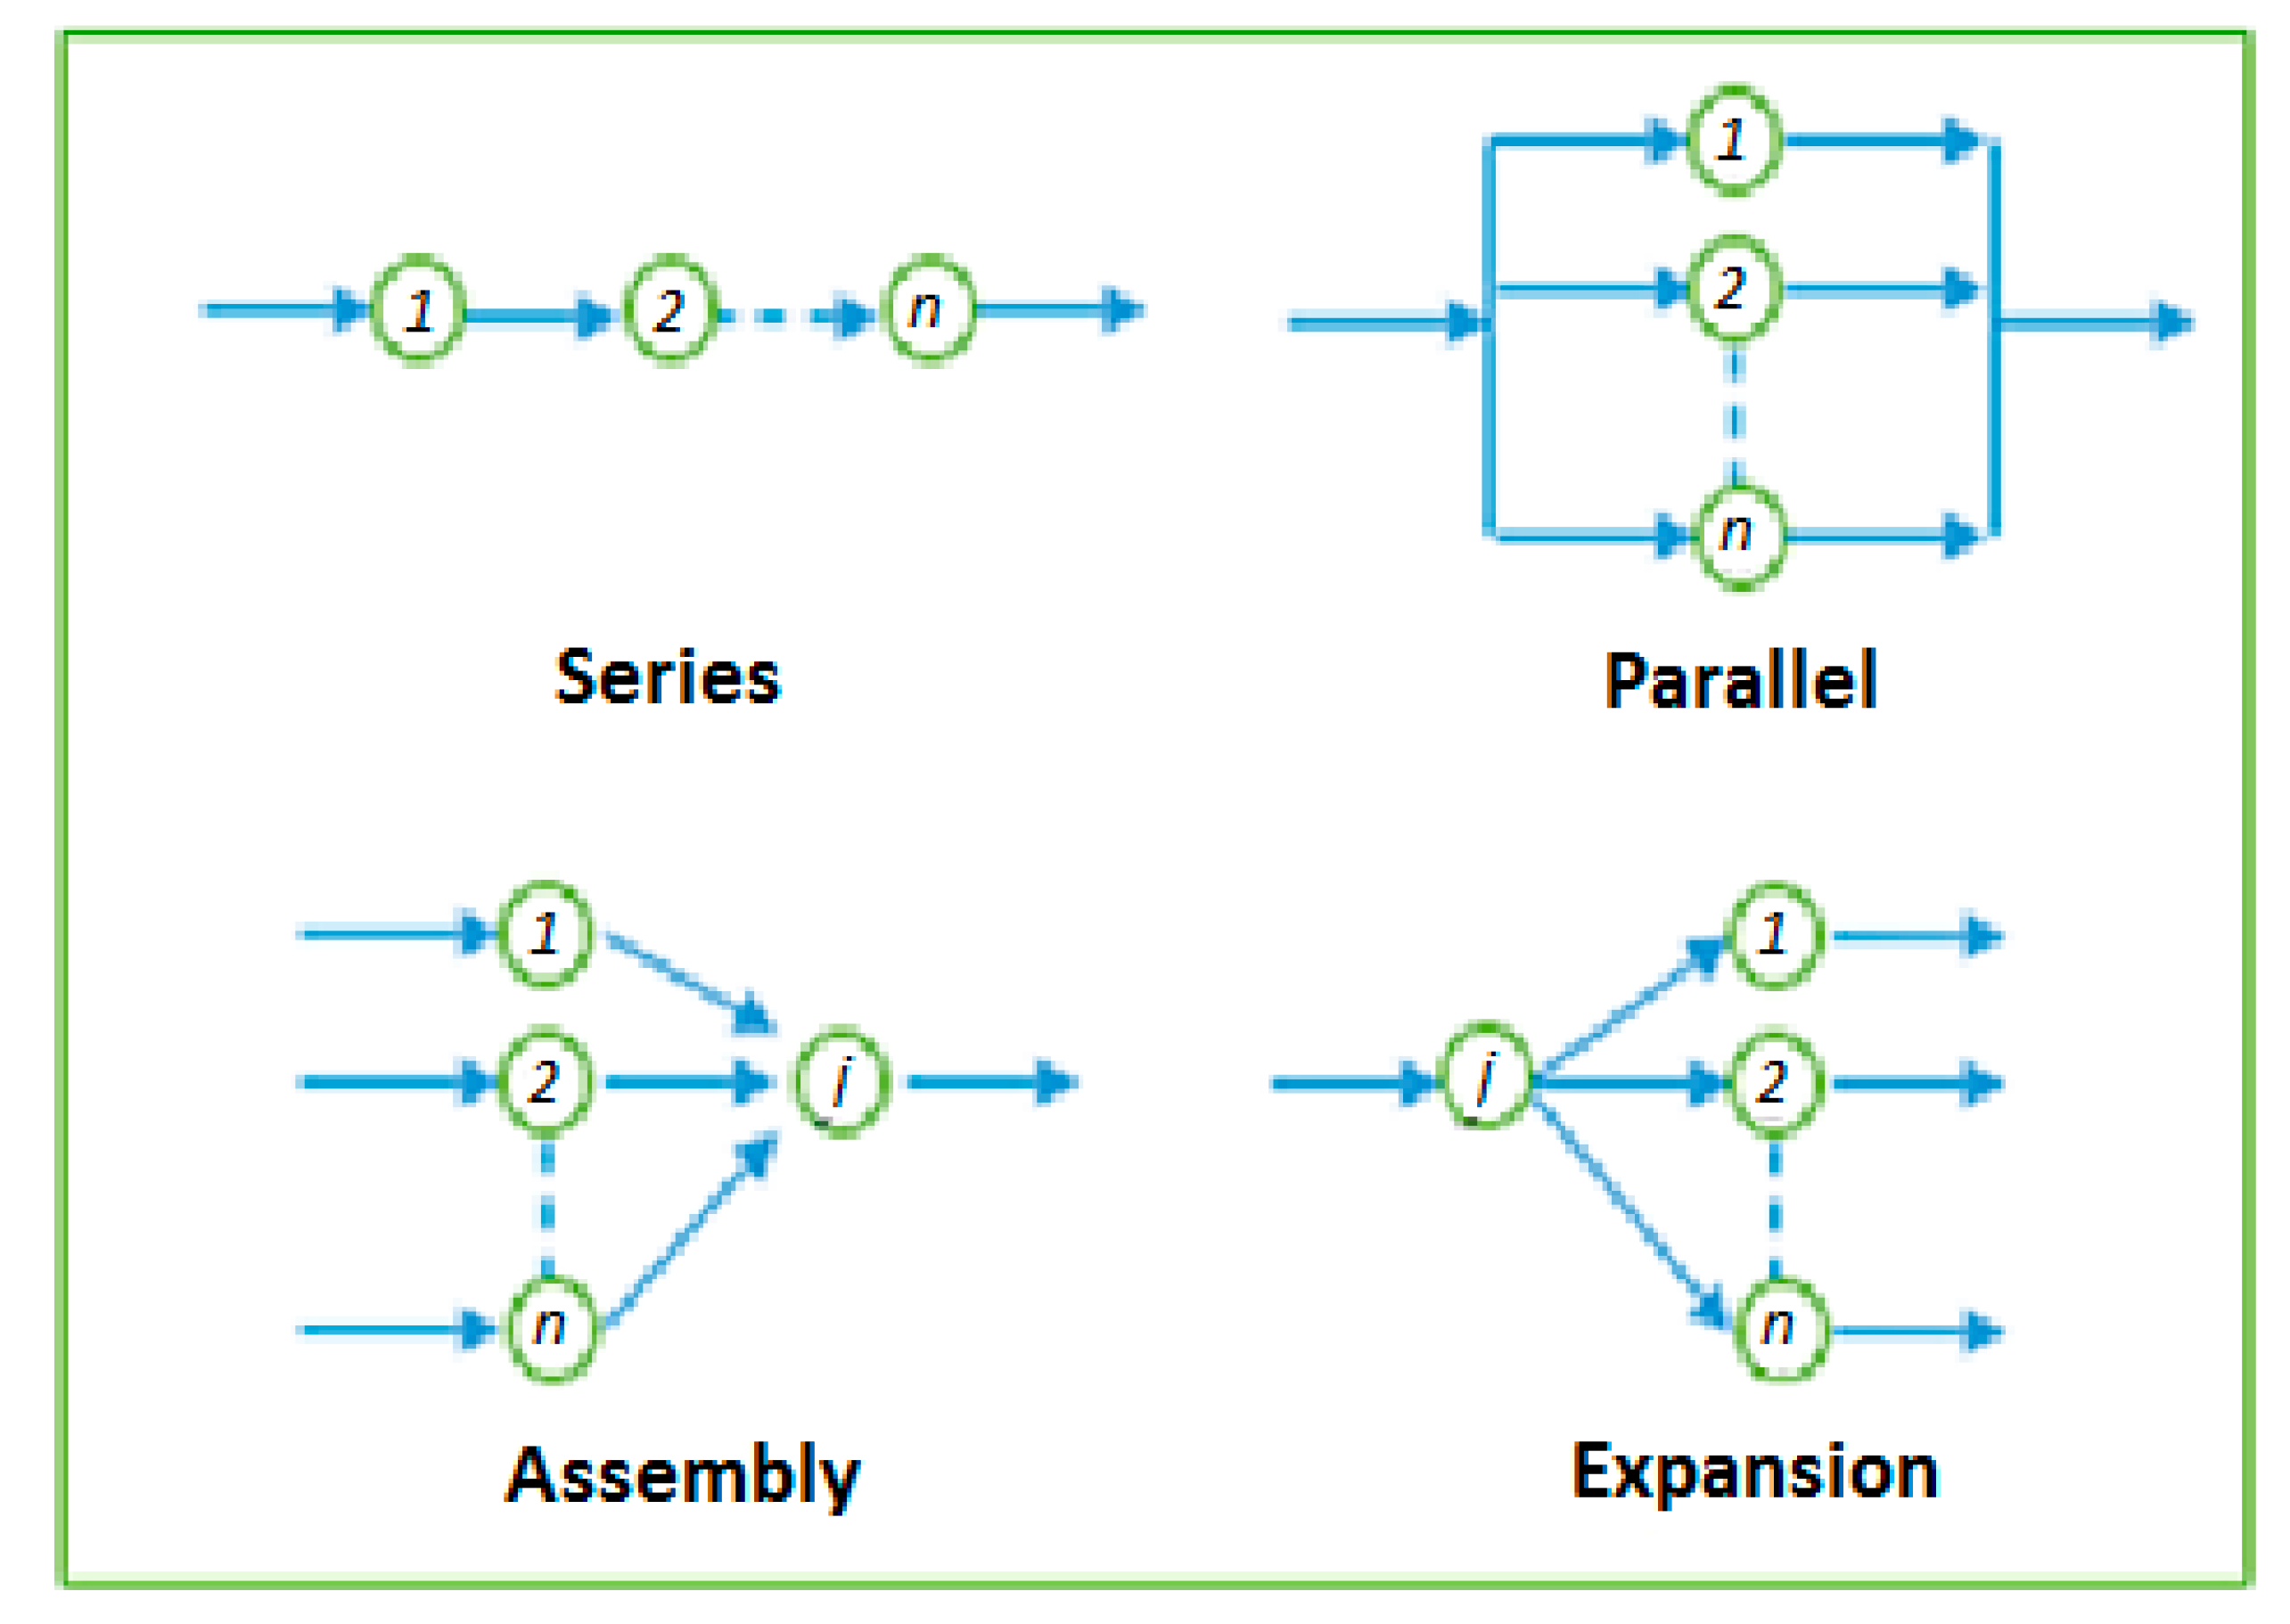
To address the OEE limitation mentioned above, and considering that most production systems have different configurations among their equipment, e.g., serial and parallel equipment, Overall Throughput Efficiency (OTE) was developed by Muthiah et al. [31]. This metric considers the various configurations present in production systems, including series, parallel, assembly, and expansion (Figure 3). The goal of OTE is twofold: factory-based performance measurement based on OEE, and performing diagnostic actions (also at the factory level) such as bottleneck detection and hidden capacity identification.
Taking into account that the OEE in Equation (1) can be expressed in a simplified way as:
To further define, in a simplified way, the OTE, the above definition must be extended at the factory level as follows:
To calculate the OTE, it was necessary to define a set of equations for each of the configurations already mentioned. The idea is the following. For example, if a part needs to be processed by equipment A, before being processed by equipment B (A and B are connected in series), then the quantity produced by equipment B will be limited by the units produced by equipment A and that meet the required quality standards.
Assuming that the equipment i processes n different products, let Qeff(ij) and Rth(ij) be the quality efficiency and the theoretical processing rate of the equipment i when processing the product j (j = 1, 2, ..., n), respectively. Let X(ij) be the percentage of the mixture of product j in equipment i. kA(i) is the number of parts needed from the ith equipment to make one final product in the assembly equipment, kE(i) is the number of parts proceeding the ith equipment produced from one part in the expansion equipment, and Qeff(i) and Rth(i) for multiple products can be calculated as follows:
where:
4. Sustainable Overall Throughput Effectiveness
As proposed by Domingo and Aguado [13], the new metric Overall Environmental Equipment Effectiveness (OEEE) is based on the OEE. The OEEE is the result of a set of indicators used to represent the capacity of a workstation, taking into account its availability, performance, quality, and sustainability (See Equation (10)):
where
OEEE = OEE × Sustainability
To allow the evaluation of the effectiveness at the production system level and of the impact of each one of the equipment’s operational parameters (including sustainability), we propose the substitution of the OEE, in each one of the models proposed by Muthiah and Huang [5], with the OEEE metric, proposed by Domingo and Aguado [13] (Equation (4)). This will allow us to incorporate sustainability aspects into the overall throughput, and its effectiveness, through a new indicator, is called S.O.T.E., sustainable overall throughput effectiveness. In the following we show the S.O.T.E. equations for each one of the subsystem configurations.
Note that, as in the case of OEEE, sustainability is expressed in relation to the time of analysis, that is, initial or final. This makes it possible to use various sustainability metrics and in different units of measurement. To demonstrate the applicability and utility of the proposed index in the next section, we present a case study based on a real crushing plant located in the Chilean Andes.
5. Case Study
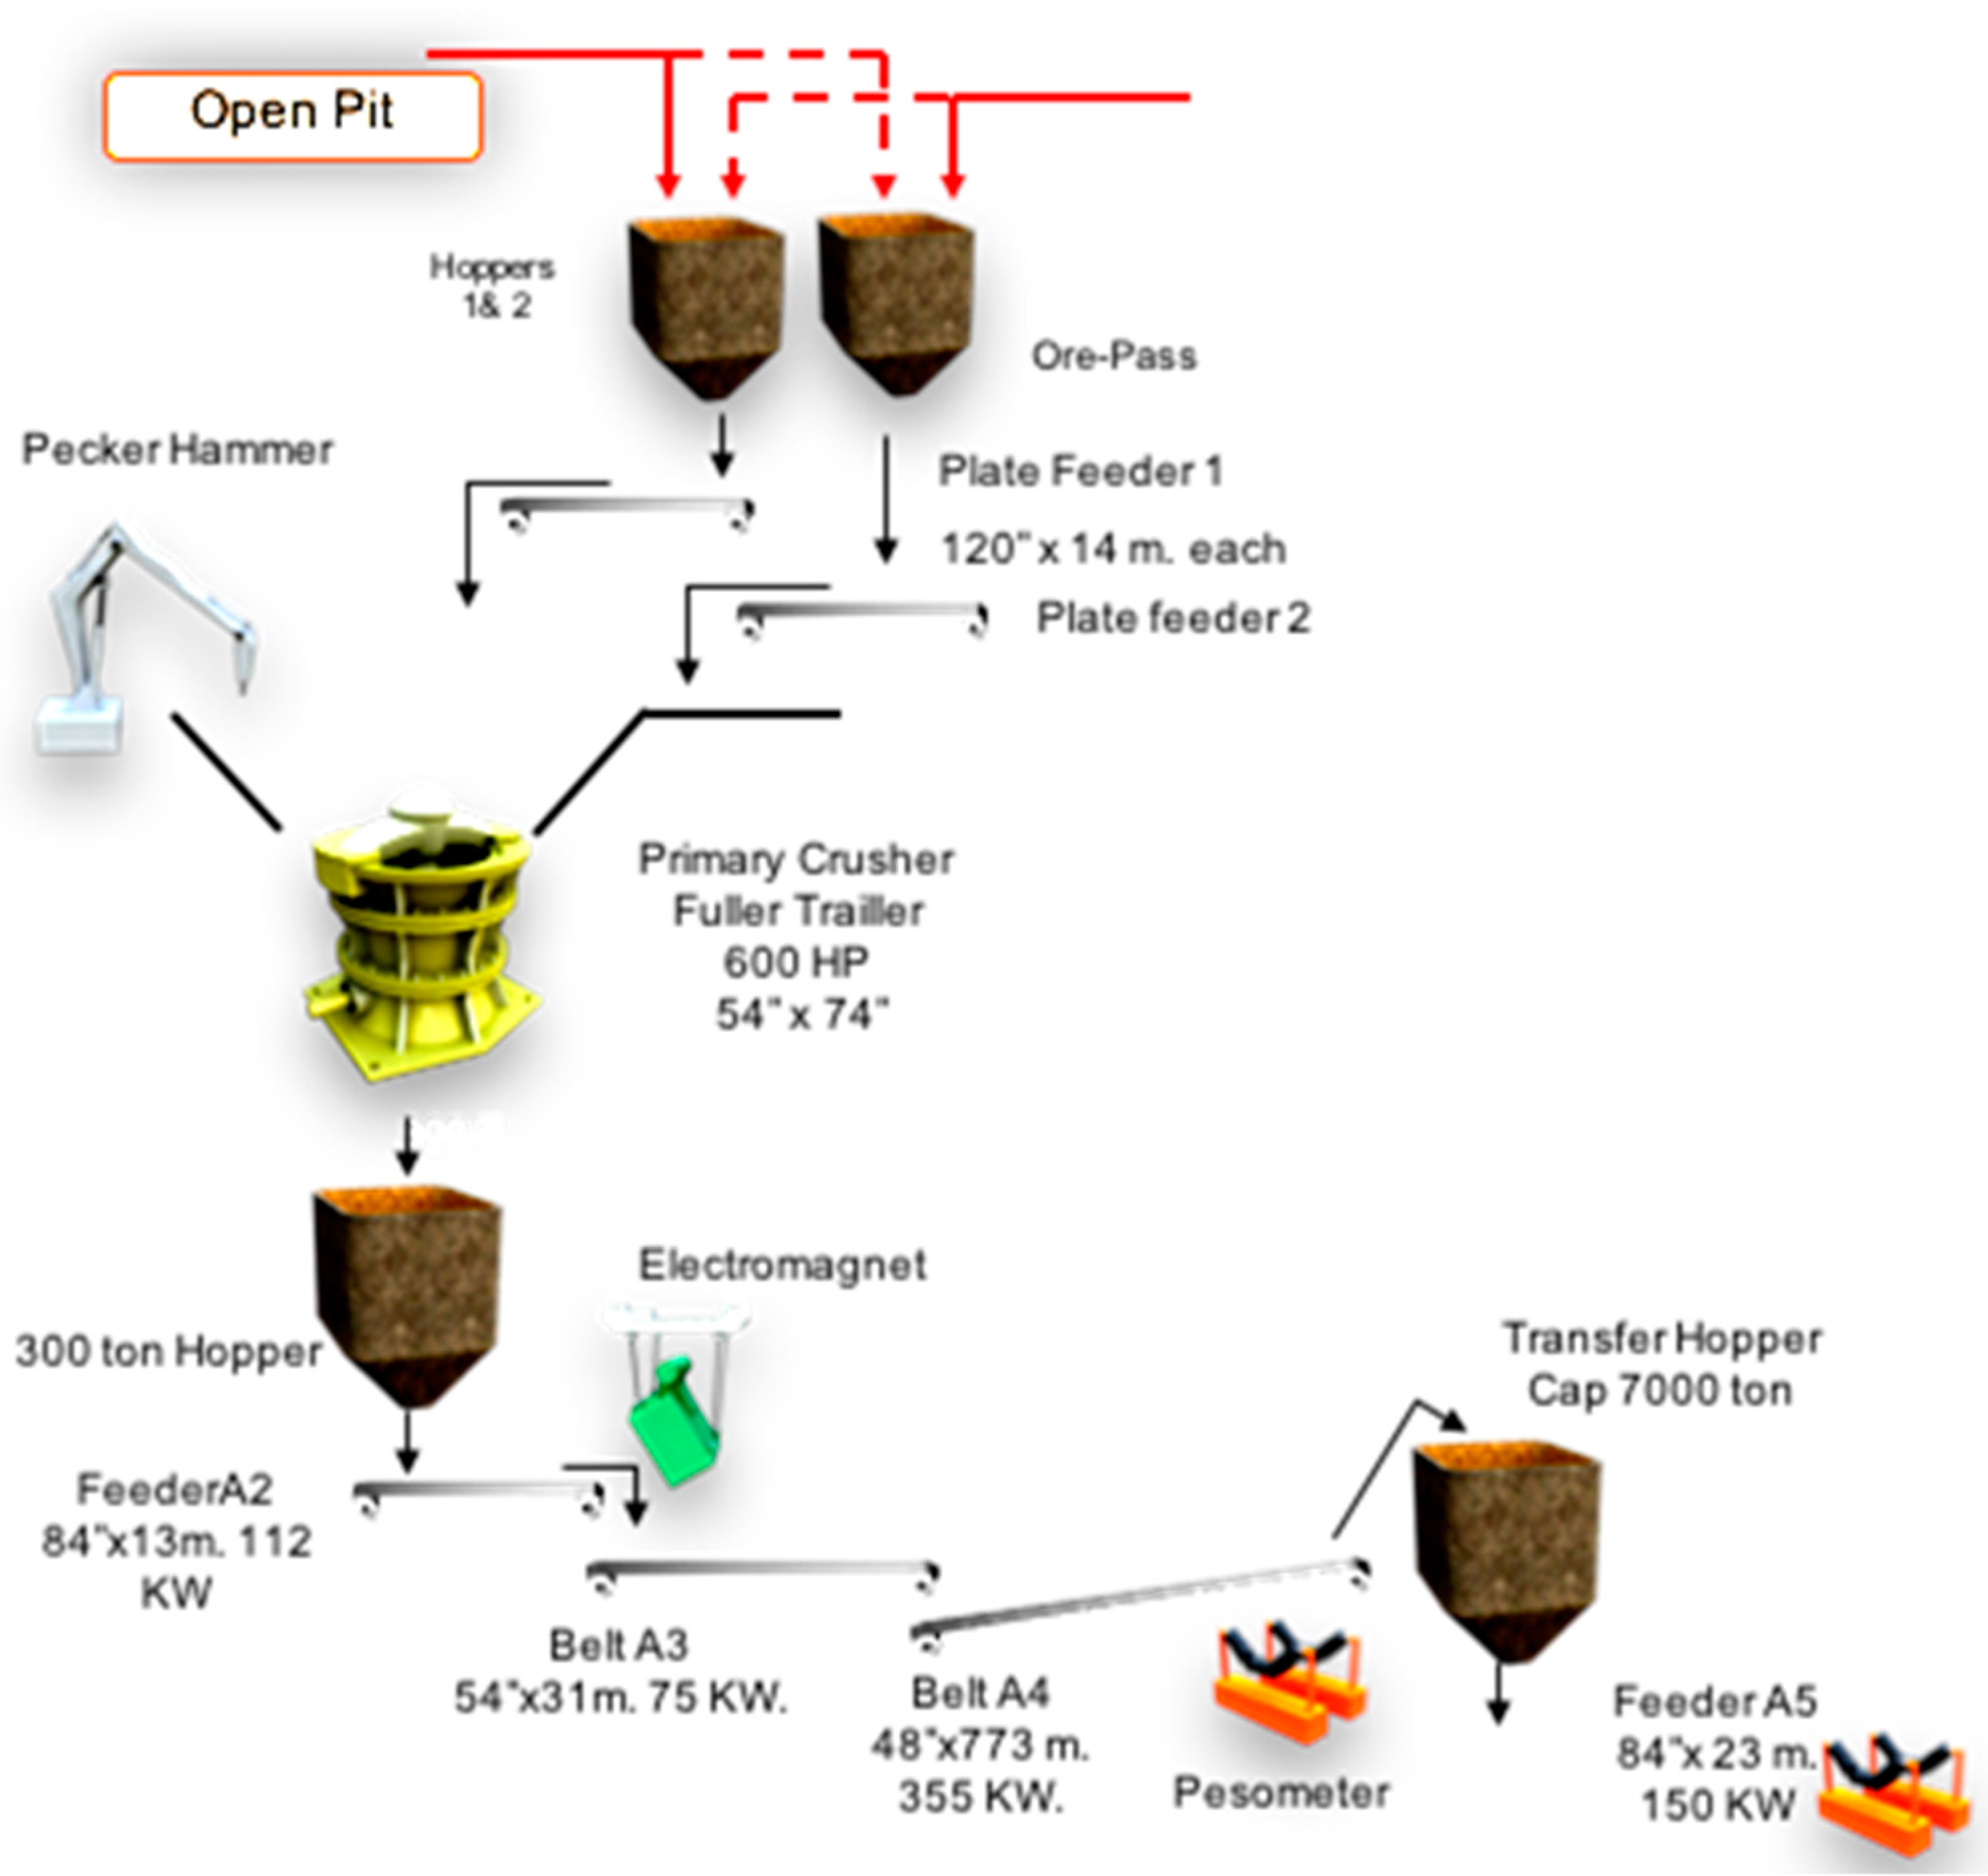
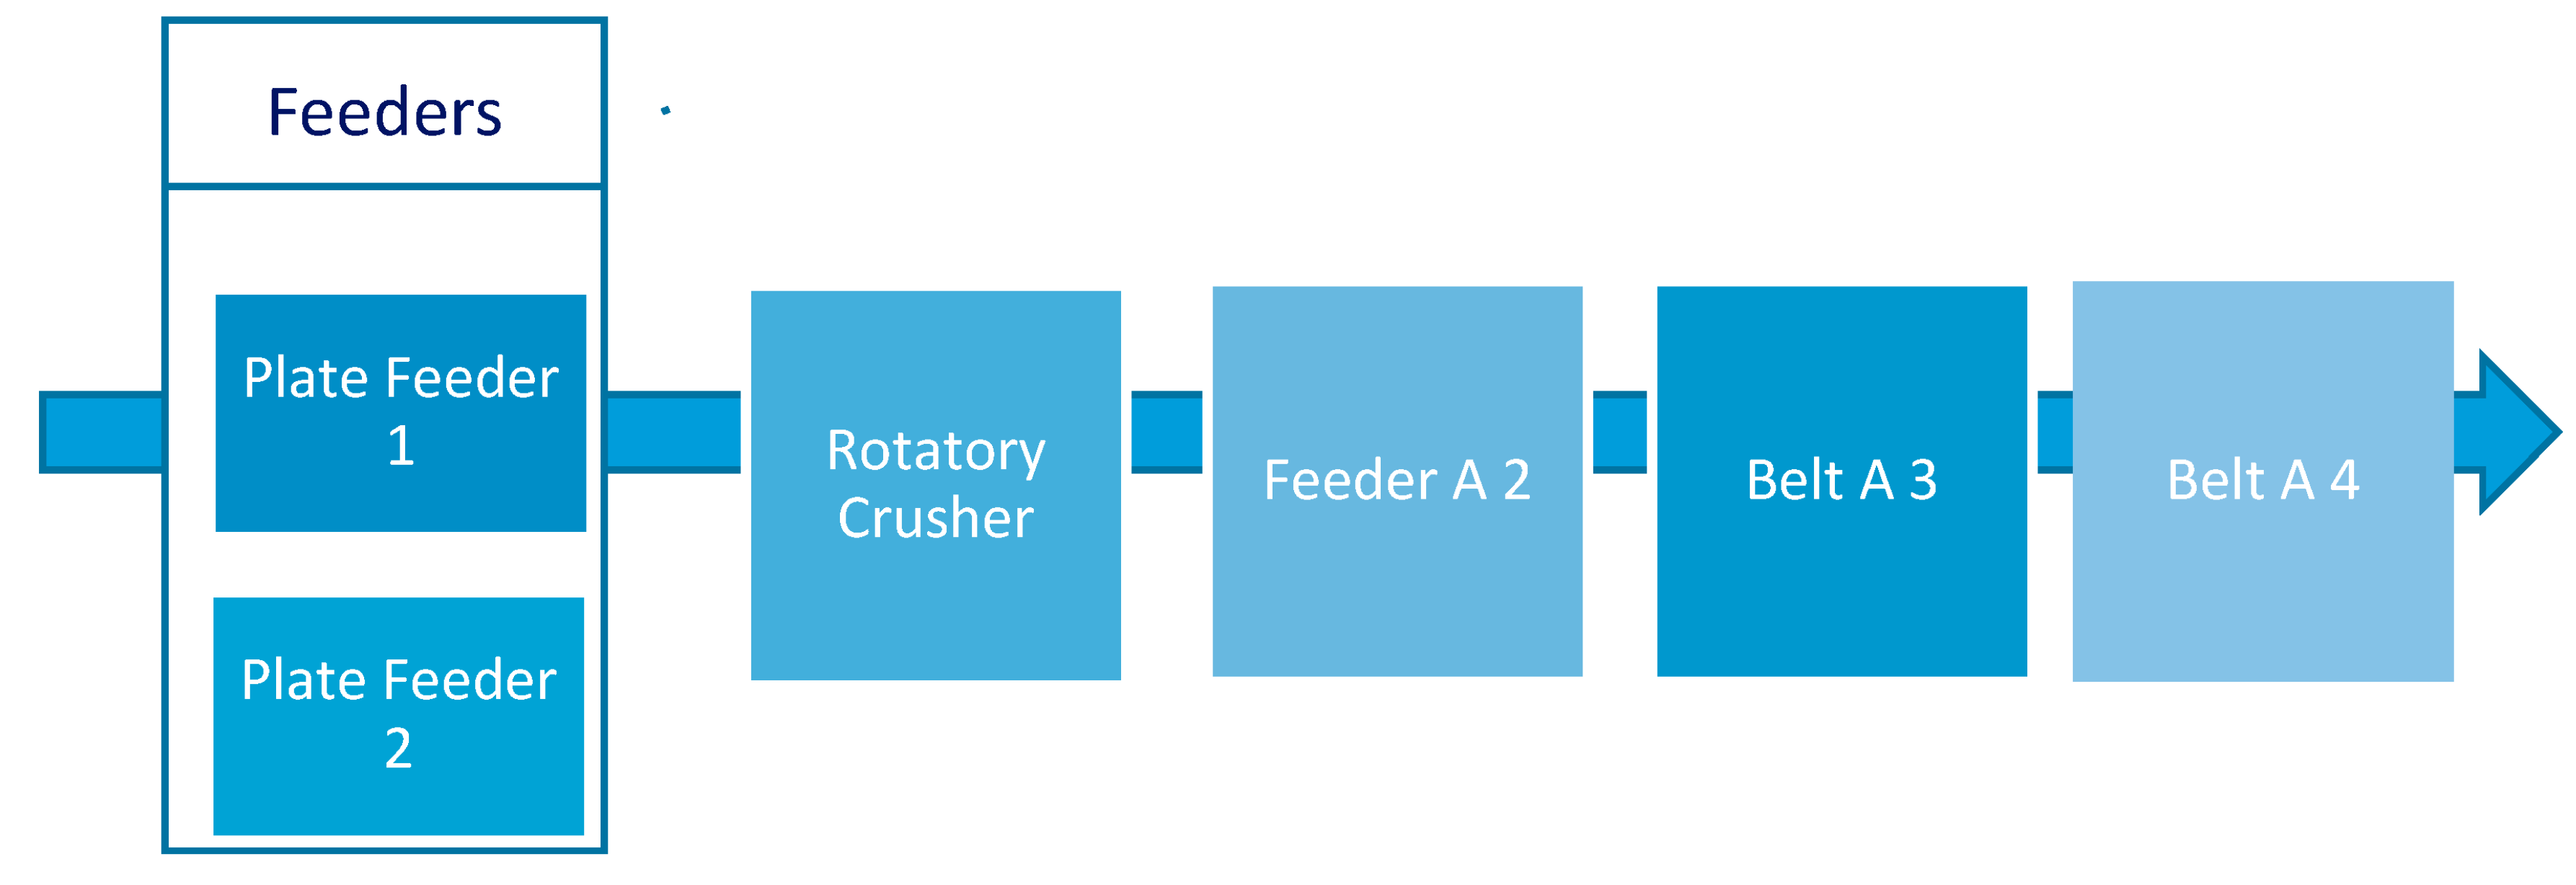
To demonstrate the use of the proposed indicator and validate its usefulness, in the following paragraphs we describe a case study based on a crushing plant destined to process copper ore in a Chilean open-pit mine. This plant is located in the central area of the country at about 3000 m above sea level. In this plant, the first reduction in the size of the material coming from the mine takes place. This plant has a nominal capacity of more than 4000 t/h. Figure 4 shows schematically the configuration and the main equipment used in the plant.
With respect to the configuration of the mentioned equipment, Figure 5 shows how they are interrelated. In this figure, it is possible to see that the feeders work in parallel, forming a line with the rest of the equipment. Some of the equipment that appears in Figure 4 is considered as a part of the major equipment, so it was obviated in Figure 4 and in the model.
As the indicator can have its greatest utility in comparative terms, we present in the following tables the measurements made over 6 consecutive months. Table 1 presents the Availability levels of each team during the analysis period. Table 2 presents the levels of Effective Utilization of each piece of equipment during the same period. In the same way, Table 3 shows the Productivity Performance of each team during the months considered. Table 4 shows the values of the OEE calculated for each piece of equipment in each of the six months, together with the average values during those same six months for each of those pieces of equipment that make up the plant.
To incorporate the aspect of sustainability into the OEE index, and based on the OEEE index, data related to environmental performance in the various stages of the process must be incorporated into the OEE calculation. This work proposes adding a fourth factor to the analysis; this considers the environmental performance in terms of Particulate Matter, PM10, in the vicinity of each piece of equipment in the crushing line. Since, at present, these measurements are not available in the plant under study, and for purely illustrative purposes, we have used as a reference data from measurements made in a similar plant of the same company but from another mine in the same country. The aforementioned plant uses as acceptance limits for particulate material measurements those shown in Table 5.
Table 6 shows the data referring to PM10 measurements during the analysis period. Table 7 presents the calculations of the sustainability indexes for the case under study.
Table 8 shows the OEEE values calculated for each team during the period under analysis.
Subsequently, the OTE and S.O.T.E. values were calculated for each month of the period under analysis. Table 9 shows these values.
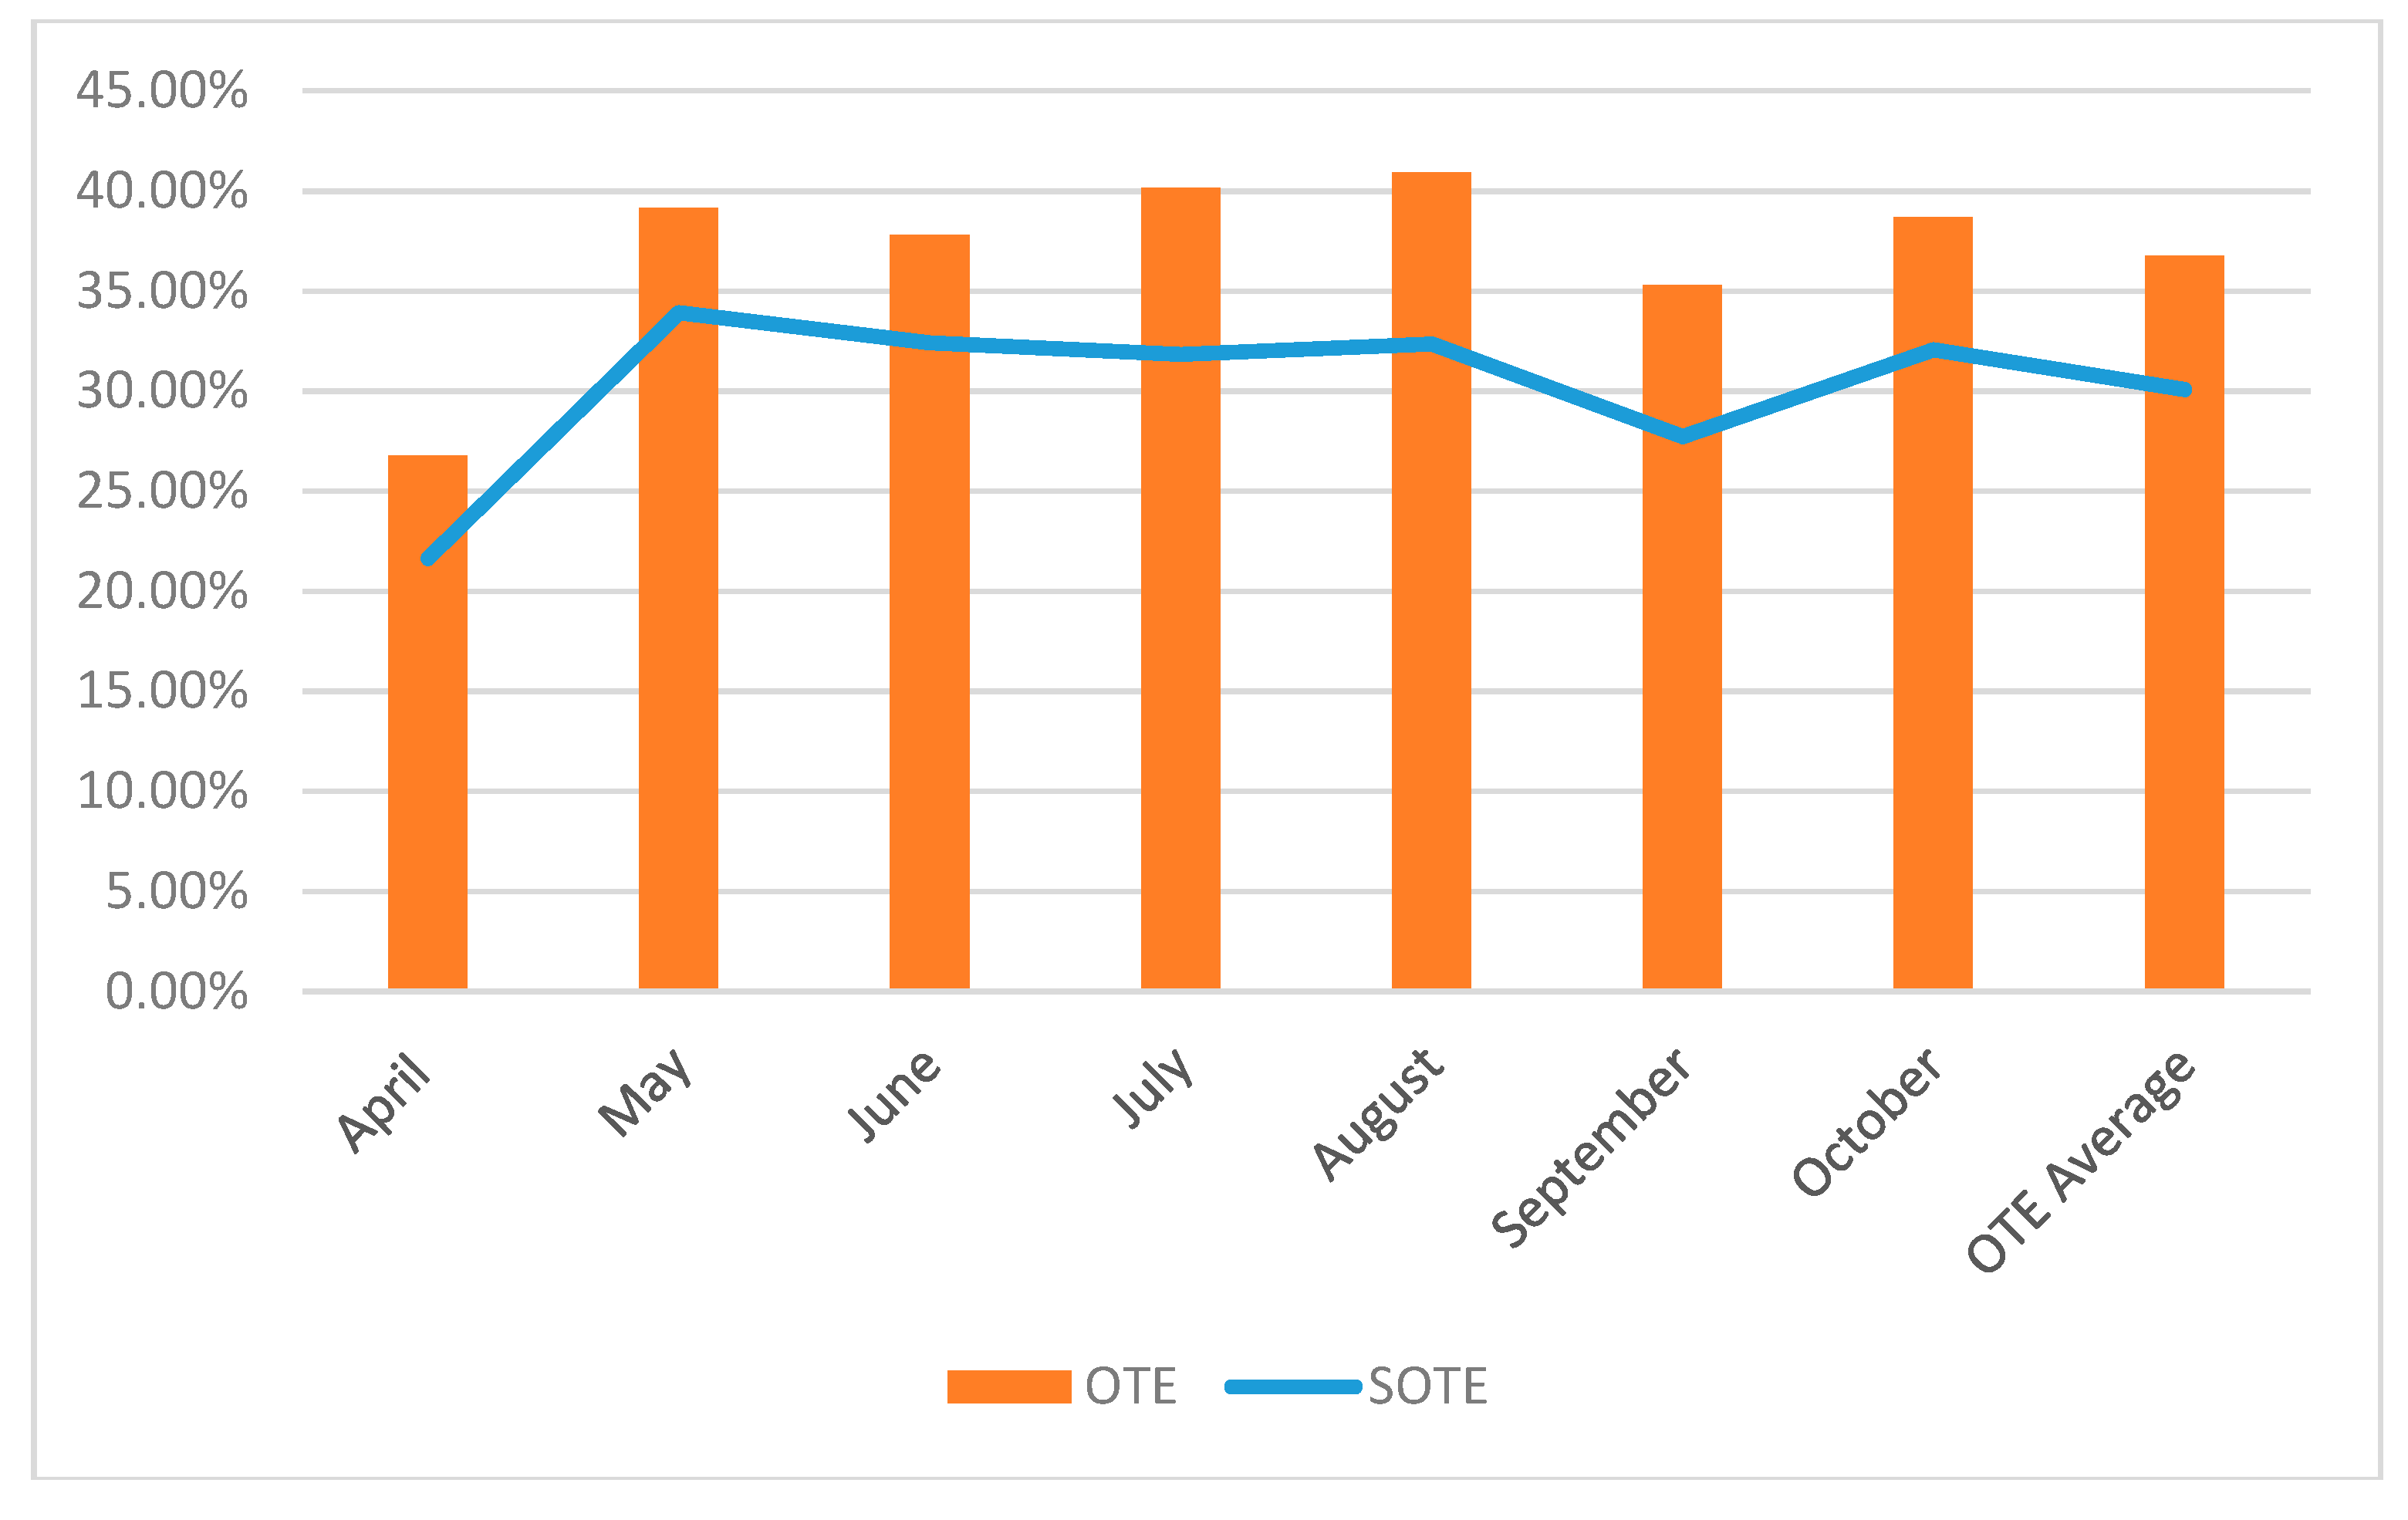
Figure 6 shows the OTE and S.O.T.E. behaviours for each of the six months and for the average monthly values.
A quick analysis of the graph shown in Figure 6 allows us to observe that the behaviour of the OTE does not necessarily show the same tendency as that shown by the behaviour of the S.O.T.E. It is worth analysing this situation. Consider the months of June and July, for example; in those months, the OTE shows an increase in its value, from 37.8% to 40.15%. However, S.O.T.E. in those same months has fallen, from 32.4% to 31.83%. This could be interpreted as that in those months there was an increase in the productive efficiency of the system (Throughput) despite a worsening of its environmental performance. This type of scenario is not the most desired in today’s days. On the other hand, between April and May, or between September and October, there is an improvement in throughput accompanied by environmental improvements. This analysis is based on two different data samples (from similar mines, but with some way different equipment) and therefore some conclusions are partly speculative, and obtained results can be used for purely illustrative purposes as presentation of the proposed methodology.
On the other hand, when analysing the data calculated from the OEEE for each piece of equipment in July and August, it is observed that there was an improvement in all of them. However, the value of S.O.T.E. for those same months was unchanged. This confirms that environmental improvements in individual equipment do not necessarily impact in the same way at the plant level. In the same way, according to Ylipää et al. [4], not every variation in equipment effectiveness may cause the same effects on the system’s throughput. This brings us to the second part of this study: how we will be able to know, through a sensitivity analysis, the impact that the individual environmental performances cause at the plant or system level.
5.1. Analysis of Results and Sensitivity Study
Beyond the comparative purposes over time that the proposed indicator may have, it can also be used to measure the influence that each team can have in global terms. That is, through a sensitivity study it can be known how the Availability, Utilization, Productivity, and Sustainability levels affect the sustainable througputability of a plant or production line.
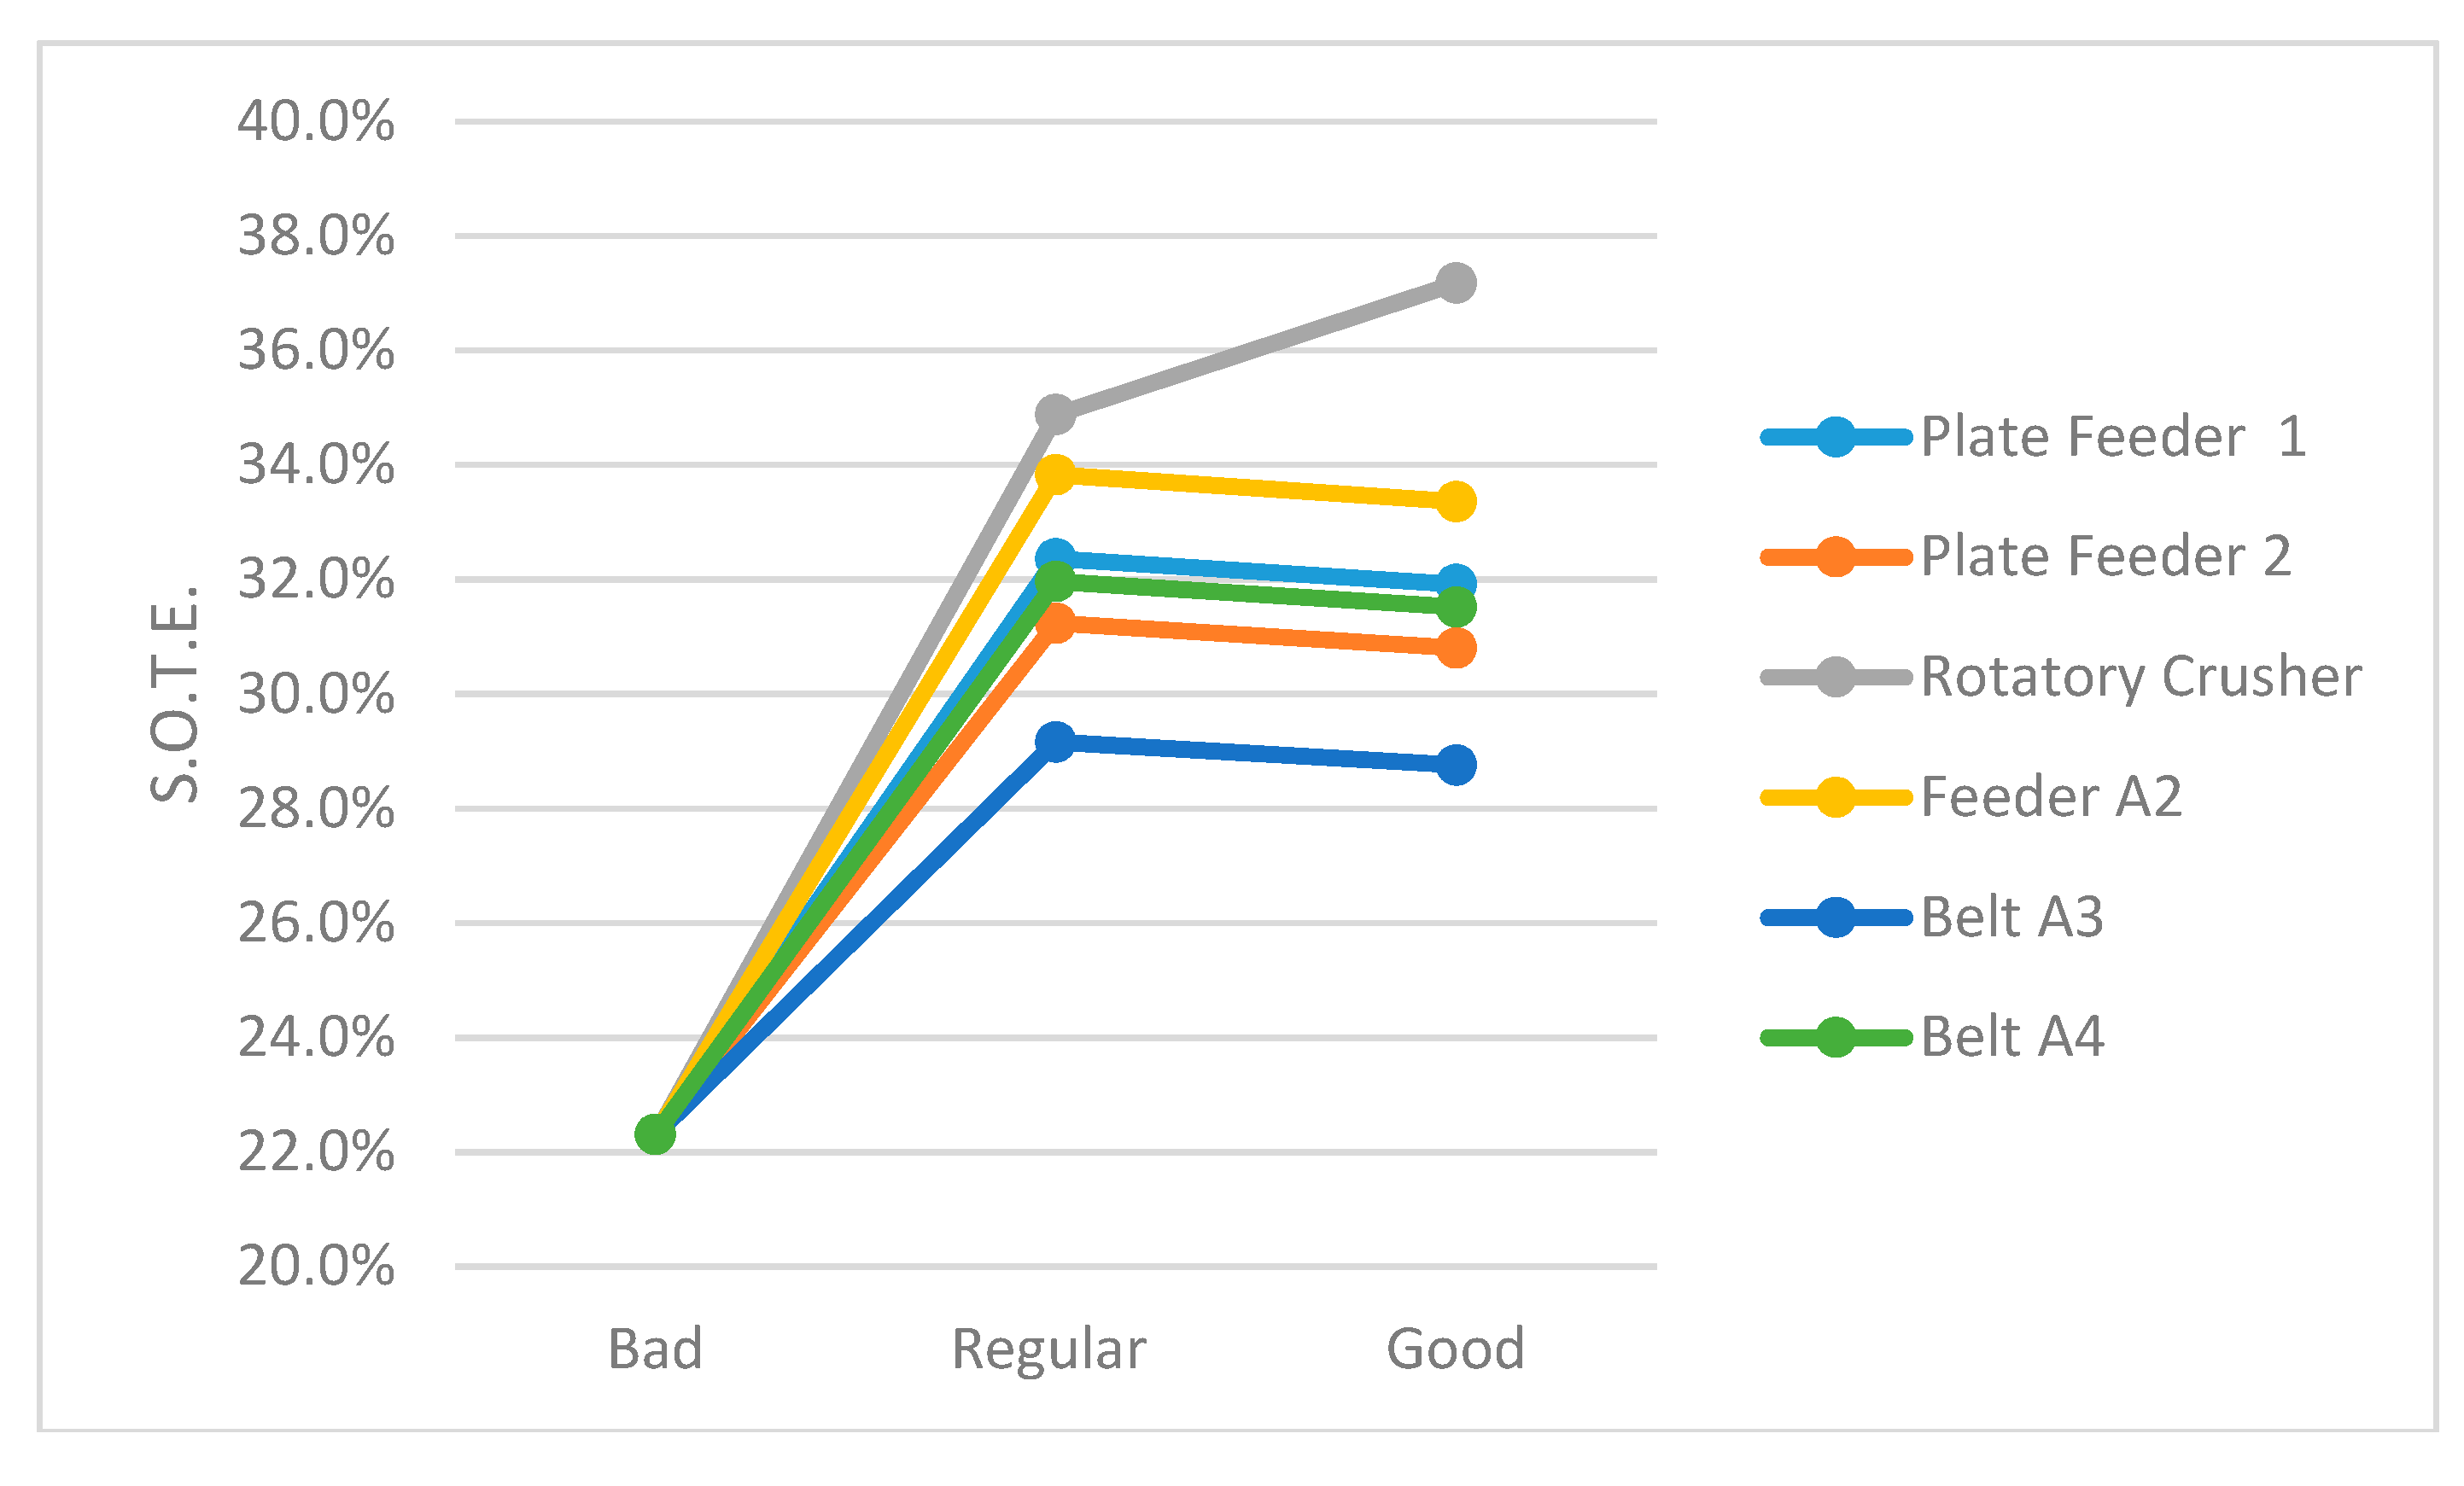
To carry out this study, as already mentioned, we used the limits of acceptance that the company uses for its own analyses (Table 7). Three basic scenarios were created: one bad, one regular, and one good. In each of them, the starting point is given by the hypothetical situation in which all equipments show, simultaneously, bad performances. From those scenarios, the environmental performance of each of the pieces of equipment was individually modified, one by one, to analyse the influence and behaviour of S.O.T.E. Table 10 shows the S.O.T.E. values obtained from the simulations.
Figure 7 shows the variation of S.O.T.E. according to the variations of the PM10 index of each of the pieces of equipment from a Bad level (base situation) to the Regular and Good levels, respectively. It is clearly seen that the variation of the environmental performance of the Rotary Crusher generates a greater effect in the S.O.T.E. That is, by improving the environmental performance of each piece of equipment separately, the one that generate the greatest improvement globally are the rotating crusher, followed by the A2 Feeder.
Finally, based on the sensitivity study, it is possible to define a priority list among all the existent pieces of equipment. This prioritization list is based on the influence that each piece of equipment has on the S.O.T.E. index at the production system level. The Sensitivity Index is calculated through the following Equation (6):
in which Dmin and Dmax correspond to the minimum and maximum values of the dependent variable, respectively. In this case, that variable is the S.O.T.E. that is influenced by the behaviour of the environmental performances of each of the pieces of the equipment. Table 11 shows the sensitivity indicators for each piece of the equipment, depending on the variation of the PM10 indicators.
S.I. = (Dmax − Dmin)/Dmax
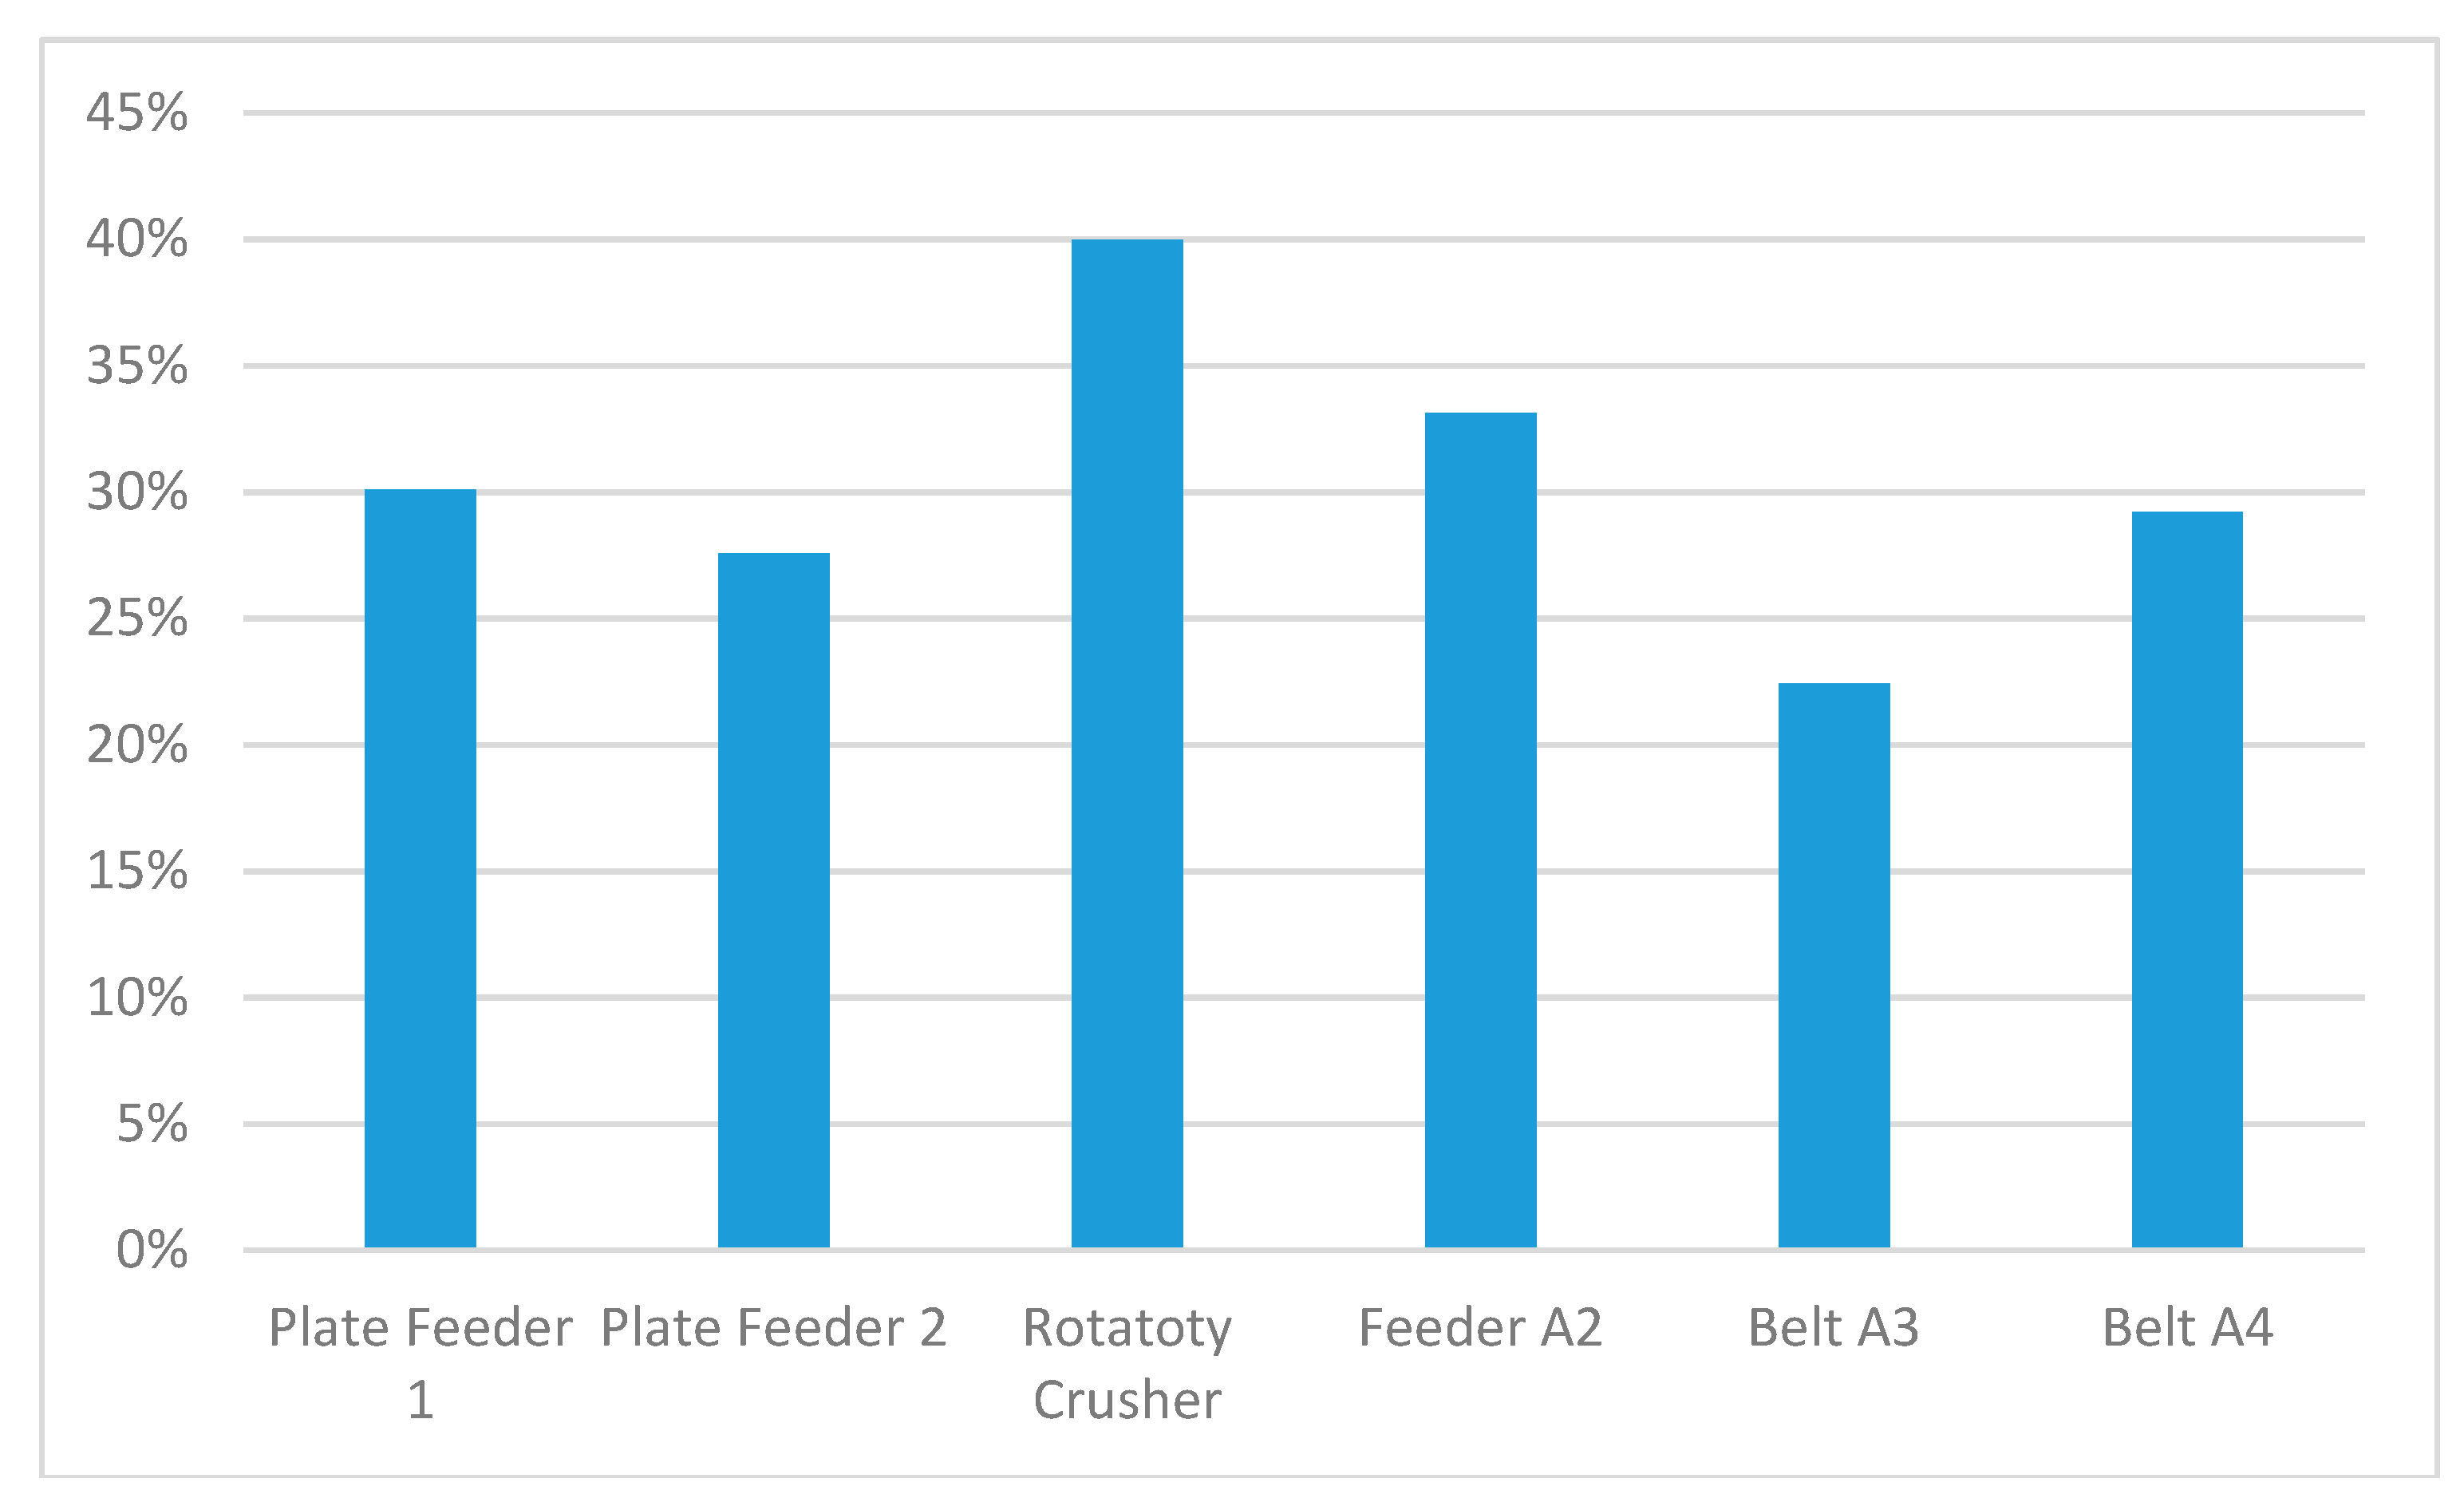
Figure 8 shows the behaviour of S.I. of each piece of the equipment. The highest numbers are related to the equipment that has a higher index and, therefore, their environmental performance variations generate a greater impact on the global indicator. Therefore, the pieces of equipment that show highest sensitivity can be considered more critical than the pieces of equipment that generate a lower impact.
In Figure 8 it can be seen that the environmental performance of the rotary crusher is the equipment that exerts a greater influence on the S.O.T.E. indicator. In second place is the A2 Feeder.
5.2. Future Developments: S.O.T.E. and LCA
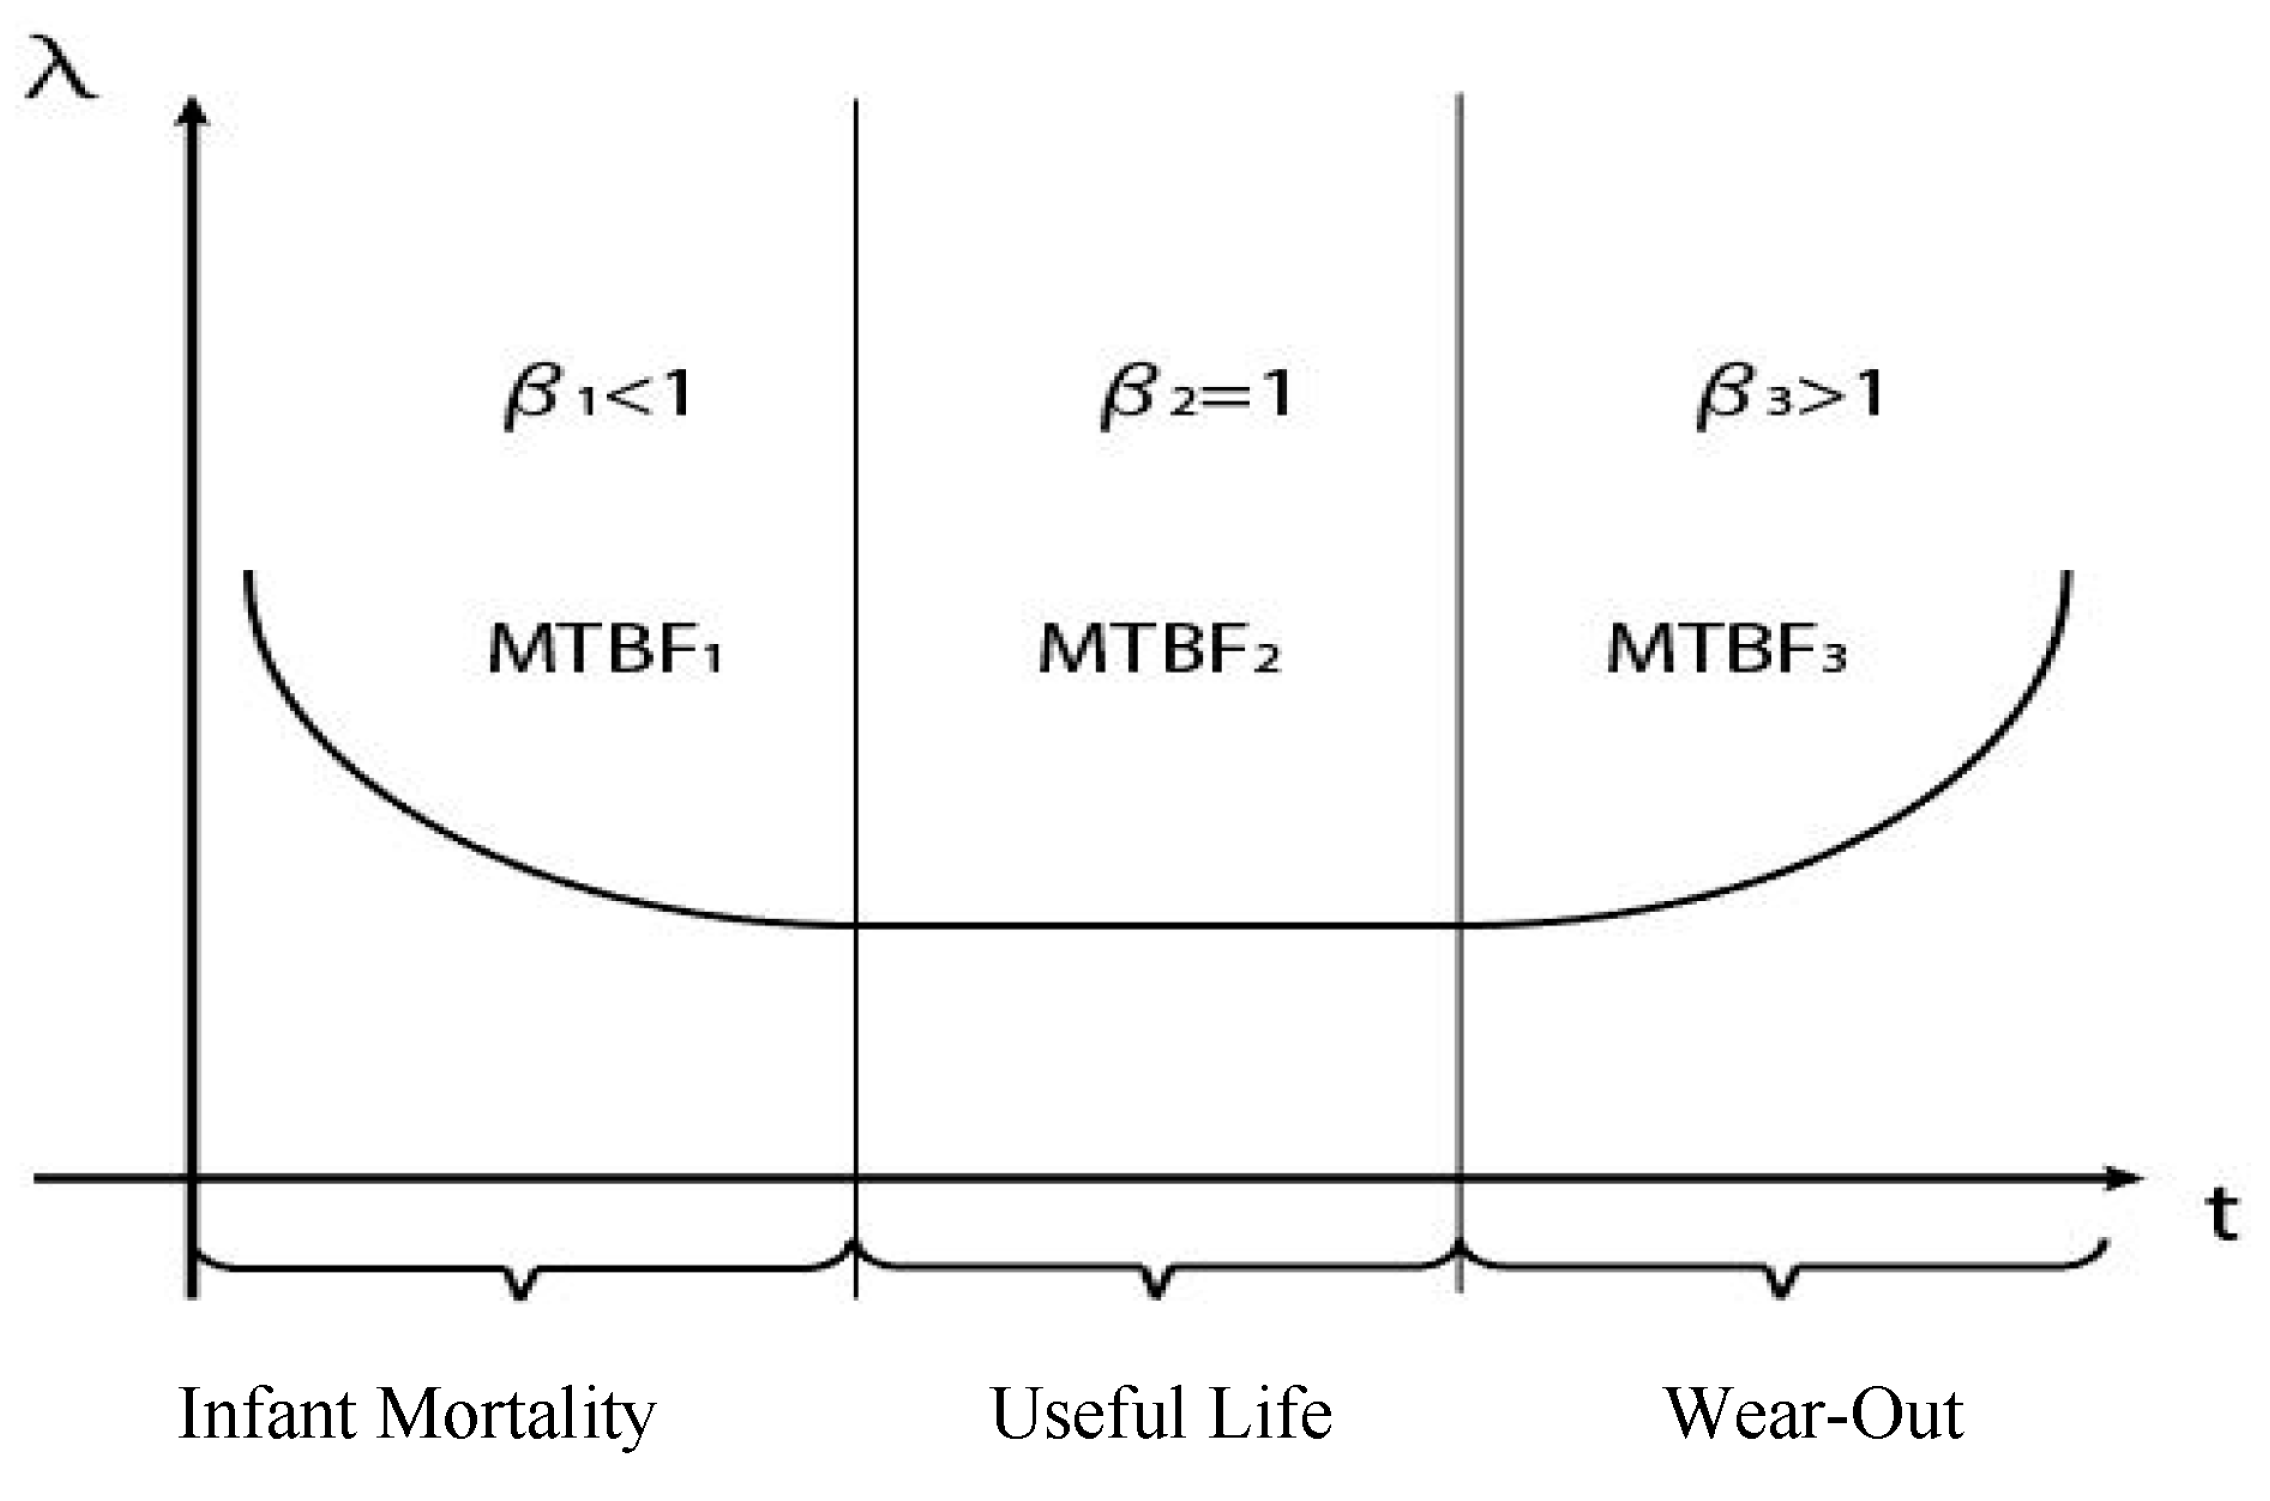
This section describes how the S.O.T.E. indicator can be used as a tool for life cycle analysis (LCA). One of the most used representations of the life cycle of a physical asset is the bathtub curve (Figure 9). Through that curve, the behaviour of the failure rate of the most physical assets can be appreciated over time. During their lives, most of the physical assets show three phases or failure rate patterns. The first is an initial phase that is characterized by a high but rapidly decreasing failure rate (λ). This region is known as the Early Failure Period (also referred to as Infant Mortality Period). The second phase usually shows a constant failure rate; in this phase, the equipment presents random failures. In the final part of the life cycle, the wear mechanisms cause the fault pattern to begin to increase, constituting the so-called Wear-Out phase.
For any physical asset, the different phases of its life cycle result in different failure rates (λ), generating different effects in the reliability, and therefore in the availability, of the equipment, also affecting indicators such as OEE, OTE, and S.O.T.E. One of the statistical models most used to represent the behaviour of the reliability of components and equipment is based on the Weibull distribution. By estimating the future behavior of reliability and maintainability, it will be possible to predict the future behavior of availability, and therefore projections will be made of how this will affect the future behavior of S.O.T.E. [32,33].
It is more difficult to predict the future behaviour of the environmental performance. Several models have been proposed in the literature. Those models range from simple (average based models) [34,35,36,37,38,39,40] to very complex (Artificial Intelligence based tools such as deep learning-based techniques).
Once the projections of the operational and environmental indexes have been obtained, it was possible to draw a development profile for the system and project its future. With this, it will be possible to have an estimate of the future behaviour of the S.O.T.E. along with the possibility of defining possible scenarios. Thus, a new tool is available to guide decisions at a system level that allows specification of measures or strategies in the fields of productivity, maintenance, and environmental mitigation.
6. Conclusions
In this paper, a new indicator is proposed. Such an indicator allows a system-level assessment of the environmental and operational efficiencies jointly. The indicator called S.O.T.E. incorporates the traditional aspects of OEE together with an indicator of environmental performance based on indexes of Particulate Matter. As in the work of Domingo and Aguado [13], also here the compatibility of objectives between lean and Green Manufacturing can be seen. Through the continuous and consistent use of the proposed indicator, the environmental aspect can be integrated into decisions at a business level. A case study based on a real comminution plant located in the central Andes of Chile is presented as validation. Finally, as it is commented on and explained at the end of this paper, this indicator can be used in system life cycle assessments. The consistent use of the S.O.T.E. indicator will allow companies to include sustainability as a criterion in business decision-making.
Acknowledgments
This research was supported by a NATIONAL RESEARCH FUNDING COMPETITION FONDECYT Regular 2017 No. 1170915 Design and Optimization of a Life Cycle based Critical Spare Parts Management System.
Author Contributions
Orlando Durán designed the research; Andrea Capaldo and Paulo Andrés Duran Acevedo wrote or contributed to the writing and editing of the manuscript.
Conflicts of Interest
The authors declare no conflict of interest.
References
- Nakajima, S. Introduction to TPM: Total Productive Management; Productivity Press: Portland, OR, USA, 1988. [Google Scholar]
- Hansen, R. Overall Equipment Effectiveness: A Powerful Production/Maintenance Tool for Increased Profits; Industrial Press: New York, NY, USA, 2002. [Google Scholar]
- Gola, A.; Nieoczym, A. Application of OEE Coefficient for Manufacturing Lines Reliability Improvement. In Proceedings of the 4th International Conference on Management Science and Management Innovation (MSMI 2017), Suzhou, China, 23–25 June 2017; Volume 31. [Google Scholar]
- Ylipää, T.; Skoogh, A.; Bokrantz, J.; Gopalakrishnan, M. Identification of maintenance improvement potential using OEE assessment. Int. J. Product. Perform. Manag. 2017, 66, 126–143. [Google Scholar] [CrossRef]
- Muthiah, K.M.N.; Huang, S.H. Overall throughput effectiveness (OTE) metric for factory-level performance monitoring and bottleneck detection. Int. J. Prod. Res. 2007, 45, 4753–4769. [Google Scholar] [CrossRef]
- Oechser, R.; Pfeffer, M.; Pftzner, L.; Binder, H.; Muller, E.; Vonderstrass, T. From Overall Equipment Effectiveness to Overall Fab Effectiveness (OFE). Mater. Sci. Semicond. Process. 2003, 5, 333–339. [Google Scholar] [CrossRef]
- Raouf, A. Improving capital productivity through maintenance. Int. J. Oper. Prod. Manag. 1994, 14, 44–52. [Google Scholar] [CrossRef]
- Ivancic, I. Development of maintenance in modern production. In Proceedings of the Euromaintenance’98, Dubrovnik, Croatia, 5–7 October 1998. [Google Scholar]
- Scott, D.; Pisa, R. Can Overall Factory Effectiveness Prolong Moore’s Law. Solid State Technol. 1998, 41, 75–81. [Google Scholar]
- Muchiri, P.; Pintelon, L. Performance measurement using overall equipment effectiveness (OEE): Literature review and practical application discussion. Int. J. Prod. Res. 2008, 46, 3517–3535. [Google Scholar] [CrossRef]
- Goedkoop, M.; Hofstetter, P.; Müller-Wenk, R.; Spriemsma, R. The Eco-indicator 98 explained. Int. J. Life Cycle Assess. 1998, 3, 352–360. [Google Scholar] [CrossRef]
- Ahlroth, S.; Finnveden, G. Ecovalue08-A new valuation set for environmental systems analysis tools. J. Clean. Prod. 2011, 19, 1994–2003. [Google Scholar] [CrossRef]
- Domingo, R.; Aguado, S. Overall environmental equipment effectiveness as a metric of a lean and green manufacturing system. Sustainability 2015, 7, 9031–9047. [Google Scholar] [CrossRef]
- Muthu, S.S.; Li, Y.; Hu, J.Y.; Mok, P.Y. Quantification of environmental impact and ecological sustainability for textile fibres. Ecol. Indic. 2012, 13, 66–74. [Google Scholar] [CrossRef]
- Paju, M.; Heilala, J.; Hentula, M.; Heikkilä, A.; Johansson, B.; Leong, S.; Lyons, K. Framework and indicators for a sustainable manufacturing mapping methodology. In Proceedings of the IEEE 2010 Winter Simulation Conference (WSC), Baltimore, MD, USA, 5–8 December 2010; pp. 3411–3422. [Google Scholar]
- Palme, U.; Tillman, A.M. Sustainable development indicators: How are they used in Swedish water utilities? J. Clean. Prod. 2008, 16, 1346–1357. [Google Scholar] [CrossRef]
- Particulate Matter (PM) Basics. Available online: https://www.epa.gov/pm-pollution/particulate-matter-pm-basics (accessed on 15 November 2017).
- Kavouras, I.G.; Koutrakis, P.; Cereceda-Balic, F.; Oyola, P. Source apportionment of PM10 and PM25 in five Chilean cities using factor analysis. J. Air Waste Manag. Assoc. 2001, 51, 451–464. [Google Scholar] [CrossRef] [PubMed]
- Mahmood, W.; Hasrulnizzam, W.; Abdullah, I.; Fauadi, M.; Fazli, M.H. Translating OEE Measure into Manufacturing Sustainability. Appl. Mech. Mater. 2015, 761, 555–559. [Google Scholar] [CrossRef]
- Pires, S.P.; Sénéchal, O.; Loures, E.F.R.; Jimenez, J.F. An approach to the prioritization of sustainable maintenance drivers in the TBL framework. IFAC-PapersOnLine 2016, 49, 150–155. [Google Scholar] [CrossRef]
- Xu, J.; Jiang, X.; Wu, Z. A Sustainable Performance Assessment Framework for Plastic Film Supply Chain Management from a Chinese Perspective. Sustainability 2016, 8, 1042. [Google Scholar] [CrossRef]
- To, W.M.; Lee, P.K. A Triple Bottom Line Analysis of Hong Kong’s Logistics Sector. Sustainability 2017, 9, 388. [Google Scholar] [CrossRef]
- De Soete, W. Towards a multidisciplinary approach on creating value: Sustainability through the supply chain and ERP systems. Systems 2016, 4, 16. [Google Scholar] [CrossRef]
- Dhillon, B.S. Mining Equipment Reliability, Maintainability, and Safety; Springer: London, UK, 2008. [Google Scholar]
- Paraszczak, J. Understanding and assessment of mining equipment effectiveness. Min. Technol. 2005, 114, 147–151. [Google Scholar] [CrossRef]
- Emery, J.C. Improving coal mining production performance through the application of Total Production Management. In Proceedings of the Coal Operators’ Conference, Wollongong, NSW, Australia, 18–20 February 1998; pp. 71–80. [Google Scholar]
- Samanta, B.; Sarkar, B. TPM and Assessment of Overall Effectiveness for Mining Equipment. Coal Min. Technol. Manag. 2003, 8, 10–21. [Google Scholar]
- Samanta, B.; Banerjee, J. Improving Productivity of Mining Machinery through Total Productive Maintenance. Available online: http://docplayer.net/22851170-Improving-productivity-of-mining-machinery-through-total-productive-maintenance.html#download_tab_content (accessed on 25 January 2018).
- Elevli, S.; Elevli, B. Performance Measurement of Mining Equipments by Utilizing OEE. Acta Montan. Slovaca 2010, 15, 95–101. [Google Scholar]
- Aguado, S.; Alvarez, R.; Domingo, R. Model of efficient and sustainable improvements in a lean production system through processes of environmental innovation. J. Clean. Prod. 2013, 47, 141–148. [Google Scholar] [CrossRef]
- Muthiah, K.M.; Huang, S.H.; Mahadevan, S. Automating factory performance diagnostics using overall throughput effectiveness (OTE) metric. Int. J. Adv. Manuf. Technol. 2008, 36, 811–824. [Google Scholar] [CrossRef]
- Guo, L. The research of equipment maintainability forecasts methods based on support vector machine. In Proceedings of the IEEE Chinese Automation Congress (CAC), Wuhan, China, 27–29 November 2015. [Google Scholar]
- Silva, F.J.D.S.; Viana, H.R.G.; Queiroz, A.N.A. Availability forecast of mining equipment. J. Qual. Maint. Eng. 2016, 22, 418–432. [Google Scholar] [CrossRef]
- Konovalov, I.B.; Beekmann, M.; Meleux, F.; Dutot, A.; Foret, G. Combining deterministic and statistical approaches for PM10 forecasting in Europe. Atmos. Environ. 2009, 43, 6425–6434. [Google Scholar] [CrossRef]
- Li, J.; Wu, Z.; Zhang, H.-C. Application of neural network on environmental impact assessment tools. Int. J. Sustain. Manuf. 2008, 1, 100–121. [Google Scholar] [CrossRef]
- Grivas, G.; Chaloulakou, A. Artificial neural network models for prediction of PM10 hourly concentrations, in the Greater Area of Athens, Greece. Atmos. Environ. 2006, 40, 1216–1229. [Google Scholar] [CrossRef]
- Reed, W.R.; Westman, E.C. A model for predicting the dispersion of dust from a haul truck. Int. J. Surf. Min. Reclam. Environ. 2005, 19, 66–74. [Google Scholar] [CrossRef]
- Huertas, J.I.; Camacho, D.A.; Huertas, M.E. Standardized emissions inventory methodology for open-pit mining areas. Environ. Sci. Pollut. Res. 2012, 19, 2784–2794. [Google Scholar] [CrossRef] [PubMed]
- Shields, D.J.; Blengini, G.A.; Solar, S.V. Integrating life cycle assessment and other tools for ex ante integrated sustainability assessment in the minerals industry. Am. J. Appl. Sci. 2011, 8, 1214–1227. [Google Scholar] [CrossRef]
- Yetilmezsoy, K.; Ozkaya, B.; Cakmakci, M. Artificial intelligence-based prediction models for environmental engineering. Neural Netw. World 2011, 21, 193. [Google Scholar] [CrossRef]
Figure 1.
Graphical representation of the proposed model.

Figure 2.
OEE typical structure used in mining operations.

Figure 3.
Alternative configurations for OTE computation.

Figure 4.
Crushing plant flow sheet.

Figure 5.
Process flow of the crushing plant.

Figure 6.
OTE and S.O.T.E. behaviour along the analysis periods.

Figure 7.
Sensitivity analysis of S.O.T.E. for each piece of equipment.

Figure 8.
Sensibilisation study results.

Figure 9.
Bathtub curve model.


Table 1.
Historical Availability levels for each piece of equipment.
| Equip. Layout | April | May | June | July | August | September | October | Average |
|---|---|---|---|---|---|---|---|---|
| Plate Feeder 1 | 16.88% | 0.00% | 0.00% | 83.04% | 91.05% | 97.17% | 95.98% | 54.87% |
| Plate Feeder 2 | 74.81% | 91.81% | 93.35% | 95.76% | 100.00% | 93.33% | 95.54% | 92.09% |
| Rotatory Crusher | 73.91% | 90.91% | 86.17% | 92.50% | 93.62% | 92.25% | 89.10% | 88.35% |
| Feeder A2 | 76.61% | 92.16% | 92.43% | 93.25% | 93.65% | 95.37% | 89.06% | 90.36% |
| Belt A3 | 77.76% | 92.40% | 93.13% | 93.40% | 94.26% | 94.10% | 87.79% | 90.41% |
| Belt A4 | 77.33% | 92.00% | 92.20% | 94.30% | 89.37% | 93.43% | 85.09% | 89.10% |
Table 2.
Historical Effective Utilization for each piece of equipment.
| Equip. Layout | April | May | June | July | August | September | October | Average |
|---|---|---|---|---|---|---|---|---|
| Plate Feeder 1 | 23.70% | 0.00% | 0.00% | 72.93% | 55.16% | 67.01% | 63.24% | 40.29% |
| Plate Feeder 2 | 75.20% | 73.76% | 83.17% | 70.10% | 18.57% | 20.30% | 11.67% | 50.40% |
| Rotatory Crusher | 79.65% | 74.06% | 79.90% | 75.28% | 67.67% | 71.40% | 74.98% | 74.49% |
| Feeder A2 | 80.11% | 77.68% | 84.57% | 78.11% | 69.48% | 73.63% | 77.78% | 77.23% |
| Belt A3 | 76.97% | 78.27% | 83.96% | 77.30% | 71.22% | 74.16% | 77.53% | 77.04% |
| Belt A4 | 82.09% | 78.46% | 86.96% | 76.62% | 72.72% | 75.59% | 76.38% | 78.35% |
Table 3.
Productivity levels.
| Equip. Layout | April | May | June | July | August | September | October | Average |
|---|---|---|---|---|---|---|---|---|
| Plate Feeder 1 | 82.12% | 87.33% | 86.08% | 87.14% | 89.66% | 85.56% | 87.23% | 86.45% |
| Plate Feeder 2 | 82.12% | 87.33% | 86.08% | 87.14% | 89.66% | 85.56% | 87.23% | 86.45% |
| Rotatory Crusher | 82.12% | 87.33% | 86.08% | 87.14% | 89.66% | 85.56% | 87.23% | 86.45% |
| Feeder A2 | 82.12% | 87.33% | 86.08% | 87.14% | 89.66% | 85.56% | 87.23% | 86.45% |
| Belt A3 | 82.12% | 87.33% | 86.08% | 87.14% | 89.66% | 85.56% | 87.23% | 86.45% |
| Belt A4 | 82.12% | 87.33% | 86.08% | 87.14% | 89.66% | 85.56% | 87.23% | 86.45% |
Table 4.
Overall Equipment Effectiveness calculation.
| Equip. Layout | April | May | June | July | August | September | October | Average |
|---|---|---|---|---|---|---|---|---|
| Plate Feeder 1 | 3.28% | 0.00% | 0.00% | 52.77% | 45.03% | 55.71% | 52.95% | 26.76% |
| Plate Feeder 2 | 46.20% | 59.14% | 66.83% | 58.50% | 16.65% | 16.21% | 9.73% | 40.12% |
| Rotatory Crusher | 48.34% | 58.80% | 59.27% | 60.68% | 56.80% | 56.36% | 58.28% | 56.89% |
| Feeder A2 | 50.40% | 62.52% | 67.29% | 63.47% | 58.34% | 60.08% | 60.42% | 60.33% |
| Belt A3 | 49.15% | 63.16% | 67.31% | 62.92% | 60.19% | 59.70% | 59.37% | 60.21% |
| Belt A4 | 52.13% | 63.04% | 69.02% | 62.96% | 58.27% | 60.42% | 56.69% | 60.35% |
Table 5.
PM10 acceptance ranges and their classifications.
| PM10 Content (mg/m3) | Qualification |
|---|---|
| <0.025 | Good |
| 0.025 ≤ mg < 0.034 | Regular |
| >0.034 | Bad |
Table 6.
PM10 measures (mg).
| Equip. Layout | April | May | June | July | August | September | October |
|---|---|---|---|---|---|---|---|
| Plate Feeder 1 | 0.034 | 0.033 | 0.034 | 0.031 | 0.032 | 0.032 | 0.033 |
| Plate Feeder 2 | 0.025 | 0.035 | 0.025 | 0.024 | 0.027 | 0.029 | 0.028 |
| Rotatory Crusher | 0.024 | 0.024 | 0.024 | 0.034 | 0.035 | 0.036 | 0.030 |
| Feeder A2 | 0.045 | 0.038 | 0.034 | 0.025 | 0.024 | 0.024 | 0.032 |
| Belt A3 | 0.036 | 0.025 | 0.025 | 0.026 | 0.024 | 0.023 | 0.027 |
| Belt A4 | 0.024 | 0.024 | 0.026 | 0.024 | 0.025 | 0.024 | 0.025 |
Table 7.
PM10-based sustainability indexes.
| Equip. Layout | April | May | June | July | August | September | October | Average |
|---|---|---|---|---|---|---|---|---|
| Plate Feeder 1 | 81.91% | 81.56% | 79.76% | 81.10% | 80.84% | 80.95% | 81.04% | 81.02% |
| Plate Feeder 2 | 86.70% | 80.45% | 85.12% | 85.37% | 83.83% | 82.74% | 84.04% | 84.04% |
| Rotatory Crusher | 80.85% | 86.59% | 85.71% | 79.27% | 79.04% | 78.57% | 82.88% | 81.85% |
| Feeder A2 | 76.06% | 78.77% | 79.76% | 84.76% | 85.63% | 85.71% | 81.62% | 81.76% |
| Belt A3 | 80.85% | 86.03% | 85.12% | 84.15% | 85.63% | 86.31% | 84.62% | 84.67% |
| Belt A4 | 87.23% | 86.59% | 84.52% | 85.37% | 85.03% | 85.71% | 85.78% | 85.75% |
Table 8.
OEEE indexes.
| Equip. Layout | April | May | June | July | August | September | October | Average |
|---|---|---|---|---|---|---|---|---|
| Plate Feeder 1 | 2.69% | 0.00% | 0.00% | 42.80% | 36.40% | 45.10% | 42.91% | 15.49% |
| Plate Feeder 2 | 40.06% | 47.58% | 56.89% | 49.94% | 13.96% | 13.41% | 8.17% | 33.71% |
| Rotatory Crusher | 39.09% | 50.92% | 50.80% | 48.10% | 44.90% | 44.28% | 48.30% | 46.57% |
| Feeder A2 | 38.33% | 49.25% | 53.67% | 53.80% | 49.96% | 51.50% | 49.32% | 49.33% |
| Belt A3 | 39.74% | 54.34% | 57.29% | 52.94% | 51.54% | 51.53% | 50.24% | 50.98% |
| Belt A4 | 45.47% | 54.59% | 58.34% | 53.75% | 49.55% | 51.79% | 48.63% | 51.75% |
Table 9.
OTE and S.O.T.E. calculations.
| April | May | June | July | August | September | October | Average | |
|---|---|---|---|---|---|---|---|---|
| S.O.T.E. | 21.64% | 33.92% | 32.40% | 31.83% | 32.36% | 27.73% | 32.06% | 30.08% |
| OTE | 26.77% | 39.17% | 37.80% | 40.15% | 40.94% | 35.29% | 38.68% | 36.75% |
Table 10.
Simulation results.
| Equipment | Bad | Regular | Good |
|---|---|---|---|
| Plate Feeder 1 | 22.3% | 32.4% | 31.9% |
| Plate Feeder 2 | 22.3% | 31.2% | 30.8% |
| Rotatory Crusher | 22.3% | 34.9% | 37.2% |
| Feeder A2 | 22.3% | 33.8% | 33.4% |
| Belt A3 | 22.3% | 29.2% | 28.8% |
| Belt A4 | 22.3% | 32.0% | 31.5% |
Table 11.
Sensitivity indicators.
| Equipment | S.I. |
|---|---|
| Plate Feeder 1 | 30.0% |
| Plate Feeder 2 | 28.0% |
| Rotatory Crusher | 40.0% |
| Feeder A2 | 33.0% |
| Belt A3 | 22.0% |
| Belt A4 | 29.0% |
© 2018 by the authors. Licensee MDPI, Basel, Switzerland. This article is an open access article distributed under the terms and conditions of the Creative Commons Attribution (CC BY) license (http://creativecommons.org/licenses/by/4.0/).
Share and Cite
MDPI and ACS Style
Durán, O.; Capaldo, A.; Duran Acevedo, P.A. Sustainable Overall Throughputability Effectiveness (S.O.T.E.) as a Metric for Production Systems. Sustainability 2018, 10, 362. https://0-doi-org.brum.beds.ac.uk/10.3390/su10020362
AMA Style
Durán O, Capaldo A, Duran Acevedo PA. Sustainable Overall Throughputability Effectiveness (S.O.T.E.) as a Metric for Production Systems. Sustainability. 2018; 10(2):362. https://0-doi-org.brum.beds.ac.uk/10.3390/su10020362
Chicago/Turabian StyleDurán, Orlando, Andrea Capaldo, and Paulo Andrés Duran Acevedo. 2018. "Sustainable Overall Throughputability Effectiveness (S.O.T.E.) as a Metric for Production Systems" Sustainability 10, no. 2: 362. https://0-doi-org.brum.beds.ac.uk/10.3390/su10020362
Note that from the first issue of 2016, this journal uses article numbers instead of page numbers. See further details here.