Sustainable Investment in a Supply Chain in the Big Data Era: An Information Updating Approach


1
Library, Central China Normal University, Wuhan 430079, China
2
Department of Logistics and Maritime Studies, Faculty of Business, The Hong Kong Polytechnic University, Hung Hom, Kowloon, Hong Kong, China
3
School of Economics and Management, Nanjing University of Science and Technology, Nanjing 210094, China
4
School of Business Administration, Zhongnan University of Economics and Law, Wuhan 430073, China
*
Author to whom correspondence should be addressed.
Sustainability 2018, 10(2), 403; https://0-doi-org.brum.beds.ac.uk/10.3390/su10020403
Submission received: 29 December 2017
/
Revised: 30 January 2018
/
Accepted: 31 January 2018
/
Published: 4 February 2018
(This article belongs to the Special Issue Sustainability in Supply Chain Operations and Collaboration in the Big Data Era)
Abstract
:We are now living in the big data era, where firms can improve their decision makings by adopting big data technology to utilize mass information. To explore the effects of the big data technology, we build an analytical model to study the sustainable investment in a supply chain, consisting of one manufacturer and one retailer, by using Bayesian information updating approach. We derive the optimal sustainable investment level for the manufacturer and the optimal order quantity for the retailer. Comparing the results with and without the big data technology, we find that whether the manufacturer should make more sustainable investment when the retailer adopts the big data technology depends on the service level at the retailer side. Interestingly, it is not always optimal for the retailer to adopt the big data technology. We identify the conditions under which the manufacturer and retailer are better off with the big data technology. In addition, we investigate the impact of the number of observations regarding the market information and find that the optimal decisions and profits increase in the number of the observations, if and only if the service level is low.
1. Introduction
With the development of information technology, firms are able to access, store and process massive amount of data. It means that we are now in the big data era, where the data is generated in huge volume with high velocity and variety [1]. New technologies and business modes have emerged with the utilization of the big data. For example, in the big data era, retailers are possible to access the real-time sales data and thus improve their decision makings by using the big data technology [2]. Although the firms may benefit from using the big data technology, the cost of adopting the big data technology is substantial, which cannot be neglected [3]. Thus, it is important to investigate whether the firm can be better off by adopting the big data technology.
On the other hand, environmental issues, such as carbon emission, have received increasing concerns both in academia and industry. Many countries, such as USA, have designed carbon emission regulations to deal with the environmental issues [4]. Environmental tax is one of the carbon emission regulations used to reduce the carbon emission. Firms need to pay for carbon emission under the environmental tax regulation. For example, carbon tax has been legislated by Australian government in 2011 and the carbon is priced at AU$23 per ton in 2012 [5]. Facing the environmental tax, firms have incentive to do the sustainable investment, such as adopting the cleaner technology, to reduce the carbon emission. Many firms, such as H&M and Marks & Spencer, have made substantial investment in their sustainable projects. For example, Marks & Spencer’s sustainable investment excesses 200 million pounds in 2007 [6].
In a supply chain, the sustainable investment benefits not only the manufacturer by reducing the carbon emission but also the retailer. This is because, as shown in both research papers and industry reports, the sustainable investment in the products has positive effects on the demands [7]. In other words, some consumers are environmental awareness and they prefer the products with high sustainable level. Here, high sustainable level refers to less carbon or pollutant emissions in the manufacturing process. Meanwhile, in the framework of the supply chain, adoption of the big data technology by the retailer may affect the sustainable investment for the manufacturer. For example, the retailer can get more accurate demand information by the big data technology, which directly affects the order quantity of the products. And the order quantity further affects the sustainable investment decisions by the manufacturer. Thus, both the impacts of the sustainable investment and big data technology cannot be neglected in managing the supply chain.
Motivated by the above real industry practices, in this paper, we consider the sustainable investment in a supply chain in the big data era. Here, the term of the big data era represents that in this era the retailer is able to collect the data in huge volume with high velocity and variety, which can be used to improve the demand forecast by adopting some big data technologies [8]. For the big data technologies, we focus on the forecasting techniques and consider that the retailer can use the big data technology to improve the demand forecast. This is because forecasting technique is one of important big data technologies, which has played increasingly significant roles in supply chain management [2,9]. Note that in this paper we would not discuss how to implement the big data technologies. Instead, we aim to answer the fundamental research question that whether the retailer should adopt the big data technology in the presence of sustainable investment by the manufacturer. This is important because the effect of the big data technology using by the retailer is rather unclear, especially when the sustainable investment, which is one of the keys to achieve the environmental sustainability, is taken into consideration [3,4,8]. To answer the above research question, we consider a supply chain consisting of one manufacturer and one retailer. The manufacturer will invest in the sustainable effort to reduce the carbon emission. Consumers are environmental awareness, which means that the demands of the products are positively affected by the sustainable effort. The manufacturer and the retailer play a Stackelberg game, where the manufacturer acts as a leader deciding the sustainable investment effort and the retailer acts as a follower deciding the order quantity. We focus on exploring the effects of the information updating on the sustainable investment, order quantity and the performances of both the retailer and manufacturer. We construct the mathematical model to study the problem. Especially, to investigate the effects of the big data technology, we build a Bayesian information updating model that captures the key feature of improving the demand forecast with big data.
To the best of our knowledge, this is the first paper studying the sustainable investment with the consideration of consumer environmental awareness and information updating in the big data era. We derive the optimal sustainable investment level for the manufacturer and the optimal order quantity for the retailer with the big data technology. Comparing the results with and without the big data technologies, we find that whether the manufacturer should make more sustainable investment with the big data technology than that without the big data technology depends on the service level at the retailer side. Specifically, the manufacturer is expected to invest less sustainable effort with the big data technology if and only if the service level is high. Similar results hold for the order quantity of the retailer. Interestingly, we find that it is not always optimal for the retailer to adopt the big data technology. We identify the conditions, associated with the sustainable investment cost and fixed cost of adopting the big data technology, under which the retailer is better off with the big data technology. Similarly, the manufacturer may be better or worse off with the big data technology. We identify the thresholds associated with the unit production cost and the service level, under which the manufacturer is better off when the retailer adopts the big data technology.
The rest of the paper is organized as follows. In Section 2, we show the literature related to our paper. In Section 3, we introduce the basic modeling framework and the Bayesian information updating model. In Section 4, we analyze a benchmark case where big data technology is not adopted by the retailer. In Section 5, we analyze the case with big data technology. In Section 6, we compare the results with and without big data technologies. In Section 7, we examine the impacts of the number of the observations regarding the market information. All proofs are provided in the Appendix A.
2. Literature Review
Our work is related to three streams of research in the literature, i.e., sustainability issues, supply chain management in the big date era and Bayesian information updating.
(1) Sustainability Issues
Researches have shown that the sustainability issues should be integrated into the operational decisions to achieve the sustainability of the supply chain [10,11]. Next, we review the related literature on the sustainability issues with respects to carbon emission, sustainable investment and consumer environmental awareness, as which are three key features of our research problem regarding the sustainability.
(a) Carbon Emission
Some papers investigate the procurement/production/inventory decisions with the consideration of carbon emission. For example, Letmathe and Balakrishnan [12] is an early paper that incorporates the environment issues into the production decisions. In their paper, they develop two models to determine the production decisions in the presence of environmental constraints. Focusing on the inventory models, Bouchery et al. [13] revisit the classical economic order quantity model with the consideration of sustainability concerns. Zhang and Xu [14] study a production planning problem with carbon cap-and-trade regulation, where both the optimal production quantities and the corresponding carbon trading quantity are determined. Chen and Wang [15] study the effects of carbon emission regulations on the optimal ordering and the transportation mode selection. They find that there are some thresholds for the transportation modes under different carbon emission regulations. There are papers investigate the carbon emission considering other supply chain aspects, e.g., dual sourcing problem, return policies, supplier evaluation and transportation scheduling. For example, Rosič and Jammernegg [16] investigate the effects of the environmental regulations on the dual sourcing problem, in which the retailer uses both the offshore and onshore suppliers. Shen and Li [17] investigate the effects of the return policies on the sustainability of fashion supply chain, where the sustainability factors include expected amount leftover, the ration of expected sales over expected leftover, etc. Guo et al. [18] use a fuzzy multi-criteria decision-making approach to evaluate the green supplier. He et al. [19] discuss the development of low-carbon logistics by a case study in China. Guo et al. [20] study the green transportation scheduling problem with the consideration of pickup time and transport mode selections. One of the key elements for integrating the sustainability issues into operation decisions is sustainable investment, which, however, is not considered by the majority of the above papers.
(b) Sustainable Investment
Considering the sustainable investment, some papers also investigate the procurement/production/inventory policies. For example, Benjaafar et al. [21] study how to integrate carbon emission concerns into the procurement/production and inventory decisions. Toptal et al. [22] study the joint decisions of replenishment and sustainable investment under carbon cap, tax and cap-and-trade policies. They find that sustainable investment can reduce both the carbon emission and cost. Some papers examine different emission regulations with the consideration of sustainable investment. For example, Drake et al. [23] compare the impacts of emission tax and emission cap-and-trade regulations on firm’s sustainable investment. However, all these three papers consider that the product demand is not affected by the carbon emission/sustainable investment.
(c) Consumer Environmental Awareness
Yalabik and Fairchild [24] and Liu et al. [25] are two early papers that consider the consumer environmental awareness, such that the demand will be affected by the carbon emission/sustainable investment. Procurement/production/inventory are also main decisions investigated in the literature when considering the consumer environmental awareness. For example, Nouira et al. [26] study the selection of production processes and the choice of input products with the consideration of greenness-dependent demand. Dong et al. [4] consider retailer’s procurement policy with environmental awareness consumers when the manufacturer is under the carbon cap-and-trade regulation. There are other papers that consider the consumer environmental awareness from other supply chain aspects, e.g., power structure, supply chain performance and business modes selection. Specifically, Shi et al. [11] study the joint effect of power structure and sustainable investment on the economic and environmental performance of supply chain. They show that the supply chain member with less power has more incentive to make the sustainable investment to achieve a high profit. Du et al. [27] investigate the impacts of consumer environmental awareness on the performance of the emission-concerned supply chain. They show that both the channel profit and the emission reduction are increasing in the consumers’ preference for low-carbon consumption. Li and Shen [28] study the sustainable investment with the consideration of the consumer environmental awareness by developing two business modes for the manufacturer, namely, the non-profit manufacturer model and for-profit manufacturer model. Our work is different from the above papers. Although we consider the sustainable investment and environmental awareness consumers, we focus on the effects of the big data technology and consider that the demand information can be updated by this technology. Please refer to conception and review papers, such as Maletič et al. [29], Centobelli et al. [30], Kohtala [31] and the references therein for other related researches about the environmental sustainability.
(2) Supply Chain Management in the Big Date Era
The literature on big data usually focuses on the data-driven decision-making, where the data can be used to create values for the organizations and societies [32]. From this perspective, some papers argue that the big data may be a contributor to and/or an element of knowledge management [32,33]. Regarding the knowledge management, various methods and technologies are used to support the organizational processes of knowledge creation, storage and transfer [34,35]. With the big data technology, useful predictive knowledge can be generated to help organizations improve the capability of the knowledge management [9,36].
Meanwhile, big data has dramatically changed the operations in supply chain and the big data research in supply chain has generated increasing attention in recent years [2]. See-To and Ngai [37] investigate the effects of information of big data streams of customer review on sales nowcasting. Liu and Yi [3] examine the effects of the big data information investment on the performance of supply chain and the supply chain coordination. They show that under some conditions associated with the investment cost, the manufacturer and retailer are better off by the big data information investment and the supply chain can be coordinated under revenue sharing contract. Considering the adoption of the big data technology, our paper, however, is fundamentally different from their work as we study the sustainable investment with Bayesian information updating model. Other related researches can be found in the review papers or essay papers, such as Feng and Shanthikumar [1], Shen and Chan [2], Choi et al. [8], Arunachalam et al. [38] and Guha and Kumar [39] and the references therein.
(3) Bayesian Information Updating
In the big data era, firms can collect the big data and utilize the data to improve the demand forecast by information updating approach. The Bayesian information updating is wildly used in researches considering the operational strategies. For example, Iyer and Bergen [40] adopt the Bayesian information updating approach to study the effect of quick response strategy on the performance of supply chain. They show that service level plays an important role under the quick response strategy. Under some conditions associated with the service level, both the manufacturer and the retailer are better off by the quick response strategy. Choi et al. [41] study the optimal two-stage ordering policy with the consideration of Bayesian information updating and discuss the service level and profit uncertainty under the optimal policy. Wu [42] considers the quantity flexibility contracts with Bayesian information updating and shows that more flexibility always benefits the retailer rather than the manufacturer. Choi and Chow [43] study the quick response strategy by a mean-variance and Bayesian information updating approach with the consideration of risk. Yang et al. [44] examine the supply chain coordination for a supply chain consisting two suppliers and one retailer with Bayesian information updating. They show that the supply chain coordination is independent of the information updating process. Chan et al. [45] also consider the supply chain coordination with the Bayesian information updating, while focus on examining the value of RFID.
All the above papers about the Bayesian information updating do not consider sustainability issues. Choi [46], Chan et al. [47] and Shen et al. [48] are three exceptions that consider the sustainability issues with Bayesian information updating. Specifically, Choi [46] studies a quick response strategy with the consideration of carbon footprint tax and Bayesian information updating. Shen et al. [48] investigate the selling sequence of the green and non-green products by using the Bayesian information updating approach. Both Choi [46] and Shen et al. [48] do not consider the sustainable investment and consumer environmental awareness, which are salient features of our study. Chan et al. [47] investigate the supply chain coordination by Bayesian information updating approach with the consideration of sustainable investment. However, unlike ours, they do not consider the consumer environmental awareness which significantly affects the operational decisions. Besides, in our paper we study the business modes in the big data era and examine the effects of the number of observations regarding the demand information, which is not considered in their paper.
Table 1 shows the positioning of this paper in the literature.
3. Modelling
3.1. Basic Modelling Framework
We consider a supply chain which consists of one manufacturer and one retailer. The retailer purchases a single type of sustainable products at a unit wholesale price from the manufacturer and sells to customers at a unit retail price . Let denote the unit production cost of the products. Clearly, we have . We consider that the demand is stochastic. Hence, there may exist some leftover products at the end of the selling season. Let denote the unit salvage price of the unsold products.
Facing the environmental taxation, the manufacturer has the incentive to invest in the sustainable effort. Let denote the sustainable level of the products. Following Shi et al. [11], we assume that the sustainable effort reduces the manufacturer’s environmental tax. The reduction of the environmental tax by the sustainable investment can be denoted as
where is the sensitivity parameter of the environmental tax reduction by the sustainable investment, which is related to the per unit pollutant emission equivalent and tax rate. Investing in the sustainable effort will incur the investment cost to the manufacturer. Following the settings in the literature (see e.g., Savaskan and Van Wassenhove [49] and Shi et al. [11]), we consider the following cost function:
It indicates that the investment cost is convex increasing in the sustainable level. is the coefficient of investment cost. To avoid the trivial outcomes, we assume that , implying that the sustainable investment cost is usually substantial [4].
In addition, following the literature and industry practice, we assume that the consumers are environmental awareness, such that the sustainable level has a positive effect on the demand of the products [28]. Let denote the demand of the products. Consistent with the existing literature (see e.g., Dong et al. [4]), we consider the following stochastic demand function:
where is the sensitivity parameter of the sustainable level, and is the base demand which is stochastic and irrelevant to the sustainable level. Let denote the order quantity of the products by the retailer. In order to avoid the trivial outcomes, we assume that . This is reasonable because given that the base demand is non-negative, the number of products that the retailer should order exceeds the deterministic part of the demand i.e., .
3.2. Bayesian Information Updating
We assume that in the big data era, the retailer can easily and conveniently access to massive amount of data, such as the sales data. These data can be used to improve the performance of the business operations, by adopting the big data technology. A typical approach of the adoption of big data technology is to utilize the data to improve the demand forecast [8]. In order to capture the characteristics of demand forecast, we consider a Bayesian information updating model. Similar to Chan et al. [47] and Shen et al. [48], we consider the forecasted base demand of the products in two stages. Let denote the forecasted base demand of the products at Stage 0. Following the Bayesian information updating model as in Iyer and Bergen [40] and Choi [50], we assume that is normally distributed with mean and variance , i.e.,
Consider that is also a random variable which is normally distributed with mean and variance , i.e.,
Note that represents the inherent uncertainty of the demand which cannot be reduced by the big data technology. In other words, it implies that the demand at Stage 0 is still a random variable even if we have perfect information about [43].
Then, we can derive the unconditional distribution of at Stage 0, which is normally distributed with mean and variance , i.e.,
where .
Let denote the forecasted base demand of the products at Stage 1. We assume that up to Stage 1, the retailer can obtain sufficient amount of data from the market to improve the demand forecast. Following Choi [50] and Shen et al. [48], we define as the number of market observations, which represents the market information that the retailer can use to improve the demand forecast. In the big data era, could be very large and it tends to infinity when the market observation is real-time [48]. Using the Bayesian theory (see, e.g., Pratt et al. [51]), we can obtain the distribution of , which can be presented as follows:
where
and is the mean of the observations.
3.3. Objective Functions
We consider a Stackelberg game, where the manufacturer acting as the leader determines the sustainable investment level and the retailer acting as the follower determines the order quantity of the products.
The retailer’s objective is to maximize her expected profit by setting the optimal order quantity of the products. Given the mean of the observations , the retailer’s optimal expected profit can be expressed as:
where is the fixed cost due to the adoption of big data technology. Without loss of generality, we assume that the shortage cost is zero. Therefore, in the above expected profit function, the first term is the revenue from selling the products to the customers, the second term denotes the cost of ordering the products from the manufacturer, and the third term captures the salvage value when the demand is less than the order quantity.
We consider a make-to-order production system for the manufacturer. The manufacturer’s optimal profit function, denoted by , can be expressed as:
In the above profit function, the first term is the revenue of selling the products to the retailer, the second term denotes the production cost, the third term is the gain of reducing the environmental tax, and the last term is the sustainable investment cost. Note that following the literature, we consider that the sustainable investment cost is a convex function, which is wildly used in the literature (see e.g., Dong et al. [4], Shi et al. [11], Chan et al. [47] and Savaskan and Van Wassenhove [49]). On the other hand, if the sustainable investment cost is linear or concave function, it can be easily shown that the manufacturer’s objective function is convex in the sustainable effort, so the optimal sustainable effort is either the lower bound (i.e., zero) or the upper bound (i.e., the ideal level that eliminates all the emissions).
We let , which represents to the service level at the order quantity in types of the newsvendor problems [43].
Table 2 shows the major notations used in this paper.
4. A Benchmark
We first consider a benchmark case in which no big data technology is used, so that there is no information updating approach to improve the demand forecast. As a result, the forecasted base demand at Stage 1 is still , and there is no fixed cost for big data technology, i.e., . Then we can obtain the optimal order quantity for the retailer.
Proposition 1.
Without the big data technology, the retailer’s optimal order quantity, denoted by , for a given is as follows:
where .
Proposition 1 shows that the best response of the order quantity for the retailer for a given sustainable level, when the big data technology is not used. It is straightforward to see that the optimal order quantity is increasing in the sustainable level. Substituting the optimal response into the manufacturer’s profit function, i.e., Equation (2), we can obtain the following results:
Proposition 2.
Without the big data technology, the manufacturer’s optimal sustainable investment level is as follows:
Then, substituting into Equation (3), we obtain that
Substituting the optimal solutions into Equations (1) and (2) and rearranging the results, then the retailer’s and manufacturer’s optimal expected profits without big data technology, denoted by and respectively, can be expressed as follows:
5. With Bayesian Information Updating
In this section, we consider that the retailer can use the big data technology to improve the demand forecast by Bayesian information updating approach. Similar to the benchmark case, by solving the retailer’s problem, we can obtain the following results:
Proposition 3.
With the big data technology, given the mean of the observations , the retailer’s optimal order quantity at Stage 1, denoted by and manufacturer’s optimal sustainable level, denoted by , are as follows:
Substituting the above optimal solutions into Equation (1) and rearranging the result, then the retailer’s optimal expected profit with information updating, denoted by , can be expressed as follows:
At Stage 0, the expected and are given by
It is straightforward to see that the optimal expected order quantity is increasing in the salvage value and the mean of the forecasted base demand at Stage 0, and decreasing in the unit production cost. The optimal sustainable level is decreasing in the investment cost and the unit production cost, and increasing in the salvage value and the mean of the forecasted base demand at Stage 0.
Un-conditioning with respected to yields
The manufacturer’s optimal profit with Bayesian information updating can be expressed as follows:
6. Comparison
In this section, we compare the model with Bayesian information updating and the benchmark.
Comparing the retailer’s and manufacturer’s optimal decisions with and without the big data technologies, respectively, yields
Note that . Here, is the inverse cumulative distribution function of the standard normal distribution. Therefore, if , then ; otherwise, . Then we can obtain the following results:
Proposition 4.
If , then and ; otherwise, and .
Proposition 4 provides the conditions under which the optimal solutions with the big data technology are larger than those without the big data technology. Specifically, it shows that when the service level is large, i.e., , with the big data technology, the retailer is expected to order less products from the manufacturer than that without the big data technology. Otherwise, the retailer is expected to order more with the big data technology. It implies that although using the big data technology can improve the demand forecast, whether the retailer can order less products depends on the service level. Similarly, with the big data technology, the manufacturer is also expected to invest a lower sustainable level in the products, than that without the big data technology, if and only if the service level is high.
Comparing the retailer’s and manufacturer’s optimal profits with and without the big data technologies yields
To simplify the exposition, we define the term and as
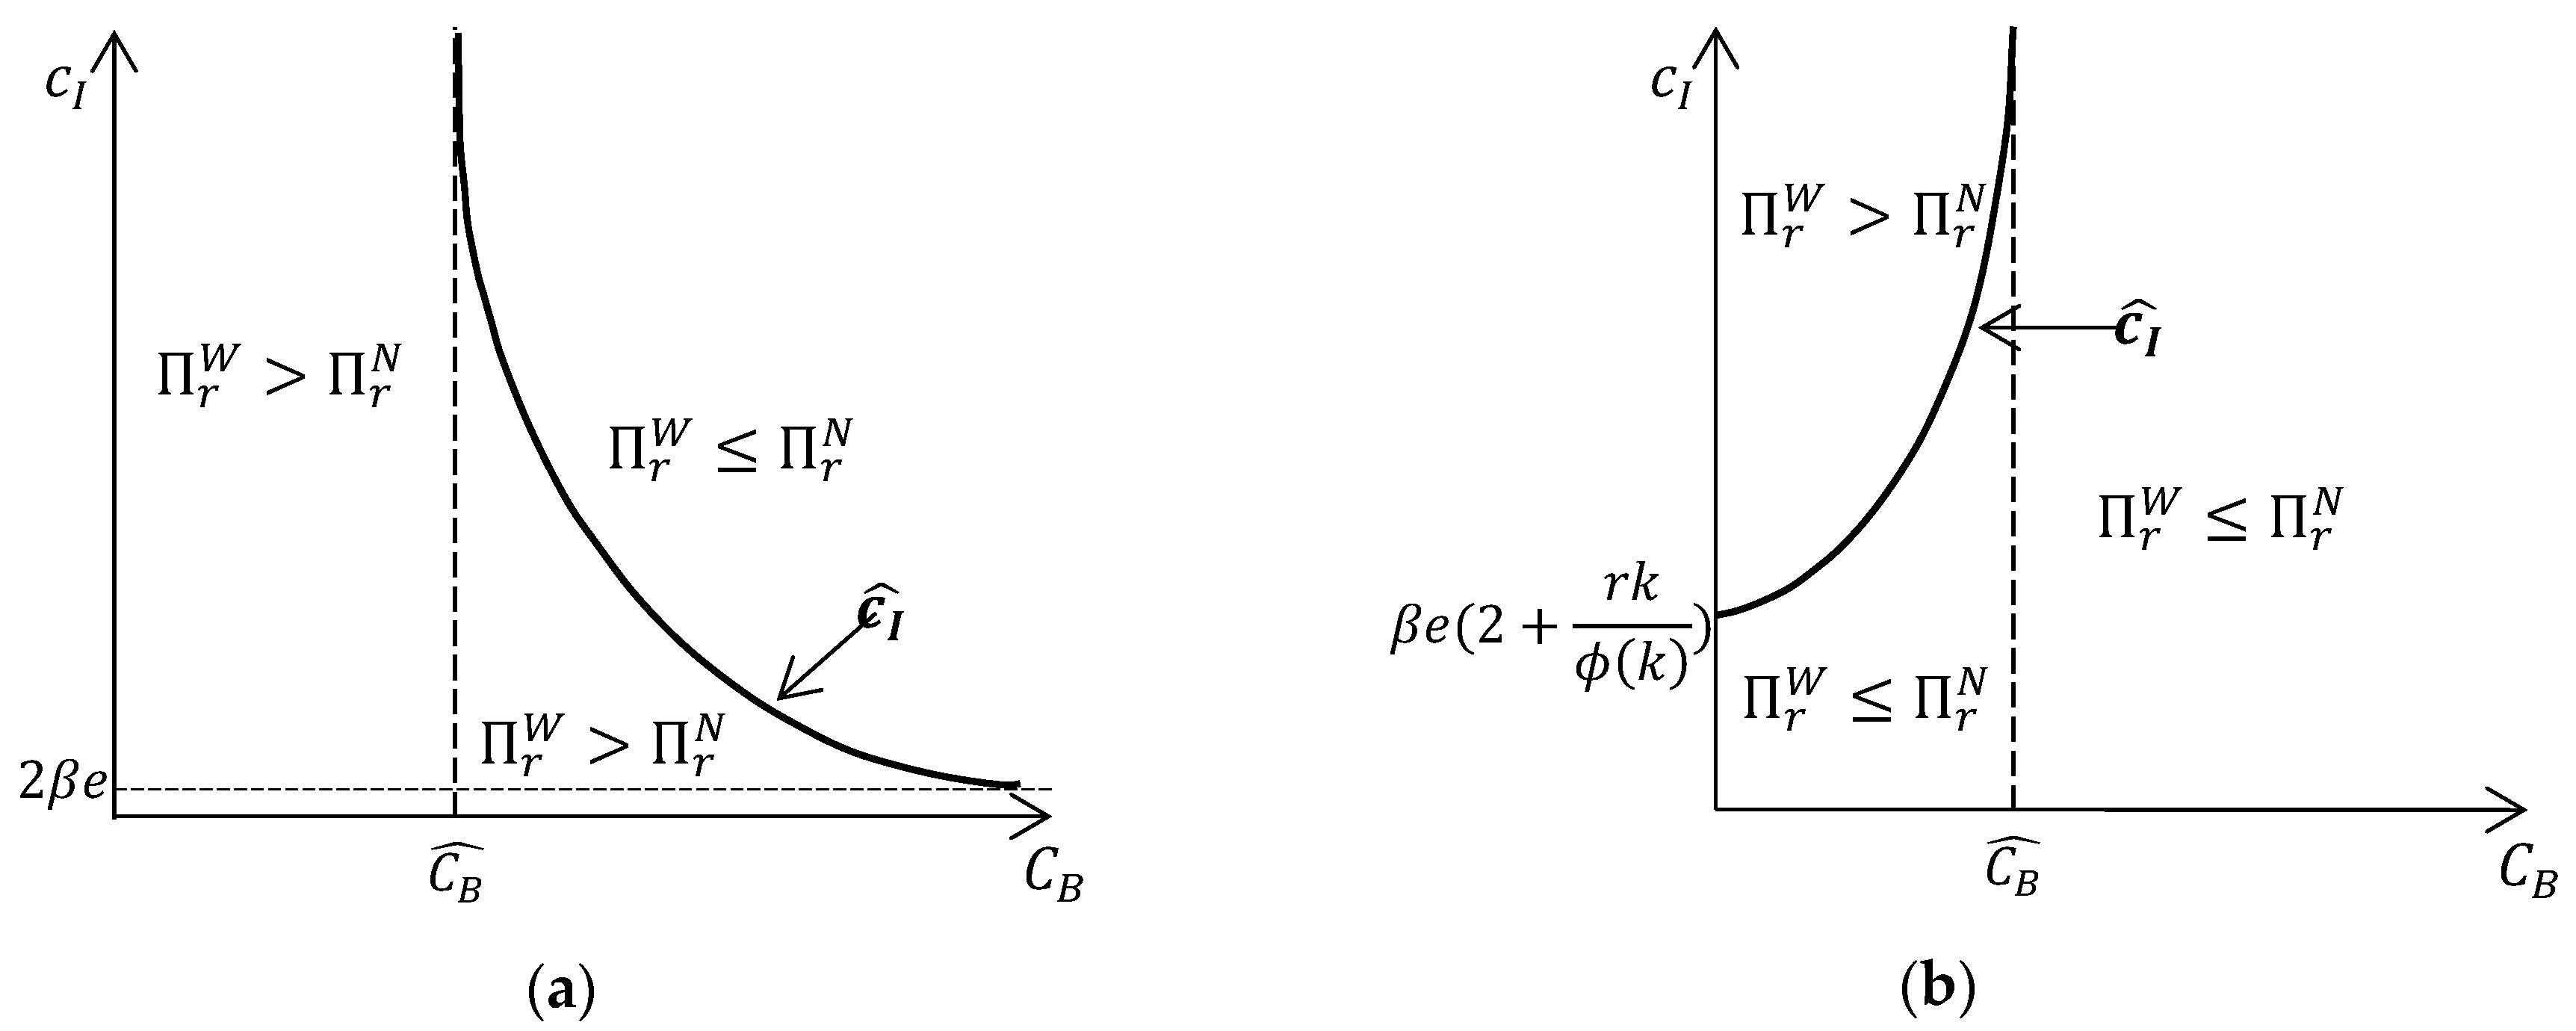
Proposition 5.
When , if , then ; if , then the relationship of and depends on and : if , then , otherwise . When , if , then ; if , then the relationship of and depends on and : if , then , otherwise .
Proposition 5 shows the relationships of and . It indicates that the relationships depend on the values of service level, fixed cost of using the big data technology and the coefficient of the sustainable investment cost.
Figure 1 depicts the results in Proposition 5.
The relationships of and can be presented in two cases. The first case is shown in Figure 1a, where the service level is low, i.e., . We can see that if the fixed cost of using the big data technology is low, i.e., , the retailer is better off by using the big data technology to improve the demand forecast. It is intuitive. However, it can be seen that the retailer can also be better off with the big data technology, even the fixed cost of using the big data technology is large, i.e., . We can see that when the fixed cost is high, whether the retailer is better off with the big data technology depends on the coefficient of the investment cost. Specifically, the retailer is still better off with the big data technology if and only if the investment cost is low, i.e., . The second case is shown in Figure 1b, where the service level is large, i.e., . Contrary to the first case, when the service level is high, the retailer is better off with the big data technology if and only if the investment cost is high, i.e., . These results imply that the strategy of using the big data technology should be tailored to fit each type of retailers, with the consideration of both the retailer’s fixed cost of using the big data technology and service level and the manufacturer’s sustainable investment cost.
Before presenting the comparisons of the manufacturer’s optimal profits, we define the term to simplify the exposition. Let
Note that it may be less than when .
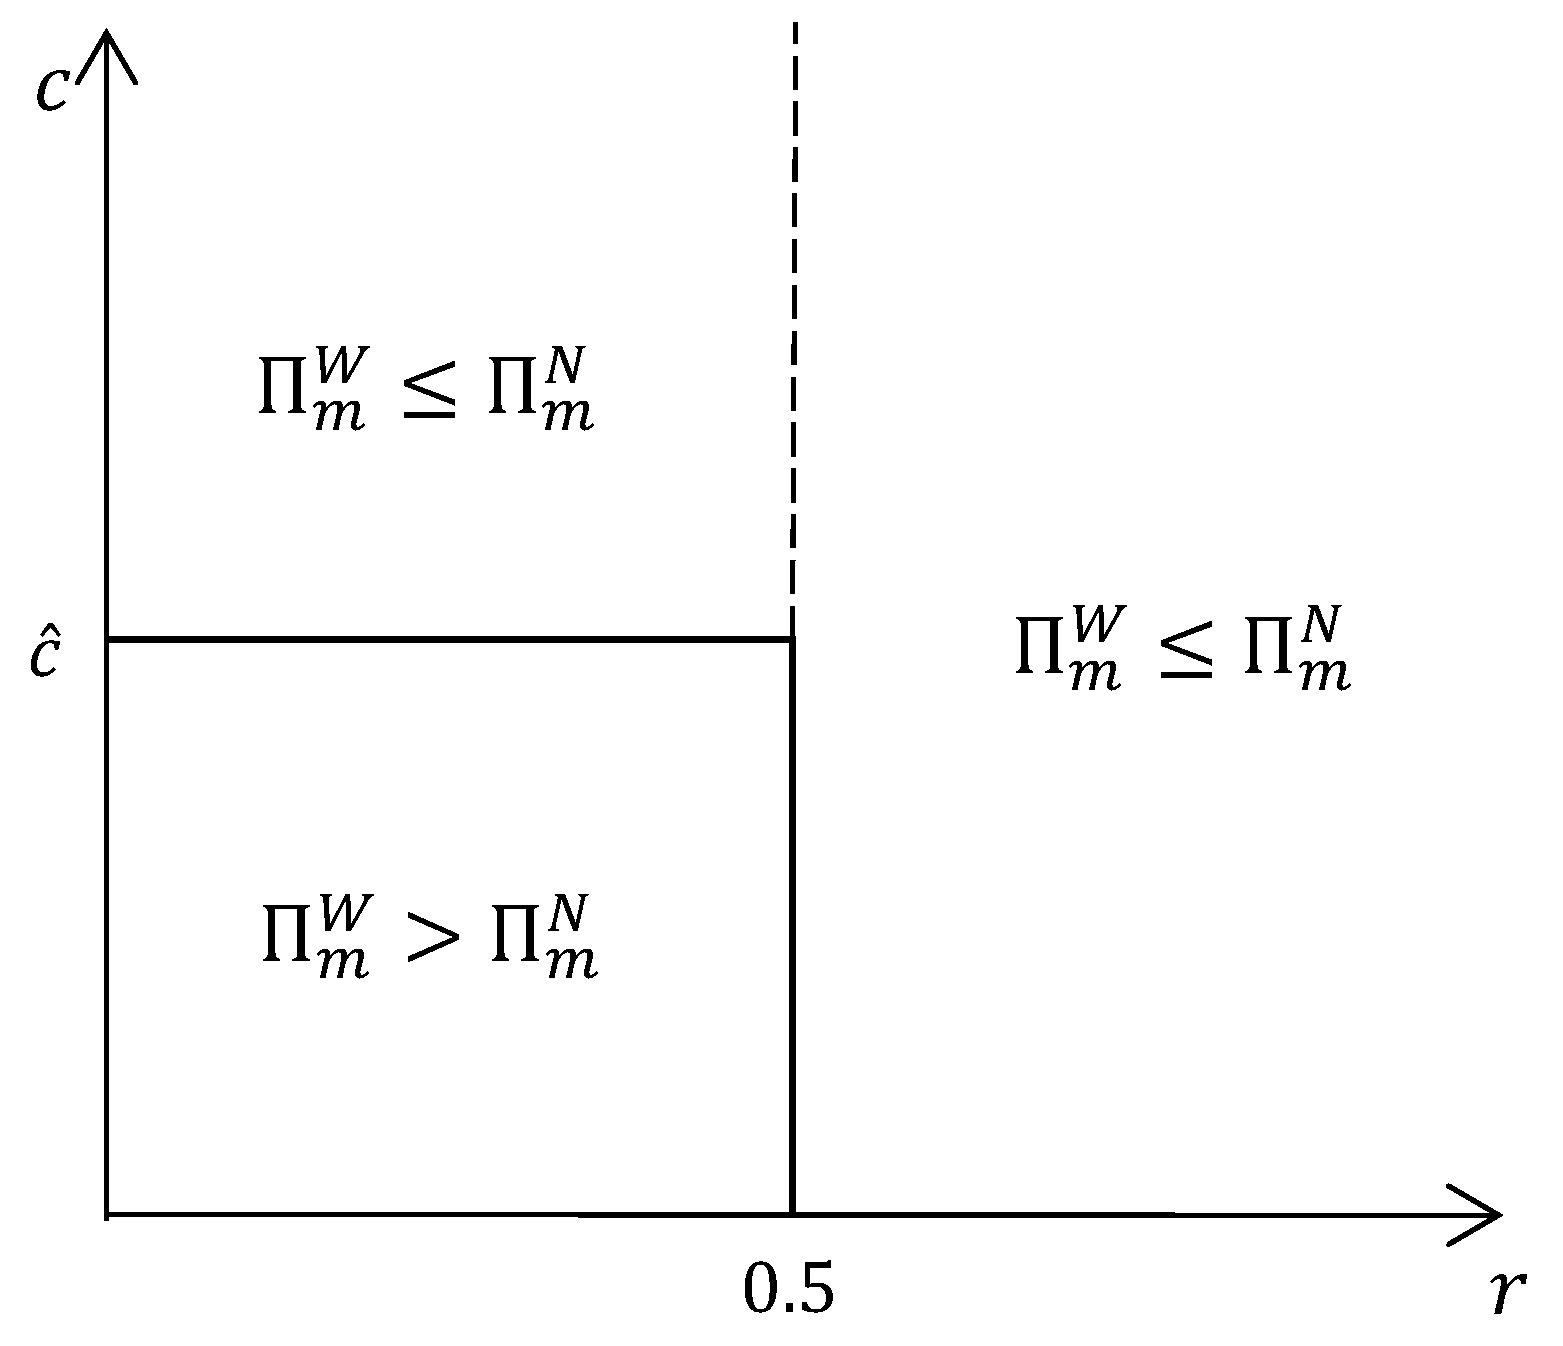
Proposition 6.
When , if , then ; otherwise When , .
Proposition 6 shows the relationships between and , which are depicted in Figure 2.
Figure 2 shows that the relationship between and depends on the service level and the unit production cost. If the service level is high, i.e., , then the manufacturer is worse off when the retailer uses the big data technology to improve the demand forecast. If the service level is low, i.e., , then whether the manufacturer will be worse off depends on the unit production cost. Specifically, if the unit production cost is large, then the manufacturer will also be worse off; otherwise, the manufacturer will be better off when the retailer uses the big data technology.
Note that we consider the wholesale price contract and the retailer can be better off either the service level is large or small, whereas the manufacturer can be only better off with the big data technology if the service level is small. Above analysis implies that under the wholesale price contract, we are possible to achieve the Parato improvement by using the big data technology only when the service level is small. However, in practice such small service level is unlikely to be observed in most cases [40,43]. Therefore, from the perspective of the whole supply chain, the manufacturer and retailer are suggested to sign some other contracts, under which the retailer may pay some subsidies to the manufacturer, so that both of them can be better off with the big data technology.
7. Impact of the Number of the Observations
In this section, we study the impact of the number of the observations . Notice that the observations represent the market information that can be used by the retailer to improve the demand forecast. If there is no market observation, then and . In this case, the optimal decisions in the Bayesian information updating model are the same with those in the benchmark case. If the market observation is real-time, then tends to infinity [48,50]. And we can derive that . It implies that there is only the inherent uncertainty in the demand, when the observation is real-time. Then the optimal solutions in the Bayesian information updating model can be represented as follows:
The above equations indicate that in the big data era, the optimal decisions and profits of the retailer and manufacturer will be converged at certain levels, when we can use infinite observations to update the demand information.
Next, we show the results that how the optimal solutions in the Bayesian information updating model change along with the number of observations .
Proposition 7.
If , then , , and ; otherwise , , and .
Proposition 7 shows the impacts of the number of observations on the optimal decisions and profits of the retailer and manufacturer. It indicates that there is a threshold for the service level, above which all the optimal decisions and profits decrease in the number of observations. Specifically, if the service level is low, i.e., , then the retailer should order more products and the manufacturer should invest more sustainable effort in the products and both the retailer and manufacturer will gain more profits, when the number of observations increases. However, if the service level is high, i.e., , then the retailer should order less products and the manufacturer should invest less sustainable effort in the products and both the retailer and manufacturer will get less profits, when the number of observations increases. These results imply that it may not be better for both the retailer and manufacturer to obtain more data in the big data era. More number of observations from the data may cause a decrease in the profits.
8. Conclusions
In this paper, we study the sustainable investment for a single manufacturer and single retailer supply chain in the big data era. Facing the environmental tax, the manufacturer will make the sustainable investment to reduce the carbon emission. Facing the uncertain demand, the retailer will consider using the big data technology to improve the demand forecast. Consumers are environmental awareness, so that the manufacturer’s sustainable investment has positive effect on the demand. We consider a Stackelberg game, where the manufacturer is the leader determining the sustainable investment level and the retailer is the follower determining the order quantity of the products. Both the manufacturer’s and retailer’s objectives are to maximize their own profits.
To explore the effects of the big data technology on the sustainable investment strategies and the performance of supply chain, we construct a Bayesian information updating model to study the problem. We first derive the optimal investment level for the manufacturer and the optimal order quantity for the retailer under two cases, i.e., with and without the big data technologies. By comparing the optimal solutions and performance of the manufacturer and retailer under these two cases, we identify the effects of the big data technology. Besides, we also investigate the impact of the number of observations regarding the market information.
In summary, the managerial insights and implication of the main results derived in this paper are as follows:
(1) Service level plays an important role in the impacts of adopting the big data technology. We show that with the big data technology, the manufacturer and retailer should invest a lower sustainable effort and order less products, respectively, than those without the big data technology, if and only if the service level is large, i.e., larger than 0.5. Meanwhile, the service level also affects the manufacturer’s and retailer’s profits when adopting the big data technology. We show that under some conditions the retailer can be better off by using the big data technology no matter the service level is large or small, whereas the manufacturer can be better off with the big data technology only if the service level is small, i.e., smaller than 0.5. It implies that using the big data technology can achieve the Parato improvement when the service level is small. However, in practice such small service level is unlikely to be observed in most cases [40,43]. Therefore, from the perspective of the whole supply chain, the manufacturer and retailer are suggested to sign some contracts, under which the retailer may pay some subsidies to the manufacturer, so that both of them can be better off with the big data technology.
(2) The impacts of the cost parameters on the adoption of big data technology are significant. We show that not only the fixed cost of using the big data technology but also the manufacturer’s sustainable investment cost significantly affects the retailer’s profit of using the big data technology. We identify the conditions, associated with the sustainable investment cost and fixed cost of using the big data technology, under which the retailer is better off by using the big data technology. It implies that the strategy of using the big data technology should be tailored to fit each type of retailers, with the consideration of both the retailer’s fixed cost of using the big data technology and the manufacturer’s sustainable investment cost. We also identify the condition, associated with the unit production cost, under which the manufacturer is better off with the big data technology. The condition for the manufacturer being better off is strict, as the manufacturer can be better off only if the retailer’s service level and the manufacturer’s unit production cost are low enough.
(3) The number of the observations may have positive or negative effects on the optimal decisions and performance of the manufacturer and retailer. In the big data era, by using the big data technology, the retailer can update the demand information very frequently. We show that whether the optimal decisions and performance of the manufacturer and retailer increase or decrease in the number of the observations depends on the value of the service level. The optimal decisions and profits increase in the number of the observations if and only if the service level is low. This result implies that it may not be better for both the retailer and manufacturer to obtain more data in the big data era.
Note that in this paper, we study the problem by considering a general analytical model. For example, we consider a stochastic demand rather than the deterministic demand. And we use a standard approach to build the Bayesian information updating model, which has been used to study the impact of big data in the literature (see e.g., Shen et al. [48] and Choi [50]). Under these general settings, we derive the analytical results. It indicates that the results are robust and may be potentially applied to the similar problems. It is worth noting that for the sustainable investment, we consider a convex investment cost, which is wildly used in the literature (see e.g., Dong et al. [4], Shi et al. [11], Chan et al. [47] and Savaskan and Van Wassenhove [49]). Under this setting, we show that the optimal sustainable effort is determined by the first-order condition of the manufacturer’s objective function. All the comparisons regarding the big data technology are based on this result. Nevertheless, if the sustainable investment cost is linear or concave function, we can show that the manufacturer’s objective function is convex in the sustainable effort, so the optimal sustainable effort is either the lower bound (i.e., zero) or the upper bound (i.e., the ideal level that eliminates all the emissions).
Our study is subject to several limitations which also provide fruitful directions for future research. First, we focus on the theoretical analysis of the research problem by constructing the mathematical model. In future research, we may consider to empirically test the research problem by using some real data. Second, we consider that the wholesale contract is used between the manufacturer and retailer and the wholesale price is pre-determined in the paper. In future research, we may consider the wholesale price as a decision variable in the model, or we may consider that the other contracts, such as revenue sharing and buy-back contracts, are used between two supply chain members. Third, we consider in this paper that only the manufacturer has incentive to invest in the sustainable effort. However, the retailer may also have incentive to do the sustainable investment due to the consumer environmental awareness. It would be interesting to incorporate the retailer’s investment incentive into our model, as a future research direction. Fourth, we consider a manufacturer consisting of one manufacturer and one retailer. In future research, we may investigate the effects of the big data technology in a supply chain with multiple manufacturers or/and multiple retailers. Fifth, we consider in this paper that there is a single type of sustainable products. In future research, we may extend our model to consider multiple types of sustainable products. Finally, we assume that the supply chain members are risk neutral. In future research, it may be interesting to extend our model to consider the effect of the risk attitude on the sustainable investment and the performance of the supply chain.
Acknowledgments
The authors thank the editors and three anonymous reviewers for their constructive comments. This research was supported in part by the National Natural Science Foundation of China (71501097 and 71601187) and the Fundamental Research Funds for the Central Universities (30915013102).
Author Contributions
Yanping Cheng, Yunjuan Kuang, Xiutian Shi and Ciwei Dong developed the model, conducted the analysis and wrote the paper together.
Conflicts of Interest
The authors declare no conflicts of interest.
Appendix A.
Proof of Proposition 1.
Note that given , the retailer’s problem is a newsvendor problem. Thus, we can obtain the optimal order quantity by the first-order condition of Equation (1). □
Proof of Proposition 2.
Substituting the optimal response of the order quantity into the Equation (2) and taking the first and second derivatives of with respect to , respectively, we have
indicating that is concave in , then we can obtain the optimal by the first-order condition, i.e., . □
Proof of Proposition 3.
Similar to the proof of Proposition 1, we can obtain the optimal response of the order quantity. Similar to the proof of Proposition 2, we can obtain the optimal sustainable level. Then by substituting the optimal sustainable level into the optimal response of the order quantity, we have the optimal value of the order quantity. □
Proof of Proposition 4.
To prove the results, we first derive that
Then, we find from Equations (12) and (13) that whether and/or depends on the value of . In addition, we have that if , then ; otherwise, . This completes the proof. □
Proof of Proposition 5.
Note that if , then ; otherwise, . Then the results can be derived by directly comparing and through Equation (14). □
Proof of Proposition 6.
We can obtain the results by directly comparing and through Equation (15). □
Proof of Proposition 7.
Before showing the effects of on the optimal solutions, we show the effect of on . By observing the expression of , we can easily find that is decreasing in , implying that . Then, by taking the first derivative of the optimal decisions and profits with respect to , we can obtain that
Because , , and , then we obtain that whether the above equations are larger than zero depends on the value of : if , then , , > 0 and ; if , then , , and . □
References
- Feng, Q.; Shanthikumar, J.G. How Research in Production and Operations Management May Evolve in the Era of Big Data. Prod. Oper. Manag. 2017. [Google Scholar] [CrossRef]
- Shen, B.; Chan, H.L. Forecast Information Sharing for Managing Supply Chains in the Big Data Era: Recent Development and Future Research. Asia Pac. J. Oper. Res. 2017, 34, 1740001. [Google Scholar] [CrossRef]
- Liu, P.; Yi, S.P. A study on supply chain investment decision-making and coordination in the Big Data environment. Ann. Oper. Res. 2017. [Google Scholar] [CrossRef]
- Dong, C.; Shen, B.; Chow, P.S.; Yang, L.; Ng, C.T. Sustainability investment under cap-and-trade regulation. Ann. Oper. Res. 2016, 240, 509–531. [Google Scholar] [CrossRef]
- Fahimnia, B.; Sarkis, J.; Choudhary, A.; Eshragh, A. Tactical supply chain planning under a carbon tax policy scheme: A case study. Int. J. Prod. Econ. 2015, 164, 206–215. [Google Scholar] [CrossRef] [Green Version]
- Marks & Spencer. Marks & Spencer Plan A Report 2017. Available online: http://planareport.marksandspencer.com/M&S_PlanAReport_2017_FullReport.pdf (accessed on 27 December 2017).
- Shen, B. Sustainable Fashion Supply Chain: Lessons from H&M. Sustainability 2014, 6, 6236–6249. [Google Scholar]
- Choi, T.M.; Chan, H.K.; Yue, X. Recent development in big data analytics for business operations and risk management. IEEE Trans. Cybern. 2017, 47, 81–92. [Google Scholar] [CrossRef] [PubMed]
- Sumbal, M.S.; Tsui, E.; See, E.W.K. Interrelationship between big data and knowledge management: An exploratory study in the oil and gas sector. J. Knowl. Manag. 2017, 21, 180–196. [Google Scholar] [CrossRef]
- Drake, D.; Spinler, S. Sustainable operations management: An enduring stream or a passing fancy? Manuf. Ser. Oper. Manag. 2013, 15, 689–700. [Google Scholar] [CrossRef]
- Shi, X.; Qian, Y.; Dong, C. Economic and Environmental Performance of Fashion Supply Chain: The Joint Effect of Power Structure and Sustainable Investment. Sustainability 2017, 9, 961. [Google Scholar] [CrossRef]
- Letmathe, P.; Balakrishnan, N. Environmental considerations on the optimal product mix. Eur. J. Oper. Res. 2005, 167, 398–412. [Google Scholar] [CrossRef]
- Bouchery, Y.; Ghaffari, A.; Jemai, Z.; Dallery, Y. Including sustainability criteria into inventory models. Eur. J. Oper. Res. 2012, 222, 229–240. [Google Scholar] [CrossRef]
- Zhang, B.; Xu, L. Multi-item production planning with carbon cap and trade mechanism. Int. J. Prod. Econ. 2013, 144, 118–127. [Google Scholar] [CrossRef]
- Chen, X.; Wang, X. Effects of carbon emission reduction policies on transportation mode selections with stochastic demand. Transp. Res. Part E Logist. Transp. Rev. 2016, 90, 196–205. [Google Scholar] [CrossRef]
- Rosič, H.; Jammernegg, W. The economic and environmental performance of dual sourcing: A newsvendor approach. Int. J. Prod. Econ. 2013, 143, 109–119. [Google Scholar] [CrossRef] [Green Version]
- Shen, B.; Li, Q. Impacts of returning unsold products in retail outsourcing fashion supply chain: A sustainability analysis. Sustainability 2015, 7, 1172–1185. [Google Scholar] [CrossRef]
- Guo, Z.; Liu, H.; Zhang, D.; Yang, J. Green supplier evaluation and selection in apparel manufacturing using a fuzzy multi-criteria decision-making approach. Sustainability 2017, 9, 650. [Google Scholar]
- He, Z.; Chen, P.; Liu, H.; Guo, Z. Performance measurement system and strategies for developing low-carbon logistics: A case study in China. J. Clean. Prod. 2017, 156, 395–405. [Google Scholar] [CrossRef]
- Guo, Z.; Zhang, D.; Liu, H.; He, Z.; Shi, L. Green transportation scheduling with pickup time and transport mode selections using a novel multi-objective memetic optimization approach. Transp. Res. Part D Transp. Environ. 2016. [Google Scholar] [CrossRef]
- Benjaafar, S.; Li, Y.; Daskin, M. Carbon footprint and the management of supply chains: Insights from simple models. IEEE Trans. Autom. Sci. Eng. 2013, 10, 99–116. [Google Scholar] [CrossRef]
- Toptal, A.; Özlü, H.; Konur, D. Joint decisions on inventory replenishment and emission reduction investment under different emission regulations. Int. J. Prod. Res. 2014, 52, 243–269. [Google Scholar] [CrossRef] [Green Version]
- Drake, D.F.; Kleindorfer, P.R.; Van Wassenhove, L.N. Technology choice and capacity portfolios under emissions regulation. Prod. Oper. Manag. 2015, 25, 1006–1025. [Google Scholar] [CrossRef]
- Yalabik, B.; Fairchild, R.J. Customer, regulatory, and competitive pressure as drivers of environmental innovation. Int. J. Prod. Econ. 2011, 131, 519–527. [Google Scholar] [CrossRef]
- Liu, Z.L.; Anderson, T.D.; Cruz, J.M. Consumer environmental awareness and competition in two-stage supply chains. Eur. J. Oper. Res. 2012, 218, 602–613. [Google Scholar] [CrossRef]
- Nouira, I.; Frein, Y.; Hadj-Alouane, A.B. Optimization of manufacturing systems under environmental considerations for a greenness-dependent demand. Int. J. Prod. Econ. 2014, 150, 188–198. [Google Scholar] [CrossRef]
- Du, S.; Zhu, J.; Jiao, H.; Ye, W. Game-theoretical analysis for supply chain with consumer preference to low carbon. Int. J. Prod. Res. 2015, 53, 3753–3768. [Google Scholar] [CrossRef]
- Li, Q.; Shen, B. Sustainable Design Operations in the Supply Chain: Non-Profit Manufacturer vs. For-Profit Manufacturer. Sustainability 2016, 8, 639. [Google Scholar] [CrossRef]
- Maletič, M.; Maletič, D.; Dahlgaard, J.J.; Dahlgaard-Park, S.M.; Gomišček, B. Sustainability exploration and sustainability exploitation: From a literature review towards a conceptual framework. J. Clean. Prod. 2014, 79, 182–194. [Google Scholar] [CrossRef]
- Centobelli, P.; Cerchione, R.; Esposito, E. Developing the WH2 framework for environmental sustainability in logistics service providers: A taxonomy of green initiatives. J. Clean. Prod. 2017, 165, 1063–1077. [Google Scholar] [CrossRef]
- Kohtala, C. Addressing sustainability in research on distributed production: An integrated literature review. J. Clean. Prod. 2015, 106, 654–668. [Google Scholar] [CrossRef]
- Tian, X. Big data and knowledge management: A case of déjà vu or back to the future? J. Knowl. Manag. 2017, 21, 113–131. [Google Scholar] [CrossRef]
- Khan, Z.; Khan, Z.; Vorley, T.; Vorley, T. Big data text analytics: An enabler of knowledge management. J. Knowl. Manag. 2017, 21, 18–34. [Google Scholar] [CrossRef]
- Centobelli, P.; Cerchione, R.; Esposito, E. Knowledge management systems: The hallmark of SMEs. Knowl. Manag. Res. Pract. 2017, 15, 294–304. [Google Scholar] [CrossRef]
- Centobelli, P.; Cerchione, R.; Esposito, E. Aligning enterprise knowledge and knowledge management systems to improve efficiency and effectiveness performance: A three-dimensional Fuzzy-based decision support system. Expert Syst. Appl. 2018, 91, 107–126. [Google Scholar] [CrossRef]
- O’Connor, C.; Kelly, S. Facilitating knowledge management through filtered big data: SME competitiveness in an agri-food sector. J. Knowl. Manag. 2017, 21, 156–179. [Google Scholar] [CrossRef]
- See-To, E.W.; Ngai, E.W. Customer reviews for demand distribution and sales nowcasting: A big data approach. Ann. Oper. Res. 2016, 1–17. [Google Scholar] [CrossRef]
- Arunachalam, D.; Kumar, N.; Kawalek, J.P. Understanding big data analytics capabilities in supply chain management: Unravelling the issues, challenges and implications for practice. Transp. Res. Part E Logist. Transp. Rev. 2017. [Google Scholar] [CrossRef]
- Guha, S.; Kumar, S. Emergence of Big Data Research in Operations Management, Information Systems, and Healthcare: Past Contributions and Future Roadmap. Prod. Oper. Manag. 2017. [Google Scholar] [CrossRef]
- Iyer, A.V.; Bergen, M.E. Quick response in manufacturer-retailer channels. Manag. Sci. 1997, 43, 559–570. [Google Scholar] [CrossRef]
- Choi, T.M.; Li, D.; Yan, H. Optimal two-stage ordering policy with Bayesian information updating. J. Oper. Res. Soc. 2003, 54, 846–859. [Google Scholar] [CrossRef]
- Wu, J. Quantity flexibility contracts under Bayesian updating. Comput. Oper. Res. 2015, 32, 1267–1288. [Google Scholar] [CrossRef]
- Choi, T.M.; Chow, P.S. Mean-variance analysis of quick response program. Int. J. Prod. Econ. 2008, 114, 456–475. [Google Scholar] [CrossRef]
- Yang, D.; Choi, T.M.; Xiao, T.; Cheng, T.C.E. Coordinating a two-supplier and one-retailer supply chain with forecast updating. Automatica 2011, 47, 1317–1329. [Google Scholar] [CrossRef]
- Chan, H.L.; Choi, T.M.; Hui, C.L.; Ng, S.F. Quick response healthcare apparel supply chains: Value of RFID and coordination. IEEE Trans. Syst. Man Cybern. Syst. 2015, 45, 887–900. [Google Scholar] [CrossRef]
- Choi, T.M. Local sourcing and fashion quick response system: The impacts of carbon footprint tax. Transp. Res. Part E Logist. Transp. Rev. 2013, 55, 43–54. [Google Scholar] [CrossRef]
- Chan, H.L.; Shen, B.; Cai, Y. Quick response strategy with cleaner technology in a supply chain: Coordination and win-win situation analysis. Int. J. Prod. Res. 2017, 1–12. [Google Scholar] [CrossRef]
- Shen, B.; Choi, T.M.; Chan, H.L. Selling green first or not? A Bayesian analysis with service levels and environmental impact considerations in the Big Data Era. Technol. Forecast. Soc. Chang. 2017. [Google Scholar] [CrossRef]
- Savaskan, R.C.; Van Wassenhove, L.N. Reverse channel design: The case of competing retailers. Manag. Sci. 2006, 52, 1–14. [Google Scholar] [CrossRef]
- Choi, T.M. Quick response fashion supply chains in the big data Era. In Optimization and Control for Systems in the Big-Data Era; Choi, T.M., Gao, J., Lambert, J.H., Ng, C.-K., Eds.; International Series in Operations Research & Management Science; Springer: New York, NY, USA, 2017; pp. 253–267. [Google Scholar]
- Pratt, J.W.; Raiffa, H.; Schlaifer, R. Introduction to Statistical Decision Theory; MIT Press: Cambridge, MA, USA, 1995. [Google Scholar]
Figure 1.
The relationships of and . (a) r ≤ 0.5; (b) r > 0.5.

Figure 2.
The relationships of and .


Table 1.
Positioning of this paper in the literature.
| Papers | Sustainability Issues | Big Data Applications | Bayesian Information Updating | ||
|---|---|---|---|---|---|
| Carbon Emission | Sustainable Investment | Consumer Environment Awareness | |||
| Letmathe and Balakrishnan [12], Bouchery et al. [13], Rosič and Jammernegg [16], Zhang and Xu [14], Shen and Li [17], Chen and Wang [15] | √ | ||||
| Benjaafar et al. [21], Toptal et al. [22], Drake et al. [23] | √ | √ | |||
| Yalabik and Fairchild [24], Liu et al. [25], Nouira et al. [26], Du et al. [27], Li and Shen [28], Dong et al. [4], Shi et al. [11] | √ | √ | √ | ||
| Feng and Shanthikumar [1], Liu and Yi [3], See-To and Ngai [37] | √ | ||||
| Iyer and Bergen [40], Choi et al. [41], Wu [42], Choi and Chow [43], Yang et al. [44], Chan et al. [45] | √ | ||||
| Choi [46] | √ | √ | |||
| Chan et al. [47] | √ | √ | √ | ||
| Shen et al. [48] | √ | √ | √ | ||
| This paper | √ | √ | √ | √ | √ |
Table 2.
Notations.
| Notation | Meaning |
|---|---|
| Unit retail price of the products | |
| Unit wholesale price of the products | |
| Unit production cost of the products | |
| Unit salvage price of the unsold products | |
| Service level, i.e., | |
| Sustainable level of the products | |
| Sensitivity parameter of environmental tax reduction by the sustainable investment | |
| Coefficient of investment cost | |
| Sensitivity parameter of the effect of the sustainable level on the demand | |
| Demand function of the products | |
| Forecasted base demand of the product at Stage 0, a random variable | |
| Forecasted base demand of the product at Stage 1, a random variable | |
| Number of the market observation | |
| Mean of market observation | |
| Order quantity of the products | |
| Fixed cost of using the big data technology | |
| Retailer’s expected profit | |
| Manufacturer’s profit |
© 2018 by the authors. Licensee MDPI, Basel, Switzerland. This article is an open access article distributed under the terms and conditions of the Creative Commons Attribution (CC BY) license (http://creativecommons.org/licenses/by/4.0/).
Share and Cite
MDPI and ACS Style
Cheng, Y.; Kuang, Y.; Shi, X.; Dong, C. Sustainable Investment in a Supply Chain in the Big Data Era: An Information Updating Approach. Sustainability 2018, 10, 403. https://0-doi-org.brum.beds.ac.uk/10.3390/su10020403
AMA Style
Cheng Y, Kuang Y, Shi X, Dong C. Sustainable Investment in a Supply Chain in the Big Data Era: An Information Updating Approach. Sustainability. 2018; 10(2):403. https://0-doi-org.brum.beds.ac.uk/10.3390/su10020403
Chicago/Turabian StyleCheng, Yanping, Yunjuan Kuang, Xiutian Shi, and Ciwei Dong. 2018. "Sustainable Investment in a Supply Chain in the Big Data Era: An Information Updating Approach" Sustainability 10, no. 2: 403. https://0-doi-org.brum.beds.ac.uk/10.3390/su10020403
Note that from the first issue of 2016, this journal uses article numbers instead of page numbers. See further details here.