1. Introduction
As the focus on sustainable construction increases in North America, one of the most notable environmental impacts comes from CO
2 emissions during cement production. After power generation and transportation, the manufacture of cement is the third largest source of carbon emissions in the United States, and is responsible for approximately 5% of global CO
2 emissions [
1]. Replacing a portion of the ordinary Portland cement (OPC) with pozzolans, or environmentally friendly filler materials, can reduce the environmental effects. By optimizing the mixture design, both the cost and the environmental impact of concrete can be reduced [
2].
Limestone, also known as calcium carbonate (CaCO
3), has long been used as a critical component in all aspects of concrete. By replacing part of the cement with limestone powder, it provides additional surface for precipitation of hydration products, while decreasing the amount of water needed to maintain concrete workability [
3]. Lothenbach et al. [
4] reported blending ordinary cement with limestone was found to accelerate the initial hydration reaction, while influencing the hydrate assemblage of the cement pastes. This enhances the hydration of the clinker by the filler effect, rather than its influence on the chemistry, indicating that limestone powder has little effect on the temperature of the fresh properties of concrete. Limestone powder, however, is not entirely an inert filler. While there is a slight interaction between tricalcium silicate (C
3S) and CaCO
3, there is no pozzolanic reaction and does not produce calcium silicate hydrate (CSH) gel [
5]. The particle size of limestone powder in the binder phase of a mixture improves particle packing efficiency, which leads to improved blocking of capillary pores and reduced penetrability. This then results in a lower water demand due to reduced bleeding of water, thereby improving workability and durability [
6]. Palm et al. [
7] and Lollini et al. [
8] also reported that a lower water-cement ratio is the main parameter in cement with high limestone content, which leads to higher solid volume and lower porosity in the concrete. Matschei et al. [
9] found that the ettringite formation derived from the reaction of sulfoaluminate with water and calcium hydroxide increases the molar volume of paste solids and can magnify the space-filling properties of paste. This could lead to a reduction of porosity and permeability of the paste.
Separate grinding of the limestone and clinker provides greater opportunity to optimize particle size distribution, and can be incorporated into concrete like other pozzolans. This process is an alternative to inter-grounding the limestone with the cement in which the limestone powder can be mixed in with the concrete while batching.
Fly ash is widely used as a cement replacement because of its cementitious and pozzolanic properties. From 2009 to 2015, power generation from coal as a fuel has been reduced by 12% in the United States [
10]. As the use of natural gas for power generation and green energy gains popularity, there has been a reduction in the availability of fly ash as less coal is burned at power plants. Therefore, an alternative is needed for cement replacements due to the inefficiency in the manufacture of cement. The release of CO
2 in cement production is primarily due to the calcination of the limestone. Approximately 1.6 metric tons of raw materials are essential to produce one metric ton of cement [
11]. An estimated 40% of raw materials are lost in the formation, but the environmental effect can be lowered by employing limestone powder as a replacement for cement. However, this reduction effect will vary based on particle size of the limestone powder used as fine limestone powder, which requires extra milling. Limestone powder with a particle size of 8 µm produces about 24.5 kg of CO
2 per ton, whereas finer particles (4.5 µm) produce approximately 90.7 kg of CO
2 per ton [
12]. This amounts to 3.4–12.5% of CO
2 emissions compared to emissions producing one ton of cement, making it sustainable as the major environmental impact of concrete comes from the CO
2 emissions during cement production.
Many models describe the relationships between mix composition and property of compressive strength of the concrete. However, the mix composition of concrete does not only include cement since more materials are used to replace cement in concrete. Cement concentrations are still a major factor that determine compressive strength. There are multiple popular models, such as Féret’s equation, Bolomey’s formula, and Abrams’ formula that focus on the relationship between water, cement and the compressive strength. These can also be used as predictive models based on water and cement content to predict compressive strength. F. de Larrard [
13] documents the accuracy of these models and compares them to the same data sets. The volumetric approach by Rene Féret’s model incorporates more elements of concrete that determine the strength [
14]. To isolate the efficiency of limestone powder in concrete, an extension of Féret’s equation can be used because it takes the air content into account, and has a mathematical form that is physically justified by the use of absolute volume.
As urban expansion grows, the increasing demand for concrete may exceed cement production’s capacity. The use of supplementary material in concrete to replace portions of cement is important to meet demand and reduce the environmental impact of cement production. With fly ash supplies decreasing, an alternate cement replacement is needed. While most research focuses on inter-ground limestone, this study focuses on the efficiency and feasibility that CaCO3, or limestone powder, can be used as a cement replacement while batching concrete. The use of limestone powder during the batching process will be investigated for the mechanical and environmental effects the particle size and replacement level have on concrete efficiency for optimal performance.
3. Test Results and Discussion
3.1. Fresh Concrete Properties
A slump test was conducted to assess the workability of the concrete in its fresh state. The presence of limestone powder in the concrete slightly increased the slump.
Table 2 and
Table 3 present the density of the fresh limestone powder concrete affecting compressive strength. The difference in the specific gravity of cement and limestone powder determines the decrease in density [
20].
Table 2 and
Table 3 show the density is not affected significantly by replacing the cement with limestone powder, but the compressive strength is affected significantly. The air content of fresh concrete comprised with limestone powder is significant due to its relationship with durability and porosity. The test results for air content indicated there is no modification with any air entraining admixtures. The air content decreases slightly with higher levels of limestone powder content in the concrete, demonstrating that the existence of limestone powder in concrete has a positive effect on durability and porosity.
3.2. Hardened Concrete Properties
3.2.1. Concrete Compressive Strength
Compressive strength indicates a satisfactory quality of concrete associated with the structure of the hydrated cement paste.
Table 3 represents the compressive strength results of diverse mixes with the limestone powder replacement at the ages of 1, 7, 14, 28, and 90 days. For these mixes, the compressive strength increased from 11.9 psi to 52 psi.
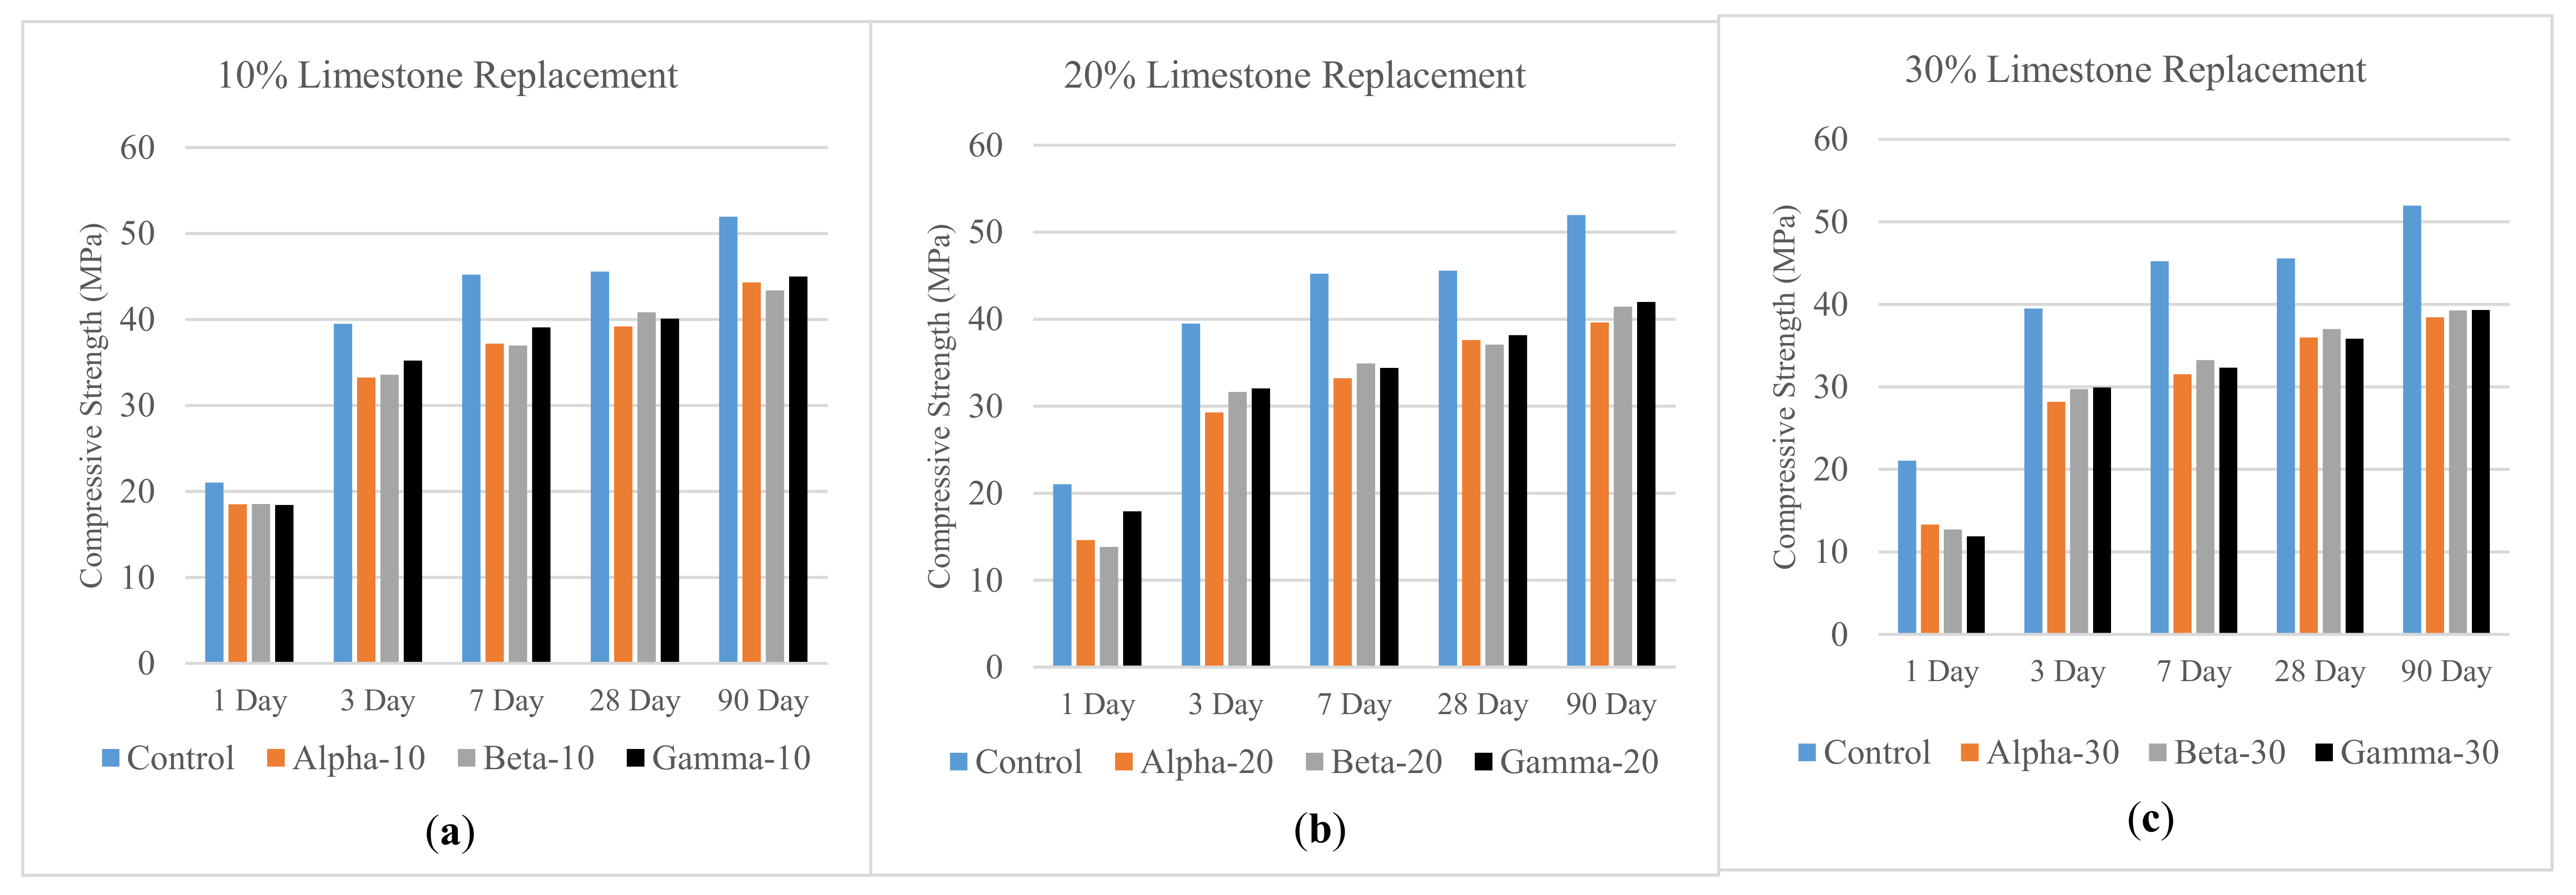
The effect of the limestone powder’s particle size on compressive strength with a 10% replacement is illustrated in
Figure 2a. In a 10% replacement with limestone powder, the compressive strength psi ranges varied from 18.4 to 18.5, 33.2 to 35.2, 37 to 39.1, 39.2 to 40.1, and 43.4 to 45, at the age of 1, 3, 7, 28, and 90 days, respectively. A similar trend was observed with a 20% replacement of cement as shown in
Figure 2b, in which the compressive strength psi ranges varied from 13.8 to 17.9, 29.3 to 32.1, 33.2 to 34.4, 37.1 to 38.2, and 39.6 to 42, at 1, 3, 7, 28, and 90 days, respectively.
Likewise, the test results of a 30% replacement with limestone powder shown in
Figure 2c illustrate the compressive psi strengths varying from 11.9 to 13.3, 28.2 to 29.9, 31.5 to 33.2, 35.8 to 37.0, and 38.4 to 39.3, at 1, 3, 7, 28, and 90 days, respectively. This data demonstrates that the particle size of the limestone powder has an insignificant effect on strength, even with a larger volume of limestone powder in the concrete, as shown in
Figure 2.
3.2.2. Concrete Splitting Tensile Strength and Flexural Strength
The modulus of rupture and splitting tensile strength for concrete was calculated after an aging period of 28 days.
Table 4 illustrates the calculated average MPa from three specimens that were tested to failure for the splitting tensile strength and flexural strength.
The splitting tensile strength results in
Table 4 range from 3.14 MPa to 3.44 MPa, decreasing as the limestone powder increased. The adverse effects of the limestone powder are less significant in the strength than the compressive strength. As 10% replacement of cement reduced the splitting tensile strength on average by 5%, a 20% replacement reduced the strength by 10%, and an average of 12% reduction was observed with a 30% replacement. The limestone powder particle size has little influence on the splitting tensile strength.
Figure 3 compares the splitting tensile strength and flexural strength of various levels and particle sizes of limestone powder in concrete. The results demonstrate that the replacement of limestone powder is related to tensile and flexural strength, and that increasing the replacement decreases tensile and flexural strength. Comparatively, the particle size of the limestone powder in concrete has less effect on tensile and flexural strength.
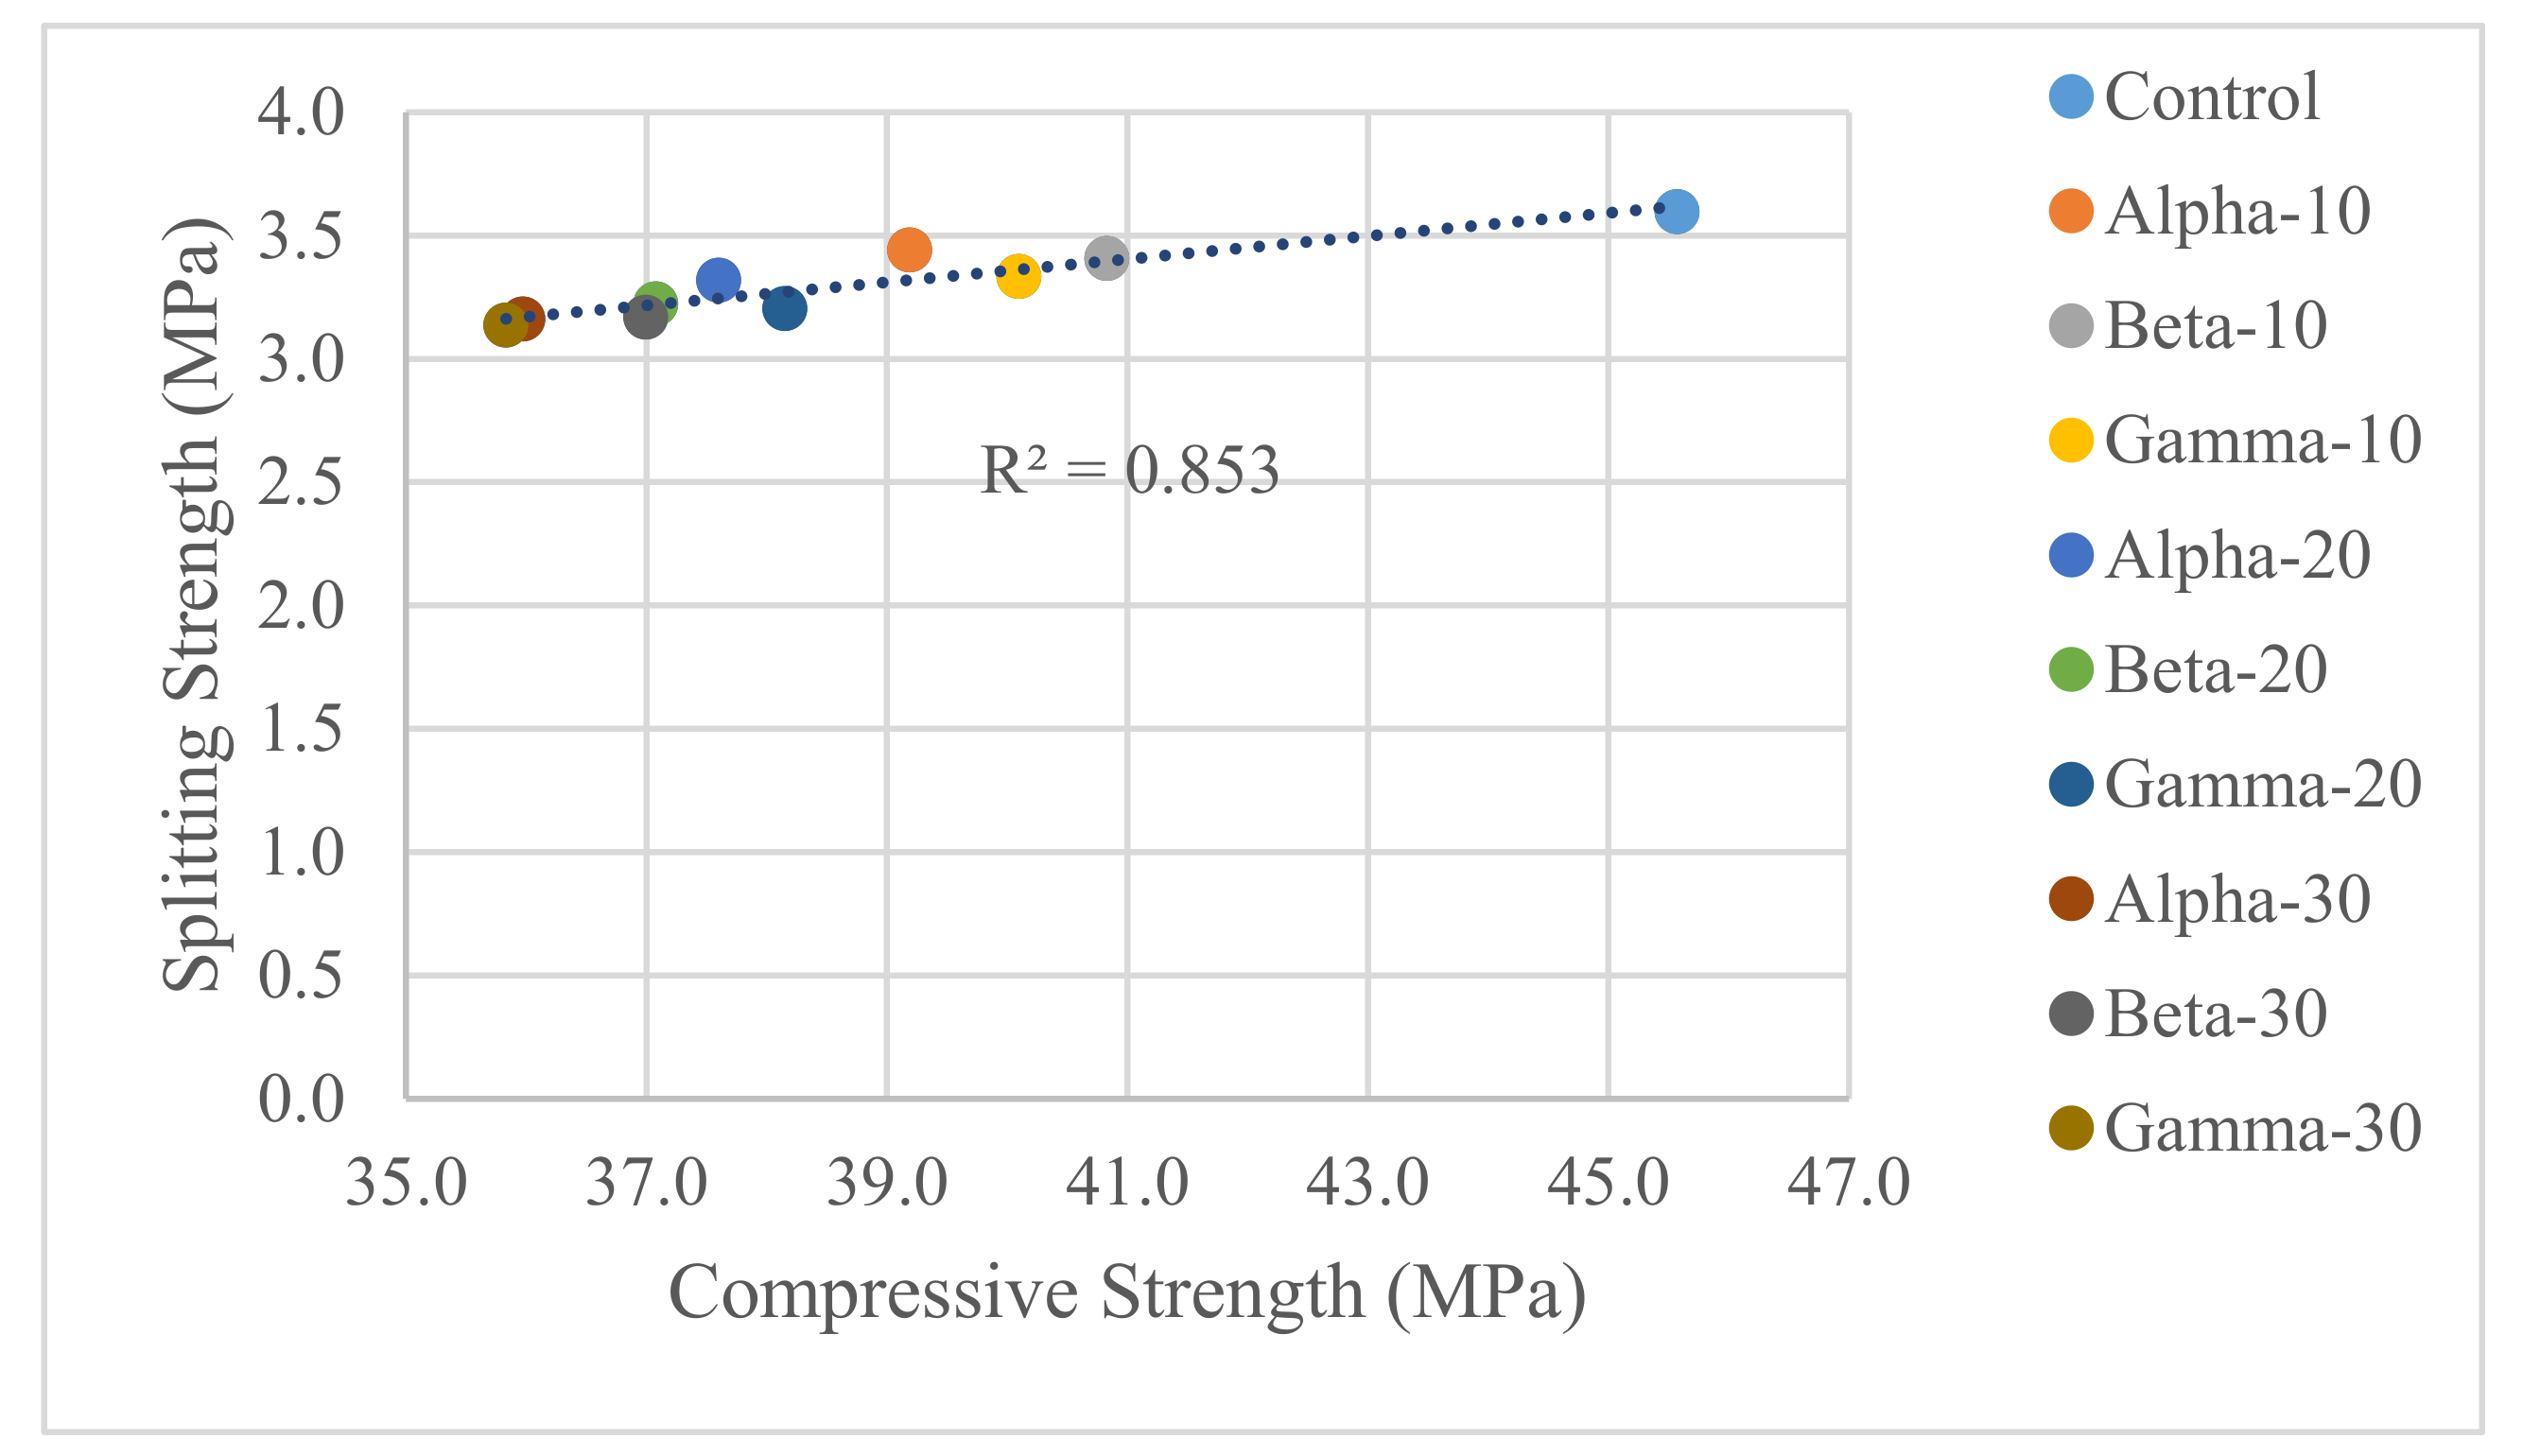
The correlation to the compressive strength is important because it can be used to estimate the splitting tensile strength.
Figure 4 shows the correlation relation between the splitting tensile strength and compressive strength, with a R-square of 0.85. The splitting tensile strength with limestone powder is, on average, 8.6% of the concrete compressive strength, about a 1% increase over the control.
A graphical representation of compressive strength versus flexural strength is shown in
Figure 5. The flexural strength when replaced by limestone powder ranged from 12% to 14.2% in compressive strength, with the control in a similar range of 13.4%.
Figure 5 also illustrates that the R-square for this relationship is 0.86. The data obtained indicates that there is a statistically important relationship between the modulus of rupture and the compressive strength of concrete. Findings from the correlation results indicate the compressive strength could be used to estimate both splitting tensile strength and the flexural strength of concrete with limestone powder.
3.2.3. Drying Shrinkage
Three specimens of drying shrinkage were measured at 7, 14, 21, and 28 days in accordance with ASTM C596 [
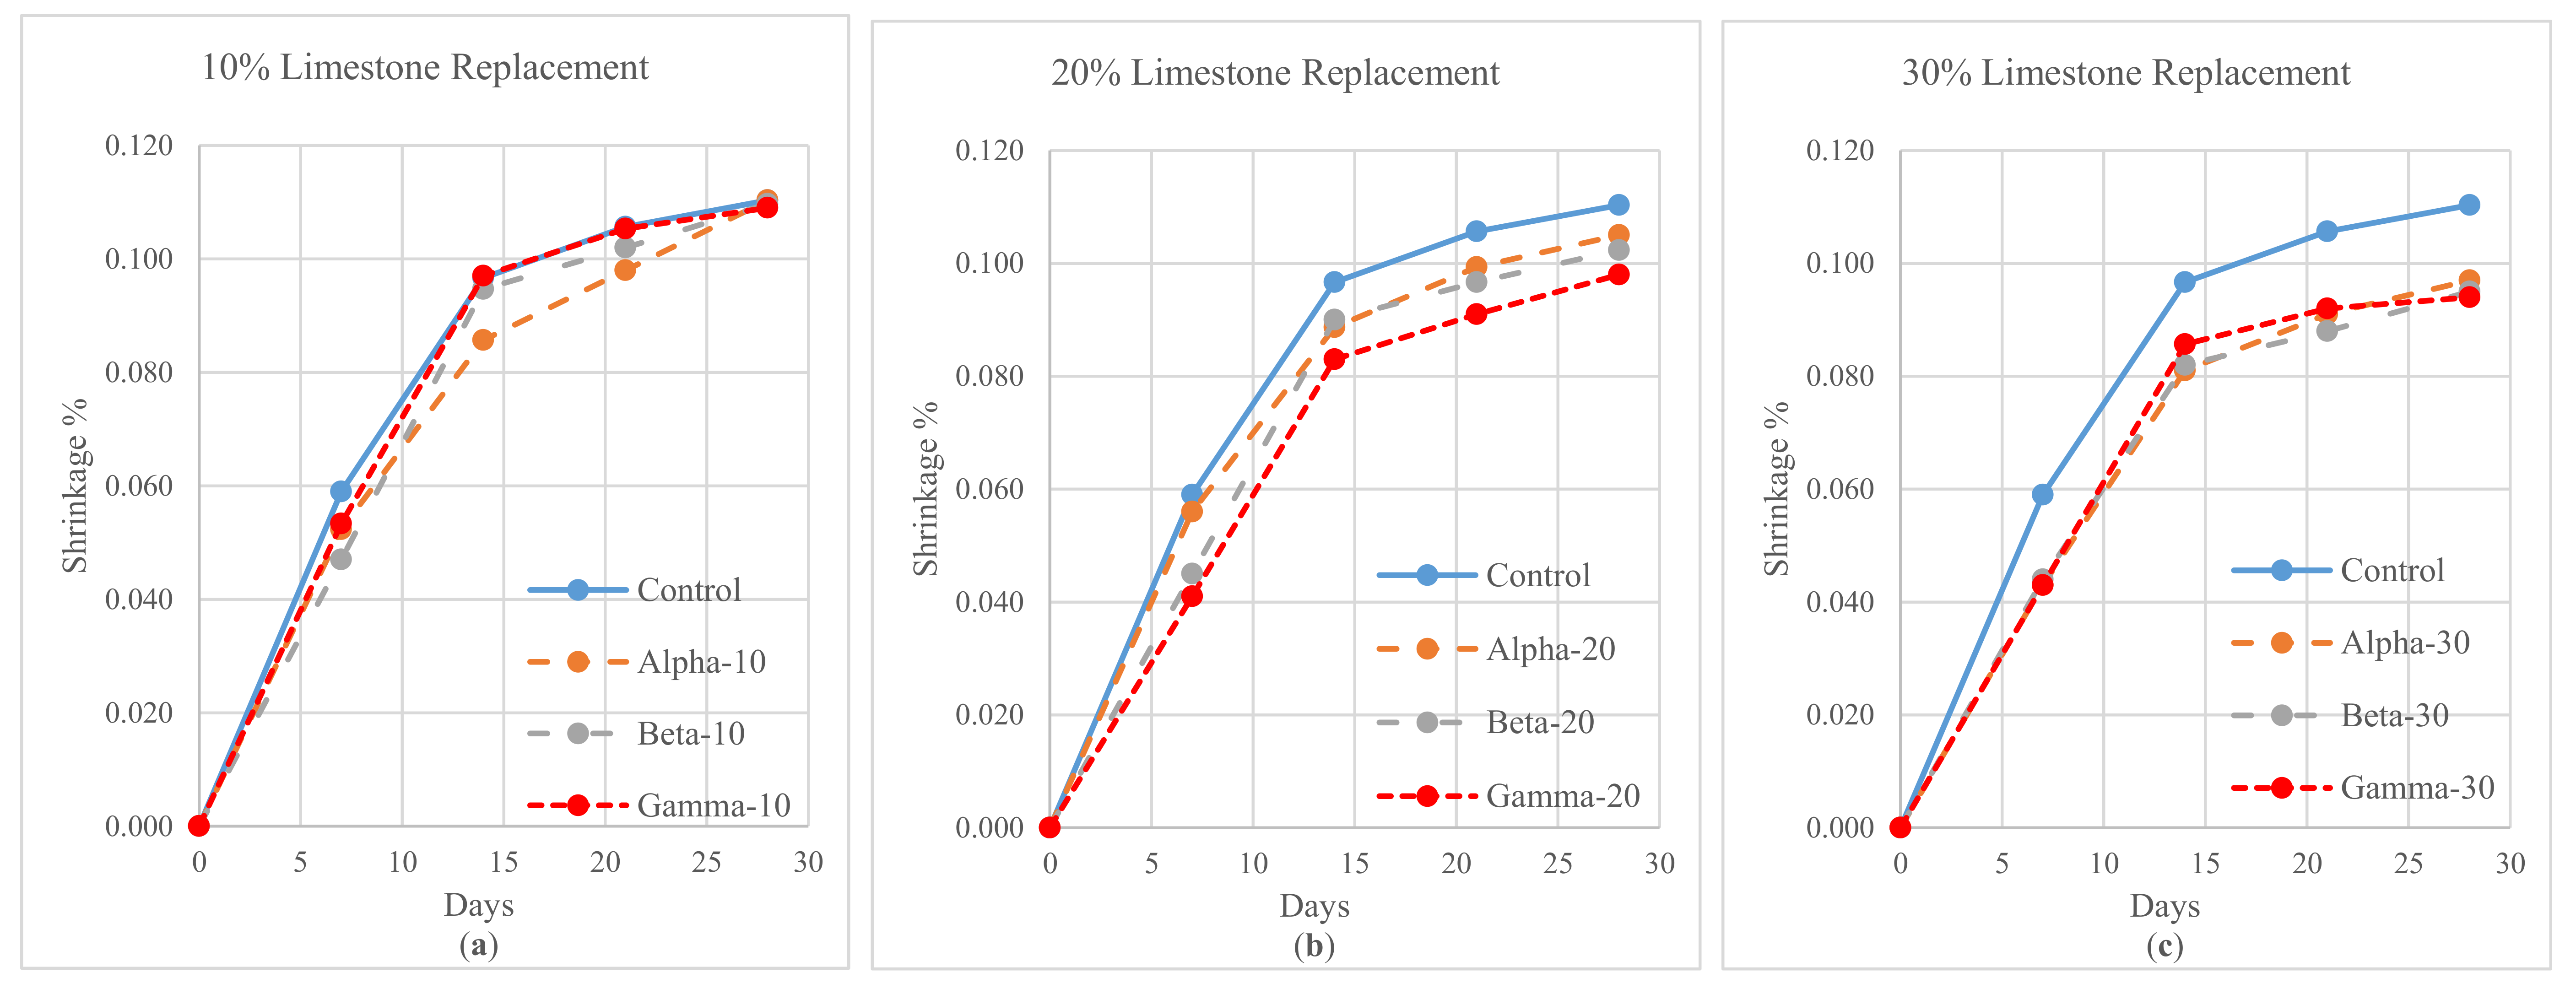
21]. Drying shrinkage is an important physical property that influences the structure of concrete and mortar, and is more substantial in the early stages of the cement hydration process. The test results indicated various shrinkage readings ranging from 0.041% to 0.11%, as shown in
Table 5.
Figure 6a illustrates shrinkage with a 10% replacement of limestone powder versus the control mix, which decreases the shrinkage at early ages. The shrinkage is not significantly changed at 28 days, and is not affected by the size of the limestone particle.
Figure 6b indicates that shrinkage with a 20% replacement decreases approximately 0.008% at an early age and at 28 days, in comparison to the control mix. Similarly, a 30% replacement decreases shrinkage significantly by 0.015% at 28 days, as shown in
Figure 6c.
3.2.4. Statistical Significance
Particle size of limestone powder was further studied to analyze its effects on concrete, and compressive strength was evaluated for statistical importance using the analysis of variance (ANOVA) method at 28 and 90 days. In order to determine the significance of the calculated variation, the need for ANOVA was vital. This method involved the total variation in the results caused by random variations by each factor with a conventional level of significance of 0.05. This methodology tested the supposition of whether particle size of limestone had an influence on concrete strength.
Table 6 and
Table 7 illustrate the effect that particle size and replacement percentage had on compressive strength.
This approach was used to test whether the particle size had an effect on the compressive strength of concrete at 28 as hypothesis H0, or had no effect on compressive strength as hypothesis H1. The F-values and P-values for the ANOVA of the concrete strength positively supported the null hypothesis with values of 2.85 > 3.55. Thus, limestone particle had no considerable effect on the compressive strength of concrete at a level of 0.05, and since 16.60 > 3.55, the null hypothesis was rejected. Therefore, the replacement percentage of limestone powder does have a significant effect on compressive strength of concrete.
Test results of the 90-day compressive strength of concrete follow the same approach as the hypotheses that are tested for the 28-day results.
Table 7 represents results that are the same as the 28-day results. Since
1.94 > 3.55, the null hypothesis is not rejected. Thus, particle size does not significantly affect the compressive strength of concrete at ages that are tested at a level of 0.05. Because 31.62 > 3.55, the null hypothesis is rejected as in the other tests. The replacement percentage of limestone powder does significantly affect compressive strength in concrete at all ages that are tested.
3.3. Petrographic Analysis
3.3.1. Visual Examination
The use of a petrographic examination gives a visual analysis of the how the limestone powder affects the concrete. On concrete thin sections on 24 mm × 46 mm slides of 20% limestone powder in 4.5 µm, 8 µm, 15 µm particle sizes, the control shows a distinct visual difference. Visual comparison of the samples of the cement paste can also be used to determine if there is a reaction between the cement and limestone powder by the formation of calcium silicate hydrate gel. These images are two-dimensional representations of concrete, but can give insight to the structure and composition of a volumetric product.
Figure 7 shows an image of the control sample that contains no additional limestone powder. The image focuses on the cement paste with the majority of the area as calcium–silicate–hydrates and calcium hydroxide reacted. There is a small presence of limestone, due to both the coarse and fine aggregates, as well as a significant visual difference between the control and the concrete with the addition of limestone powder.
Figure 7 shows how the 4.5 µm limestone particles are distributed relatively evenly within the cement paste. The affluent presence of the limestone particles indicates that a chemical reaction between the cement and limestone powder is minimal.
Figure 7 shows the 8 µm limestone particles in the cement paste. While some particles are slightly bigger, it is visually similar to that of the 4.5 µm limestone particles, and still fairly evenly distributed and easily identified. The visual results from 15 µm limestone particles is expressively different with large limestone particles present in the cement paste. However, distribution of limestone particles is still similar within all samples containing limestone powder. Most of the particles are relatively small with a few larger particles between the paste. This might be an indication as to why the particle size does not have a significant effect on the mechanical properties. And unlike smaller cement particles that tend to react more rapidly, there is no visual chemical reaction. If there had been additional formation of calcium silicate hydrate gel, the images would have had a similar visual representation to that of the control.
3.3.2. Particle Size Analysis with Imaging Software 370e
The 24 mm × 46 mm × 30 µm thin concrete slide images are obtained using a Leica D2500P petrographic microscope with polarizing light and analyzing filters. Each slide is used to capture three 476 × 357 µm images at magnification 200, with focus on the cement paste. Each image is analyzed using ImageJ, a public domain Java image processing program that can display, edit, analyze, and process images. Based on the user-defined selections and thresholds, it can count and calculate areas based on the pixel color values. Each image is analyzed selecting color threshold values of hue, saturation, and brightness that isolate the limestone particles. The values are applied to all images and processed to analyze the limestone particle to produce a count, area of the particle, and the mean color. A sample of the cement paste that does not visually contain aggregates within each image is also analyzed for the percentage of the area that is occupied by limestone particles. This is used as a reference for the particle distribution in the area because all samples contain 20% limestone powder.
Table 8 shows the collected data from each image that was analysed. As expected, the concrete with finer limestone powder has a higher count of particles within the sample, and less particles counted as the size of the limestone particles are increased. For each particle count, an average area in µm
2 is also calculated. Based on the area, an estimated particle size or average diameter can be determined. The area of the particle occupation within the paste is consistent in all the images, and is slightly less than 20%. The slight decrease below 20% of the area occupation might be an indication that a small percentage of particles might have a chemical reaction with the cement, but the decrease is most likely due to the small sample size and image distortions.
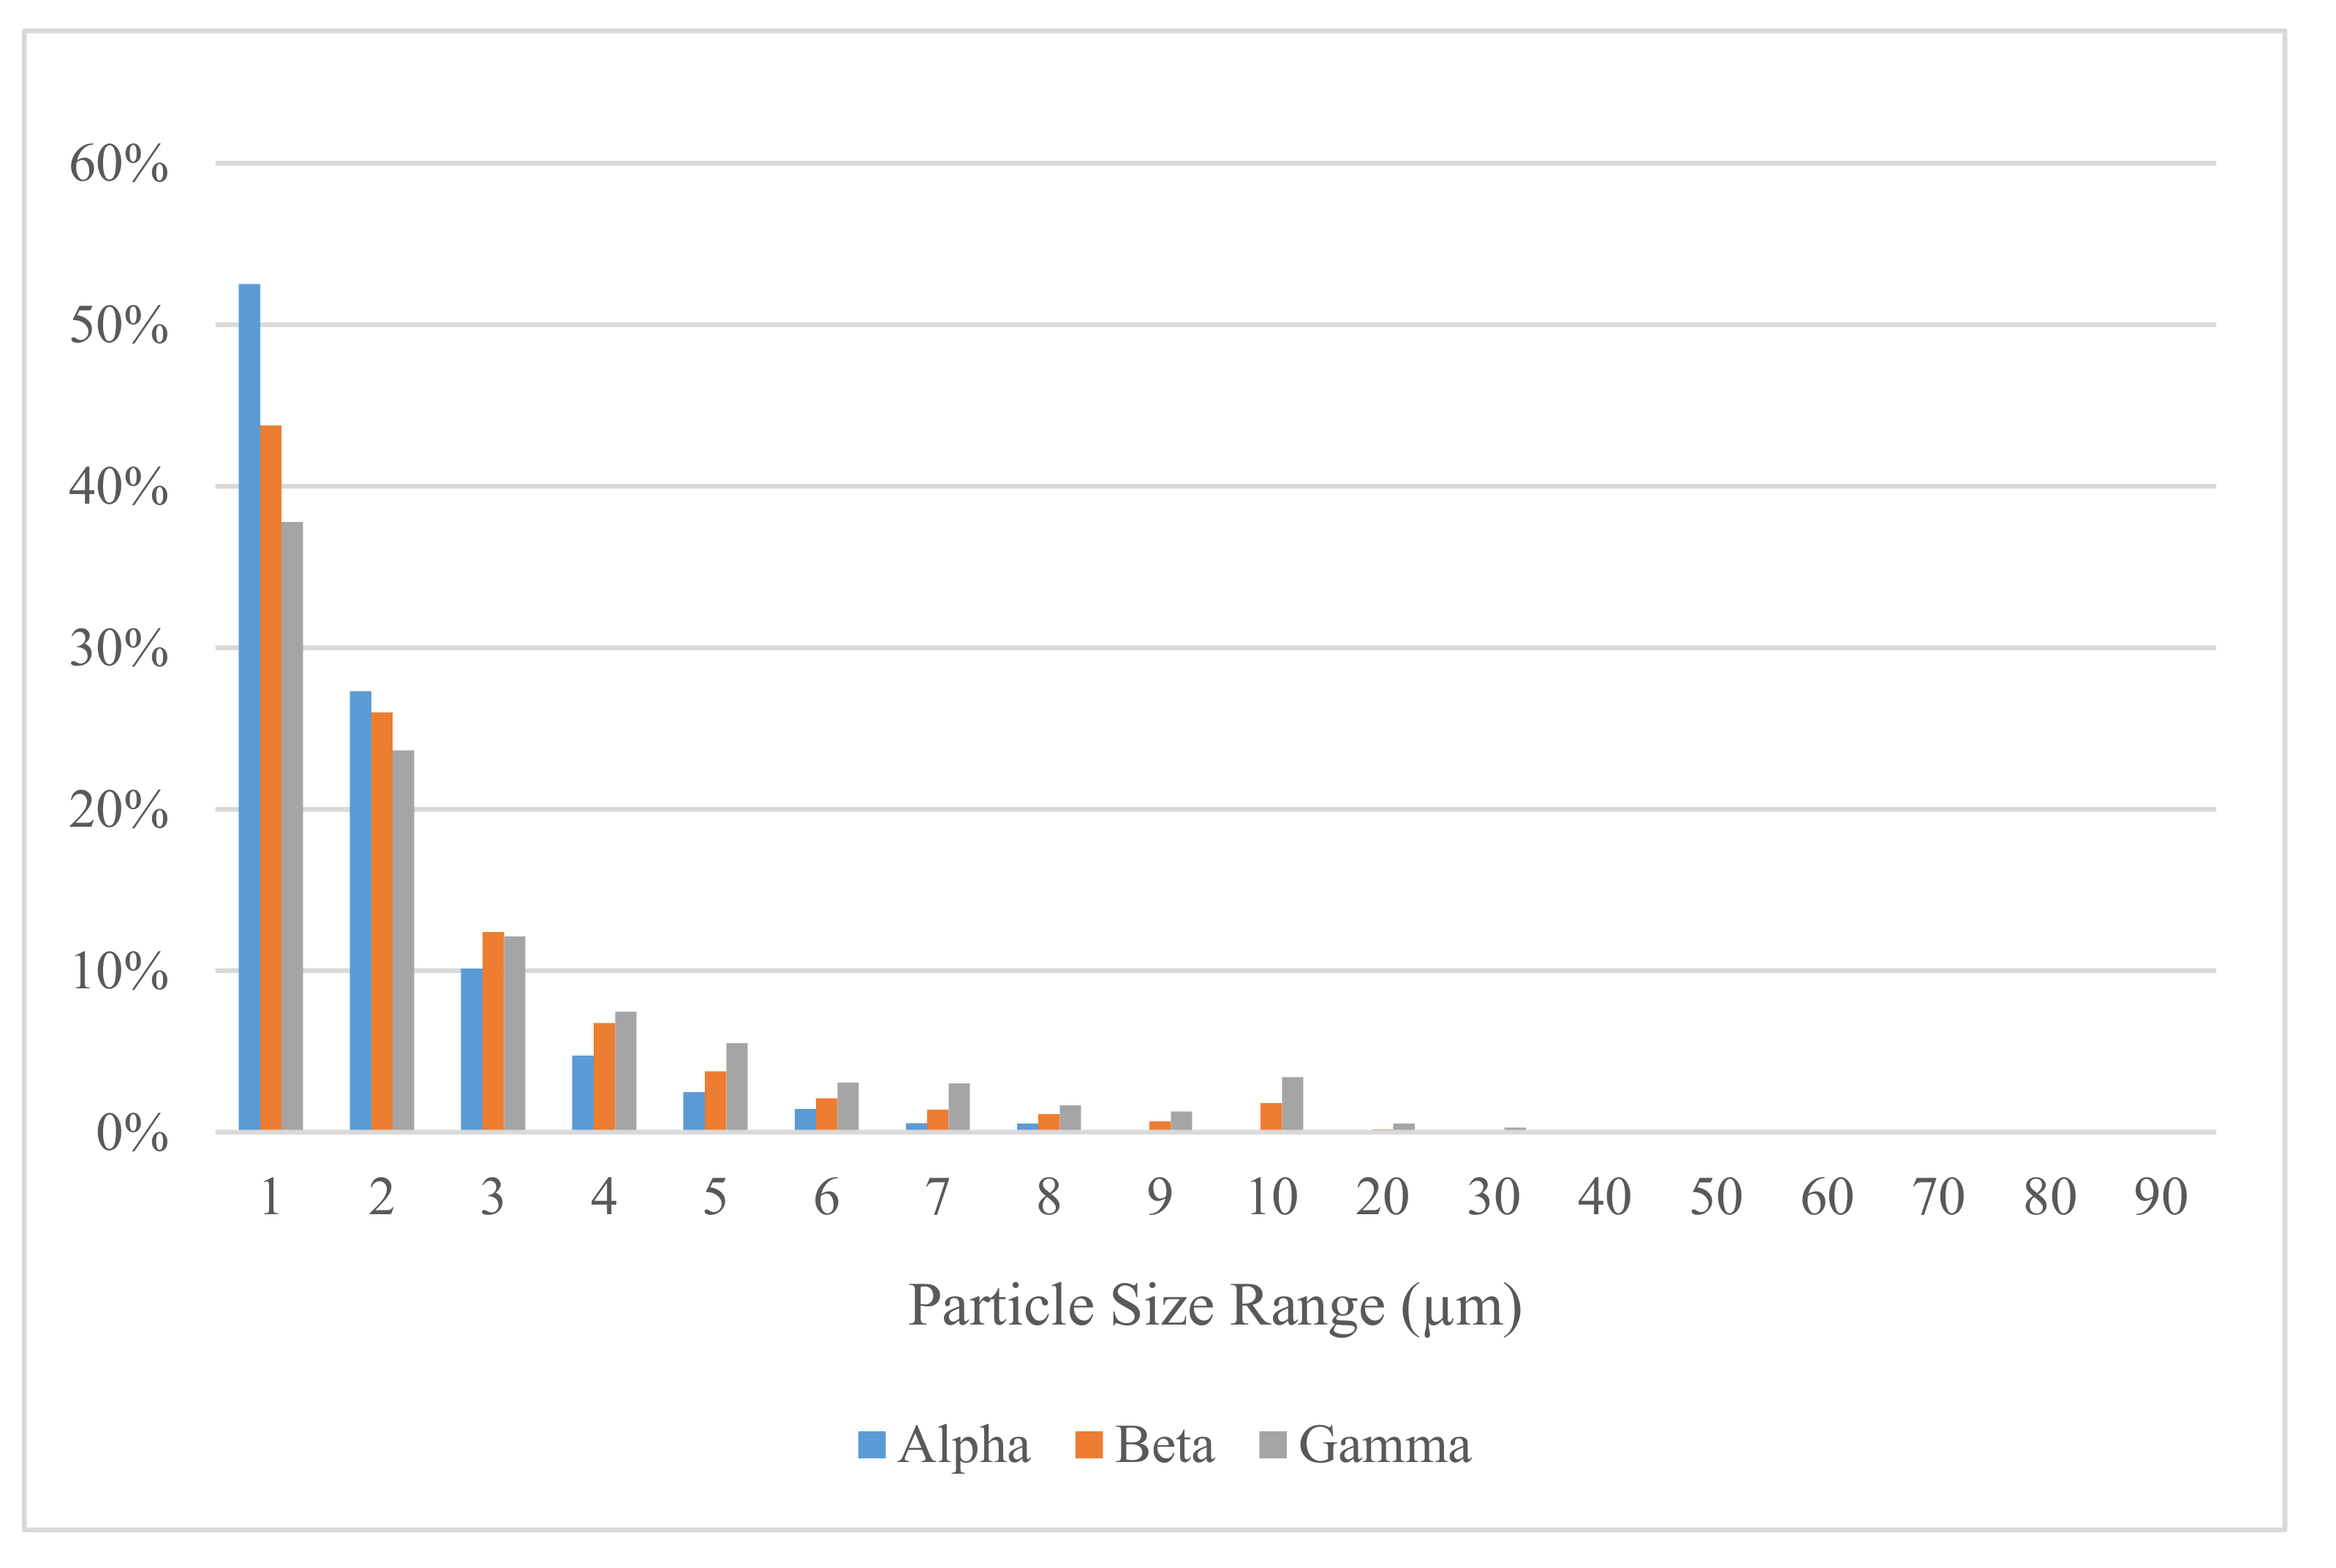
Table 8 shows that the average diameter of all particles counted is less than the nominal size. This is most likely due to the two-dimensional view that displays a section of the particle, and most particles are very fine as shown in
Figure 8. Even though the gamma particles do contain larger particles, the percentage of particles larger the 10 µm is less than 5%.
Figure 8 shows that the distribution of the particles by size is comparable and might explain why particle size has little effect on the mechanical properties.
3.3.3. Particle Distribution of Particle Size by Mass
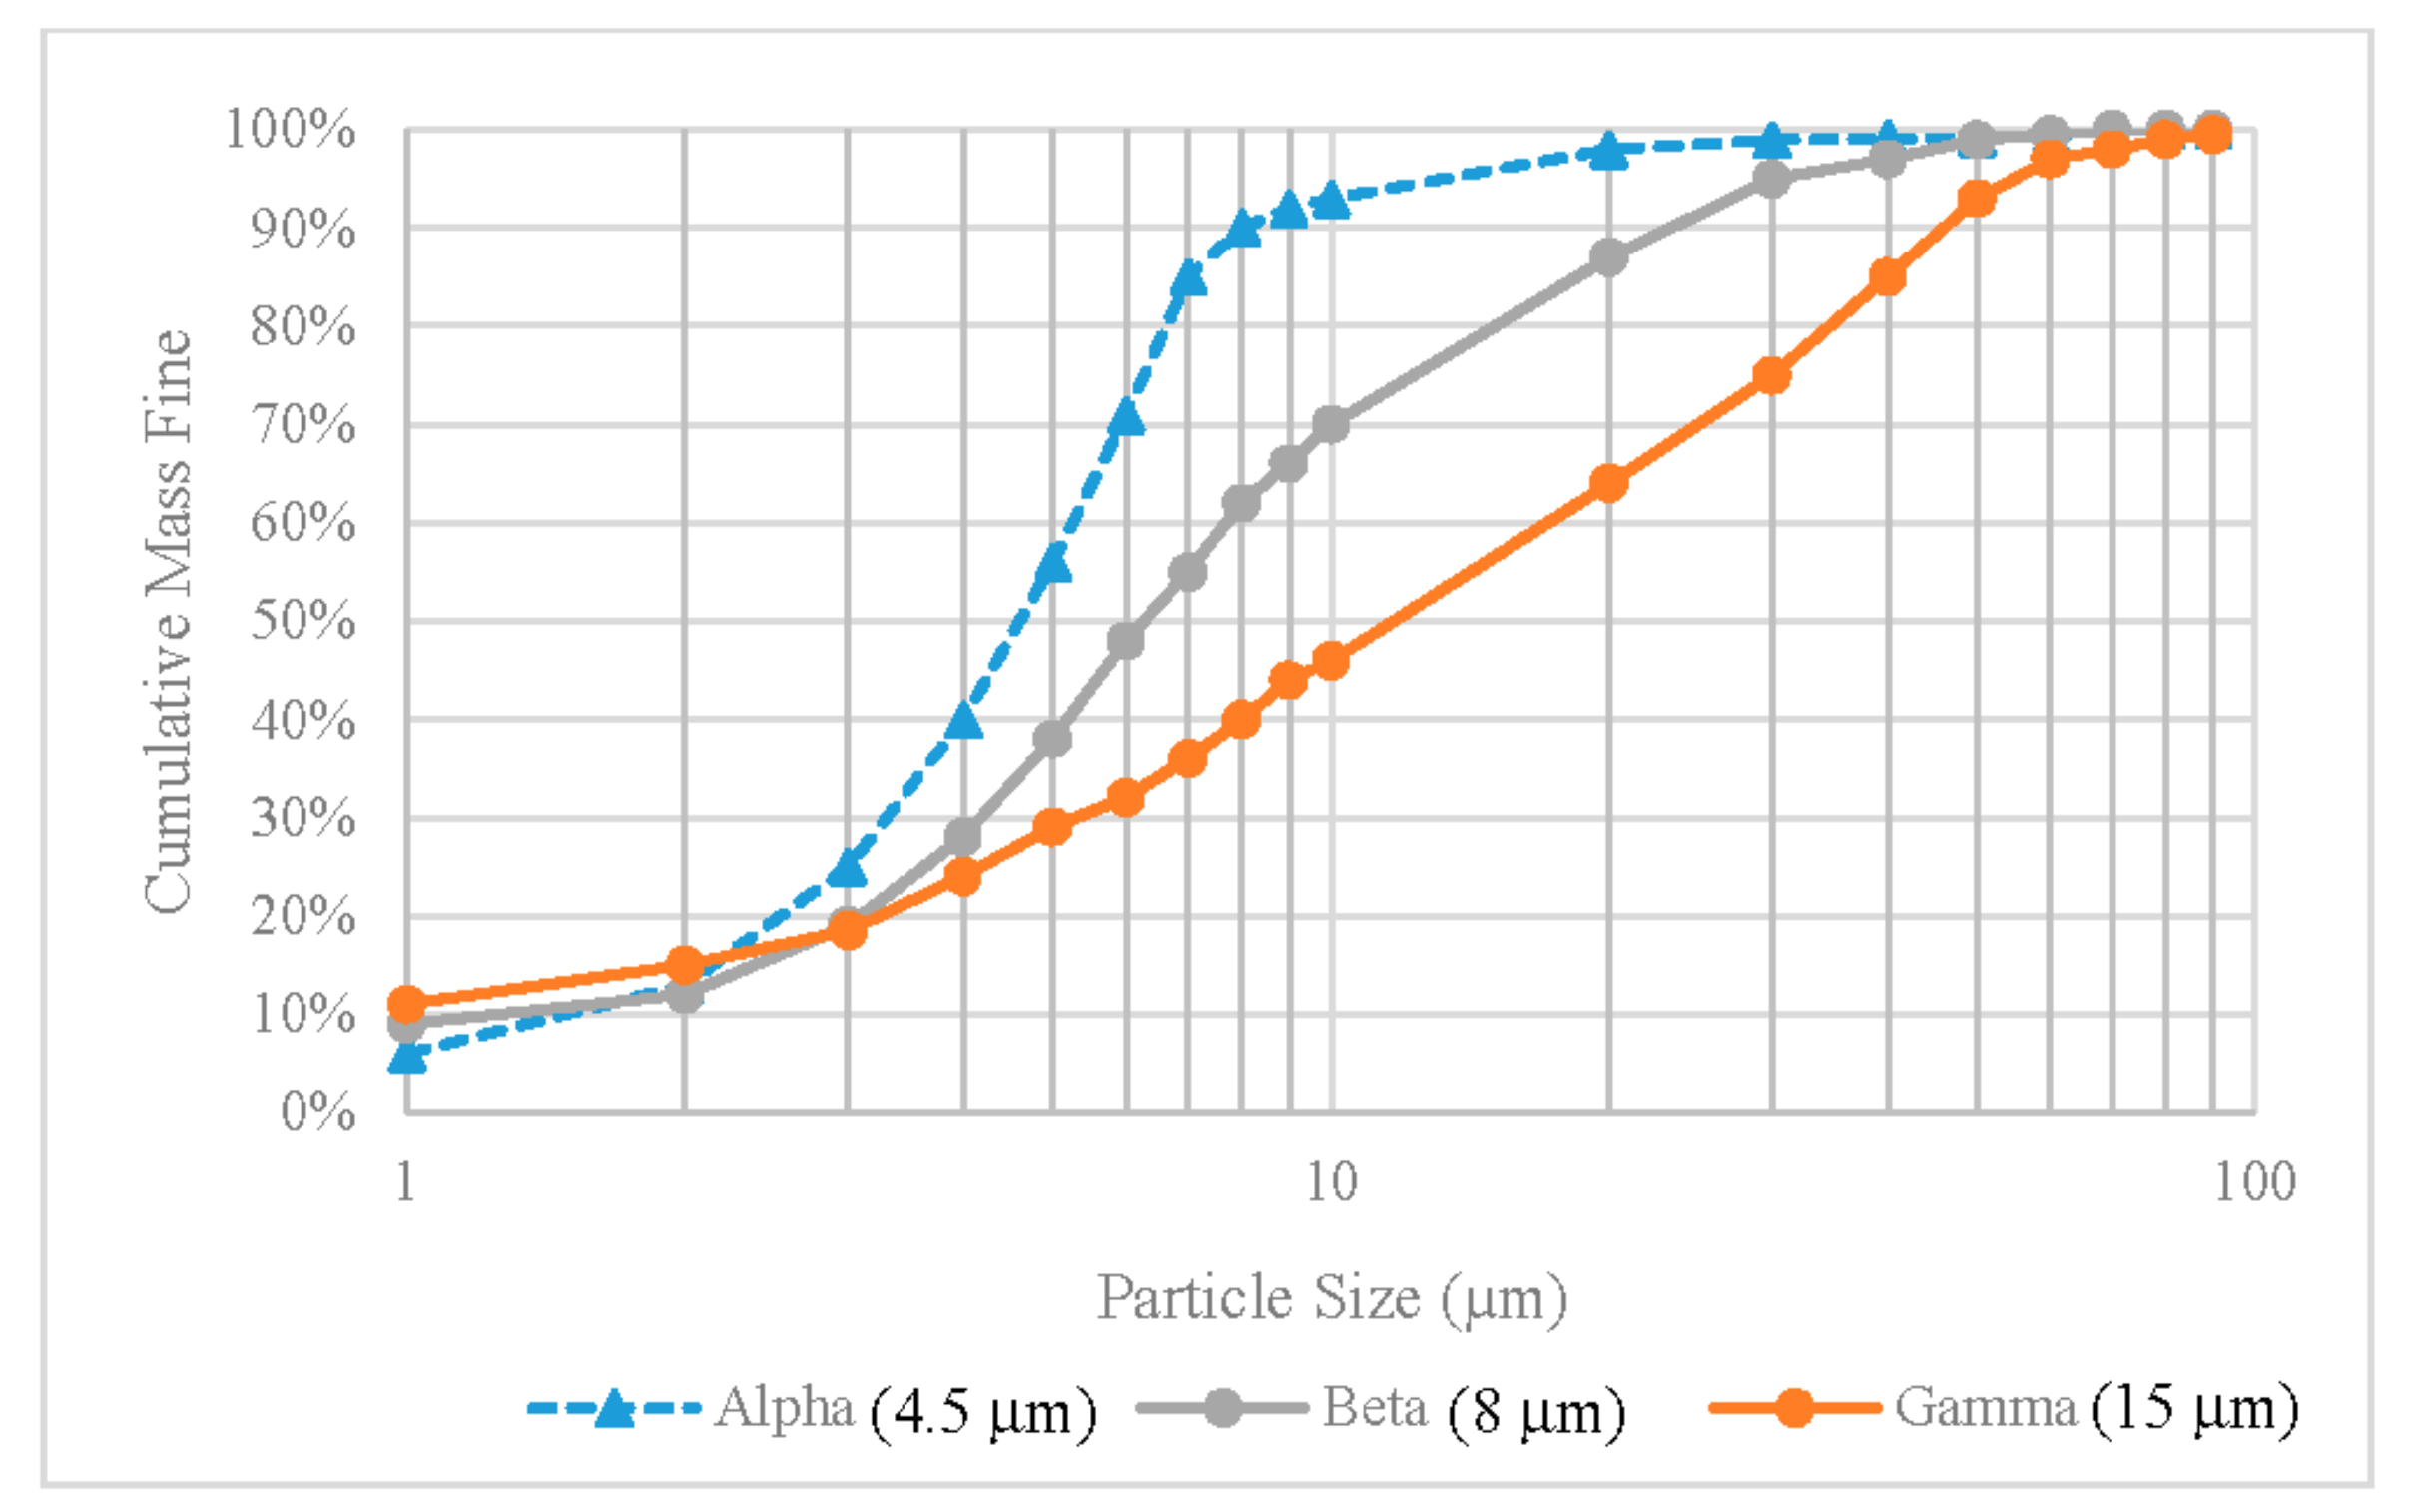
The particle distribution of limestone powder in the concrete can be evaluated to that of the raw materials to identify if the limestone powders react with the cement or other changes in size due to clumping. The data from limestone powder is expressed by the percentage of the cumulative mass of the particle size. To make this comparison, data collected from the petrographic images analyzed with ImageJ are used to calculate a cumulative mass to determine particle distribution of limestone powder in concrete. The specific gravity of limestone powder is 2.7 and can be used to determine an estimated mass equivalent sphere diameter of the particle.
Figure 9a shows the particle distribution of Alpha particles in the concrete, and compares it to the raw limestone powder product. The distribution of the limestone particles in concrete is almost identical to the distribution of the raw limestone powder product, indicating that the distribution is homogenous and that particles do not clump together. This also indicates that no significant reaction occurs between the limestone particles and cement since there is little to no loss in calculated mass. The distribution of the Beta limestone particles by the cumulative mass is significantly larger than that of the Alpha particles, see
Figure 9b. The distribution comparison between the limestone powder in concrete and as a raw product is still similar with a small increase in the cumulative mass by particle size. This increase can be an indication that a small percentage of limestone powder is clumping together. As the particle size increases, the small sample size might also affect the results to a greater degree.
Figure 9c, Gamma particles show the larger particle distribution of the limestone powder in concrete following a similar trajectory of the raw limestone powder material in
Figure 9c. The larger particles might cause some additional clumping of limestone powder. Results may be affected by a small sample size and larger particles that overestimate the mass from larger particles.
Based on
Figure 8, the particles larger than 10 µm represent less than 5% of particles, though they significantly affect the distribution of mass.
Table 8 shows little change in the area of occupation based on particle size from two-dimensional images, and because there is minimal reaction between cement paste and limestone powder, it is assumed that the controlling factor is the volume of limestone powder occupation within the cement paste. The representative combination by mass of the particle size and count are negligible as long as the volume of occupation remains the same.
3.4. Efficiency of Limestone Powder in Concrete
The general rule formulated by Rene Féret in 1896 relates the strength of concrete to the water and cement, and is determined by the volumetric proportions of the cement, water, and air. While water/binder ratios and degrees of compaction are usually considered when estimating the strength of concrete, the volume of air filled voids cannot be neglected, as this volume contributes to the strength loss [
14]. Equation (1) indicates that concrete strength (
fc) with minimum water content decreases in proportion to an increase in the
a/
c, where
a,
c, and
w are absolute volumes of air, cement, and water in concrete, respectively. The relationship between the water/cement ratios and compressive strength specifies that a high strength concrete with minimum air voids can be achieved with lower water/cement ratios. However, a rapid loss in strength is evident if the water/cement ratios fall below the practical limit. If a graph is drawn between the strength and the cement/water ratio, an approximately linear relationship will be obtained [
20].
The dilution effect of limestone powder results in a lower hydraulic reactivity, which, in turn, affects the compressive strength of the concrete; however, the dilution effect enhances homogeneity. This occurs by the dispersion of clinker particles, which increases the bonds per unit of cement, which, in turn, results in decreased porosity [
22]. To determine the efficiency of limestone powder as a cement replacement, it must be compared to properties of cement. Although limestone powder does not have cementitious properties, the effectiveness of the particle distribution can be evaluated by using a modified version of Féret’s equation. Using the test results of the compressive strength at 28 days and 90 days, the limestone powder factor of efficiency can be calculated in relation to cement.
Modified Féret’s Equation:
Modification of Féret’s equation will incorporate the same structure as the original equation. In Equation (2), the parameters of the modified equation include two factors: (1) the volume of limestone powder (ls) because it modifies the integer numerator containing both the volume of cement (c) and the limestone powder, and (2) the efficiency factor (k
ls) because a cement replacement must be compared to properties of cement, as explained in
Section 2.5. The denominator is also modified to adjust for the volume of the limestone powder due to a lower specific gravity. Using the compressive strength results of the control mix, the volumetric portions of cement, water, and air allows the ability to calculate K, an empirical constant using Féret’s equation. Because the aggregates and the mixing process remain unchanged in batches containing limestone powder, the empirical constant K will remain constant, and can be used in the modified equation with a value of 280 for 28 days, and 319 for 90 days.
The modified equation can be used on batches containing limestone powder to calculate the efficiency factor based on volumetric portions of cement, water, air, and the compressive strength per
Table 9. The efficiency factor gives a representation of cementitious properties of the limestone powder in relation to cement based on the volume occupied.
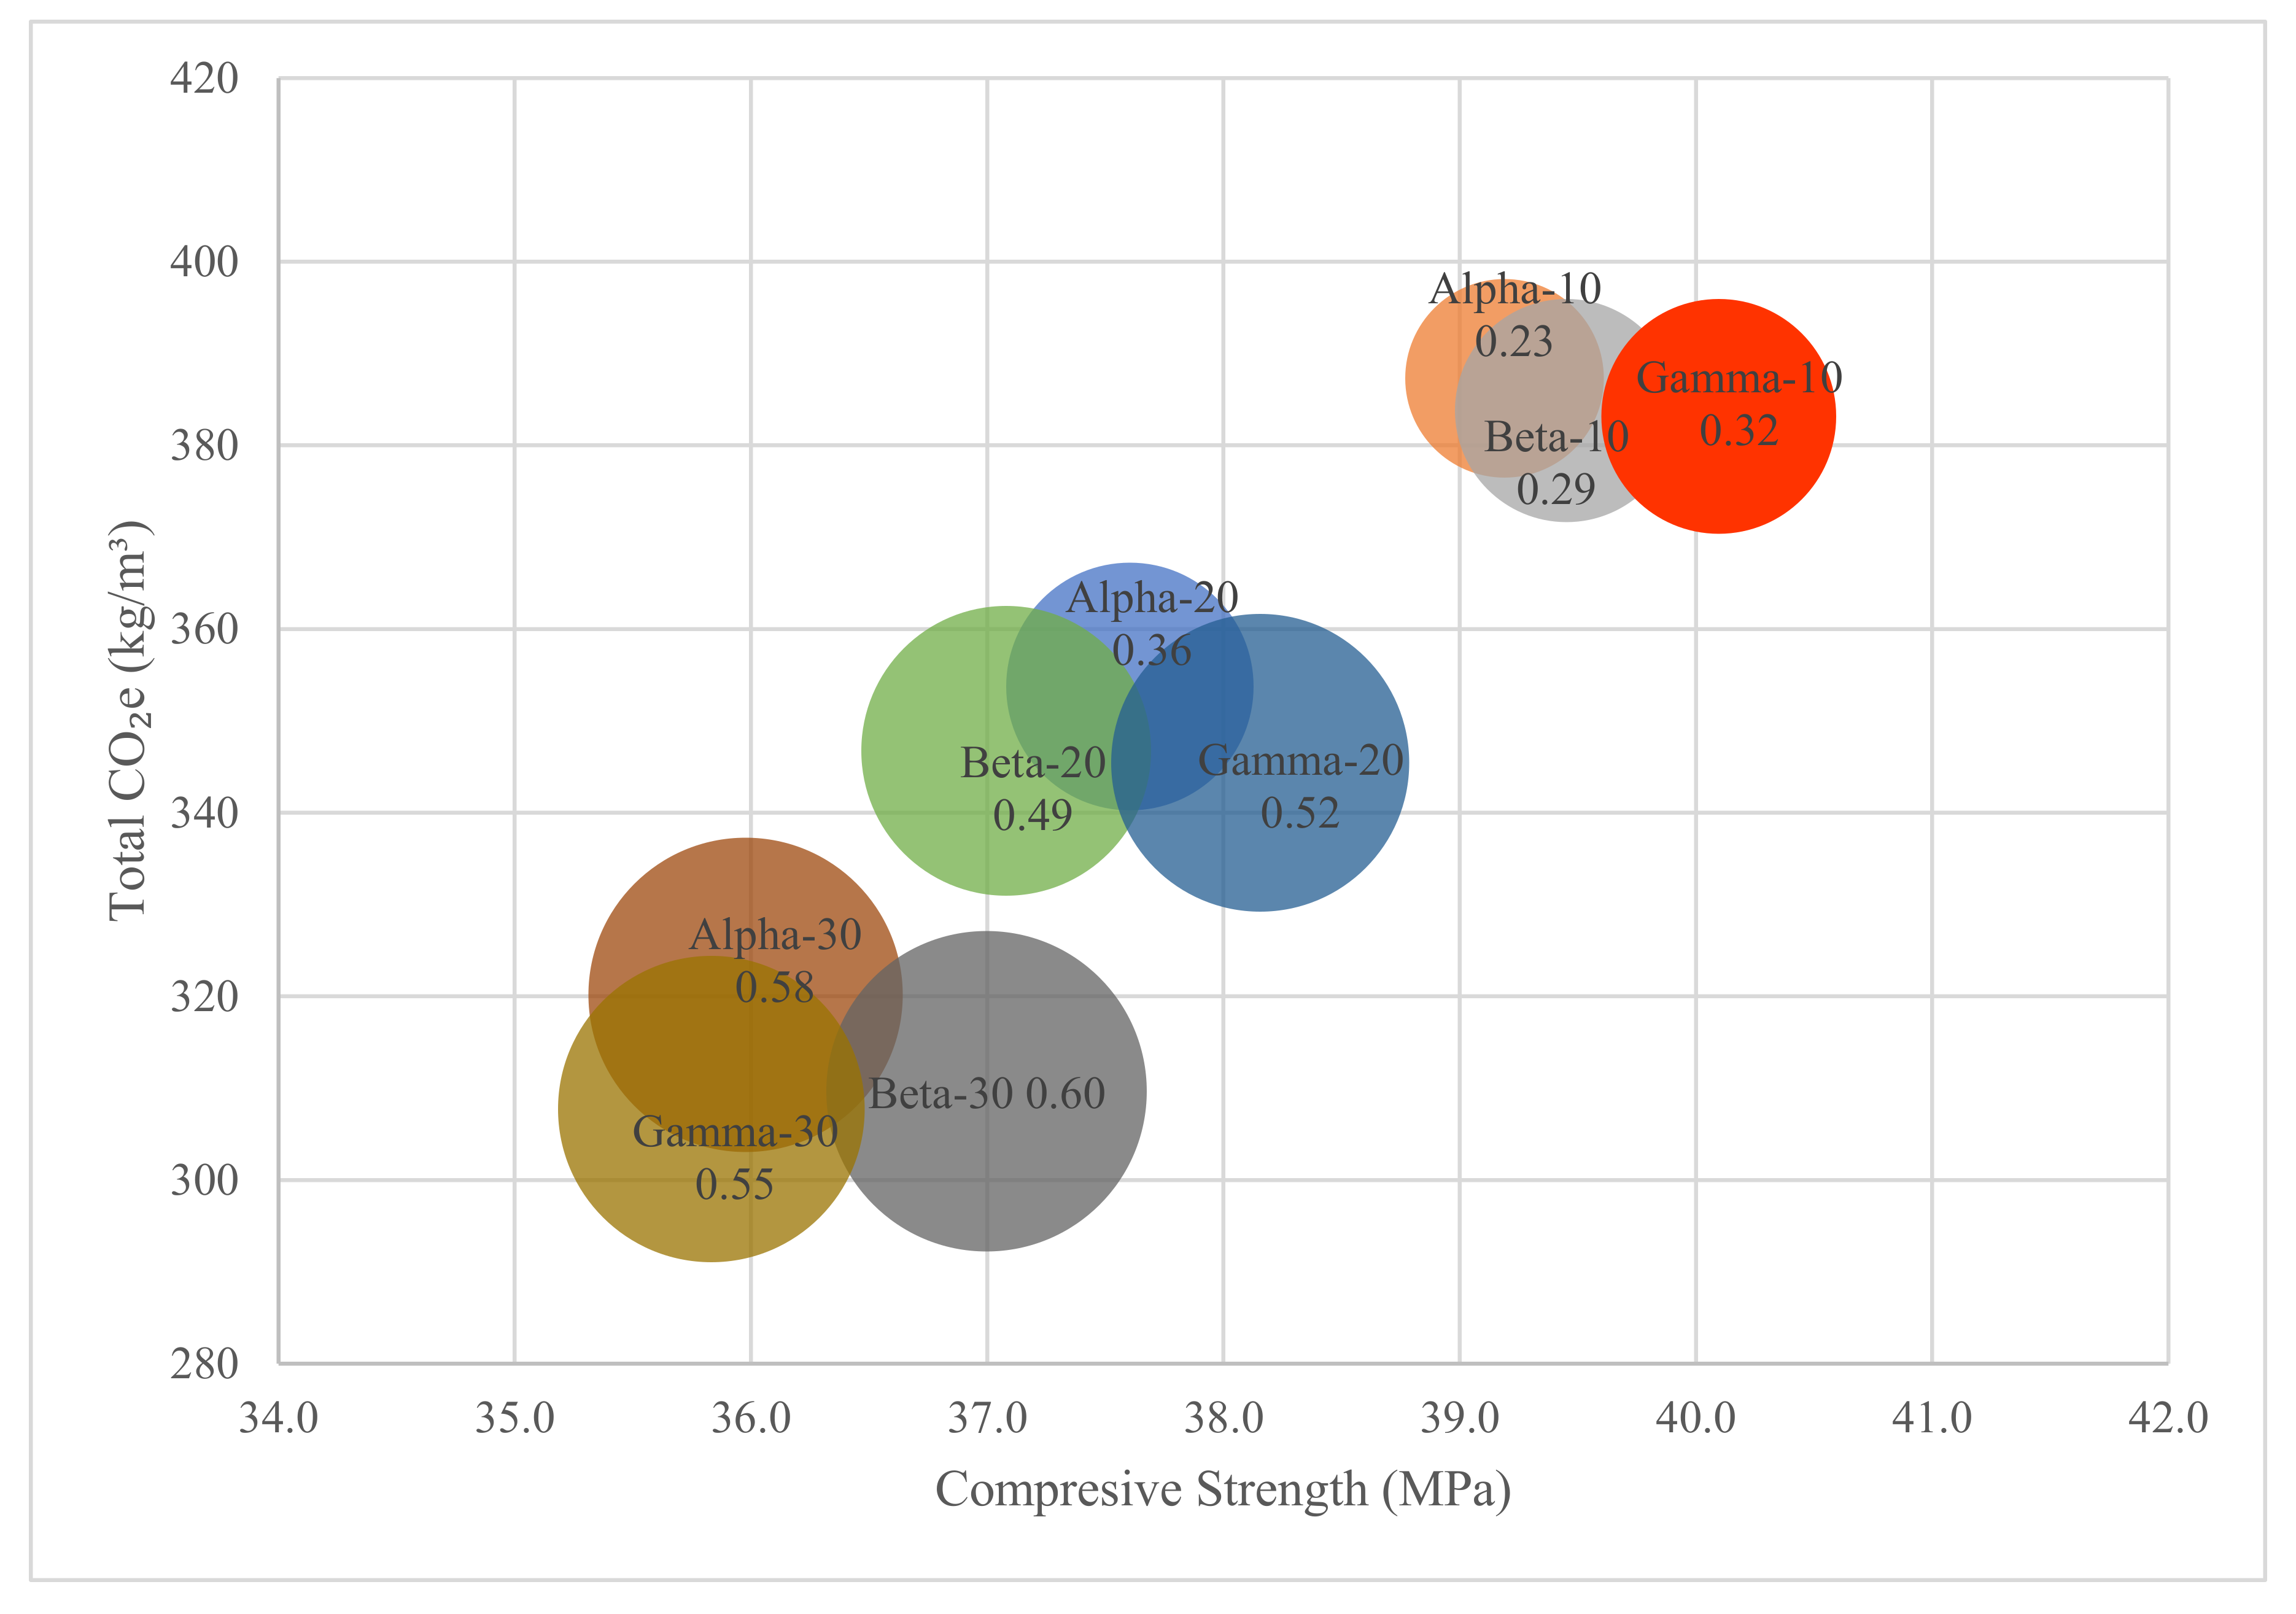
Figure 10 shows the calculated efficiency factor using the modified version of Féret’s equation, and demonstrates how it increases when a greater amount of cement is replaced. The 28-day efficiency factor increases an average of 104% from 0.23 to 0.32 for a 10% replacement to 0.55–0.60 for a 30% replacement. With similar results for the 90-day efficiency factor that increases from 0.15–0.26 for a 10% replacement to 0.49–0.61 for a 30% replacement, there is a 150% average increase in efficiency. There is little variance in the efficiency factor based on particle size, but it is not significant enough to make any conclusions other than the effects are negligible.
3.5. Limestone Powder Predictive Model
Once the efficiency factor per replacement level and particles have been determined, Féret’s modified equation can serve as a model to develop and predict the strength of mix designs containing limestone powder. The model is based on the same principles and element of Féret’s equation describing the relationship between mix compositions and compressive strength properties. Since the mix compositions of concrete differ based on the regions and material availability, the model also utilizes a calculated empirical constant. This allows for the model to be applied to a mix design that has known mechanical properties. Using Féret’s original equation and the volumetric portions of cement, water, and air, the empirical constant can be calculated.
Since the size of limestone particles does not have a significant effect on the mechanical properties, the average efficiency factor is used to simplify the model. The average efficiency factor for a 10% replacement is 0.28, 0.49 for a 20% replacement, and 0.57 for a 30% replacement at 28 days. The model also allows for the manipulation of water to cement ratios and air content.
Figure 11 shows the 28-day compressive strength predictions based on the mechanical properties of the control mix design with different water-to-binder ratios. Strength prediction results range from 22.79 MPa to 24.92 MPa for a 0.60 w/b ratio, and from 46.42 MPa to 51.21 psi for a 0.30 w/b ratio. The 0.40 w/b ratio predicted results are almost identical to compressive strength test results with little variation. The prediction model can serve as a viable tool to plan for concrete mix designs containing limestone powder that meet specific specifications based on known mix designs.
3.6. Life Cycle Assessment of Limestone Powder in Concrete
Table 10 highlights the materials from the mix design and emission data from the PCA report on the life cycle assessment of different mix designs [
11]. The procedures to produce limestone powder emissions were prescribed by the manufacturer [
12]. The evaluation for environmental impact due to carbon dioxide equivalents (CO
2e), found in the U.S. Environmental Protection Agency Tool for the Reduction and Assessment of Chemical and Other Environmental Impacts (TRACI), was used to achieve the emission factors [
23]. The capability to assess the environmental impact that materials and operations have in concrete production, as well as irradiating pollution shifts and suggesting improvement benchmarks, are some of the advantages of conducting a life cycle analysis. This analysis allows for the study of limestone powder replacements and different particle sizes, as well as their influence on the environment. In order to conduct a precise life cycle analysis, an inventory of all inputs and outputs was compared with a life cycle inventory.
The transportation and production of material components leads to carbon dioxide equivalents (CO
2e), which impact the environment, as shown in
Table 10. The information in this table clearly specifies a higher environmental impact from cement manufacturing in concrete production. According to the control mix design, cement manufacturing contributes about 91% to CO
2e emissions, although the cement is comprised of only 15.7% concrete. The primary source of the emission is the operation of the kiln, which causes high carbon dioxide emissions due to the release of CO
2 from CaCO
2 during the calcination process.
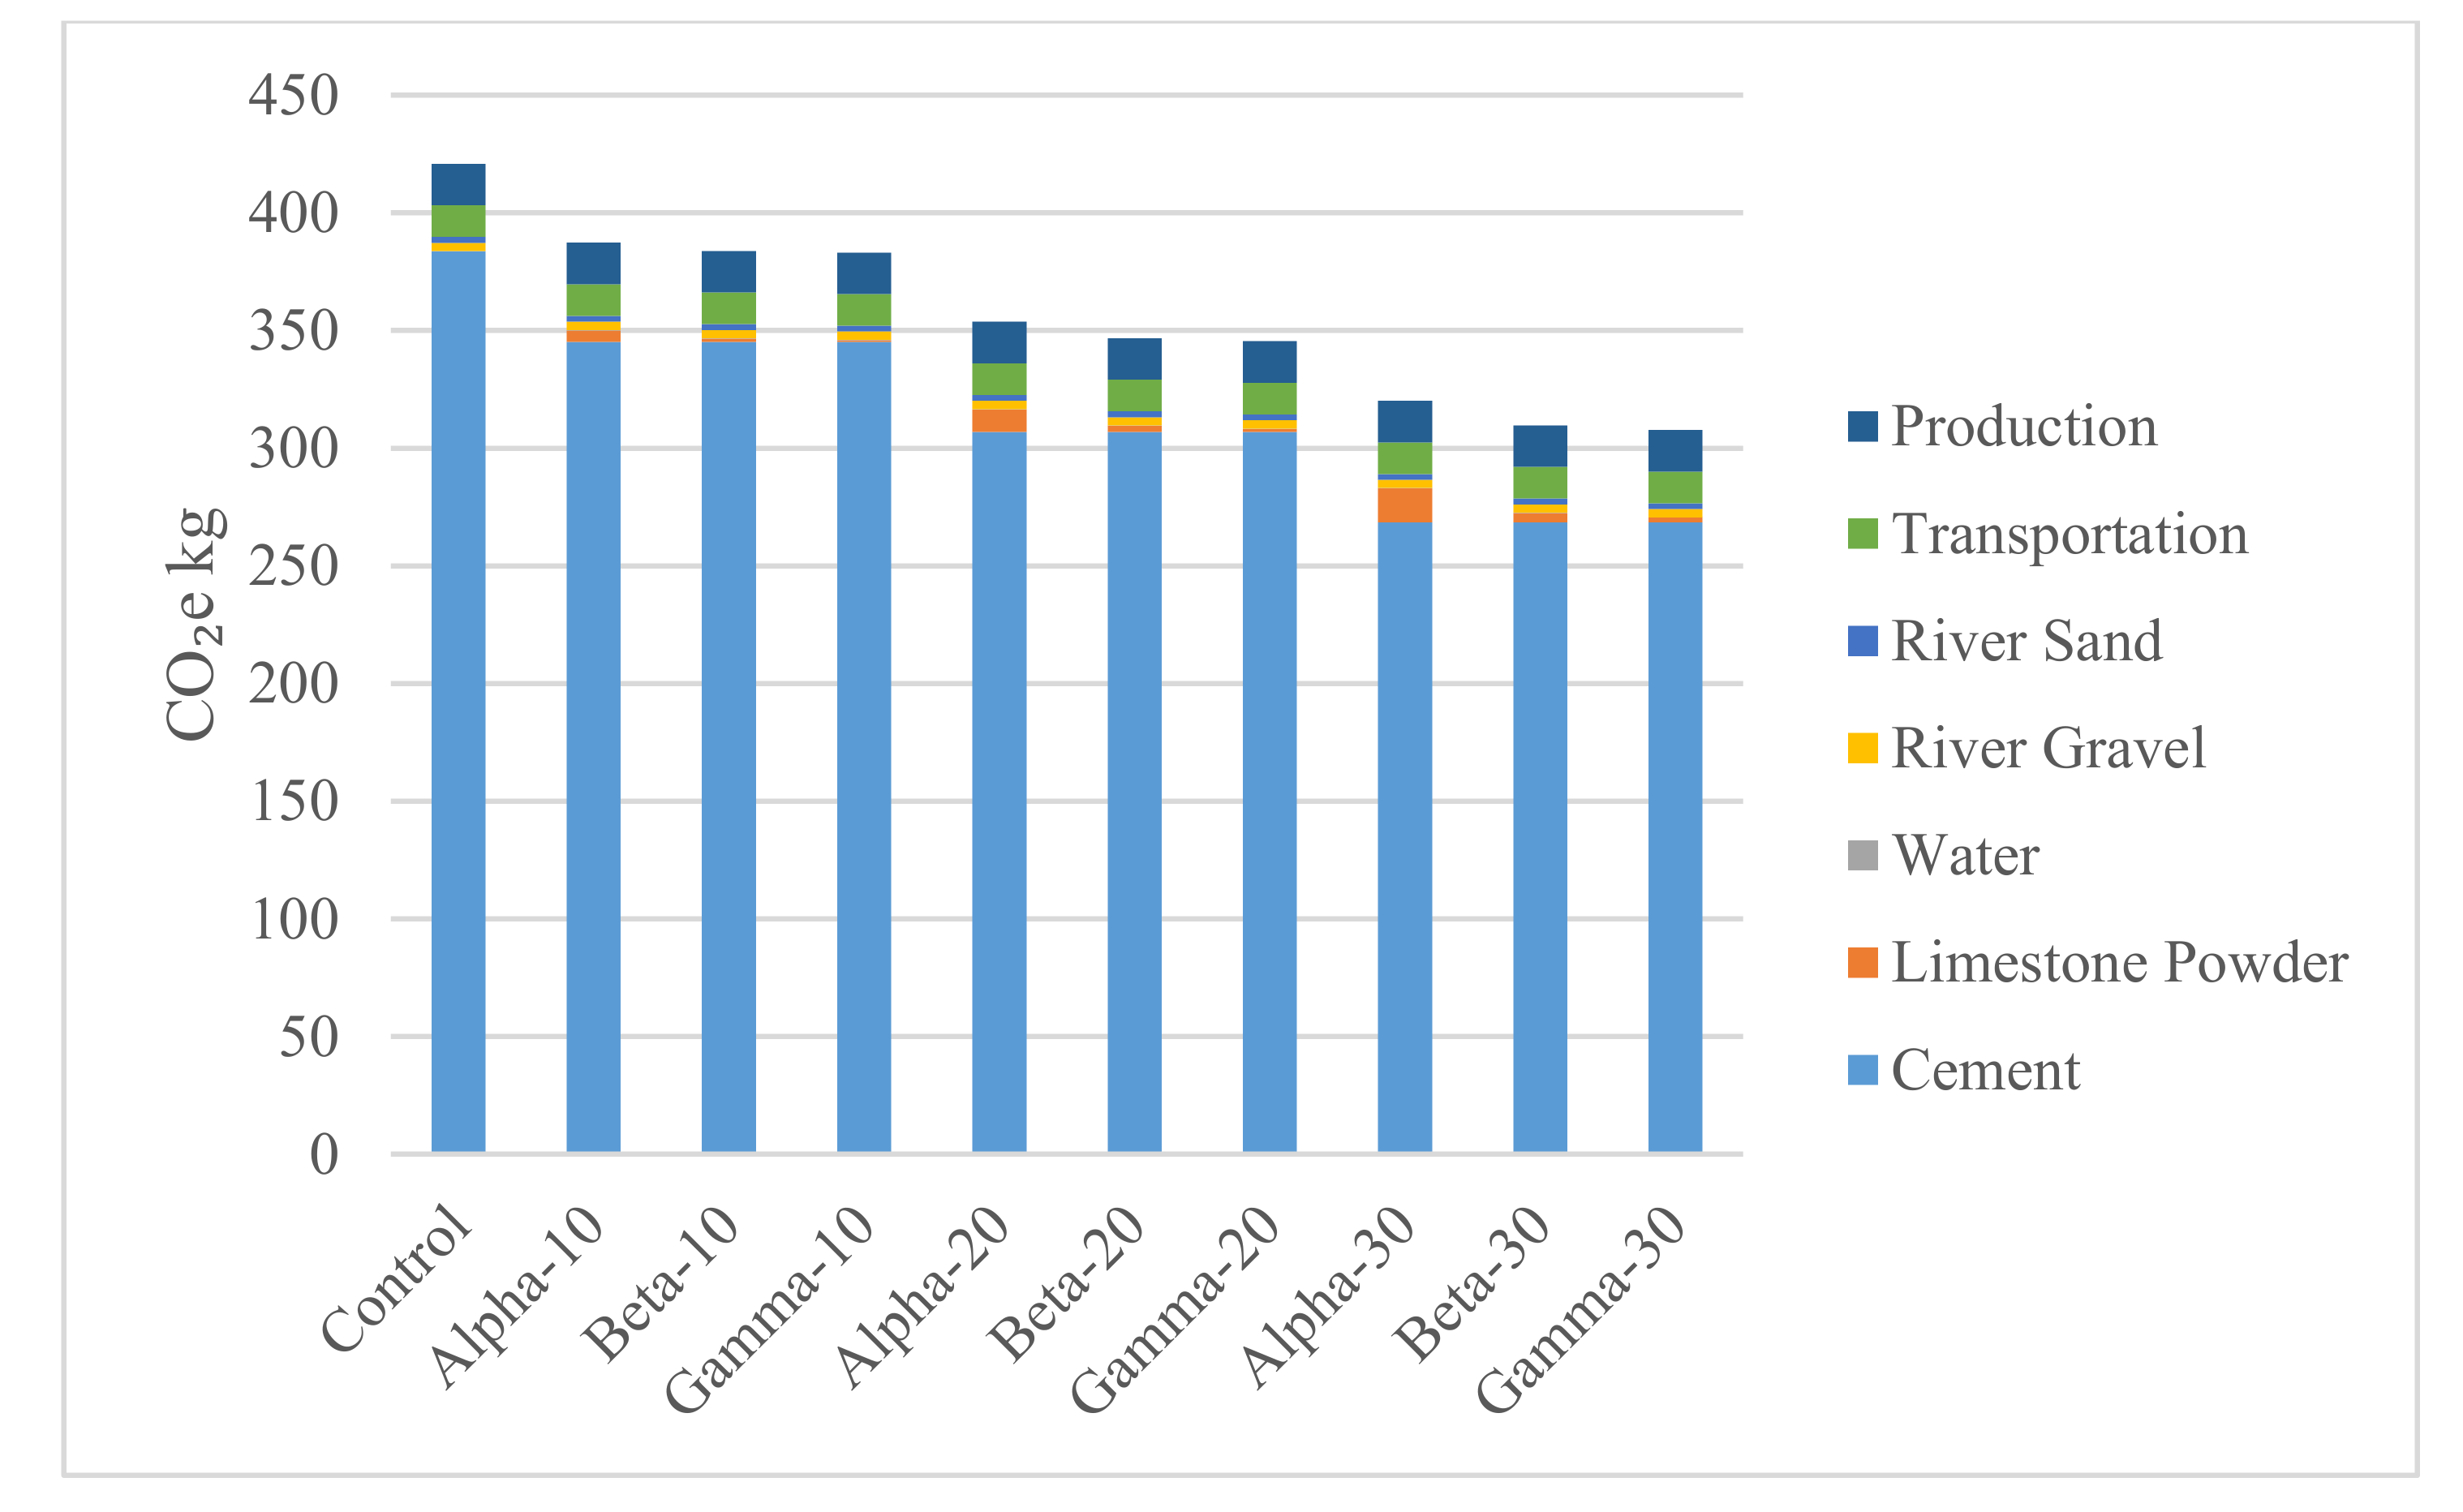
The direct relation CO
2e emissions has in the replacement of cement with limestone powder is evident in
Figure 12. As both the levels of replacement and particle size of the limestone powder increase, the CO
2e emissions of the mix designs decrease. As indicated in
Figure 13, CO
2e emissions are decreased by 8% to 9% (subject to the particle size), with every 10% of cement that is substituted with limestone powder. The particle size of the limestone powder does not have a considerable effect on CO
2e emissions, reducing CO
2e emissions by 1% for every 10% replaced with larger limestone powder particles.
A comparison of the advantages in reducing in CO
2e emissions and the negative effects on the compressive strength are evident in
Figure 13.
It also indicates the level of percentage replacement at which the benefits of CO2e emissions are superior to the loss of strength. At a 10% replacement of cement directs a reduction of the compressive strength by 13% at 28 days, and CO2e emissions by 9.5%. This percentage of replacement is inefficient as the loss of strength exceeds the emissions. The reduction of CO2e emissions by 17.2% was evident with a 20% replacement of limestone powder. A negative implication of this was the loss of compressive strength of concrete by 17%; however, the reduced CO2e emissions are more advantageous than the loss of compressive strength, which was a 30% replacement ratio with an average of 5.7%. This makes it an ideal cement replacement level with superior environmental benefits.
3.7. Optimizing the Limestone Powder in Concrete
The use of limestone powder in concrete to replace portions of cement can help to meet demand and reduce the environmental impact of cement production. But with all supplementary materials, the proportional use must be optimized. Optimization of the use depends on multiple factors and can vary from region to region. Cost and availability are important factors to consider for using limestone powder in concrete, and will have to be assessed based on local regions. Due to the dilution effect, both the mechanical properties and environmental effects have to be considered in tandem to utilize limestone powder in concrete. The optimal solution is based on the life cycle analysis results, mechanical properties, and efficiency.
Figure 14 compares the life cycle analysis results, mechanical properties, and efficiency factors of the limestone particle sizes, and replacement levels. The graph reiterates that particle size is not a main factor in the optimization, and will be more dependent on the availability and cost of using limestone powder in concrete. The optimal use of limestone powder is in higher replacement concentrations, as these concentrations reduce the environmental impact of producing concrete, and are more efficient with Beta-30 having the highest efficiency at 0.60. The loss of strength does increase as the replacement levels increase, and though the reduction in strength is less significant, it has to be accounted for when implementing limestone powder in concrete.


