Curve Number Applications for Restoration the Zarqa River Basin


1
Water, Energy and Environment Center, The University of Jordan, Amman 11942, Jordan
2
Faculty of Agriculture, The University of Jordan, Amman 11942, Jordan
3
Department of Civil and Environmental Engineering, Brigham Young University, Provo, UT 84602, USA
*
Author to whom correspondence should be addressed.
Sustainability 2018, 10(3), 586; https://0-doi-org.brum.beds.ac.uk/10.3390/su10030586
Submission received: 24 January 2018
/
Revised: 13 February 2018
/
Accepted: 21 February 2018
/
Published: 26 February 2018
Abstract
:The great demand for water resources from the Zarqa River Basin (ZRB) has resulted in a base-flow reduction of the River from 5 m3/s to less than 1 m3/s. This paper aims to predict Curve Numbers (CNs) as a baseline scenario and propose restoration scenarios for the ZRB. The method includes classifying the soil type and land use, predicting CNs, and proposing CN restoration scenarios. The prediction of existing CNs will be in parallel with the runoff prediction by using the US Army Corps of Engineers HEC-1 Model, and the Rainfall–Runoff Model (RRM). The models have been set up at the land use distribution of 0.3% water body, 9.3% forest and orchard, 71% mixture of grass, weeds, and desert shrubs, 7.0% crops, 4.0% urban areas, and 8.4% bare soil. The results show that CNs are 59, 78 and 89 under dry, normal and wet conditions, respectively. During the vegetation period, CNs are 52, 72 and 86 for dry, normal and wet conditions respectively. The restoration scenarios include how CNs decrease the runoff and increase the soil moisture when using the contours, terraces and crop residues. Analyzing the results of CN scenarios will be a fundamental tool in achieving watershed restoration targets.
1. Introduction
The Curve Number (CN) is one of the most frequently used methods for predicting runoff, and determining rainfall–runoff relationships [1,2]. Curve Numbers represent average antecedent runoff conditions for urban, cultivated agricultural, and arid and semi-arid range land uses. Curve Numbers can be determined from soil type, land use, soil moisture conditions, and hydrologic conditions. In hydrology, CN values are used to determine how much rainfall is lost (initial abstractions and infiltration) and how much becomes runoff. A high CN means high runoff and low losses as with urban areas, whereas a low CN means low runoff and high infiltration. The Soil Conservation Service (SCS) CN method is one of the most popular methods for computing the runoff volume from a rainstorm. It is popular because it is simple, easy to understand and apply, stable, and accounts for most of the runoff producing watershed characteristics. The SCS CN is a function of land use and hydrologic soil groups and is calculated using a table relating the two [3,4]. For each land use type, there is a corresponding CN for each of the SCS hydrologic soil types A, B, C, and D, with values ranging theoretically from 0–100 [2]. Selection of the CN is generally accomplished using lookup tables and site-specific information based on soil groups, land use, vegetative cover, and antecedent moisture. Previous studies have focused on CN identification and utilization, and have suggested adjusting CNs for watershed conservation [5,6,7,8].
Several models exist that can calculate watershed runoff [9]. Each component of a model is an aspect of the rainfall–runoff process, such as precipitation, losses, runoff transformation, and river storage and routing. Representing one of these components requires a set of parameters, which specify the particular characteristics of the watershed in terms of their mathematical and empirical relation to physical processes. Two such models that can predict watershed runoff that are used in this study are the HEC-1 Model, and the Rainfall Runoff Model (RRM).
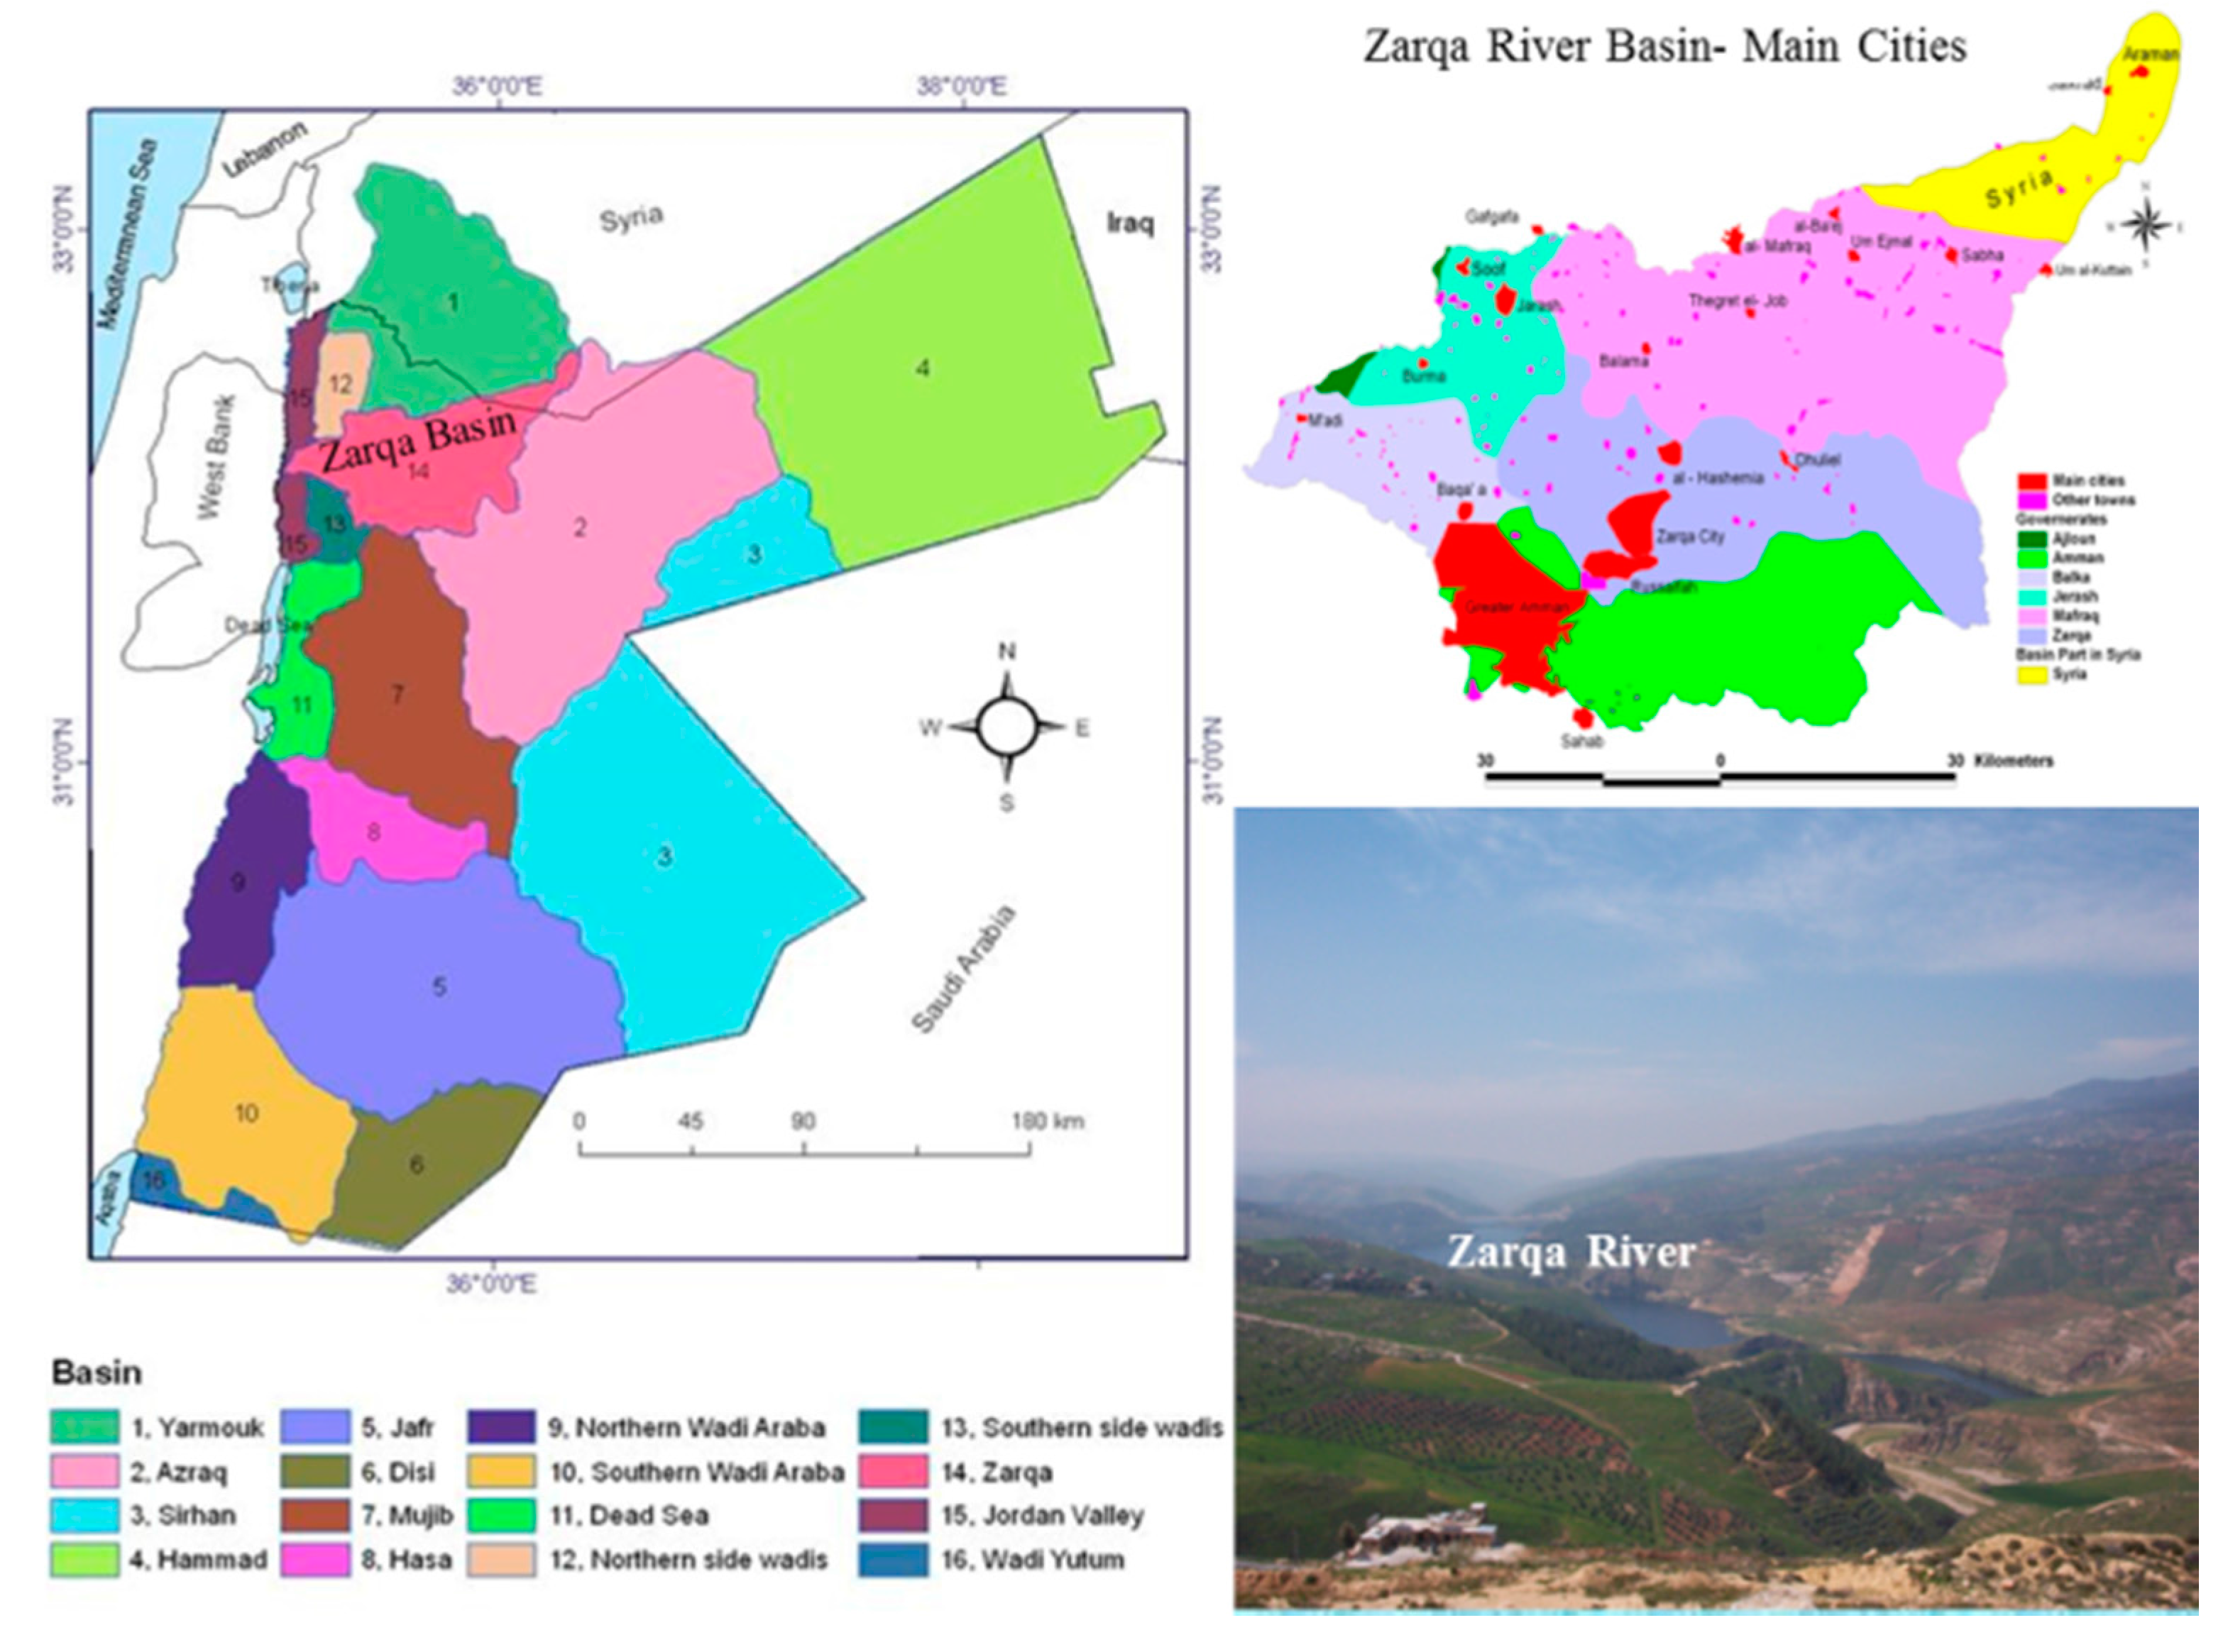
Surface water resources in Jordan are mainly used for agriculture because they are mixed with treated water and cannot be used for domestic purposes. Groundwater is also used for domestic purposes but it is not enough to satisfy the growing demand for domestic and industrial sectors [10]. Surface water resources are distributed among 15 major basins in Jordan, with the Zarqa River Basin (ZRB) considered as one of the most significant basins due to its economic, social and agricultural importance as the second main tributary to the Jordan River. The Zarqa River Basin has been taken as a case study because it suffers from several water problems ranging from poor water management, water quality, and from water conflicts over allocation amongst various sectors [10,11]. It is considered to be the area most affected by water scarcity because of its limited water resources and high demand, which is due to the fact that the basin houses about 52% of Jordan’s population [12,13]. The heavy utilization of the Zarqa Basin has resulted in the reduction of the base flow of the Zarqa River from 5 m3/s to less than 1 m3/s and the discharge of springs from an average 317 million cubic meter (MCM) prior to 1985 to less than 130 MCM after 2000.
The Zarqa Basin drains 4120 square kilometers and extends from Syria to Amman, and then to the Jordan River. The highest point in the basin is located near the Syrian town of Salkhad in Jebel Al-Arab at an elevation of 1460 m. The basin discharges its water at the confluence of the Zarqa River with the Jordan River at an elevation of −350 m below sea level. The steep bed slopes of the river and its tributaries are in the range of 0.7 to 1.5 percent on average. The stream flow of the Zarqa River is impounded by the King Talal Dam (KTD), south-west of the town of Jaresh at an altitude of about 120 m above sea level, which has a storage capacity of 75 MCM, the largest dam in Jordan. The flood (runoff) gauge station of New Jerash Road Bridge is the only gauge in the Zarqa Basin and has a database that is long enough to be suitable for evaluation. The station near Ain Ghazal, important for monitoring the runoff from Amman, stopped operating in 1979. The Zarqa River Basin spans five governorates: Amman, Balqa’a, Zarqa, Jerash, and Mafraq [14]. Figure 1 shows the location of the Zarqa River Basin and the main cities it contains.
The soils of the ZRB differ widely according to various slopes. In the most humid west, reddish to brownish clay and clay loams prevail. Toward the east, the soil becomes silty loam to loamy in texture, yellowish brown to strong brown with very high carbonate content. Soil erosion on the steeper slope is the main cause of alluvial processes where sheet erosion is more pronounced in the eastern part [15]. These changes have taken place in a matter of decades starting in the early 1960s.
Land use in the ZRB has undergone considerable changes [15]. The recent expansion of Amman and surrounding towns has been extensive; the area where large expanses of grazing land and more fertile agricultural lands could once be found between Amman and other towns has now developed into a sprawling urban conglomerate. The Basin has regions of natural forests occurring in the mountainous area that are composed of oak, pine, juniper, wild olive and cypress trees. Agriculture is scattered within the Basin comprising rain-fed orchards, olive, and field crops, with irrigated agriculture on the river basin banks. The major industrial activities in the Basin include the Hussein thermal plant, petrol refining, the textile industry, paper processing, leather production, and intermediate petrochemical processing. The ZRB which was once full of scattered forest, rangelands and a haven for wild and domestic animals, has suffered from desertification caused by human activities and climate change.
Therefore, the critical situation of the Zarqa Basin requires proper management to enhance watershed restoration efforts. For this purpose, the identification of CN values based on existing land uses and hydrologic soil groups (HSGs) classification is an important first step for developing a model dealing with watershed management problems. This paper presents possible solutions for watershed restoration by using the HEC-1 and the RRM models, with the aim of estimating the baseline CN values and proposing new CN values that would represent restoration scenarios. The prediction of CNs for the average rainy season of 2001/2002 will be in parallel with the prediction of runoff using the HEC-1 and the RRM models. The HEC-1 Model was developed by the US Army Corps of Engineers [16], while the RRM was implemented as a web-based distributed client-server system and was provided by the Environmental Software Systems-ESS, Austria [17,18].
2. Methodology
The data used for running these models includes elevation maps; precipitation amounts; temperature; flow; runoff; satellite imagery; soil maps, and basin characteristics. This data is used for the 2001/2002 water year from 1 October 2001 to 30 September 2002. The water year of 2001/2002 is taken because it was an average rainy season with a good distribution of rainfall amounts. For that year, all data related to daily rainfall and runoff records was available. The gauging station of New Jerash Road Bridge is the most essential gauge with a complete record and is used for the HEC-1 and the RRM model calibrations. This allows for the simulated flow from the HEC-1 Model and the RRM to be compared with the actual data to calibrate parameters and verify the accuracy of the model.
2.1. Watershed Modeling System (WMS): HEC-1 Model
The Watershed Modeling System (WMS) is a comprehensive graphical modeling environment for all phases of watershed hydrology and hydraulics. The WMS includes tools to automate model parameterization such as automated basin delineation, geometric parameter calculations, GIS overlay computations, and cross-section extraction from terrain data. The WMS software supports many hydrologic models, including the HEC-1 [19], and can be used for the estimation of the similar parameters used by the RRM.
The HEC-1 Model is one of the most widely-used lumped parameter models available. It is designed to simulate the surface runoff response of a river basin to precipitation by representing the basin as an interconnected system of hydrologic and hydraulic components. It simulates a single storm event, and includes several options for modeling and computing total runoff volume for a rain storm event. Precipitation loss is calculated based on the CN values and on the initial surface moisture storage capacity. The CN and surface moisture storage capacity are related to the total runoff depth for a storm. The certainty of the HEC-1 application was deduced from the compatibility of the modeled flow to the actual flow data. For instance, the availability of daily runoff data allows for the calibration of the modeled flow with a known data series. The limitation of the HEC-1 Model is its simulation to a single storm due to the fact that provisions are not made for soil moisture recovery during periods of no precipitation. Therefore, the total seasonal runoff volume was considered in simulating the watershed.
2.2. WaterWare System: Rainfall–Runoff Model (RRM)
The WaterWare system is a model-based information and decision support system for water resources management. The system is designed to support the implementation of the Water Framework Directive or any similar national legislation. The system is a modular client-server system that smoothly integrates several databases, GIS, and a range of dynamic simulation and optimization models for a wide range of Integrated Water Resources Management (IWRM) tasks. The system is implemented in a fully web-enabled environment, supporting the seamless integration of databases, simulation and optimization models, and analytical tools into a common, easy-to-use framework. This includes a multi-media user interface with Internet access, a GIS with hierarchical map layers, object databases, time series analysis, reporting functions, and an embedded expert system for estimation, classification and impact assessment tasks. Monitoring data acquisition, automatic forecast runs and reporting, is driven by a real-time rule-based expert system. The components of the WaterWare System can be summarized as follows: a- Database management for all components of a basin including monitoring time series. b- Embedded GIS functionality. c- A set of dynamic simulation models in the base system. The WaterWare system provides the following: a- a scenario analysis; b- continuous monitoring, now-casting and scheduled forecasting; c- event-based operation triggered by user-defined events.
The WaterWare on-line system and databases include the following: the Water Resources Model (WRM), the Rainfall–Runoff Model (RRM), the Irrigation Water Demand Model, the Water Quality Model, the WRM Optimization Model, the Water Technologies Database, the Discrete Multi Criteria Decision Support System (DSS), the River Basin Object Database, the Water Institutions Database; and the Water Issues Questionnaire [18].
The WaterWare system was developed through a series of applications, where different institutions from several Mediterranean countries (Austria, Italy, Greece, Cyprus, Malta, Turkey, Lebanon, Jordan, Palestine, Tunisia, and Morocco) were involved in the OPTIMA Project (Optimization for Sustainable Water Management), sponsored by the EU under the Sixth Framework Programme (FP6) with contract No. INCO-CT-2004-50909 [20,21]. The Rainfall–Runoff Model is one of the components of the WaterWare system [18]. It is a dynamic, spatially lumped, basin scale water budget model that operates at a daily time step. It is designed for un-gauged basins, estimating their outflow as a function of basin characteristics including elevation distribution, land use distribution, rainfall in mm and average air temperature in degree Centigrade as dynamic inputs.
Editing a scenario for the Rainfall–Runoff Model involves major components:
- Basic basin characteristics data such as basin size, and channel characteristics;
- Defining basin morphometry, and geometry
- Providing specific model parameters including the initial conditions
- Land use data such as forests, pastures, agricultural practices, built up areas
- Temperature and precipitation data as a daily time series
- Daily runoff model results data shown together with the observed runoff data that can also be used for model calibration
- Daily main output data from the Rainfall–Runoff Model as well as a stand-alone model for analysis, or generation of the RRM data in a file format that is compatible with the Water Resources Model (WRM) in order to be used as input for the WRM
2.3. Soil and Land Use Classification for Predicting Curve Numbers
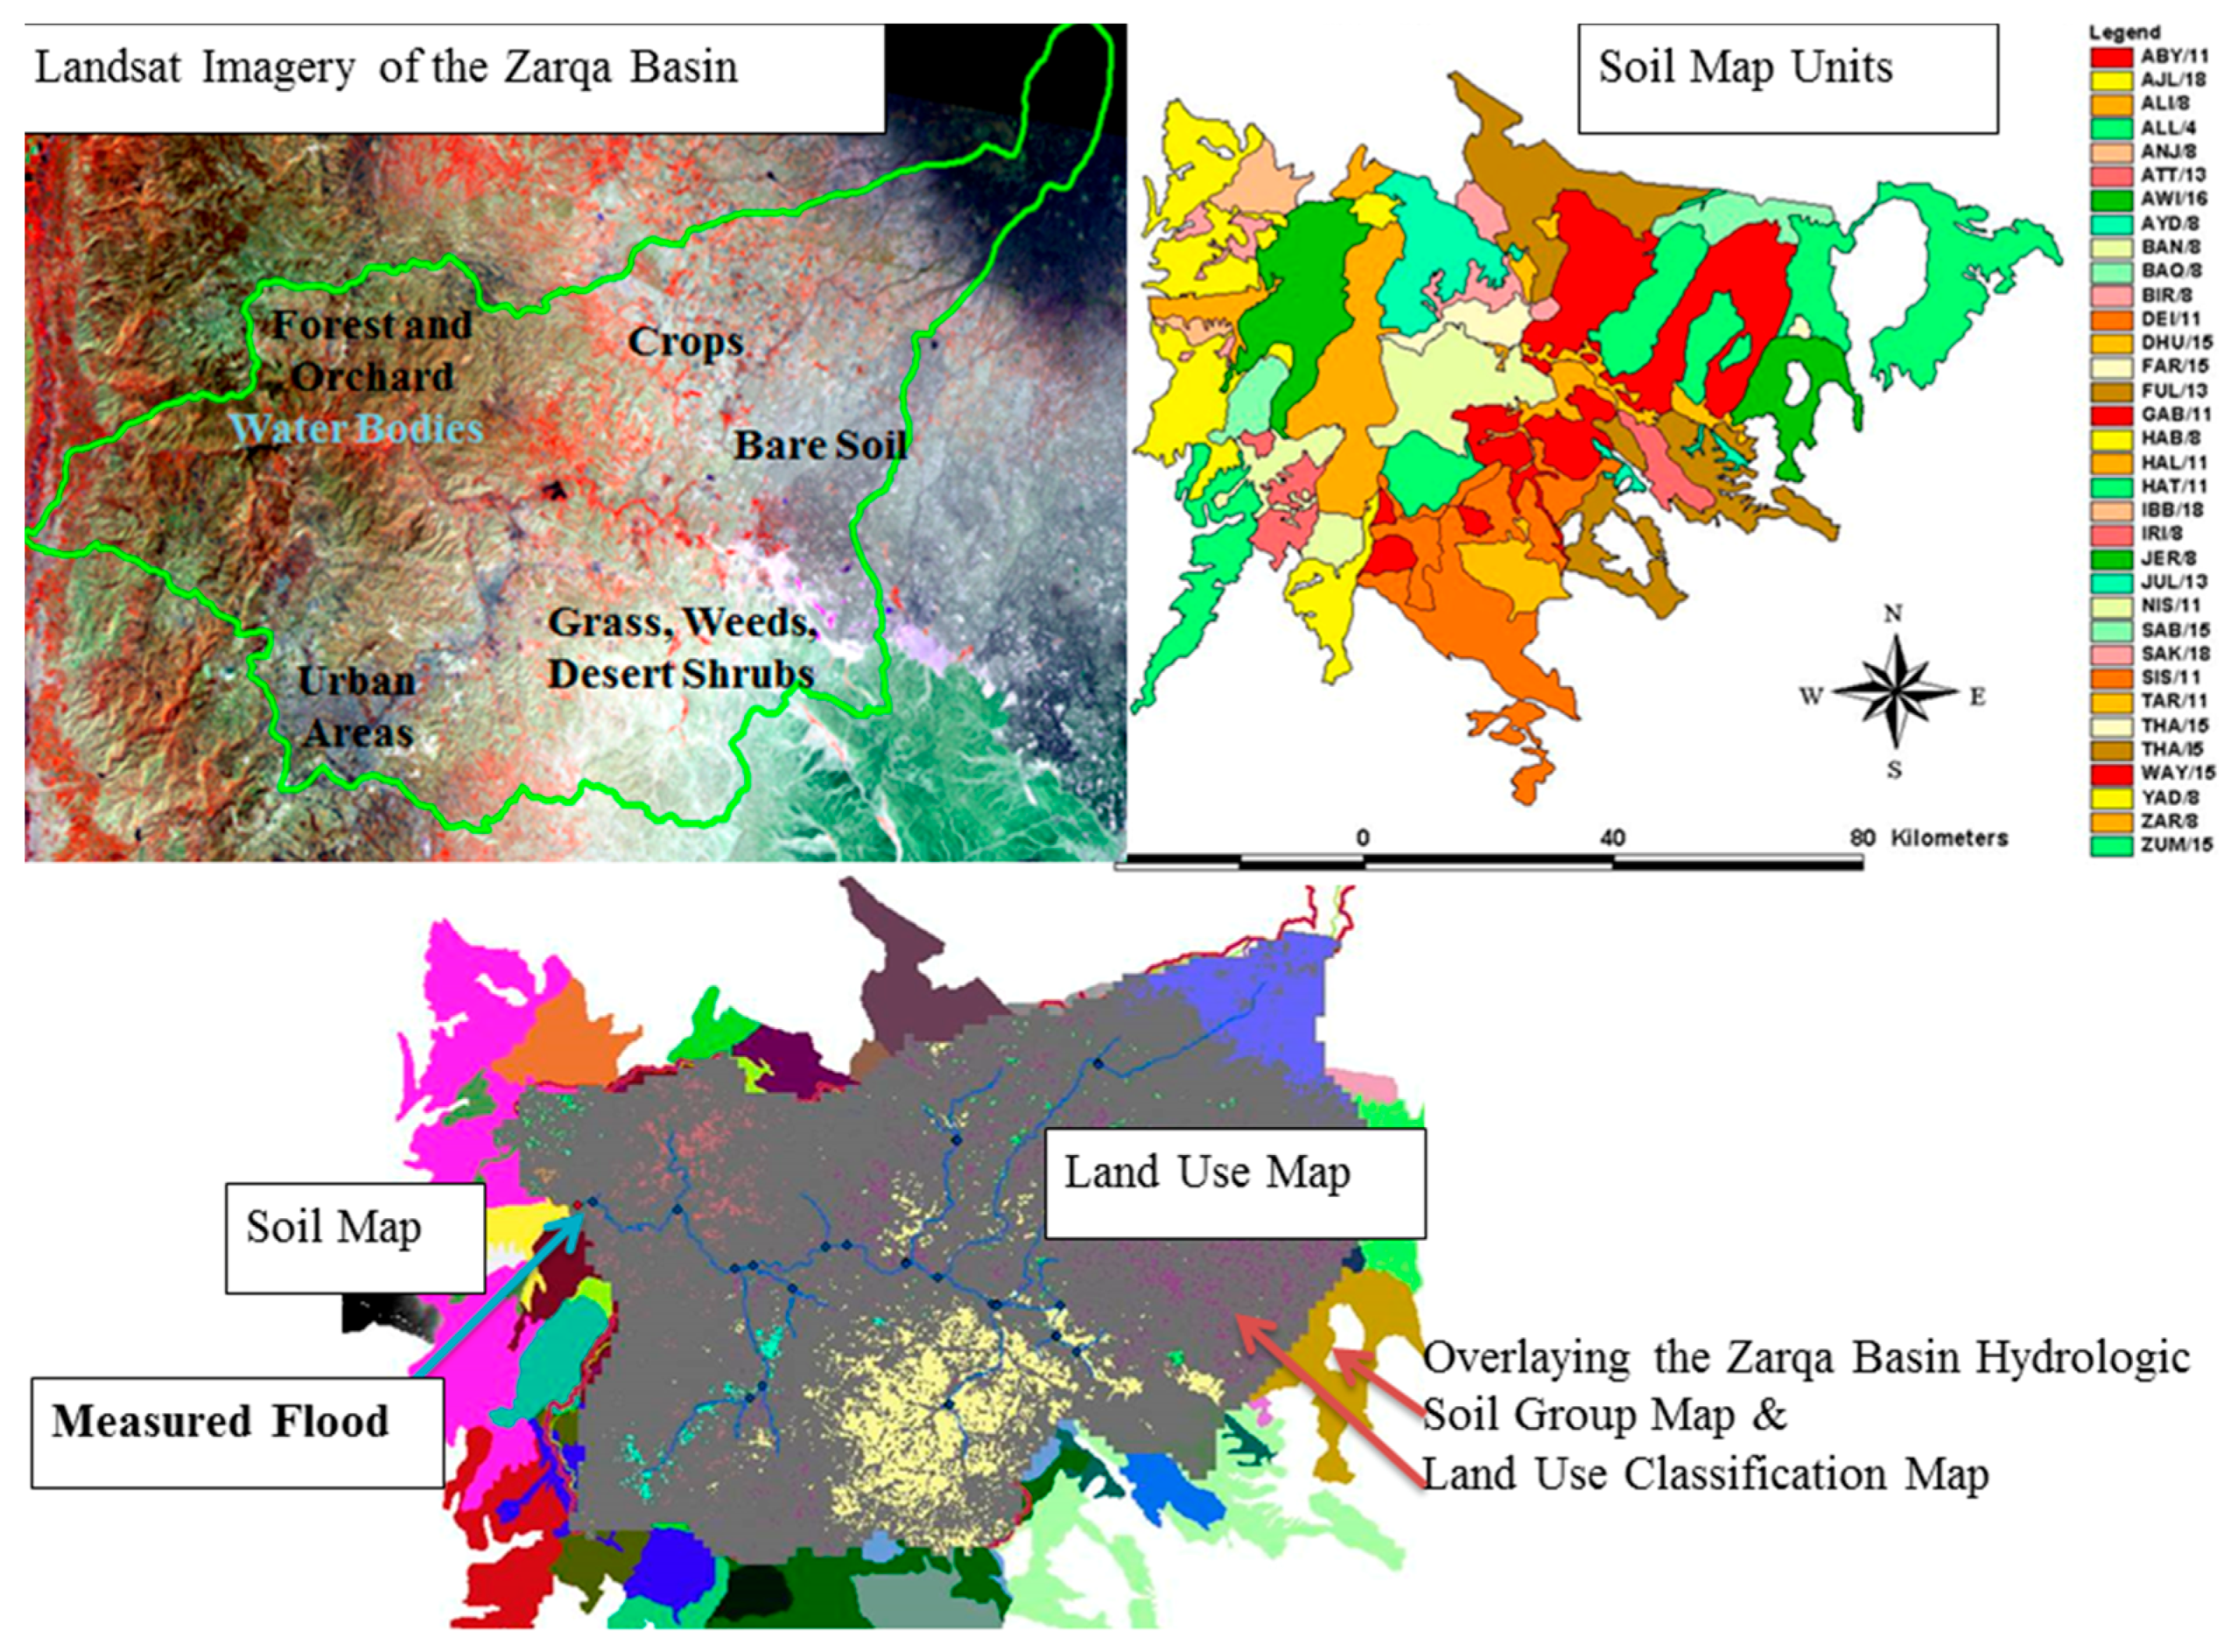
Soil and land use classifications are used for predicting the baseline CN values of the Zarqa River Basin. This is done by overlaying the classification of Hydrologic Soil Groups with the land use maps of the Zarqa River Basin. The identification of the existing CN for the average rainy year will be in parallel with the prediction of runoff using the HEC-1 Model, and the Rainfall–Runoff Model (RRM).
These classifications are based on USDA Soil Conservation Service [2], which considers factors such as soil texture, soil depth, infiltration rate, and layers that impede the downward movement of water. Four hydrologic soil groups A, B, C and D are considered as the basic classification of soils of the watershed as defined in Table 1. The soil textures of the Zarqa River Basin differ according to slope and soil depth in terms of percentages of silty clay loam, clay, silty clay, clay loam, sandy clay loam, and others. The properties of the representative soil profiles of each soil map unit and the description of each soil map unit are classified into their hydrologic soil groups.
The land use classifications from the September 2001 Landsat Enhanced Thematic Mapper (ETM) imagery of the Zarqa Basin include 6 different classes established by using Environment for Visualizing Images (ENVI) software for satellite data analysis. The classes are represented in percentages.
The CN values for each unique area are found by identifying the soil type and assigned land use in the lookup tables of the Soil Conservation Service (SCS) [2]. An example of the values which are considered as a reference for determining the Zarqa Basin CNs is shown in Table 2. The weighted value of CN for the Zarqa Basin is determined according to the Equation (1).
CN (weighted) = ∑ (CNi X Ai)/A,
- CN = Weighted curve number.
- CNi = Curve number for each unique soil and land use.
- Ai = Area with curve number CNi, and A = Total area.
The CN for the average antecedent moisture condition AMC II can be converted to the dry condition AMC I and the wet condition AMC III using Equations (2) and (3) [3]:
CN (I) = 4.2 CN (II)/10 − 0.058 CN (II),
CN (III) = 23 CN (II)/10 + 0.13 CN (II)
3. Results and Discussion
3.1. HEC-1 Model, and Rainfall Runoff Model
Prior to running the HEC-1 model, and the RRM, all parameters are checked for consistency. The profile of each soil map unit is classified and results in two Hydrologic Soil Groups (HSGs), HSG B and HSG C, whereas, the land use (existing condition of the land) of the September 2001 Landsat Enhanced Thematic Mapper (ETM) imagery of the Zarqa Basin has been classified into six different classes. The different land use classes are water body, forest and orchard, mixture of grass, weeds and desert shrubs, crops, urban areas, and the bare soil. Table 3 shows the land use classification of the Zarqa River Basin in percentages. The Zarqa River Basin hydrologic soil group map and the land use classification map are overlaid to determine the CNs of the entire watershed using the HEC-1 Model. Figure 2 Shows the Zarqa River Basin’s soil and land use classification maps.
The standard SCS Table [2] is used to estimate the initial CN values, then, the HEC-1 Model runs the simulations and adjusts the CN values until the measured runoff is computed within a close amount. Table 4 shows the weighted CNs for the Zarqa Basin where the average weighted CNs for the Zarqa River Basin are 59 (dry), 78 (normal) and 89 (wet). During the growing season, the average curve numbers are 52, 72 and 86. These weighted baseline CNs are the keys to modeling/simulating the runoff at the Zarqa Basin’s outlet; Runoff Gauge at Jerash Bridge, and the expected CN adjustments for restoration scenarios.
The HEC-1 Model is run using the Watershed Modeling System (WMS) [16,17,18,19]. The results of running the HEC-1 Model show that the annual calibrated (modeled) runoff volume is 36.4 MCM from the total rainfall storms, which totaled 911 MCM. The measured (actual or observed) total runoff volume of the Zarqa Basin outlet was 36.6 MCM. Thus, the simulated runoff with a value of 36.4 MCM almost matches the figures of the gauged values from the Ministry of Water and Irrigation. It should be noted that this excludes the base flow. The base flow consists of the effluent of the wastewater treatment plant of khirbet es-Samra which is about 2.0 m3/s. The calibrated runoff value of 36.4 MCM is achieved after adjusting the CN values (model calibration), and shows that the land uses are 0.3% water body, 9.3% forest and orchard, 71% mixture of grass, weeds, and desert shrubs, 7.0% crops, 4.0% urban areas, and 8.4% bare soil. Thus, the amount of runoff in the HEC-1 Model is a function of the parameters, primarily, the composite CN of the Zarqa River Basin for a specific year. Using the land use percentages of the HEC-1 Model with the RRM will also simulate the flow for the same year 2001/2002. The RRM incorporates the existing conditions by setting up the basin’s parameters as rainfall, temperature, geometry, morphometry, and land use distributions.
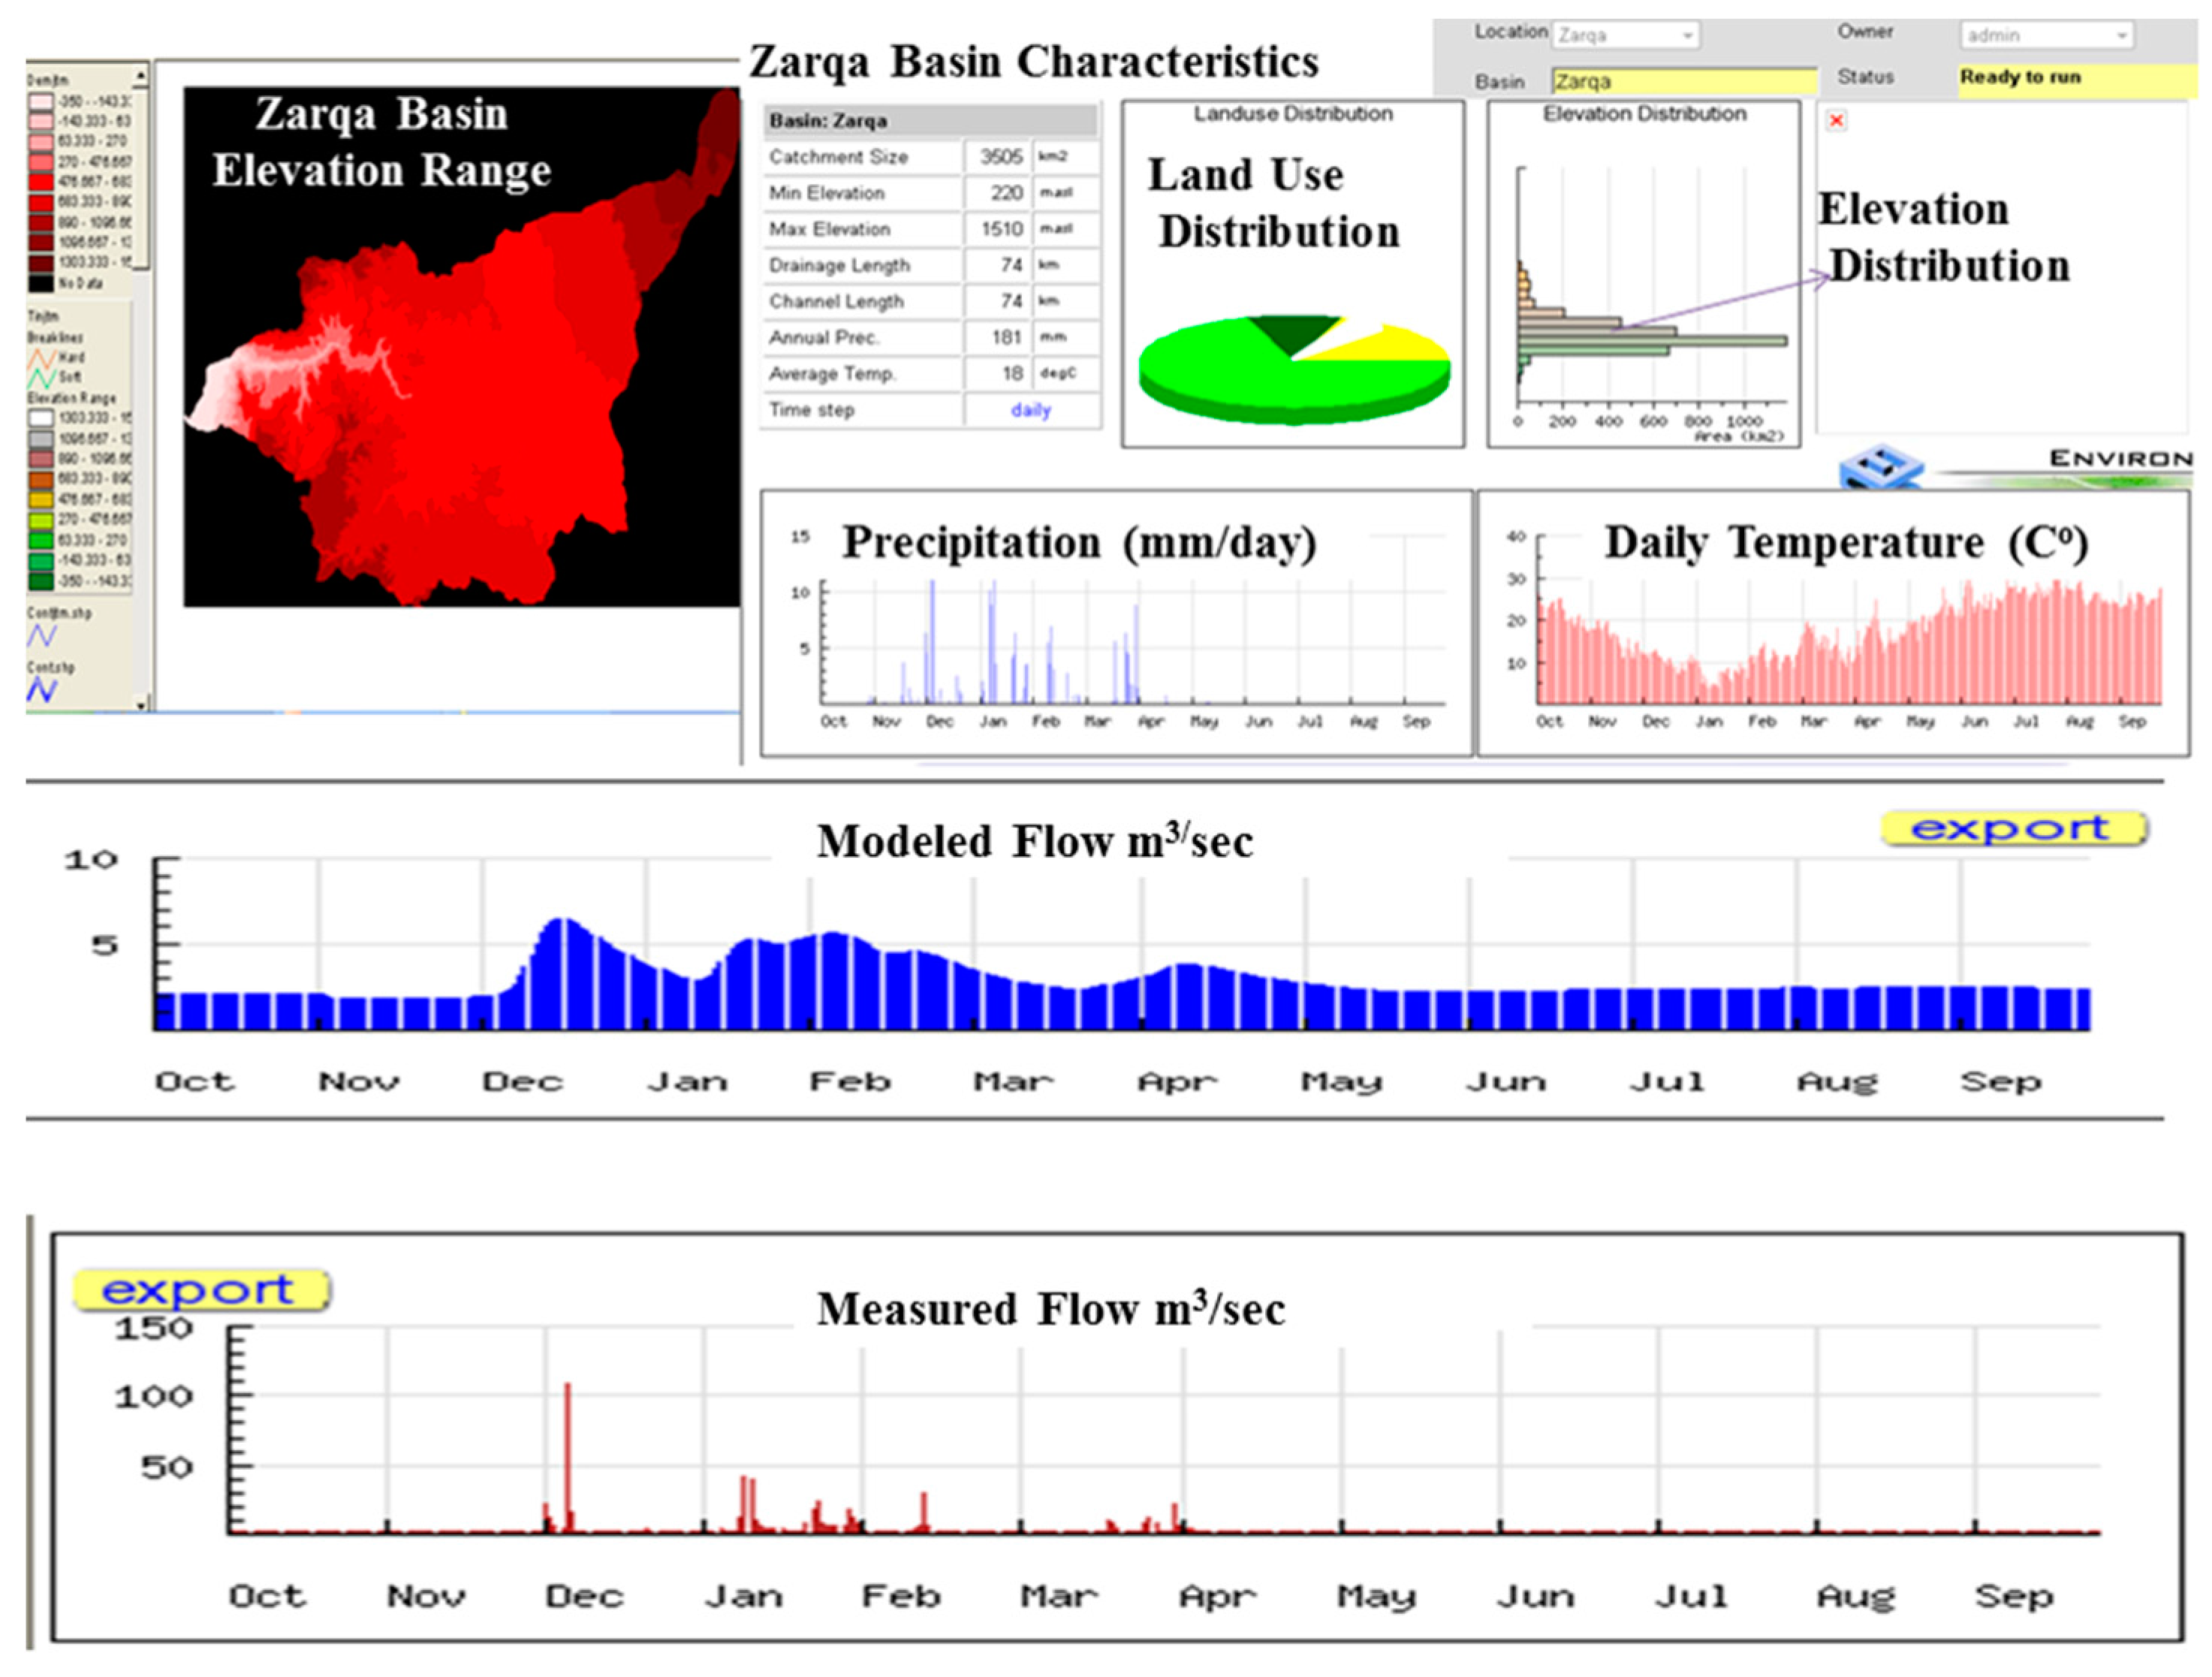
The Rainfall–Runoff Model (RRM) is run online using the huge capability of the Environmental Software and Services (ESS) server [17,18]. Figure 3 shows the Zarqa River Basin’s flow simulation. It also shows the time series of precipitation (mm/day), the average daily temperature (°C), and the measured and modeled flow for the studied year (1 October 2001 to 30 September 2002). The results of running the RRM show that the average modeled flow (runoff and base-flow) is about 2.97 m3/s or about 93.7 MCM/year, which matches the figures of the Ministry of Water and Irrigation 2002, with an average value of 2.96 m3/s or about 93.4 MCM/year. The simulated flow is highly compatible to the current (measured) flow due to the simulation capability of RRM, which has been set up based on the existing conditions of the basin, primarily the land use for that year.
Comparing the results of the HEC-1 Model in predicting the Zarqa River Basin runoff, with the RRM’s predicted water flow of the Zarqa River Basin proved their simulation efficiency. Nevertheless, the HEC-1 Model uses a single storm event and is based on values of curve number, while the RRM is a dynamic, spatially lumped model that operates at a daily time step, and estimates the flow as a function of the basin characteristics. The models’ predictions for the real runoff and flow definitely establish the modeling certainty and help water resource developers to incorporate different basin features for watershed simulation and restoration.
3.2. CN Applications for Watershed Restoration
Using the baseline result from Section 3.1, the proposed changes in land use can be simulated via the HEC-1 Model and provide a mechanism to evaluate conservation mechanisms for Zarqa River Basin restoration planning. Two scenarios are developed here as tools for making decisions on the land class [22] of mixtures of grass, weeds, and desert shrubs. Table 5 shows the weighted CNs for the Zarqa Basin restoration, simulated using the HEC-1 Model.
First scenario: This scenario proposes the use of contours to lands which are mixtures of grass, weeds, and desert shrubs. The average weighted CNs for the Zarqa River Basin are 58, 76 and 88 under dry, normal and wet conditions respectively. During the growing season, the average CNs are 51, 71 and 85. The results of running the HEC-1 Model show that the annual average predicted runoff volume is 33.1 MCM from the total rainfall.
Second scenario: This scenario proposes the use of contours, terraces and crop residues to lands which are mixtures of grass, weeds, and desert shrubs. The average weighted CNs for the Zarqa River Basin are 57, 75 and 87. During the growing season, the average CNs are 50, 70 and 84. The results of running the HEC-1 Model show that the annual predicted runoff volume is 28.4 MCM from the total rainfall based on the average rainy season of 2001/2002.
Herein, the results of running the HEC-1 Model and the RRM as baseline scenarios for runoff prediction are compared. The HEC-1 Model shows that the average calibrated runoff is about 36.4 MCM (excluding the base-flow), whereas the RRM shows that the average modeled flow (runoff + base-flow) is about 2.97 m3/s; about 93.7 MCM/year. Land use change scenarios are affecting CNs as the predicted runoff decreases from 36.4 to 33.1 by applying contours, and then to 28.4 by applying contours, terraces and crop residues. The land use changes will help in enhancing the infiltration of water into the soil to increase soil moisture storage and recharge groundwater, while maintaining sufficient surface water downstream of the basin. This will lead to the gradual restoration of the watershed with time. Land use changes have been demonstrated in protected areas in the adjacent watershed. Thus, the models can present, simulate, predict the flow, and provide watershed restoration options for decision makers.
3.3. Sustainability of the Zarqa River Basin
The area of the basin before 1900 was thriving with scattered forests, bushes and pastures and was grazing land for domestic and wild animals such as camels, sheep, deer and Zebras. It was also a haven for migrating birds. Since the beginning of the 20th century, the area has suffered from gradual deforestation, overgrazing, land degradation and soil erosion resulting in bare lands which are subject to wind and water erosion. In addition, since the middle of last century, the basin has witnessed the expansion of urban areas associated with an increase in the construction of roads and other infrastructure. This further increases land degradation and loss of land cover. These conditions also enhance runoff and erosion and reduce water storage in the soil profile.
The suggested interventions of land restoration such as contouring, terracing and crop residues has changed land use and thus reduced CN values (Table 5). Runoff has decreased from 36.4 MCM to 28.4 MCM using the above measures, indicating that an additional 8.0 MCM of water will be stored in the soil profile. Over the area of the basin of 4120 km2, an additional 50 mm of water could help in supporting plant cover. This could be considered as an element of sustainability [23] by maintaining the basin’s integrity, thus improving food production.
4. Conclusions
The conclusions derived from using the HEC-1 Model and the RRM tools for the Zarqa River Basin restoration include the following:
- The water resources of the Zarqa River Basin are of a complex system because water is transferred into and out of the basin. In addition, treated wastewater and desalinized water contributes to the system;
- The HEC-1 Model was used with baseline CNs based on existing conditions, primarily the distribution of land uses for the targeted year (the average rainy year); proposing CN restoration scenarios is a successful tool for the Zarqa River Basin. The calibrated runoff value of 36.4 MCM (excluding the base-flow) is achieved and shows that the average weighted CNs for the Zarqa River Basin are 59, 78 and 89 for the dry, normal and wet condition respectively. During the growing season, the average CNs are 52, 72 and 86;
- The RRM successfully simulated the Zarqa River Basin in a model that incorporates the existing conditions by setting up the basin’s parameters as rainfall, temperature, geometry, morphometry, and land use distribution. The average simulated flow is about 2.97 m3/s; about 93.7 MCM/year, which matches the measured flow of 2.96 m3/s; about 93.4 MCM/year (base-flow + runoff). Further applications on basin restoration, via the RRM, are needed.
- The HEC-1 Model and the RRM have been set up at the land use distribution of 0.3% water body, 9.3% forest and orchard, 71% mixture of grass, weeds, and desert shrubs, 7.0% crops, 4.0% urban areas, and 8.4% bare soil. Therefore, changing the percentages of land use distribution through the models will change the daily time series of runoff. This points to the importance of land use change scenarios. The first scenario uses contours and shows a reduction in annual predicted runoff volume by 3.3 MCM. The second scenario of using contours, terraces and crop residues shows a reduction in annual predicted runoff volume by 8 MCM. These reductions in runoff volumes will minimize the long-term negative impacts for the basin by enhancing the infiltration of water into the soil, increasing soil moisture storage, and recharging ground water while maintaining sufficient surface water downstream of the Zarqa River Basin. The approaches in changed land use will allow the validation of future scenarios. This could be considered as an element of sustainability by maintaining the basin’s integrity, thus improving food production.
- The HEC-1 Model and the RRM are useful tools for watershed restoration scenario simulation, where decision makers can implement the distribution of land uses to simulate the behavior of a river basin over time using the models’ parameters. Implementations and decision making are based largely on economic consideration. Thus, decision makers can evaluate the feasibility and the applicability of the land use change approaches towards basin restoration.
- The HEC-1 Model and the RRM are not only strengthening the cohesion between scientific scenarios of modeling, but are also offering new ways of indirect watershed restoration.
Acknowledgments
The application of the Rainfall–Runoff Model was carried out with financial support from the European Commission under FP6 INCO-MED Program; contract INCO-CT-2004-509091.
Author Contributions
Maisa’a Waif Shammout applied the models; Maisa’a W. Shammout, Muhammad Shatanawi and Jim Nelson analyzed the data and they contributed in the analysis tools; Maisa’a W. Shammout wrote the paper.
Conflicts of Interest
The authors declare no conflict of interest.
References
- Rallison, R.E. Origin and evolution of the SCS runoff equation. In Proceedings of the Symposium on Watershed Management, Boise, Idaho, 21–23 July 1980; ASCE: Reston, VA, USA, 1980; pp. 912–924. [Google Scholar]
- USDA-SCS. Urban Hydrology for Small Watersheds; USDA Soil Conservation Service: Washington, DC, USA, 1986.
- Chow, V.T.; Maidment, D.R.; Mays, L.W. Applied Hydrology; McGraw-Hill Book Company: New York, NY, USA, 1988. [Google Scholar]
- Rawls, W.J.; Ahuja, L.R.; Brakensiek, D.L.; Shirmohammadi, A. Infiltration and Soil Water Movement; McGraw-Hill: New York, NY, USA, 1993. [Google Scholar]
- Rawls, W.J.; Onstad, C.A.; Richardson, H.H. Residue and tillage effects on SCS runoff curve numbers. Trans. ASAE 1980, 23, 357–362. [Google Scholar] [CrossRef]
- Schwab, G.O.; Frevert, R.K.; Edminster, T.W.; Barnes, K.K. Soil and Water Conservation Engineering, 3rd ed.; John Wiley and Sons: New York, NY, USA, 1981. [Google Scholar]
- Moss, C.G.; Edwards, D.R.; Workman, S.R.; Williams, R.M. Runoff from fescue plots treated with TRIMEC. Trans. ASAE 1999, 42, 1631–1636. [Google Scholar] [CrossRef]
- Haith, D.A.; Andre, B. Curve number approach for estimating runoff from turf. J. Environ. Qual. 2000, 29, 1548–1554. [Google Scholar] [CrossRef]
- Shammout, M.W. Comparison and Assessment of Success of Models in Watershed Simulation and Management. J. Water Resour. Prot. 2014, 6, 599–608. [Google Scholar] [CrossRef]
- Shatanawi, M.; Shammout, M.W.; Naber, S. Water conflicts among sectors and environmental uses in Jordan. In Proceedings of the Water Culture and Water Conflict in the Mediterranean Area, Nabeul-Medenine Tunisia, November 2007; OPTIONS Méditerranéennes: Tunisia, 2008; pp. 159–172. [Google Scholar]
- Shammout, M.W. Land Use Options for Surface Water Management in Zarqa River Basin Using Modeling Tools. Ph.D. Thesis, The University of Jordan, Amman, Jordan, 2003, unpublished. [Google Scholar]
- DOS. Statistical Year Book; Department of Statistics: Amman, Jordan, 2011. [Google Scholar]
- Shatanawi, M.; Shammout, M.W. Supply-demand modeling of water resources in Zarqa river basin in Jordan. Int. J. Appl. Environ. Sci. 2011, 6, 261–278. [Google Scholar]
- Shammout, M.W.; Shatanawi, M.; Naber, S. Participatory Optimization Scenario for Water Resources Management: A Case from Jordan. Water Resour. Manag. 2013, 27, 1949–1962. [Google Scholar] [CrossRef]
- Al-Qaisi, B. Climate Change Effects on Water Resources in Amman Zarqa Basin-Jordan; Ministry of Water and Irrigation: Amman, Jordan, 2015.
- US-HEC. HEC-1, Flood Hydrograph Package, User’s Manual; Hydrologic Engineering Centre: Davis, CA, USA, 1998. [Google Scholar]
- ESS-GmbH. Optimisation for Sustainable Water Resources Management, OPTIMA. Available online: http://www.ess.co.at/OPTIMA/ (accessed on 6 September 2017).
- ESS-GmbH. WaterWare Models: RRM Rainfall-Runoff Model. Available online: http://80.120.147.42/MANUALS/WATERWARE/webrrm.html (accessed on 2 October 2017).
- Aquavea. Watershed Modelling System (WMS). Available online: https://www.aquaveo.com/software/wms-watershed-modeling-system-introduction (accessed on 16 December 2017).
- Harmancioglu, N.B.; Fedra, K.; Barbaros, F. Analysis for sustainability in management of water scarce basins: The case of the Gediz River Basin in Turkey. Desalination 2008, 226, 175–182. [Google Scholar] [CrossRef]
- Fedra, K.; Jamieson, D.G. The ‘WaterWare’ decision-support system for river-basin planning. 2. Planning capability. J. Hydrol. 1996, 177, 177–198. [Google Scholar] [CrossRef]
- Farjad, B.; Pooyandeh, M.; Gupta, A.; Motamedi, M.; Marceau, D. Modelling Interactions between Land Use, Climate, and Hydrology along with Stakeholders’ Negotiation for Water Resources Management. Sustainability 2017, 9, 2022. [Google Scholar] [CrossRef]
- UN. The Sustainable Development Goals Report; UN: New York, NY, USA, 2016. [Google Scholar]
Figure 1.
Location of the Zarqa River Basin and the main cities within it.

Figure 2.
The Zarqa River Basin’s soil and land use classification maps.

Figure 3.
Flow simulation of the Zarqa River Basin.


Table 1.
Hydrologic Soil Groups (HSGs) classification [2].
Table 1.
Hydrologic Soil Groups (HSGs) classification [2].
| HSG | Properties |
|---|---|
| Group A | Soils have low runoff potential and high infiltration rates even when thoroughly wetted. They consist mainly of deep, well to excessively drained sand or gravel and have a high rate of water transmission. |
| Group B | Soils have moderate infiltration rates when thoroughly wetted and consist mainly of moderately deep to deep, moderately well to well drained soils with moderately fine to moderately coarse texture. These soils have a moderate rate of water transmission. |
| Group C | Soils have low infiltration rates when thoroughly wetted and consist mainly of soils with a layer that impedes downward movement of water and soils with moderately fine to fine texture. These soils have a low rate of water transmission. |
| Group D | Soils have high runoff potential. They have very low infiltration rates when thoroughly wetted and consist mostly of clay soils with a high swelling potential, soils with a permanent high water table, soils with a clay pan or clay layer at or near the surface, and shallow soils over nearly impervious material. These soils have a very low rate of water transmission. |
Table 2.
Curve numbers of the Soil Conservation Service (SCS) [2] example.
Table 2.
Curve numbers of the Soil Conservation Service (SCS) [2] example.
| CN for Arid and Semiarid for Range Lands | |||||
| Cover Type | Hydrologic Condition | CN and Soil Type | |||
| A | B | C | D | ||
| Herbaceous-mixture of grass, weeds and low-growing brush | Poor | - | 80 | 87 | 93 |
| Fair | - | 71 | 81 | 89 | |
| Good | - | 62 | 74 | 85 | |
| Runoff CN for Urban Areas | |||||
| Urban Areas | 89 | 92 | 94 | 95 | |
Table 3.
Land use classification of the Zarqa River Basin in %.
| No. | Class | % |
|---|---|---|
| 1 | Water body | 0.3 |
| 2 | Forest and orchard | 9.3 |
| 3 | Mixture of grass, weeds, and desert shrubs | 71 |
| 4 | Crops | 7.0 |
| 5 | Urban areas | 4.0 |
| 6 | Bare soil | 8.4 |
Table 4.
Weighted curve numbers for the Zarqa Basin.
| Remaining Time | Vegetation Period (Growing Season) | ||||
|---|---|---|---|---|---|
| Dry Condition | Normal Condition | Wet Condition | Dry Condition | Normal Condition | Wet Condition |
| 59 | 78 | 89 | 52 | 72 | 86 |
Table 5.
Weighted curve number (CN) applications for the Zarqa Basin restoration using the HEC-1 Model.
Table 5.
Weighted curve number (CN) applications for the Zarqa Basin restoration using the HEC-1 Model.
| Land Use Change | Remaining Time | Vegetation Period (Growing Season) | |||||
|---|---|---|---|---|---|---|---|
| Dry Condition | Normal Condition | Wet Condition | Dry Condition | Normal Condition | Wet Condition | Predicted Runoff | |
| Contour | 58 | 76 | 88 | 51 | 71 | 85 | 33.1 MCM |
| Contour Terraces & Crop Residue | 57 | 75 | 87 | 50 | 70 | 84 | 28.4 MCM |
© 2018 by the authors. Licensee MDPI, Basel, Switzerland. This article is an open access article distributed under the terms and conditions of the Creative Commons Attribution (CC BY) license (http://creativecommons.org/licenses/by/4.0/).
Share and Cite
MDPI and ACS Style
Shammout, M.W.; Shatanawi, M.; Nelson, J. Curve Number Applications for Restoration the Zarqa River Basin. Sustainability 2018, 10, 586. https://0-doi-org.brum.beds.ac.uk/10.3390/su10030586
AMA Style
Shammout MW, Shatanawi M, Nelson J. Curve Number Applications for Restoration the Zarqa River Basin. Sustainability. 2018; 10(3):586. https://0-doi-org.brum.beds.ac.uk/10.3390/su10030586
Chicago/Turabian StyleShammout, Maisa’a W., Muhammad Shatanawi, and Jim Nelson. 2018. "Curve Number Applications for Restoration the Zarqa River Basin" Sustainability 10, no. 3: 586. https://0-doi-org.brum.beds.ac.uk/10.3390/su10030586
Note that from the first issue of 2016, this journal uses article numbers instead of page numbers. See further details here.