Article

Studies and Investigation about the Attitude towards Sustainable Production, Consumption and Waste Generation in Line with Circular Economy in Romania

1
Department of Management and Economical Engineering, Faculty of Machine Building, Technical University of Cluj-Napoca, Cluj-Napoca 400641, Romania
2
Center for Innovation and Organizational Sustainability, Cluj-Napoca 400609, Romania
3
Department of Industrial Engineering and Management, Faculty of Engineering, Lucian Blaga University of Sibiu, Sibiu 550024, Romania
4
Academy of Romanian Scientists, Bucharest 010071, Romania
5
Department of Environmental Engineering and Sustainable Development Entrepreneurship, Faculty of Materials and Environmental Engineering, Technical University of Cluj-Napoca, Cluj-Napoca 400641, Romania
6
Nicolae Balcescu Land Forces Academy, Sibiu 550170, Romania
*
Author to whom correspondence should be addressed.
Sustainability 2018, 10(3), 865; https://0-doi-org.brum.beds.ac.uk/10.3390/su10030865
Submission received: 29 December 2017 / Revised: 10 March 2018 / Accepted: 13 March 2018 / Published: 19 March 2018
(This article belongs to the Collection Trends in Municipal Solid Waste Management)

Abstract

:
With a rapidly growing world population and the need to address the issue of consumption of global resource and its associated environmental impacts and other social and economic issues, the demand for a responsible consumption, production and prevention of waste generation become increasingly crucial. With this broad characterization of Sustainable Consumption and Production (SCP), businesses based on circular economy should become the norm. With this goal in mind, an online questionnaire survey was performed on a nationwide scale, to explore consumers’ behaviors and attitudes. It was distributed in all four of Romania’s macro-regions and reached 642 respondents. The purpose of the study has been to better understand consumers’ behavior regarding sustainable consumption and production and examine whether generations play a role in responsible consumer attitudes toward the products. Three generations (X, Y, and Z) have been examined and compared. The results show that what extent those three generation agree with the environment and the benefits of reducing resource consumption, also waste generation, selective collection, recycling and reuse. However, most of them have not adopted and do not intend to adopt consumer patterns based on the circular economy. The findings provide empirical evidence and directions that could help marketers identify their consumer’s characteristics and market segments and develop consumer empowerment strategies on the Romanian market.

1. Introduction

A growing population can impact the demand and supply of food, fuel, consumer products and services, and other ecosystems, and thereby the marketing industry which is closely associated with the production and consumption of these products and services [1]. Also, the effects of population growth lead to an increase in waste generation. Global material resource use in 2030 is expected to be twice that of 2010 [1], while the most recent United Nations forecast suggests that the global population is likely to exceed 11 billion by the end of the 21st century [2]. With 7.2 billion people today, the planet is already struggling to meet humanity's demands for land, food and other natural resources, and absorb its waste. In the last four decades, studies dealing with awareness regarding the limits of natural resources pressure business organizations in various sectors to promote innovation in their conceptualization, design, and production methods, until the last stage of product lifecycle [3,4,5]. The research on perceived value for circular business models and environmentally sustainable consumption and production (SCP) becomes even more relevant when considering that green innovation success depends, among other factors, on fulfilling buyer expectations [6,7,8]. Circular economy is focused on maximizing what is already in use, at every point of a product’s life cycle. It preserves our current way of life by making it technically viable on the long run by producing within a closed system, or loop. To prevent or to decrease waste generation [9], firms and public institutions had to reuse materials through a process of disassembling, recouping and recovering, reinforcing, and, finally, repurposing materials already in use [10,11].
Researchers and modeling experts at the Ellen MacArthur Foundation and the McKinsey Center for Business and Environment estimate that, in a circular economy scenario, consumption of new materials could be reduced [12] by as much as 32% within 15 years, and by more than half, at 53%, by 2050 [13]. Raw materials used in construction, car manufacturing, synthetic fertilizer, pharmaceutical products, and pesticide production, fuels and nonrenewable energy, land use etc. can be replaced with recovered and repurposed materials in cascaded use, in circular businesses [14]. Such innovative technologies will not be sufficient to solve the environmental problems related to the growing product demand [15,16]. To maintain a sustainable environment, a better balance between consumption, waste generation, production and livestock production’s impact on the environment will be essential. Also, a change in consumption behavior, business management, and in people education [17,18,19] will be necessary to reduce manufacturing of products-related GHG emissions [16,20]. This study investigates opportunities and bottlenecks of some alternative and more SCP choices in terms of consumer evaluation with the aim of identifying which types of circular business model are more appropriated for Romanian consumers. To identify their consumer characteristics, an inter-generation segmentation analysis is included. Segmentation research, independent of the method used, is designed to identify groups of elements with common characteristics, e.g., consumers with similar attitudes, motivations, responsible habits or lifestyles. Consumers that are grouped together in a potential target segment are intended to be more alike to each other, and dissimilar to consumers outside the segment [21,22,23,24].
Segmentation research allows a better understanding on how to make SCP choices more relevant to different consumers and how to better position sustainable products in a competitive marketing environment. From this angle, distinct consumer profiles can be established, which provide insights on how to target, communicate and convince these distinct groups to make more SCP choices.
Furthermore, the researchers seek to answer the following questions:
(a)
Is there a difference in SCP attitude between the X generation, Millennials (Y) and Post-Millennials (Z)?
(b)
How do consumers’ SCP behaviors influence the new circular economy business models?
(c)
What needs to be done to increase green consumption behavior?
Research studies have found that millennials agree with protecting the environment and that there are benefits in reducing resource consumption, selective collection, recycling and reuse. However, most of them have not adopted and do not intend to adopt consumer patterns based on the circular economy and exhibit diverse levels of environmental concern and attitude. In general, millennials showed a more positive attitude or higher environmental concerns compared to other generations [25,26]. However, whether male and female consumers exhibit different levels of environmental attitude and concern toward SCP remains to be further investigated.
In line with these notions, it is the purpose of this study to provide an understanding of consumers’ behavior regarding SCP and generation-based distinctions in attitudes, which can benefit marketers to better understand their consumer characteristics and develop more efficient market communication strategies. The rationale of the relations among the variables are presented in the following sections. The next section provides a discussion and analysis of some of the CE literature including the variety of definitions that exist and identifies some of the limitations of these, frameworks for SCP and generations X, Y and Z analyses. In section three, we work on the research and methods that help us characterize consumer behavior oriented to CE and then we analyzed the questionnaire survey on a national scale. After this, we arrive with the research findings and the conclusion which looks like the most of respondents have not adopted and do not intend to adopt consumer patterns based on the circular economy. Finally, the discussion and final remarks are presented in section six.

2. Background and Analytical Framework

2.1. Frameworks for Sustainable Consumption and Production (SCP)

The formal introduction of the Sustainable Consumption and Production concept occurred during the 1992 World Summit on Sustainable Development, emerging as a response to the sustainability challenges facing communities around the globe. It has been defined by the Norwegian Ministry of Environment, in 1994, as "the use of services and related products, which respond to basic needs and bring a better quality of life while minimizing the use of natural resources and toxic materials as well as the emissions of waste and pollutants over the lifecycle of the service or product so as not to jeopardize the needs of further generations" [27]. Twenty years later, at Rio+20, the United Nations Conference on Sustainable Development reaffirmed the commitment towards SCP via the creation of a 10-year framework of SCP programs.
To achieve sustainable development, efforts should go beyond cleaner production to sustainable consumption [28]. In a narrow sense, sustainable consumption only includes buyer behaviors towards greener products that bring less pollution during production [29]. In a broader sense, it needs a reconsideration to change lifestyles, and changing consumption habits is key for success of sustainable consumption [30]. Generally, sustainable consumption has become increasingly important to prevent non-environmental practices of manufacturers [31]. Thus, sustainable consumption has gained increasing attention all over the world. For SC, in addition to end-users, the producer is also a consumer, e.g., as in the consumption of raw material, consumers of labor and consumers of other producers’ products and services [32,33]. Princen [34] has argued that SC in a deep sense addresses: “throughput (the overall flow of material and energy in the human system), growth (increasing economic activity or throughput or both), scale (the relationship of the scope and speed of economic or ‘material provisioning’ activity to human and ecological capacity), and patterns of resource use (the quantities and qualities of products used, their meanings and their changes per capita over time)”.
This view is being reflected in a growing body of research that represents a perspective on the political economy of consumption, e.g., Cohen [35]. The political economy of consumption sees patterns such as intensifying environmental stress, growing economic volatility and widening social inequality as being interlinked that need to be addressed within the same framework.
In existing SCP literature, sustainable consumption and sustainable production are generally treated as two discrete constructs within SCP systems. Sustainable consumption is concerned with “raising awareness and changing consumer behavior, values, and motivations” [36,37]. Sustainable production is mostly concerned with “not only the volume and types of goods and services produced, but the process of making them, the natural resources extracted to make them, and the waste and pollution resulting from the extraction, production, and affiliated process resulting in a particular ‘good’” [38]. A rich stream of multidisciplinary research has developed since the SCP concept was introduced exploring how and why [39] some companies engage in SCP activity as well as measuring the impacts sustainable production processes achieve [40].
As SCP requires consumers and producers to adopt different approaches towards their purchasing and use patterns, it has often been associated with social movements [38]. Yet, SCP has been increasingly associated with improved health and quality of life as well. The Lifestyles of Health and Sustainability (LOHAS) marketplace has emerged as a way to frame and market the direct health and quality of life improvements obtained by consumers embracing sustainable consumption of goods and services.
The political economy perspective makes the green consumerism approach rather shallow, as it mainly addresses (green) technology for more efficient production, green purchasing behavior by end-users of products, and recycling activities at the end of life of products. There are however recent indications that government of especially industrialized countries, in the face of growing resource scarcity, economic-growth stagnation, and pressure from growing social movements [35] might be thinking of this deeper approach. This can be seen in examples such as the European Commission Communication “GDP and beyond: Measuring progress in a changing world”, which outlines an EU roadmap with key actions to improve indicators of progress in ways that meet citizens’ concerns and make the most of new technical and political developments [41]. Consequently, the increased emphasis on efficiency and green consumerism has allowed governments to walk a fine line that pays lip service to SCP while still allowing consumer sovereignty, and tacitly or explicitly encouraging continuous consumption and production. For SCP, the tendency is to understand the drivers of consumption and production and intervening at a preventive level [36].

2.2. The Concept of Circular Economy

This concept originates from the industrial ecology paradigm, building on the notion of loop-closing emphasized in German and Swedish environmental policy, and has been pursued by China’s environmental policy makers as a potential strategy to solve existing environmental problems [42].
This holistic concept is supported by many stakeholders, but is mostly championed by the Ellen MacArthur Foundation, who depicts it as a solution to sustainability and thriving ability for both business and planet.
The concept is usually presented as an alternative to the ‘linear economy’ [43], which according to the Ellen MacArthur Foundation, is synonymous with a ‘take-make-waste’ approach to goods and services production.
Circular Economy is systemic by design of close-looped, restorative, waste-free, based on effectiveness and running on renewable energy [44].
Circular Economy supporters portray it as an exciting and as a whole new way of transforming the economy into a regenerative economic system that will, as a baseline, exist within planetary limits. The concept of a circular business model is becoming prominent in advancing the transition towards a circular economy. The current understanding of concept diverges mostly with regard to production, [45] related resource efficiency strategies such as reducing material leakages, emission reduction and energy recovery [46,47], but also efficient use of products, substituting primary material input by secondary production, extending average lifetime of products through long-life design and measures, such as repair or remanufacturing, and recycling materials [47,48,49]. The concept of a “Circular Economy” has gained much traction in the global business community in the last 5 years [50].
In order to implement a sustainable procurement process, new sustainable business models that would introduce sustainability into the company’s processes and subsequent value position are required. These require companies to rethink and redesign their business models to better engage with stakeholders, while creating competitive advantages to customers, the company, and society [51,52]. This redesign of business models should transform the relationship between supplier and procurer from a product-focused to a more service-focused one.
A business model is a comprehensive understanding of how a company does business and how value is created [53]. It articulates the logic, data, and other evidence that support a value proposition for the customer, and a viable structure of revenues and costs for the company delivering that value. Since a company may have different value propositions, it may have more business models at different organizational levels and, consequently, hierarchical relationships between these business models [54].
The inclusion of sustainability specifications in the procurement process requires a continuous adjustment of the company’s internal activities and, therefore, complies with an established vision of corporate sustainability (CS). CS covers the entire life cycle of a product or service, from downstream (i.e., extraction), to upstream (i.e., disposal), and their use. CS has to be addressed holistically, in ways that the stakeholder sustainability specifications are addressed systemically throughout the entire life cycle, now and in the future. The integration of CS into business activities has challenged traditional business models. This has pushed companies to better engage with stakeholders, while creating competitive advantages to customers, the company, and society.
The redesign of business models changes the relationship between the supplier and procurer of goods and moves away from a fully product-focused model to also including service-focused operations. This change results in a shift from selling products to providing service solutions, offering a multi-issue (i.e. economic, environmental, and social) value for the customer needs, including time dimension (i.e. now and in the future). This process also includes other stakeholders involved in the life cycle of the product.
One of the alternatives to become more circular is moving from a product economy to a more product/system combination, where products are recovered. Product-service systems, directed at reducing the total environmental burden of consumption could contribute to the more efficient use of resources. Upon Catherine Weetman, the following principles of the Circular Economy are inspired by nature [55]:
(a)
“Waste = food: in living systems, there is no such thing as ‘waste’—one species’ waste becomes food for another species. […] We can reduce waste by redesigning products so they can be reused or disassembled at the end of life, keeping the products and their materials at their highest values at all times.
(b)
Build resilience through diversity: this principle uses nature as a model, explaining that living systems are diverse, with many, many different species to support the ecosystem against shocks (e.g. drought, floods). Nature has a wide pool of resources and can share strengths building up the overall, health of the system and creating resilience. Companies, nations and economic systems can use diversity to build resilience and resources.
(c)
Use renewable energy: the circular economy is about many actors working together, creating effective flows of both materials and information, with everything increasingly powered by renewable energy.
(d)
Think in systems: looking at the connections between ideas, people and places to create opportunities for people, planet and profit”.

2.3. Generations X, Y and Z

Is it possible that different generations have different consumption habits? Marketers say it is. So, we grouped the results of convenient sampling based on generations: X, Y and Z.
According to Goldman Sachs [56], generation X comprises the persons aged between 37 and 52 in 2017. They prioritize spending on their families (children, housing, etc.) and are faced with higher costs for things like education, healthcare and property, but they are under - indexing on things like autos. According to Aaron Haimovitz, generation X has more spending power than any other generation and their buying behavior will come in line with the following values: they desire to provide for their family, they desire to take care of themselves and they prefer to play it safe [57]. This generation is also seen as resilient and pragmatic which matters not just for consumption, but also for their impact on the world given that X-ers are moving into leadership positions, both within companies and countries [57].
According to Bruce Tulgan, “Generation X started as a term among advertising executives, to serve as a code for those 52 million young Americans they considered difficult to pin down as a target market” [58].
“Since childhood, Xers have been providing themselves to themselves by defining and solving for themselves the problems of everyday life, from making breakfast for themselves when their parents were getting ready for work, to making dinner for themselves when their parents had to work late.”
Misconceptions related to gen X: they are disloyal, they are arrogant, they have short attention spans, Xers are not willing to pay dues and Xers can not stand differed gratification. The truth is: Xers know that the old fashioned workplace bargain—dues paying and loyalty for security—is obsolete. Also, Xers’ are self-confident, not arrogant. Xers’ natural inclination to multiple focus (homework, remote control, telephone) and selective elimination makes Xers well suited to the multiple technologies of our times. The concept of paying one’s dues depends on a notion of long-term investment. Xers are used to a short-term world in which nothing is certain. Xers have learnt to check carefully feedback from the world around them in order to see what is changing and what is staying the same, what is working and what is not working anymore [58].
Generation Y, or Millennials, come with a different world view, because they grew up in different, changing times, offering them priorities and expectations quite different from the generations before them. The generation comprises of persons born between 1980 and 2000 [59,60].
According to Bruce Tulgan: “The power of diversity has finally kicked over the melting pot. Generation Y is the most diverse generation in history in terms of ethnic heritage, geographical origin, ability/disability, age, language, lifestyle preference, sexual orientation, color, size, and every other way of categorizing people. How do they deal with this? They want to customize everything” [61].
Generation Z, or Post-Millennials, comprises of persons born after 2000 that seem to be more pragmatic and prefer “cool” products over “cool” experiences, as Millennials do, and they want to co-create culture [62].
We expected different ways of thinking among these generations, so we structured our analysis in a way that we could perceive these differences, if any.

3. Materials and methods

3.1. Justification of the Research and Methods

The article deals with two contemporary issues for academic researchers, business practitioners and policy makers. It presents an interesting survey results from Romania focusing on age group differences in attitudes towards different strategies for sustainable production and consumption in line with circular economy, a new must have trend in global business.
For this sociological survey, the instrument used was the questionnaire. Because the authors wanted to capture a larger and varied number of respondents, it was agreed by majority that they would use the online questionnaire as a research method. One of the main reasons for choosing the questionnaire, beyond the lack of a generous budget and limited time, was that it is currently one of the best known ways of obtaining large volumes of data from the Romanian environment for processing and rapid statistical analysis. The questionnaire was composed by the authors based on literature [63].
Therefore, the best environment for administering a questionnaire is the online environment because it is attractive to respondents, ease of answering, but also because it is an ultra-fast and often free method.

3.2. Sample

In the preliminary stage of the study, to test its effectiveness, the questionnaire was pre-tested on 37 respondents between 25th and 30th of March 2016. Respondents were selected non-randomly, based on accessibility. Those participated in the questionnaire’s pre-test phase have not been included in the final sample. As a consequence of the questionnaire’s pre-testing, the authors have amended the questionnaire, regrouping and reformulating some questions, in order to reduce the size it, as a response to the evaluation of the respondents that regarded questionnaire difficulty and completion time too demanding.
Given the limitations of time and budget, but also due the large geographical area (national level) of the research, the method selected for contacting prospective responded was the transmission of the questionnaire via e-mail. The questionnaire was complemented by explanations regarding the importance of the research. It was also available online between the 11th to the 23rd of April 2016.
The final number of respondents was 642, with 45 incomplete responses. Therefore, the final sample consisted of 597 respondents. The sample covers all four Romanian macro-regions, the demographic structure of the sample being presented extensively in Table 1. In addition, the sample was constituted from respondents from both genders, covering all age categories and all education categories.
The final sample consisted of only the respondents in the X, Y and Z generations. The structure of the final sample is as follows:
-
Generation X (between 35 and 44 years), 111 respondents;
-
Generation Y (between 25 and 34 years of age), 110 respondents; and
-
Generation Z (between 18 and 24 years), 354 respondents.
The detailed categorization of the sample from a socio-demographic perspective and generation sample is listed in Table 1.
The overall distributions for each generation and each questionnaire item have been determined.

3.3. Items Development and Samples

All the items in the questionnaire were developed based on the literature review. We then interviewed scholars in the field as well as ten consumers with different characteristics in terms of gender, ages, education, and family income. This focus group reviewed our questionnaire for clarity and importance of the items. Based on their comments, we did minor modification, mainly on wording, to avoid confusion. The method of research used was the survey, based on an online questionnaire with 16 items. Detailed information about the study’s hypothesis and the questionnaire design can be found at https://sites.google.com/site/economiecirculara/ but also in the paper “How Supportive Are Romanian Consumers of the Circular Economy Concept: A Survey” [64], where the coarse results of the research were presented.
The collected data were analysed with the IBM SPSS software. For analysis, the Kruskal-Wallis H test (KWt) was used. It is considered to be a non-parametric alternative to the One-Way ANOVA. The post-hoc test that SPSS uses after a KWt is the Dunn-Bonferroni test that is based on collaborative economy applications [4]. When performing the KW test, the following assumptions were made:
  • The dependent variable is on an ordinal scale. All analyzed items were either measured on a 5-point Likert scale (Complete agreement to Complete Disagreement for questions 11 and 12) or a 6-point scale (Always to Never for question 8);
  • The independent variable consists of two or more categorical independent groups. The independent variable is the generation in which the respondent belongs. The independent variables are the socio-demographic variables, as age: there are three independent generations groups considered: X, Y and Z;
  • The observations are independent of each other. Each respondent is a different individual and there is no dependency among groups.
There was no assumption of homogeneity of variance as this is not a requirement for doing the KWt [65,66,67]. From these, the authors considered important to underline the following:
-
Scores as “important” and “very important” for the items showing concern for the environment, as the variables: Q1, Q2, Q3, Q4.1, Q4.2, Q5, Q6.1, Q6.2, Q6.3, Q6.4, Q7, Q9.1, Q9.2, Q10.1 and Q10.2). The items are presented in Table 2.
-
Scores as “frequently”, “very frequently” and “always” for the items showing the ecologic activities that they realized so far (Q8.1, Q8.2, Q8.3, Q8.4, Q8.5, Q8.6, Q8.7 and Q8.8) are presented in Table 3.
-
Scores for “Important” and “very important” to Q11 Preference of renting over buying, in the future, to contribute to the reduction of negative events on the planet, respectively reduce of resources used and Q12 Agreement with advantages of renting over buying, in order to reduce resource use are presented in Table 4.
Final shares have been calculated as division of the data mentioned above to the total volume of each sample.

4. Research Findings

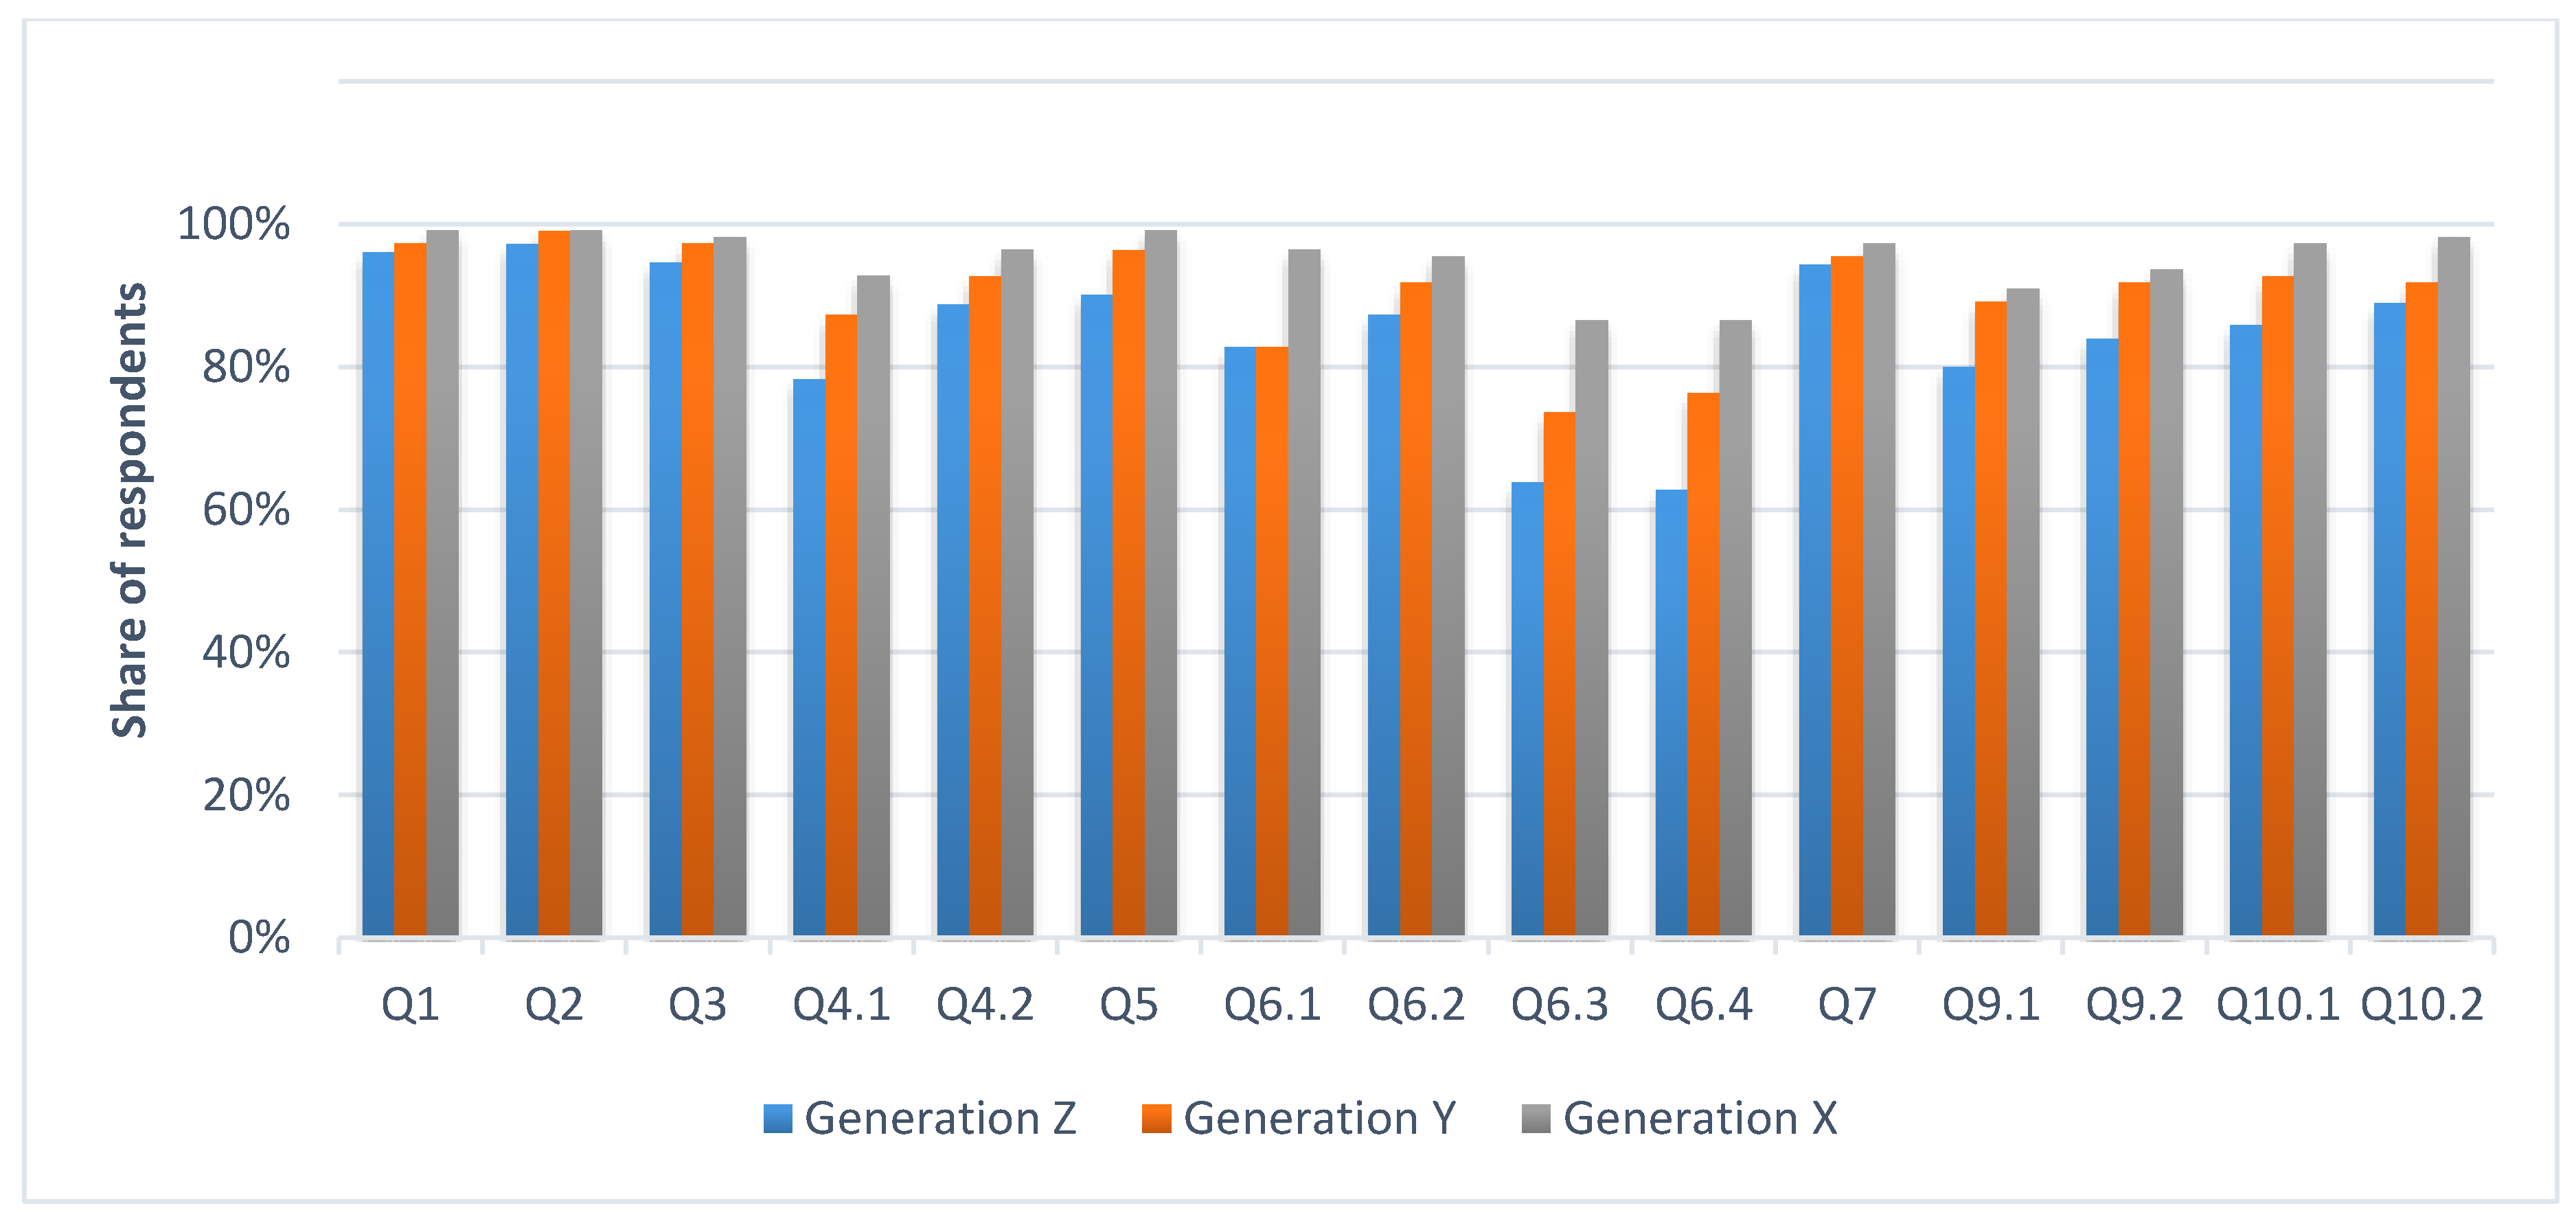
The percentage of respondents considering the attitude towards the environment as “important” and “very important” in the total sample have been calculated.
We can observe that although all three generations have a major favorable attitude towards the business and consumption models that have a lower impact on the environment, the most concerned are, in ascending order, the X-ers, the millennials and the Z generation presented in Figure 1.
Though the concern for the environment is important to all the three generations, the ecologically concerned behaviour adopted so far are relatively infrequent as can be seen in Table 5.
The most frequent behaviors, in all three generations, are: separately collection of paper and of plastic waste and separately collection of used batteries. Also, generation X is the generation most engaged in ecologic type of consumption, followed by generation Y and generation Z.
The big picture on the ecological patterns of consumption shows that the X-ers are most responsible in comparison with generation Y. Generation Z is the least involved in such activities.
Seventy five percent of X generation respondents reported behaviours of selective collection of paper waste, 71% separately collect plastic waste, 59% bring used batteries to special collection centers, 34% take used light bulbs at a special recycling centers and 32% share the car with other colleagues when going to work.
Generation Y is behind generation X with regard to ecologic activities, but we expect a more pronounced ecologic behavior once they become older. This trend is not in accordance with the behavior of Ys in the West, where Ys are more expected to establish the trend and adopt ecological behaviours.
The people in Z generation score the most at commuting to school or work with public transport, but this behavior is most probably due to the lack of financial resources required for buying a personal car, rather than an ecological reason.
Moreover, we cannot foresee changes in ecological attitudes in the near future, as can be seen in Table 6, where the preference of renting over buying a series of goods is presented. For comparison, the millennials in the US “would rather buy a car and lease a house. Seventy-one percent of millennials would rather buy than rent a car, whereas 59% would rather rent a house than buy one. More than 61% of them admit that they can't afford a house” [68].
Unfortunately, it seems that these business models based on the circular economy [69,70,71] will have to educate customers from the current Y and Z generations in the future.
In other words, some half of the millennials do not try to adopt an experiential type of consumption behavior, staying to the traditional ways of behavior. The new business models based on the circular economy will have to invest in educating the market through awareness and education campaigns.
The Millennials are aware of the advantages of the experiential types of consumption behavior, as can be seen in Table 7.
X-ers rate the advantage of buying over renting as being either important or very important on average 76% of the time, while Generations Y and Z respondents rate it only 61% and 63%, respectively. To see if there are significant differences between groups, we used the Kruskal–Wallis H test, which is an omnibus test, followed by a post-hoc test.
A Kruskal Wallis test was conducted to evaluate differences among the three generations (X, Y, Z) on median change in eco-friendly activities undergone in the past by respondents (N = 559). Of the eight types of activities presented in the questionnaire, six were found to be significantly different (Table 8). A follow-up test was conducted to evaluate pairwise differences among the three generations.
Regarding the use of public transportation for commuting to and from work, the results indicated a significant difference between generations X-Y (p = 0.02), X-Z (p < .001) and Y-Z (p = 0.45). Significantly more people from the Z generation use public transportation compared with Y and X generation and significantly more people form the Y generation use public transportation compared with X generation.
Regarding the selective collection of paper waste from Q8.4, the results indicated a significant difference between generations Y and X (p = 0.022), Z and X (p < 0.001) and Z and Y (p < 0.001). Significantly more people from Generation X collect paper waste as compared with each of the other two categories and significantly fewer people from Generation Z collect paper waste selectively.
Related to Q8.5, the selective collection of plastic waste, the results indicated a significant difference between generations Y-X (p = 0.040), Z-X (p < 0.001) and Z-Y (p = 0.001). Significantly more people from the X generation collect plastic waste as compared with each of the other two categories and significantly less people from the Z generation collect plastic waste selectively.
In the case of selective collection of used oil from Q8.6, the results indicated a significant difference between generations Y-X (p = 0.014), Z-X (p < 0.001). Significantly, more people from the X generation collect used oil as compared with the other two categories. There is no significant difference between the Z and Y generations.
The results regarding the selective collection of used batteries (Q8.7) indicated, a significant difference between generations Y-X (p = 0.044), Z-X (p < 0.001) and Z-Y (p < 0.001). Significantly more people from the X generation collect used batteries as compared with each of the other two categories and significantly less people from the Z generation collect used batteries selectively.
At the Q8.8 regarding the selective collection of used light bulbs, the results indicated a significant difference between generations Z-X (p < 0.001) and Z-Y (p < 0.001). Significantly, less people from the Z generation collect used light bulbs as compared with the other two categories. There is no significant difference between the X and Y generations as can be seen in the Figure 2. We go further to evaluate differences among the three generations (X, Y, Z) of the seven types of resources presented in the questionnaire, two were found to be significantly different, as presented in Table 9.
Consumers attitude regarding the preference for renting instead of buying IT equipment (Q11.4), showed a significant difference between generations Z-X (p = 0.017). Significantly, less people from the Z generation are willing to rent IT equipment as compared with people form the X generation. There is no significant difference between the X-Y and Y-Z generations as can be seen in the Figure 3.
A significant difference was observed between generations Z-X (p = 0.008) regarding the preference for renting instead of buying mobile phones (Q11.5). Significantly, less people from the Z generation are willing to rent mobile phones as compared with people form the X generation. There is no significant difference between the X-Y and Y-Z generations.
Related to Q12 we observe that of the five items presented in the questionnaire, two were found to be significantly different (Table 10).
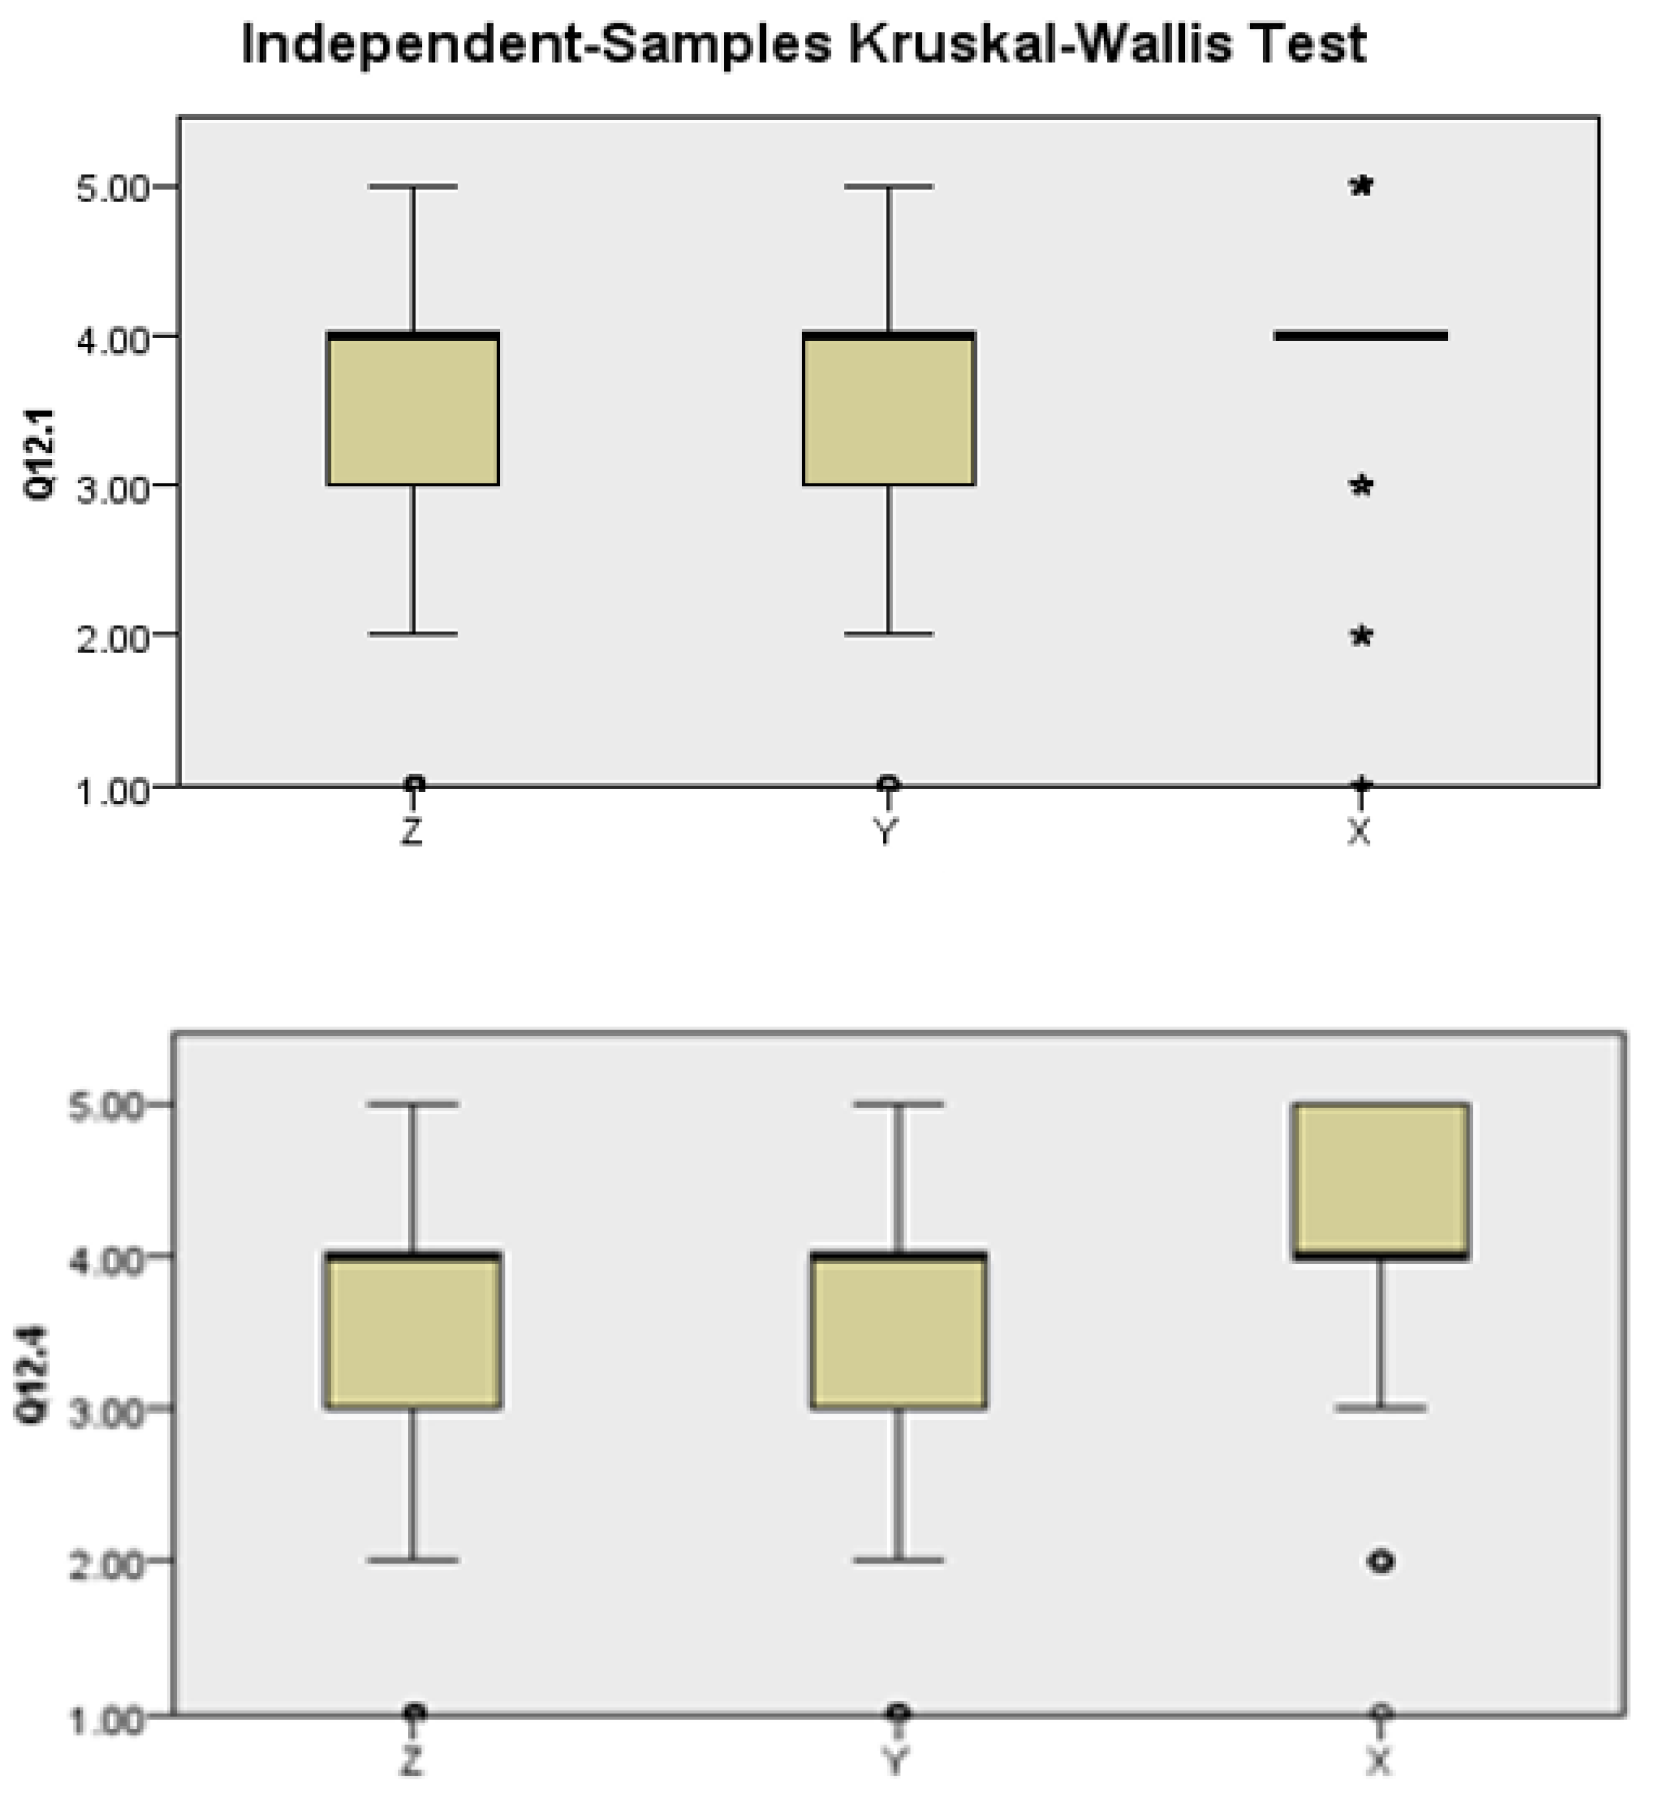
Regarding the advantage of service being a responsibility of the company (Q12.1), a significant difference was found between generations Z-X (p < 0.001). Significantly, less people from the Z generation see it as an advantage as compared with people from the X generation. There is no significant difference between the X-Y and Y-Z generations.
With regard of the advantage of the company being responsible of the product after its end of life, a significant difference was found between generations Y-X (p = 0.003) and Z-X (p = 0.001) it was observed after that Q12.4 was analyzed. Significantly less people from the Z and Y generations see it as an advantage as compared with people form the X generation. In Figure 4 it is presented a comparison between question Q12.1 and Q12.4.
We can say that Generation Y agrees with the concern towards the environment and with the advantages of the reduction of consumption of resources, of selective collection of waste, of recycling and reuse of goods. However, most of them did not adopt and they do not try to adopt consumption patterns based on circular economy. In other words, circular businesses will have to educate their markets to change their consumption patterns.
The fact that X-ers do not regularly use bus to go to work can be explained by the fact that they have higher income and can afford to use their private car. A chi-squared test (Table 11) reveals that people in the X generation have a significantly higher income than expected, in the over 2500 lei category.
A Principal Component Analysis was run with a Varimax rotation on all the items. The determinant for the correlation matrix was positive (t = 2.607 × 10⁻⁹), the KMO value was quite high 0.738 and Bartlett’s Test of Sphericity was significant (χ(595) = 2302.644) indicating that the sample is adequate for factor analysis.
The communalities were all over the threshold of 0.4, the minimum being 0.540. A nine-component solution emerged explaining 67.268% (Appendix A). The rotated component matrix (Appendix B) contained both factors with less than 3 items and cross-loadings. The items in question were excluded in an iterative process until a satisfactory solution was obtained.
The final correlation matrix still had a positive determinant and with a higher value (t = 3.113 × 10⁻⁶), KMO value remained unchanged and Bartlett’s Test of Sphericity was still significant (χ(276) = 1523.707). The communalities were all above 0.4 (minimum 0.460).
The six resulting components explained a total of 66.317% of variance (Appendix C). The resulting rotated component matrix is presented in Appendix D. The resulting factors are:
-
Factor 1 - The preference for renting things (Q11.1, 11.2, 11.3, 11.4, 11.5, 11.7)
-
Factor 2 - Selective collection of waste (Q8.5, 8.7, 8.8, 8.4, 8.6)
-
Factor 3 - Advantages of renting things (Q12.3, 12.3, 12.4, 12.5)
-
Factor 4 - Attitude towards recycling (Q9.2, 10.2, 4.2)
-
Factor 5 - Efficiency of resource utilization (Q6.1, 6.3, 6.4)
-
Factor 6 - Attitude towards selective recycling (Q3, 5, 7)
After performing a reliability test, the Cronbach Alpha values in Table 12 were obtained for:
Except for the last factor, the other sub-scales showed very good reliability, meaning that they are appropriate for measuring the construct that they are part of.
For each of the factors the factor scores were computed by using the regression method.
The regression scores were used for performing an analysis of variance (ANOVA). The only statistically significant group mean differences that emerged were for factor 2 and factor 6, which are presented in Table 13.
They are also more prone to live in urban areas as opposed to rural settings. The people in this category are significantly more involved in selective collection of different types of waste (paper, plastic, used oil, batteries and light bulbs). They are also significantly more willing to share their IT and mobile equipment. They see it as an advantage that companies take care of servicing and disposing of their products once they have reached their end of life.
People from the Z generation regularly use buses, mostly because of financial reasons. Significantly more people from the Z generation earn less than 1000 lei per month. They don’t engage in selective collection behaviors and are less willing to share their IT or mobile devices.

5. Conclusions

There are, without doubt, many factors influencing the SCP. The described circular business models provide huge opportunities for companies, customers and the environment. These benefits alone, however, will not translate into widespread acceptance of the idea of circular economy business models [72,73,74,75].
From the results of the survey regarding the attitude towards the environment and the adoption of new behavior models and responsible consumption among consumers in Romania, it has been possible to determine the level at which the consumers’ concerns lean toward the effects of the traditional production and consumption of goods in the environment. At the same time, the research has sought to highlight eco-friendly behavior that consumers have, including conservation behavior in daily life. Moreover, the study investigates the attitudes of consumers toward the desirability of business models based on CE [75,76].
Consumer behavior will play an important, if not the most important, role in the shift towards a circular economy by SCP.
Customers that embrace the classical economic theory, purely motivated by rational monetary considerations, would be easy to convince to buy a more expensive but more durable product if this would reduce their overall lifetime costs. At the same time, such customers would be willingly sending back articles after use if this would be rewarded with a small monetary incentive. It has become well known, however, that consumers are not always rational, objective and utility maximizing. Instead, they tend to base their decisions on other, more subjective beliefs about the product or service in question. Different areas of technological and service advancements have shown that reasonable innovations take longer than expected to reach widespread acceptance, despite their proven usefulness. Consumer resistance to change learned purchasing behavior generally explains this paradox. Members of Generation Y tend to agree with the concern for environment and with the advantages the reduction of the resources’ consumption, of selective collection of waste, of recycling and reuse of goods bring. Most respondents in this generation have not adopted or attempted to adopt consumption patterns based on the circular economy although they are the ones who support the costs of risk and waste. Among the steps that should be taken, we can recommend a good education of these consumers on circular economy spirit and to increase the responsibility of the Industrial Economy because most of them are delegating the responsibility for utilization to the buyer-owner-user of their products, and for the end-of-life to the state or third parties. It also implies that there are supplementary breaks to the financial sustainability of these business models [77]. The X-ers are well educated in recycling behaviors and are more open to circular economy. The Z generation is the least engaged in selective collection and must be educated in this sense.
According to the analysis of the questionnaire, the following conclusions have been reached:
(1)
The results of principal component analysis are six factors as we presented in the above and in the case of selective collection of waste (Factor 2), the X generation has a statistically significant higher (p = 0.017) score than the Z generation, meaning that they are more open to it. The same is true in the case of the attitude towards selective recycling (Factor 6). The X generation is statistically significant (p = 0.012) more open to recycling than the Z generation.
(2)
Though all three generations have a generally favorable attitude towards the business and consumption models which have a lower impact on the environment, the most concerned, are the X-ers, followed by the millennials and lastly, the Z generation.
(3)
Though the concern for the environment is important to all the three generations, the ecologically-concerned behaviors adopted so far are relatively infrequent. The most frequent behaviors are: separately collection of paper and plastic waste and of used batteries. Also, generation X is the most engaged in ecologic type of consumption.
(4)
Regarding the ecological patterns of consumption, results show that the X-ers are most responsible in comparison with generation Y and that generation Z is the least involved in such activities. Respondents from the X generation presented behaviors of selective collection of the paper waste (75%), plastic waste (71%), used batteries (59%), used light bulbs (34%) and 32% of them share their car with other colleagues when going to work.
(5)
Generation Y is behind generation X in ecological activities, but we expect a more pronounced ecological behavior once they become older, as they have learned from their parents. This trend does not correspond to the behavior of members of generation Y in the West, where Ys are more expected to establish the trend and of adopting ecological behaviors.
(6)
Generation Z scores best at going to school or work by public transport, but this behavior results most probably from lack of financial resources rather than from ecological mindset.
(7)
Moreover, we cannot foresee changes in ecological attitudes for the near future, as can be observed related to the preference of renting over buying for a series of goods. For comparison, the millennials in the US “would rather buy a car and lease a house. Seventy-one percent of millennials would rather buy than rent a car, where as 59% would rather rent a house than buy one. More than 61% admit that they can't afford a house” [74].
(8)
Unfortunately, it seems that these business models based on circular economy will face difficulties in targeting generations Y and Z in the future. In other words, some half of the millennials are trying to adopt an experiential type of consumption behavior, sticking to the traditional ways of behavior. The new business models, based on circular economy, will have to invest in educating the market through awareness and education campaigns. More than half of the millennials agree on the advantages of the experiential types of consumption behavior.
(9)
X-ers rate the advantage of buying over renting as being either important or very important on average 76% of the time, while Y and Z generation respondents rate it only 61% and 63% respectively.
(10)
Generation Y agrees with the concern towards the environment and with the advantages offered by the reduction of consumption of resources, of selective collection of waste, of recycling and of reuse of goods.

6. Discussions and Limitations of the Study

The success of certain business models based on new ways of SCP, give a glimpse at the opportunities for new business models in different industries [78].
This might only be the starting point for changing the entire economy. More research in the realm of circular economy will contribute to the meeting of the expectations described earlier. In particular, practical research focusing on consumers’ behavior on SCP in the acceptance process will be highly beneficial for those designing new circular economy business models. A profound knowledge of the latent motives and norms underlying consumer reasoning is a prerequisite for developing a convincing value. The study’s limits come from the study’s sample, given the method of research.
The sample is large enough to say the results of the study are convincing but the representativeness is at the level of the investigated sample. This study can be used to understand what would motivate consumers to make the transition to a circular economy, being an important aspect for state and companies to know how to react. The directions for studying consumer behavior can be a point of view related to resource utilization issues, and concrete provisions should be formulated to regulate the behavior of peoples in the utilization of material resources.
Also, Y generations is more open in reducing resource consumption, recycling and reuse, meaning that generations X and Z should be studied in the idea of encouraging them in their approach to a circular economy. In this way the results obtained may be working hypotheses for larger sample surveys from several countries to see if consumers' behavior on sustainable production and consumption it is similar to that in Romania.

Acknowledgments

This work received financial support of the Center for Initiation and Organizational Development. Research: “The study on the assessment of attitudes towards the environment and the adoption of new patterns of behavior and responsible consumption among consumers”, Project No. 007/2016.

Author Contributions

Elena Simina Lakatos conceived and designed the research, drafted and finalized the paper; Elena Simina Lakatos, Lucian Ionel Cioca, Viorel Dan, Alina Oana Ciomos and Oana Adriana Crisan performed the research and the analysis, Ghita Barsan do ANOVA analysis and calculate the scale (mean) of the items if the Cronbach alpha; and all authors contributed in discussing the research, writing parts of the paper and commenting on draft versions.

Conflicts of Interest

The authors declare no conflict of interest.

Appendix A

Total Variance Explained by the Initial Factors
ComponentInitial EigenvaluesExtraction Sums of Squared LoadingsRotation Sums of Squared Loadings
Total% of VarianceCumulative %Total% of VarianceCumulative %Total% of VarianceCumulative %
16.88219.66419.6646.88219.66419.6644.10511.72911.729
24.37112.48732.1514.37112.48732.1513.68010.51522.244
33.50210.00742.1583.50210.00742.1583.0378.67730.921
41.8345.24047.3981.8345.24047.3982.6877.67638.597
51.7434.97952.3771.7434.97952.3772.6267.50346.100
61.5844.52556.9031.5844.52556.9032.2996.56952.670
71.3683.90960.8111.3683.90960.8112.2376.39059.060
81.2563.58964.4001.2563.58964.4001.5224.34963.409
91.0042.86867.2681.0042.86867.2681.3513.85967.268
100.9582.73670.004
110.9502.71572.718
120.8312.37575.093
130.8022.29177.384
140.7082.02379.407
150.6671.90781.314
160.6031.72383.037
170.5691.62684.663
180.5441.55386.216
190.5221.49187.707
200.5011.43389.140
210.4551.30190.441
220.4201.19991.640
230.3951.12892.768
240.3781.08093.848
250.3010.85994.707
260.2910.83095.537
270.2650.75796.294
280.2410.68896.983
290.2200.62897.611
300.2020.57898.189
310.1700.48598.674
320.1460.41899.092
330.1250.35799.449
340.1050.30199.749
350.0880.251100.000
Extraction Method: Principal Component Analysis.

Appendix B

Rotated Component Matrix a of the Initial Factors
Component
123456789
Q11.30.852
Q11.50.843
Q11.40.786
Q11.20.785
Q11.70.780
Q11.10.574 −0.475
Q8.7 0.786
Q8.8 0.786
Q8.5 0.782
Q8.4 0.736 0.314
Q8.6 0.715
Q8.2 0.557
Q12.5 0.801
Q12.4 0.799
Q12.3 0.668
Q12.2 0.662
Q12.1 0.635
Q4.2 0.752
Q9.2 0.739
Q10.2 0.623 0.403
Q6.2 0.5620.534
Q11.60.442 0.3570.464
Q6.3 0.791
Q6.4 0.778
Q6.1 0.657
Q9.1 0.759
Q10.1 0.362 0.674
Q4.1 0.521 0.326
Q7 0.720
Q3 0.304 0.630
Q2 0.627
Q5 0.314 0.523
Q8.1 0.797
Q8.3 0.316 −0.675
Q1 0.805
Extraction Method: “a” Principal Component Analysis. Rotation Method: Varimax with Kaiser Normalization. a Rotation converged in seven iterations.

Appendix C

Total Variance Explained by the Final Factors After Problematics Factors was Removed
ComponentInitial EigenvaluesExtraction Sums of Squared LoadingsRotation Sums of Squared Loadings
Total% of VarianceCumulative %Total% of VarianceCumulative %Total% of VarianceCumulative %
15.32522.18622.1865.32522.18622.1863.85516.06216.062
23.75815.65837.8443.75815.65837.8443.32213.84129.902
32.63010.95748.8012.63010.95748.8012.52110.50640.408
41.6416.83955.6401.6416.83955.6402.2439.34449.752
51.4345.97561.6151.4345.97561.6152.1348.89158.643
61.1284.70266.3171.1284.70266.3171.8427.67466.317
70.9353.89570.212
80.8073.36273.574
90.7433.09476.668
100.7152.98079.648
110.6962.89882.547
120.5612.33984.885
130.5232.18087.065
140.4882.03489.099
150.4391.83090.929
160.4031.68092.608
170.3511.46394.071
180.3051.27195.342
190.2671.11296.454
200.2571.06997.523
210.2140.89298.415
220.1450.60299.017
230.1230.51299.529
240.1130.471100.000
Extraction Method: Principal Component Analysis.

Appendix D

Rotated Component Matrix a by the Final Factors After Problematics Factors was Removed
Component
123456
Q11.30.863
Q11.50.846
Q11.40.780
Q11.20.773
Q11.70.772
Q11.10.619
Q8.5 0.814
Q8.7 0.807
Q8.8 0.786
Q8.4 0.771
Q8.6 0.700
Q12.5 0.812
Q12.4 0.796
Q12.3 0.725
Q12.2 0.637
Q9.2 0.825
Q10.2 0.743
Q4.2 0.743
Q6.4 0.834
Q6.3 0.812
Q6.1 0.672
Q7 0.704
Q3 0.694
Q5 0.653
Extraction Method: “a” Principal Component Analysis. Rotation Method: Varimax with Kaiser Normalization. a Rotation converged in six iterations.

References

  1. Euromonitor International. Available online: http://blog.euromonitor.com/2016/12/what-drives-demand-natural-resources.html (accessed on 3 April 2017).
  2. United Nations. Available online: https://www.un.org/development/desa/en/key-issues/population.html (accessed on 5 April 2017).
  3. Organisation for EconomicCo-Operation and Development. Available online: https://www.oecd.org/innovation/inno/2105727.pdf (accessed on 8 April 2017).
  4. Gallarza, M.; Gil, I.; Calderon, H. Destination image: Towards a conceptual framework. Ann. Tour. Res. 2002, 29, 56–78. [Google Scholar] [CrossRef]
  5. Bungau, S.; Bungau, C.; Tit, D.M. Studies about last stage of product lifecycle management for a pharmaceutical product. J. Environ. Prot. Ecol. 2015, 16, 56–62. [Google Scholar]
  6. Sezen, A.; Cankaya, Y.S. Effects of Green Manufacturing and Eco-innovation on Sustainability Performance. Procedia Soc. Behav. Sci. 2013, 99, 154–163. [Google Scholar] [CrossRef]
  7. Porter, M.E.; Van der Linde, C. Green and Competitive—Ending the Stalemate. Harv. Bus. Rev. 1995, 5, 120–134. [Google Scholar]
  8. Yang, C.J.; Chen, J.L. Accelerating preliminary eco-innovation design for products that integrates case-based reasoning and TRIZ method. J. Clean. Prod. 2011, 19, 998–1006. [Google Scholar] [CrossRef]
  9. Tit, D.M.; Bungau, S.; Nistor Cseppento, C.; Copolovici, D.M.; Buhas, C. Disposal of Unused Medicines Resulting from Home Treatment in Romania. J. Environ. Prot. Ecol. 2016, 17, 1425–1433. [Google Scholar]
  10. Popescu, D.E.; Bungau, C.; Prada, M.; Domuta, C.; Bungau, S.; Tit, D.M. Waste Management Strategy at a Public University in Smart City Context. J. Environ. Prot. Ecol. 2016, 17, 1011–1020. [Google Scholar]
  11. Bungau, S.; Suciu, R.; Bumbu, A.; Cioca, G.; Tit, D.M. Study on hospital waste management in medical rehabilitation clinical hospital, Baile Felix. J. Environ. Prot. Ecol. 2016, 16, 980–987. [Google Scholar]
  12. Ellen MacArthur Foundation. Available online: https://www.ellenmacarthurfoundation.org/case-studies/pre-consumer-waste-a-gbp-1-9-billion-opportunity-awaits (accessed on 15 June 2017).
  13. The McKinsey Center for Business and Environment. Available online: https://www.mckinsey.com/business-functions/sustainability-and-resource-productivity/how-we-help-clients/mckinsey-center-for-business-and-environment (accessed on 17 June 2017).
  14. International Organization for Standardization. Available online: https://www.iso.org/standard/23149.html (accessed on 20 June 2017).
  15. Garnett, S.T.; Franklin, D.C.; Ehmke, G.; Van Der Wal, J.J.; Hodgson, L.; Pavey, C.; Reside, A.E.; Welbergen, J.A.; Butchart, S.H.M.; Perkins, G.C.; et al. Climate Change Adaptation Strategies for Australian Birds, National Climate Change Adaptation Research Facility; The National Climate Change Adaptation Research Facility: Gold Coast, Australia, 2013; pp. 1–940. ISBN 978-1-925039-14-6. [Google Scholar]
  16. Butchart, S.H.; Mccarthy, D.P.; Balmford, A.; Bennun, L.A.; Buchanan, G.M.; Burgess, N.D.; Donald, P.F.; Fishpool, L.D.; Garnett, S.T.; Leonard, D.L.; et al. Sharing Future Conservation Costs—Response. J. Sci. 2013, 339, 271–272. [Google Scholar] [CrossRef] [PubMed]
  17. Badulescu, D.; Bungau, C.; Badulescu, A. Sustainable development through sustainable businesses. An empirical research among master students. J. Environ. Prot. Ecol. 2015, 16, 1101–1108. [Google Scholar]
  18. Bungau, C.; Badulescu, A.; Badulescu, D. Assessing the Effectiveness of Mobility and Study Abroad Stages During Doctoral Programmes: A Case Study. In ECRM2014-Proceedings of the 13th European Conference on Research Methodology for Business and Management Studies: ECRM 2014; Academic Conferences Limited: London, UK, 2014; p. 473. [Google Scholar]
  19. Prada, M.F.; Popescu, D.E.; Bungau, C. Building Education, Source of Energy Saving in Romania. In Proceedings of the 15th National Technical-Scientific Conference on Modern Technologies for the 3rd Millennium, Oradea, Romania, 23–24 March 2015. [Google Scholar]
  20. Nistor, S.; Popoviciu, G.A. (Eds.) Climate; World Wildlife; MEDIMOND SRL: Bologna, Italy, 2016; pp. 157–162. Available online: https://www.worldwildlife.org/initiatives/climate (accessed on 3 July 2017).
  21. Pieniak, Z.; Verbeke, W.; Olsen, S.O.; Hansen, K.B.; Brunso, K. Health-Related Attitudes as a Basis for Segmenting European Fish Consumers. Food Policy 2010, 35, 448–455. [Google Scholar] [CrossRef]
  22. Businesss Forecasting. Available online: http://businessforecastblog.com/some-observations-on-cluster-analysis-data-segmentation/ (accessed on 5 July 2017).
  23. Beane, T.P.; Ennis, D.M. Market Segmentation: A Review. Eur. J. Mark. 1987, 21, 20–42. [Google Scholar] [CrossRef]
  24. Motoiu, E.; Pavel, O.A.; Lakatos, E.S. A brief quantitative analysis of clusters from the creative industry in Romania. Rev. Appl. Soc.-Econ. Res. 2016, 11, 57–66. [Google Scholar]
  25. Lewandowski, M. Designing the Business Models for Circular Economy—Towards the Conceptual Framework. J. Sustain. 2016, 43. [Google Scholar] [CrossRef]
  26. Eurostat Press Office. Available online: http://ec.europa.eu/eurostat/documents/2995521/6839731/1-21052015-AP-EN.pdf/c3f5f43b-397c-40fd-a0a4-7e68e3bea8cd (accessed on 12 July 2017).
  27. UN Environment. Available online: http://web.unep.org/10yfp/about/what-scp (accessed on 15 July 2017).
  28. Narayanaswamy, V.; Stone, L. From cleaner production to sustainable production and consumption in Australia and New Zealand: Achievements, challenges, and opportunities. J. Clean. Prod. 2007, 15, 711–715. [Google Scholar] [CrossRef]
  29. Organisation for Economic Co-operation and Development (OECD). Available online: https://www.oecd.org/edu/school/programmeforinternationalstudentassessmentpisa/33690904.pdf (accessed on 22 July 2017).
  30. Marchand, M.; Walker, S.; Cooper, T. Beyond Abundance: Self-Interest Motives for Sustainable Consumption in Relation to Product Perception and Preferences. J. Sustain. Consum. 2010, 2, 1431–1447. [Google Scholar] [CrossRef] [Green Version]
  31. Mont, O.; Plepys, A. Sustainable consumption progress: Should we be proud or alarmed? J. Clean. Prod. 2008, 16, 531–537. [Google Scholar] [CrossRef]
  32. Geels, F.; McMeekin, A.; Mylan, J.; Southerton, D. A critical appraisal of Sustainable Consumption and Production research: The reformist, revolutionary and reconfiguration positions. J. Glob. Environ. Chang. 2015, 34, 1–12. [Google Scholar] [CrossRef]
  33. Schumacher, E.F. Small Is Beautiful: A Study of Economics as If People Mattered, 1st ed.; Blond and Briggs: London, UK, 1973; pp. 1–319. ISBN 0-06-091630-3. [Google Scholar]
  34. Princen, T.; Maniates, M.; Conca, K. Confronting Consumption, 2002 ed.; MIT Press: London, UK, 2002; pp. 1–392. ISBN 9780262661287. [Google Scholar]
  35. Cohen, A. A consumers’ republic: The politics of mass consumption in postwar America. J. Consum. Res. 2004, 31, 236–239. [Google Scholar] [CrossRef] [Green Version]
  36. Lorek, S.; Fuchs, D. Strong sustainable consumption governance—Precondition for a degrowth path? J. Clean. Prod. 2013, 38, 36–43. [Google Scholar] [CrossRef]
  37. Prinet, E. Sustainable Consumption and Production. In Proceedings of the North American Workshop on Sustainable Consumption and Production and Green Building, Ottawa, ON, Canada, 31 January–1 February 2011; One Earth Initiative Society: Vancouver, BC, Canada, 2011. Available online: https://scpgreenbuild.files.wordpress.com/2011/01/background_paper_1_sust_cons_prod.pdf (accessed on 2 September 2017).
  38. Barber, J. Mapping the movement towards sustainable production and consumption in North America. J. Clean. Prod. 2007, 15, 499–512. [Google Scholar] [CrossRef]
  39. Dyllick, T.; Hockerts, K. Beyond the business case for corporate sustainability. J. Bus. Strateg. Environ. 2002, 11, 130–141. [Google Scholar] [CrossRef]
  40. Veleva, V.; Ellenbecker, M. Indicators of sustainable production: Framework and methodology. J. Clean. Prod. 2001, 9, 519–549. [Google Scholar] [CrossRef]
  41. European Comission. Available online: http://ec.europa.eu/environment/beyondgdp/index_en.html (accessed on 2 September 2017).
  42. China Dialogue. Available online: https://www.chinadialogue.net/article/show/single/en/10298-Opinion-China-will-be-key-to-creating-a-global-circular-economy (accessed on 3 September 2017).
  43. Lakatos, E.S.; Rusu, T.; Crisan, O.A. An effective alternative to linear economy: Circular economy. AGIR Bull. 2017, 31, 21–31. [Google Scholar]
  44. Lakatos, E.S.; Crisan, O.A.; Lakatos, D.; Bejan, M. Circular economy paradigm. A challenge for the intelligent city. AGIR Bull. 2017, 1, 191–201. [Google Scholar]
  45. Ortan, C.; Ciomos, A.O.; Pavel, O.A.; Lakatos, E.S. Circular economy and the field of electronic and electrical components. AGIR Bull. 2016, 29, 175–182. [Google Scholar]
  46. Prada, M.; Popescu, D.E.; Bungau, C.; Pancu, R.; Bungau, C. Parametric Studies on European 20-20-20 Energy Policy Targets in University Environment. J. Environ. Prot. Ecol. 2017, 18, 1146–1157. [Google Scholar]
  47. Vesselenyi, T.; Bungau, C.; Husi, G. Research Equipment and Computation Techniques for Intelligent Building Applications. In Proceedings of the 2014 IEEE/SICE International Symposium on System Integration, Tokyo, Japan, 13–15 December 2014; pp. 228–233. [Google Scholar]
  48. Rada, E.C.; Cioca, L.I.; Ionescu, G. Energy recovery from Municipal Solid Waste in EU: Proposals to assess the management performance under a circular economy perspective. In Proceedings of the MATEC Web of Conferences, Sibiu, Romania, 7–9 June 2017; EDP Sciences: London, UK, 2017; Volume 121, p. 05006. [Google Scholar]
  49. Rada, E.C.; Cioca, L.I. Optimizing the Methodology of Characterization of Municipal Solid Waste in EU under a Circular Economy Perspective. Energy Procedia 2017, 119, 72–85. [Google Scholar] [CrossRef]
  50. Ionescu, G.; Rada, E.C.; Cioca, L.I. Municipal solid waste sorting and treatment schemes for the maximization of material and energy recovery in a latest EU member. Environ. Eng. Manag. J. 2015, 14, 2537–2544. [Google Scholar]
  51. Ragazzi, M.; Fedrizzi, S.; Rada, E.C.; Ionescu, G.; Ciudin, R.; Cioca, L.I. Experiencing Urban Mining in an Italian Municipality towards a Circular Economy vision. Energy Procedia 2017, 119, 192–200. [Google Scholar] [CrossRef]
  52. Bungau, C.; Blaga, F.; Gherghea, C. Kaizen Implementation for Cost Reduction in Manufacturing Process Product “Driver Control Board”. In Proceedings of the International Conference on Production Research—Regional Conference Africa, Europe and the Middle East (ICPR-AEM)/3rd International Conference on Quality and Innovation in Engineering and Management (QIEM), Cluj Napoca, Romania, 1–5 July 2014; pp. 55–58. [Google Scholar]
  53. Orban, M.; Cristorean, C.; Crisan, O.A.; Lakatos, E.S. Eco-innovative methods and technologies for reducing and recycling of persistent organic pollutants from environment-an overview. “SCIENCE AND ENGINEERING” Magazine. AGIR Bull. 2017, 32, 651–660. [Google Scholar]
  54. Chiaroni, D.; Urbinati, A. Circular Economy Business Models: Towards a new taxonomy of the degree of circularity. In Proceedings of the XXVII Edition of the Annual Scientific Meeting, Bergamo, Italy, 13–14 October 2016; Italian Association of Management Engineering (AiIG): Bergamo, Italy, 2016; pp. 1–27. [Google Scholar]
  55. Weetman, C. A Circular Economy Handbook for Business and Supply Chains: Repair, Remake, Redesign, Rethink; Kogan Page Publishers: London, UK, 2016; p. 18. [Google Scholar]
  56. Goldman Sachs Research Newsletter. Available online: http://www.goldmansachs.com/our-thinking/pages/macroeconomic-insights-folder/gen-x/report.pdf (accessed on 25 October 2017).
  57. Goldman Sachs. Available online: http://www.goldmansachs.com/our-thinking/pages/millennials/ (accessed on 5 November 2017).
  58. Tulgan Tulgan, B. The Manager’s Pocket Guide to Generation X; Human Resource Development: Minneapolis, SUA, 1997; p. 4. [Google Scholar]
  59. Hofmann, E.; Hartl, B.; Elfriede, P. Power versus trust—What matters more in collaborative consumption? J. Serv. Mark. 2017, 31, 589–603. [Google Scholar] [CrossRef]
  60. eMarketer. Available online: https://www.emarketer.com/Article/No-One-More-Sharing-Economy-than-Millennials/1015886 (accessed on 10 November 2017).
  61. Tulgan, B. Not Everyone Gets a Trophy: How to Manage Generation Y; Wiley & Sons: Hoboken, NJ, USA, 2009; pp. 8–9. [Google Scholar]
  62. Visioncritical. Available online: https://www.visioncritical.com/generation-z-infographics/ (accessed on 11 November 2017).
  63. Massey, J.T.; O’Connor, D.; Krotki, K. Response rates in random digit dialing (RDD) telephone surveys. In Proceedings of the American Statistical Association, Section on Survey Research Methods, Washington, DC, USA, 6–10 August 1997; pp. 707–712. [Google Scholar]
  64. Lakatos, E.S.; Dan, V.; Cioca, L.I.; Bacali, L.; Ciobanu, A.M. How Supportive are Romanian Consumers of the Circular Economy Concept: A Survey. J. Sustain. 2016, 8, 789. [Google Scholar] [CrossRef]
  65. Vargha, A.; Delaney, H.D. The Kruskal-Wallis Test and Stochastic Homogeneity. J. Educ. Behav. Stat. 1998, 23, 170–192. [Google Scholar] [CrossRef]
  66. Pagano, R.R. Understanding Statistics in the Behavioral Sciences, 4th ed.; West Publishing Company: St. Paul, MN, USA, 1994; pp. 1–640. ISBN 978-1111837266. [Google Scholar]
  67. Laerd Statistics. Available online: https://statistics.laerd.com/spss-tutorials/kruskal-wallis-h-test-using-spss-statistics.php (accessed on 16 November 2017).
  68. Forbes. Available online: https://www.forbes.com/sites/danschawbel/2015/01/20/10-new-findings-about-the-millennial-consumer/#160609ed6c8f (accessed on 16 November 2017).
  69. IMSA. Available online: https://groenomstilling.erhvervsstyrelsen.dk/sites/default/files/media/imsacircular_business_models_-_april_2015_-_part_1.pdf (accessed on 17 November 2017).
  70. Schulte, U.G. New business models for a radical change in resource efficiency. J. Environ. Innov. Soc. Transit. 2013, 9, 43–47. [Google Scholar] [CrossRef]
  71. CEPS. Available online: https://www.ceps.eu/publications/understanding-circular-economy-europe-resource-efficiency-sharing-platforms-ceps (accessed on 17 November 2017).
  72. Harvard Business Review. Available online: https://hbr.org/2015/01/what-is-a-business-model (accessed on 17 November 2017).
  73. Moldovan, A.; Lakatos, E.S. Studies to Evaluate Consumer Attitudes toward the Environment and Adopting New Business Models Oriented towards a Circular Economy. Master’s Thesis, Technical University of Cluj-Napoca, Cluj-Napoca, Romania, 2016. [Google Scholar]
  74. Boulding, K.E. The Image: Knowledge in Life and Society; University of Michigan Press: Ann Abor, MI, USA, 1961; pp. 1–184. ISBN 978-0472060474. [Google Scholar]
  75. Babut, G.B.; Moraru, R.I.; Cioca, L.I. Kinney-Type Methods: Useful or Harmful Tools in the risk assessment and management process. In Proceedings of the International Conference on Manufacturing Science and Education-SIBIU-Romania, Sibiu, Romania, 2–5 June 2011. [Google Scholar]
  76. Mentink, B. Circular Business Model Innovation: A Process Framework and a Tool for Business Model Innovation in a Circular Economy. Master’s Thesis, Delft University of Technology & Leiden University, Leiden, The Netherlands, 2014. [Google Scholar]
  77. ING. Available online: https://www.ing.nl/media/ING_EZB_Financing-the-Circular-Economy_tcm162-84762.pdf (accessed on 18 November 2017).
  78. Frankenberger, K.; Weiblen, T.; Csik, M.; Gassmann, O. The 4I-framework of business model innovation: A structured view on process phases and challenges. Int. J. Prod. Dev. 2013, 18, 249–273. [Google Scholar] [CrossRef]
Figure 1. Attitude towards the consumption activities and of the ecologic production, in each generation.
Sustainability 10 00865 g001
Figure 2. Sample structure of the three generations for the cases where the null hypothesis was rejected regarding ecological patterns of consumption adopted.
Sustainability 10 00865 g002
Figure 3. Preference of renting above buying.
Sustainability 10 00865 g003
Figure 4. Agreement with advantages of renting instead of buying.
Sustainability 10 00865 g004
Table 1. The socio-demographic composition of the sample.
N (Number)% N (Number)%
SexAge
Male35859.9718–24 years34758.12
Female23940.0325–34 years10617.76
Education35–44 years6911.56
Middle School152.5145–54 years498.21
Professional school40.67Region
High School23639.53Macro-region 1
(RO1: NW and Center of Romania)
19432.50
Post-High School61.01Macro-region 2
(RO2: NE and SE of Romania)
7813.03
Faculty/University College17929.98Macro-region 3
(RO3: S of Romania and Bucharest)
17829.90
Post-University Studies13121.94Macro-region 4(RO4: SW and W of Romania)12120.22
Total597 100
Table 2. Items reflecting the concern for the environment.
Item No.Item
Q1Concern for the environment
Q2Agreement with selective waste collection in the view of recycling
Q3Agreement with selective waste collection in order to avoid depletion of natural resources
Q4.1Agreement with a “zero waste—all resources reused” type of economy
Q4.2Agreement with a “zero waste—all resources reused” type of economy
Q5Agreement with selective collection of waste in all households
Q6.1Agreement with the increase of the efficiency of resources use, through resource savings
Q6.2Agreement with increase of resources’ use efficiency through recycling
Q6.3Agreement with increase of resources’ use efficiency through substitution
Q6.4Agreement with increase of resources’ use efficiency through reduction of used resources
Q7Agreement that energetic valorization of waste brings economic savings
Q9.1Agreement with macroeconomic beneficial effects of the CE business models based on reuse
Q9.2Agreement with macroeconomic beneficial effects of the CE business models based on recycling
Q10.1Agreement with environment beneficial effects of the CE business models based on reuse
Q10.2Agreement with environment beneficial effects of the CE business models based on recycling
Table 3. Item reflecting the ecologic activities.
Item No.Item
Q8.1I go to work with a public transport vehicle
Q8.2I go to work by bicycle
Q8.3I go to work sharing a personal car with some friends
Q8.4I collect separately the waste of papers
Q8.5I collect separately the waste of plastics
Q8.6I collect separately used oils
Q8.7I bring used batteries to collection centers
Q8.8I bring light bulbs to collection centers
Table 4. Items reflecting the sharing behavior.
Item No.Name of the VariableItem
Q11.1Preference for renting over buying, in the future, in order to contribute to the reduction of negative events on the planet, respectively reduce of resources usedApartment or other type of accommodation
Q11.2Car
Q11.3Electrocasnic equipment
Q11.4IT equipment (PC, laptop, etc.)
Q11.5Mobile phone equipment
Q11.6Hobby related products (bicycle, sky, etc.)
Q11.7Clothes
Q12.1Agreement with advantages of renting over buying, in order to reduce resources’ useThe product’s service falls in the company’s yard
Q12.2The risk of not liking the product is lower
Q12.3It is financially more advantageous
Q12.4The ridding of the product, at the cycle’s end, is in the attribution of the company
Q12.5From the environment point of view
Table 5. Ecological activities achieved so far.
Q8.1Q8.2Q8.3Q8.4Q8.5Q8.6Q8.7Q8.8
Gen Z59%9%29%33%33%21%17%14%
Gen Y46%6%26%55%55%27%45%28%
Gen X28%8%32%75%71%47%59%34%
Table 6. Preference of renting over buying, in the future, to contribute to the reduction of negative events on the planet, respectively reduce of resources used.
Q11.1Q11.2Q11.3Q11.4Q11.5Q11.6Q11.7
Gen Z24%5%14%16%16%51%14%
Gen Y25%1%19%20%18%47%18%
Gen X16%1%17%28%29%59%10%
Table 7. Agreement with advantages of renting over buying, in order to reduce resources’ use.
Q12.1Q12.2Q12.3Q12.4Q12.5Avg.
Gen Z55%69%53%66%71%63%
Gen Y65%66%45%63%66%61%
Gen X81%76%65%79%79%76%
Table 8. Hypothesis Test Summary for Question 8.
Item No.Test StatisticSig.Decision
8.1H = 34.5960.000Reject the null hypothesis.
8.2H = 1.9730.373Retain the null hypothesis.
8.3H = 4.4370.109Retain the null hypothesis.
8.4H = 67.0150.000Reject the null hypothesis.
8.5H = 48.5560.000Reject the null hypothesis.
8.6H = 21.9670.000Reject the null hypothesis.
8.7H = 77.7540.000Reject the null hypothesis.
8.8H = 39.0110.000Reject the null hypothesis.
Table 9. Hypothesis Test Summary for Question 11.
Item No.Test StatisticSig.Decision
11.1H = 4.5680.102Retain the null hypothesis.
11.2H = 4.8800.087Retain the null hypothesis.
11.3H = 0.5430.762Retain the null hypothesis.
11.4H = 7.6830.021Reject the null hypothesis.
11.5H = 9.2060.010Reject the null hypothesis.
11.6H = 4.0360.133Retain the null hypothesis
11.7H = 2.4500.294Retain the null hypothesis.
Table 10. Hypothesis Test Summary for Question 12.
Item No.Test statisticSig.Decision
12.1H = 19.6520.000Reject the null hypothesis.
12.2H = 2.5990.273Retain the null hypothesis.
12.3H = 5.7980.055Retain the null hypothesis.
12.4H = 15.3100.000Reject the null hypothesis.
12.5H = 5.3870.068Retain the null hypothesis.
Table 11. Chi-Square Tests, Analysis of Income category by generation.
ValuedfAsymp. Sig. (2-Sided)
Pearson Chi-Square336.550 a60.000
Likelihood Ratio401.52460.000
Linear-by-Linear Association298.40010.000
N of Valid Cases549
Note: “a” 0 cells (0.0%) have expected count less than 5. The minimum expected count is 15.91.
Table 12. The Cronbach Alpha values.
Factor 1Factor 2Factor 3Factor 4Factor 5Factor 5Factor 6
0.8790.8540.8330.8200.7840.7840.671
Table 13. Multiple Comparisons.
Tukey HSD
Dependent Variable(I) Generation(J) GenerationMean Difference (I-J)Std. ErrorSig.95% Confidence Interval
Lower BoundUpper Bound
REGR factor score 1ZY0.375820160.288694180.397−0.30901691.0606572
X−0.104590450.298275220.935−0.81215560.6029746
YZ−0.375820160.288694180.397−1.06065720.3090169
X−0.480410610.389668960.436−1.40477890.4439577
XZ0.104590450.298275220.935−0.60297460.8121556
Y0.480410610.389668960.436−0.44395771.4047789
REGR factor score 2ZY−0.183824410.268941510.774−0.82180440.4541556
X−0.77175135*0.277867000.017−1.4309043−0.1125984
YZ0.183824410.268941510.774−0.45415560.8218044
X−0.587926940.363007520.241−1.44904930.2731954
XZ0.77175135 *0.277867000.0170.11259841.4309043
Y0.587926940.363007520.241−0.27319541.4490493
REGR factor score 3 ZY0.588191740.274654350.086−0.06334021.2397237
X0.223869890.283769440.711−0.44928480.8970245
YZ−0.588191740.274654350.086−1.23972370.0633402
X−0.364321850.370718500.589−1.24373610.5150924
XZ−0.223869890.283769440.711−0.89702450.4492848
Y0.364321850.370718500.589−0.51509241.2437361
REGR factor score 4 ZY−0.381962200.282734400.370−1.05266150.2887371
X−0.505543930.292117640.198−1.19850210.1874142
YZ0.381962200.282734400.370−0.28873711.0526615
X−0.123581720.381624660.944−1.02886740.7817040
XZ0.505543930.292117640.198−0.18741421.1985021
Y0.123581720.381624660.944−0.78170401.0288674
REGR factor score 5 ZY−0.046744630.286295960.985−0.72589270.6324034
X−0.269801260.295797400.634−0.97148850.4318860
YZ0.046744630.286295960.985−0.63240340.7258927
X−0.223056630.386431920.833−1.13974610.6936328
XZ0.269801260.295797400.634−0.43188600.9714885
Y0.223056630.386431920.833−0.69363281.1397461
REGR factor score 6ZY−0.303192610.280501090.528−0.96859410.3622089
X−0.83820486*0.289810220.012−1.5256894−0.1507203
YZ0.303192610.280501090.528−0.36220890.9685941
X−0.535012260.378610220.337−1.43314710.3631226
XZ0.83820486 *0.289810220.0120.15072031.5256894
Y0.535012260.378610220.337−0.36312261.4331471
* The mean difference is significant at the 0.05 level.

