Trend Analysis of Droughts during Crop Growing Seasons of Nigeria


1
Department of Hydraulics and Hydrology, Faculty of Civil Engineering, Universiti Teknologi Malaysia (UTM), Johor Bahru 81310, Malaysia
2
Department of Environmental Sciences, Faculty of Science, Federal University Dutse, Dutse P.M.B 7156, Nigeria
3
Department of Civil Engineering, Seoul National University of Science and Technology, Seoul 01811, Korea
*
Author to whom correspondence should be addressed.
Sustainability 2018, 10(3), 871; https://0-doi-org.brum.beds.ac.uk/10.3390/su10030871
Submission received: 6 February 2018
/
Revised: 15 March 2018
/
Accepted: 17 March 2018
/
Published: 19 March 2018
(This article belongs to the Special Issue Impacts of Climate Change on Hydrology, Water Quality and Ecology)
Abstract
:This study assesses the impacts of recent climate changes on drought-affected areas and the occurrence of droughts during different cropping seasons of Nigeria using the standardized precipitation evapotranspiration index (SPEI). The crop growing seasons are considered because the droughts for those periods are more destructive to national agricultural production. The Mann–Kendall test and binary logistic regression were used to quantify the trends in drought-affected areas and the occurrence of crop droughts with different areal extents, respectively. Gauge-based gridded rainfall and temperature data for the period 1961–2010 with spatial resolutions of 0.5° were used. Results showed an increase in the areal extent of droughts during some of the cropping seasons. The occurrences of droughts, particularly moderate droughts with smaller areal extents, were found to increase for all of the seasons. The SPEI values calculated decreased mostly in the regions where rainfall was decreasing. That is, the recent changes in climate were responsible for the increase in the occurrences of droughts with smaller areal extents. These trends in climate indicate that the occurrence of larger areal extent droughts may happen more frequently in Nigeria in the future.
1. Introduction
An increased severity and frequency of droughts around the globe has been noticed in recent decades [1,2,3,4,5]. They have severely affected agriculture, people’s livelihoods, and national economies in many countries around the world [6,7,8]. Most of the climate models project a continuous increase in the frequency and severity of droughts in the forthcoming years [9,10]. The impacts of climate change on drought may be more evident in East Asia, South Asia, and on the African continent.
Though a number of studies reported the significant increase of drought’s geospatial coverage, intensity, and frequency across Africa, Nigeria has not experienced any devastating droughts in the last three decades. This is also supported by the records of drought events of the Centre for Research of the Epidemiology of Disasters [CRED] database EM-DAT [11] based on affected and estimated economic damages. However, Nigeria is located in the high drought risk region of the world [12]. Temperatures in the whole of Nigeria increased over the period 1971–2012 [13], and rainfall over the country decreased during 1901–2000 by 20% [14]. Climatic change has increased the severity and frequency of droughts in different African countries [15]. The lack of reporting on devastating droughts in the last several decades emphasizes the need to understand how the recent changes in climate have affected droughts in Nigeria.
The numerous studies that have been conducted on droughts in Nigeria over the last 40 years have used different indices [16,17,18,19,20,21,22,23,24,25,26,27,28,29,30,31,32,33,34]. However, without any indication of agricultural drought risk considering varying cropping periods, these studies attempted to characterize droughts generally. Furthermore, studies conducted so far to assess the changes exerted on Nigeria by the recent changing climate and how it has changed drought characteristics were not conducted on a nationwide scale. If their occurrence is not within the crop growing season, the destructive droughts are not coincidental with severe droughts [35]. Therefore, drought changes during crop growing seasons are the most important consideration for the better assessment of drought hazard and the development of necessary adaptation and mitigation planning [36,37]. Therefore, this study has the objective of assessing the impacts of recent changes in climate on drought-affected areas, and the occurrence of droughts during Nigeria’s different cropping seasons.
Although a large number of indices have been developed for the identification and characterization of droughts, the standardized precipitation index (SPI) [38] has been the most widely used drought index. However, because evapotranspiration also plays a major role in agricultural water stress and crop production, the standardized precipitation evapotranspiration index (SPEI) [39] was developed. The SPEI considers potential evapotranspiration (PET) in addition to rainfall in assessing drought, and has therefore been found more effective to detect the temporal variability of droughts [40,41]. Furthermore, the SPEI is more suitable to assess the impacts of global warming-induced climate change on drought characteristics [42,43]. A number of studies have been conducted in recent years on the characterization and trend analysis of agricultural droughts using the SPEI [43,44,45]. Mohsenipour et al. [43] analyzed the changes in the return period of droughts during different cropping seasons of Bangladesh using the SPEI. Tian et al. [45] used the SPEI for the prediction of agricultural droughts in the Xiangjiang River Basin of China. Prabnakorn et al. [46] analyzed the relationship between crop yield and the SPEI for the assessment of drought impacts on rice production in the Mun River Basin of Thailand. These studies revealed the effectiveness of the SPEI in the assessment of agricultural droughts in different climatic regions.
The SPEI was used for the reconstruction of spatial patterns of droughts in Nigeria for the growing seasons of crops—namely, yam, rice, corn, millet, and sorghum—for the period 1961–2010. This study utilized gauge-based gridded rainfall and temperature data for the period 1961–2010 with a spatial resolution of 0.5°. The Mann–Kendall trend test and binary logistic regression were used for the identification of trends in drought-affected areas and the occurrence of droughts. The methodology presented in this study is anticipated to provide better insight into the changing characteristics of droughts, which have had significant impacts on agriculture and the economy due to climate change.
2. Study Area and Data
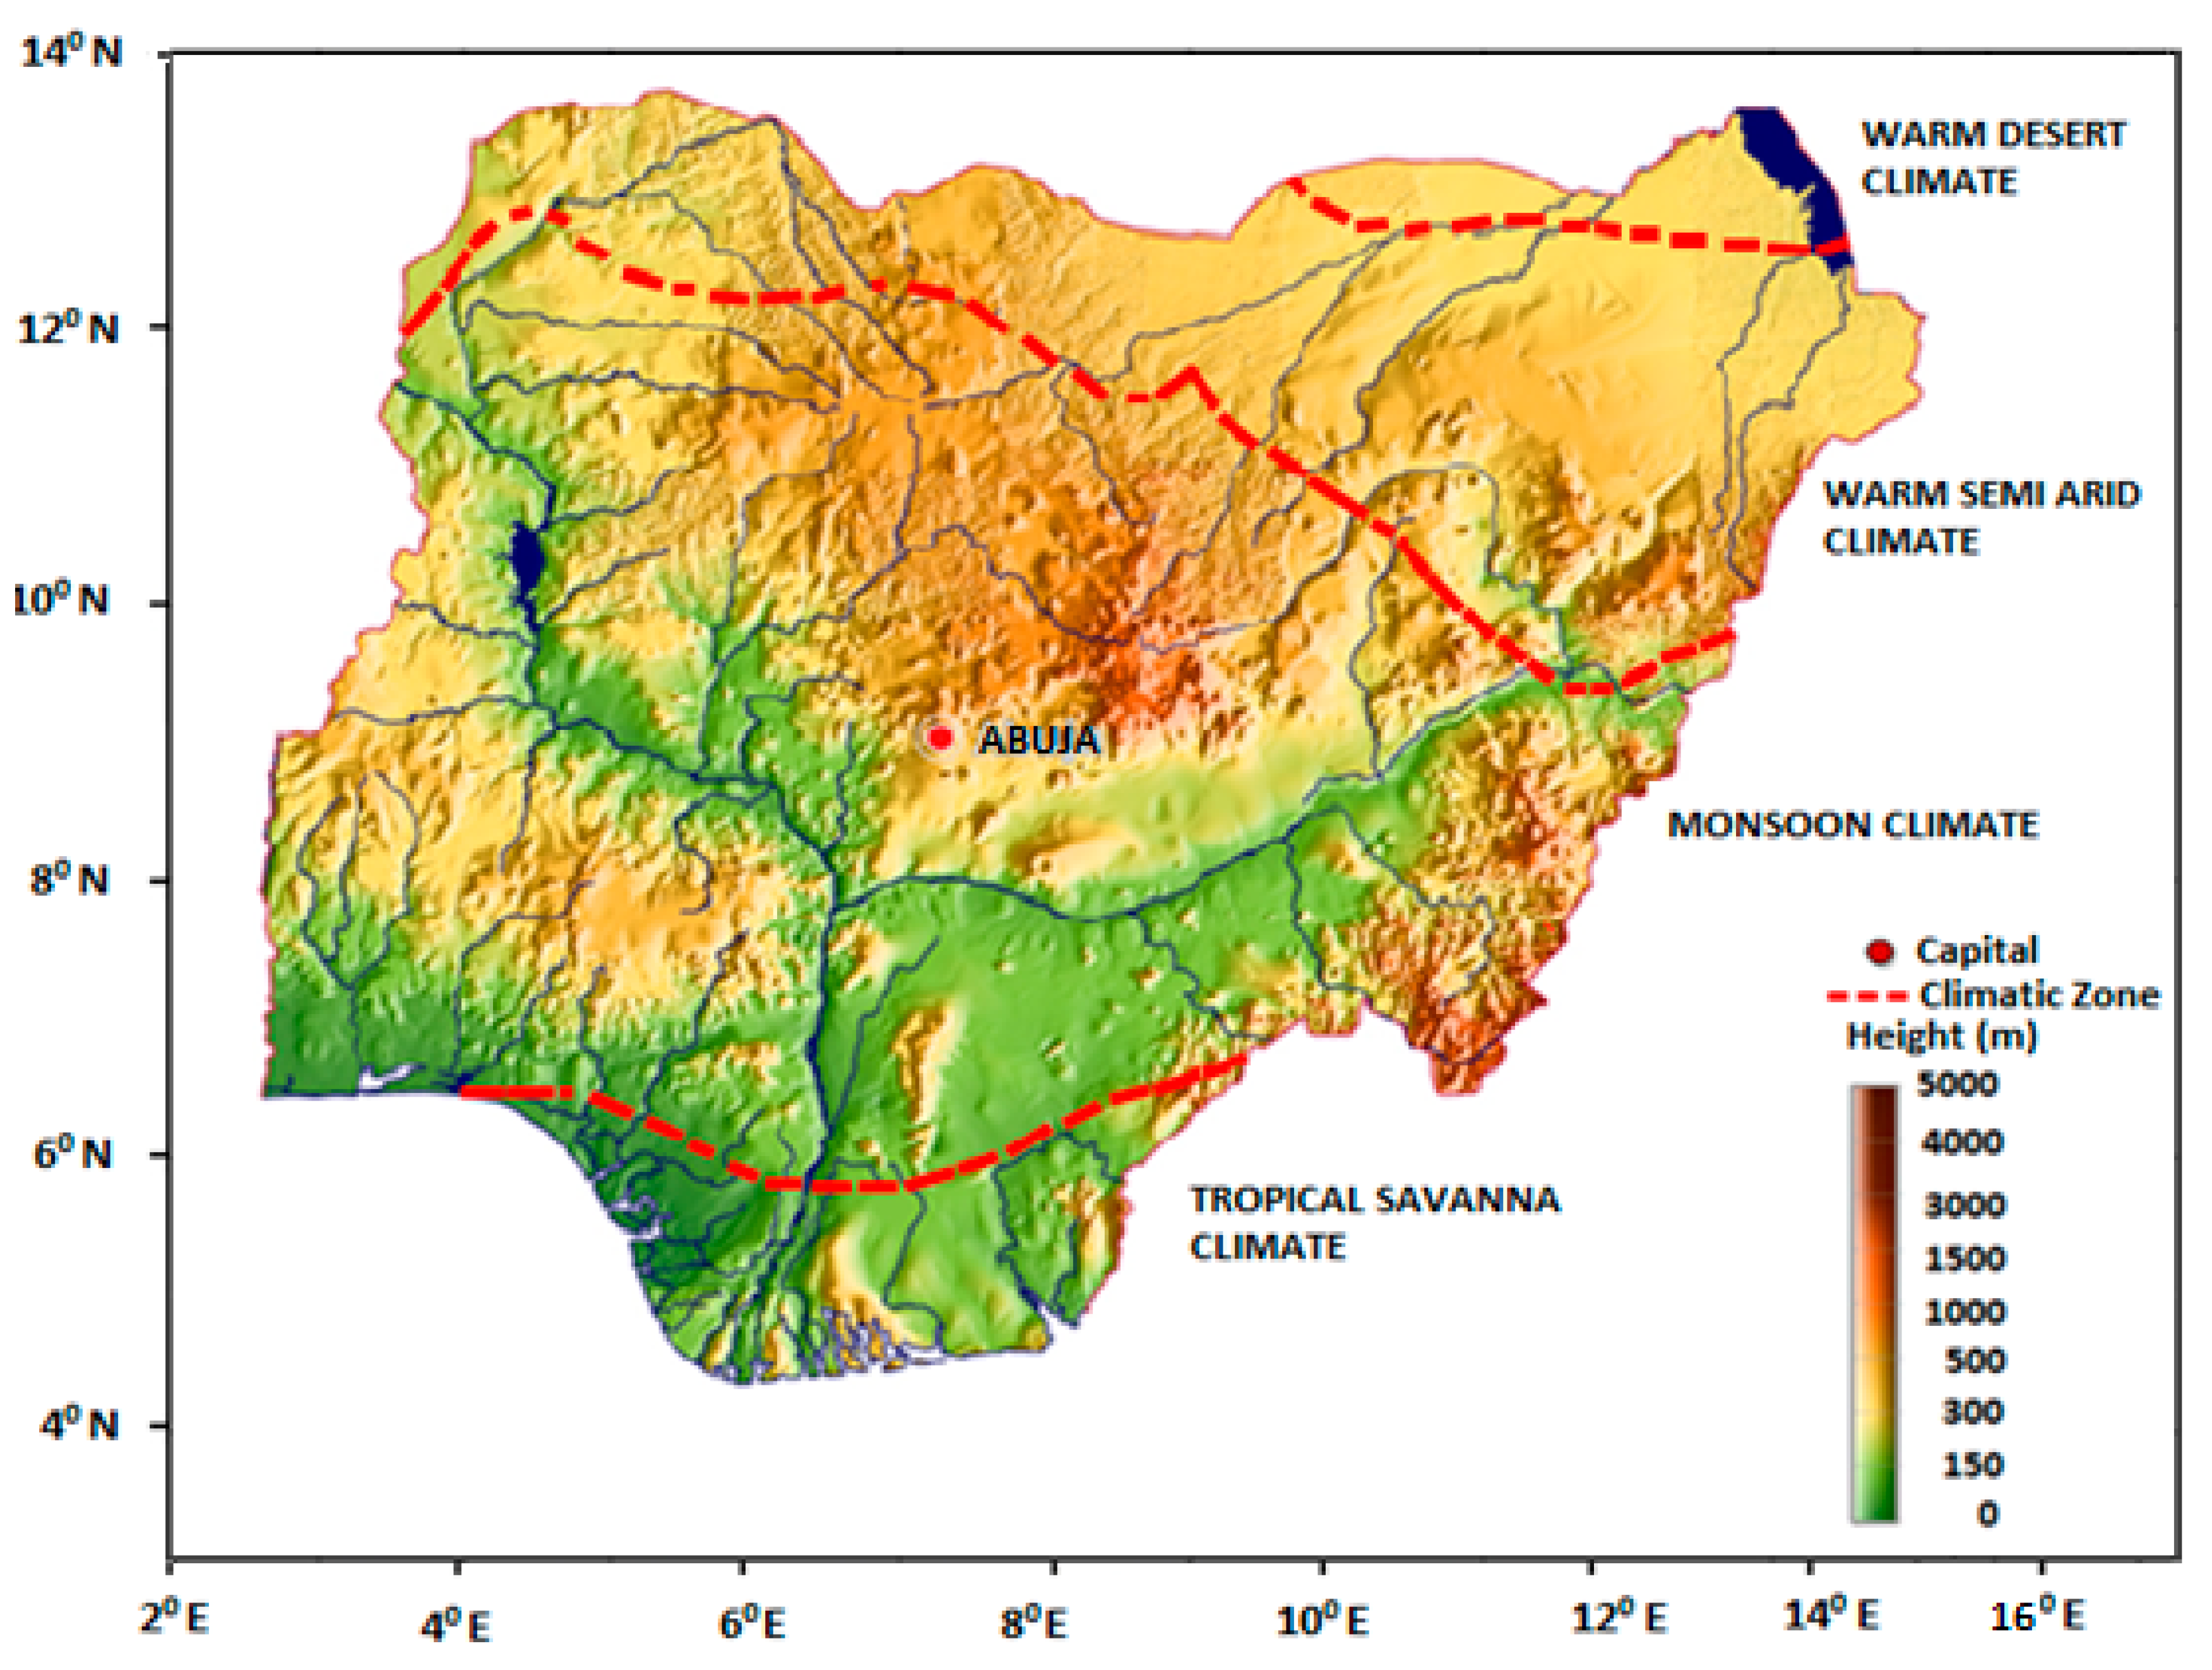
Nigeria is located in West Africa (Latitudes 4°15′–13°55′ N; Longitude: 2°40′ and 14°45′ E), and has an area of 923,000 km2 (Figure 1). The Nigerian climate can be classified into two major seasons: namely, the rainy and the dry seasons. The amount and timing of rainfall varies significantly over the country, with the southern parts receiving an annual rainfall of over 2000 mm, mostly occurring between April and October, and the northern parts receiving an annual rainfall below 500 mm, which mostly occur between June and September. The temperature ranges from 30–37 °C in the south, and as high as 45 °C in some parts of the north before the rainy season begins, while the temperature goes as low as 12 °C in the north and ranges between 17–24 °C in the south during the dry season (December–February). The land of Nigeria can be classified into four climatic zones: namely, tropical savanna climate, monsoon climate, warm semi-arid climate, and warm desert climate, according to the Koppen classification (Figure 1). The elevation of Nigeria ranges from 0 m near the coast of Atlantic Ocean in the south to 2419 m in Chappal Waddi in northeastern Nigeria (Figure 1).
Agriculture plays a significant role in the economy of Nigeria as it contributes about 20% of the country’s gross domestic product (GDP) [47]. Agriculture provides a main source of livelihood for 70% of Nigerians. Nigeria produces various food crops including rice, corn (maize), yam, cocoyam, beans, sorghum (guinea corn), melon, and soya beans, among others [48]. Amongst these, rice, yam, corn, sorghum, and millet are the most consumed. Any reduction in the production of these major crops due to natural hazards such as droughts would have a significant impact on people’s livelihood and the economy of the country.
The monthly precipitation data used in this study was obtained from the global precipitation climatology center (GPCC), with a spatial resolution of 0.5° × 0.5°, and the temperature data was obtained from the climate research unit (CRU). The monthly time series of rainfall and temperature for the period 1961–2010, which were estimated at 326 GPCC and CRU grid points, were used to estimate the areal extents of droughts in Nigeria.
3. Methods
3.1. Defining Cropping Seasons
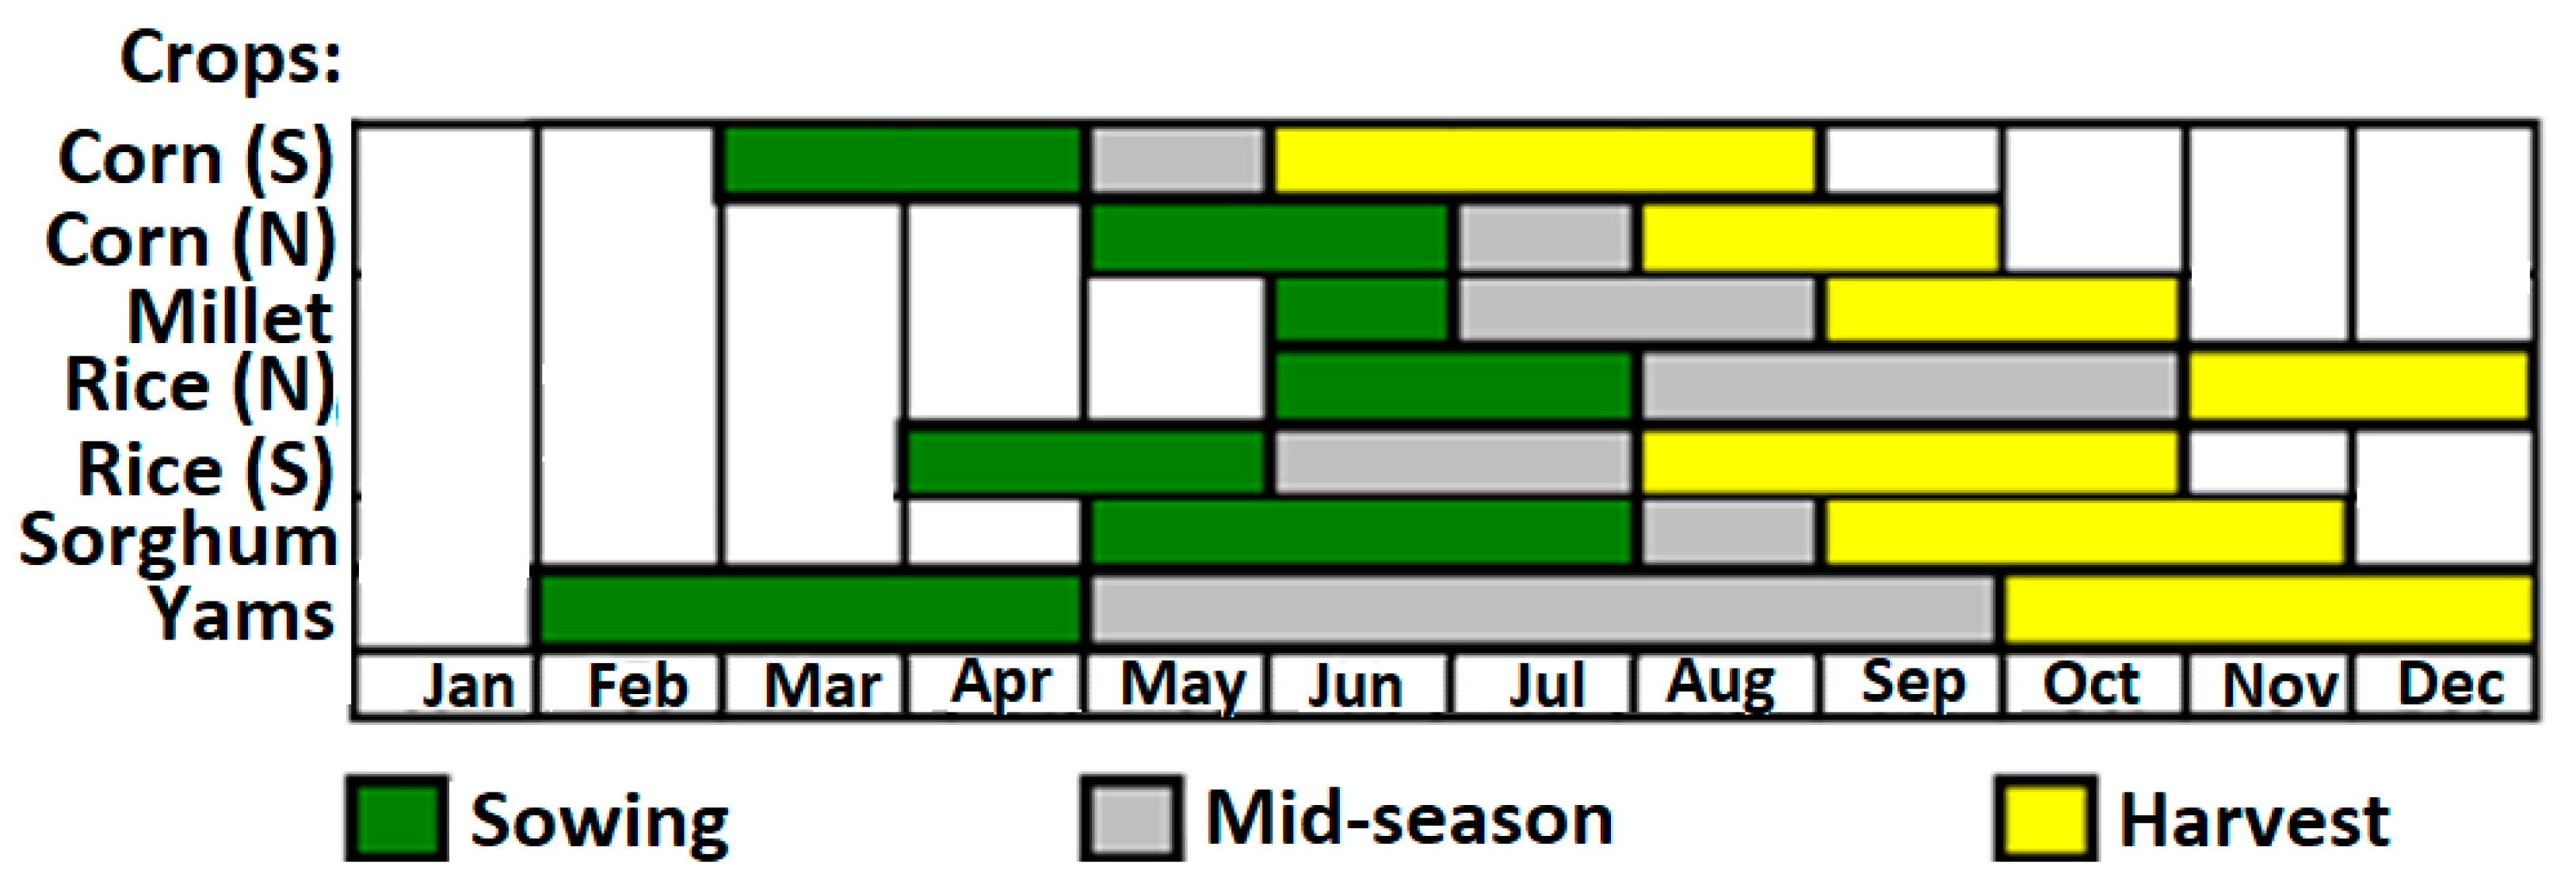
The calendar for selected crops of Nigeria is shown in Figure 2. Yam, being a tuber crop, generally has a longer growing season compared to other crops. Some of the crops, such as rice and corn, have a main and a second cropping season. This study considered only the main cropping seasons for all of the crops. The cropping seasons of corn and rice vary between the south and north of Nigeria. Therefore, those cropping seasons for both the north and south are considered.
3.2. SPEI for Crop Drought Analysis
The SPEI method [39] considers both rainfall and evapotranspiration for the identification of droughts. Different temperature, radiation, and mass transfer-based methods are available for the estimation of PET [49]. Vicente-Serrano et al. [39] proposed the use of the Thornthwaite method for the estimation of PET for the calculation of the SPEI. Stagge et al. [50] suggested that the SPEI is not sensitive to the method used for the estimation of PET. On the other hand, Begueria et al. [42] showed that differences between the SPEI series that are calculated using different PET methods may be significant in some regions, such as in semi-arid regions. They proposed the use of Penman–Monteith method as the first choice, followed by the Hargreaves and Thornthwaite methods for the calculation of the SPEI. Among these methods, the Thornthwaite method requires only average temperature for the calculation of PET, and therefore, it is the most widely used method in the region where data availability is limited only to average temperature data. Therefore, the Thornthwaite method was used in this study for the estimation of PET.
In the SPEI, the difference accumulated between monthly precipitation and potential evapotranspiration at different time scales are fitted with a three-parameter probability distribution function (PDF). The estimated parameters of the best-fitted PDF are used to calculate SPEI values. An SPEI value in between −1.0 and −1.5 indicates a moderate drought, and that between −1.5 and −2.0 means a severe drought, while the value below −2.0 presents an extreme drought.
The drought for a season is determined from the SPEI value at the last month of the season estimated for the time period of the season. Water is more critical during sowing and the mid-season (vegetative) period for crop production. Therefore, the SPEI value was calculated for the period spanning the sowing and vegetative stages of a crop for the assessment of drought for that crop. For example, a three-month SPEI value computed in August was used for the analysis of droughts for Millet. The periods used for the estimation of droughts during different crop growing seasons using the SPEI are given in Table 1. The SPEI values at all of the 326 grid points were computed to estimate the affected areas by various severities of droughts during different crop growing seasons.
3.3. Trends in Droughts
The non-parametric Mann–Kendall (MK) test [51] was used in assessing trends in drought-affected areas. The normalized test statistic Z is estimated by the MK test to estimate the significance of trends. A threshold of 95% confidence level for positive and negative trends significance classification was used in this study. If |Z| > 1.96, there is a rejection of the null hypothesis of no trend at the 95% level of significance.
Logistic regression [52] can be used to model the occurrence of an event in respect to time. The binary logistic regression coefficient can be used for the assessment of a trend in a binary time series. Therefore, logistic regression was used in this study to assess how the occurrence of drought changes with time. For this purpose, a binary time series was generated for drought-affected areas, where 1 was used to represent the occurrence of drought that affected a certain threshold of an area (e.g., 5% of total area) in a year, and 0 was used for no droughts, or a drought that occurred but affected an area that was less than the threshold area. The logistic regression model for the binary time series was developed to estimate the changing probability of drought event, x:
where, z is known as a linear predictor, which is given as:
In term of y, the model can be written as .
A number of assumptions of the ordinary least squares are violated by the binary response model, and therefore, the maximum likelihood method was used for estimating the model parameters of a logistic regression model, with the assumption that is a Bernoulli random variable. The Wald test was used to assess the significance of the regression coefficient in the logistic regression model, and therefore, the significance of a trend in the occurrence of droughts. The Wald test statistic is calculated by dividing the regression coefficient value by the standard error of the model. The null hypothesis of no trend in the occurrence of droughts can be rejected if the Wald test statistic is less than the critical table value at a 95% level of confidence.
4. Results and Discussion
4.1. Reconstruction of Historical Droughts
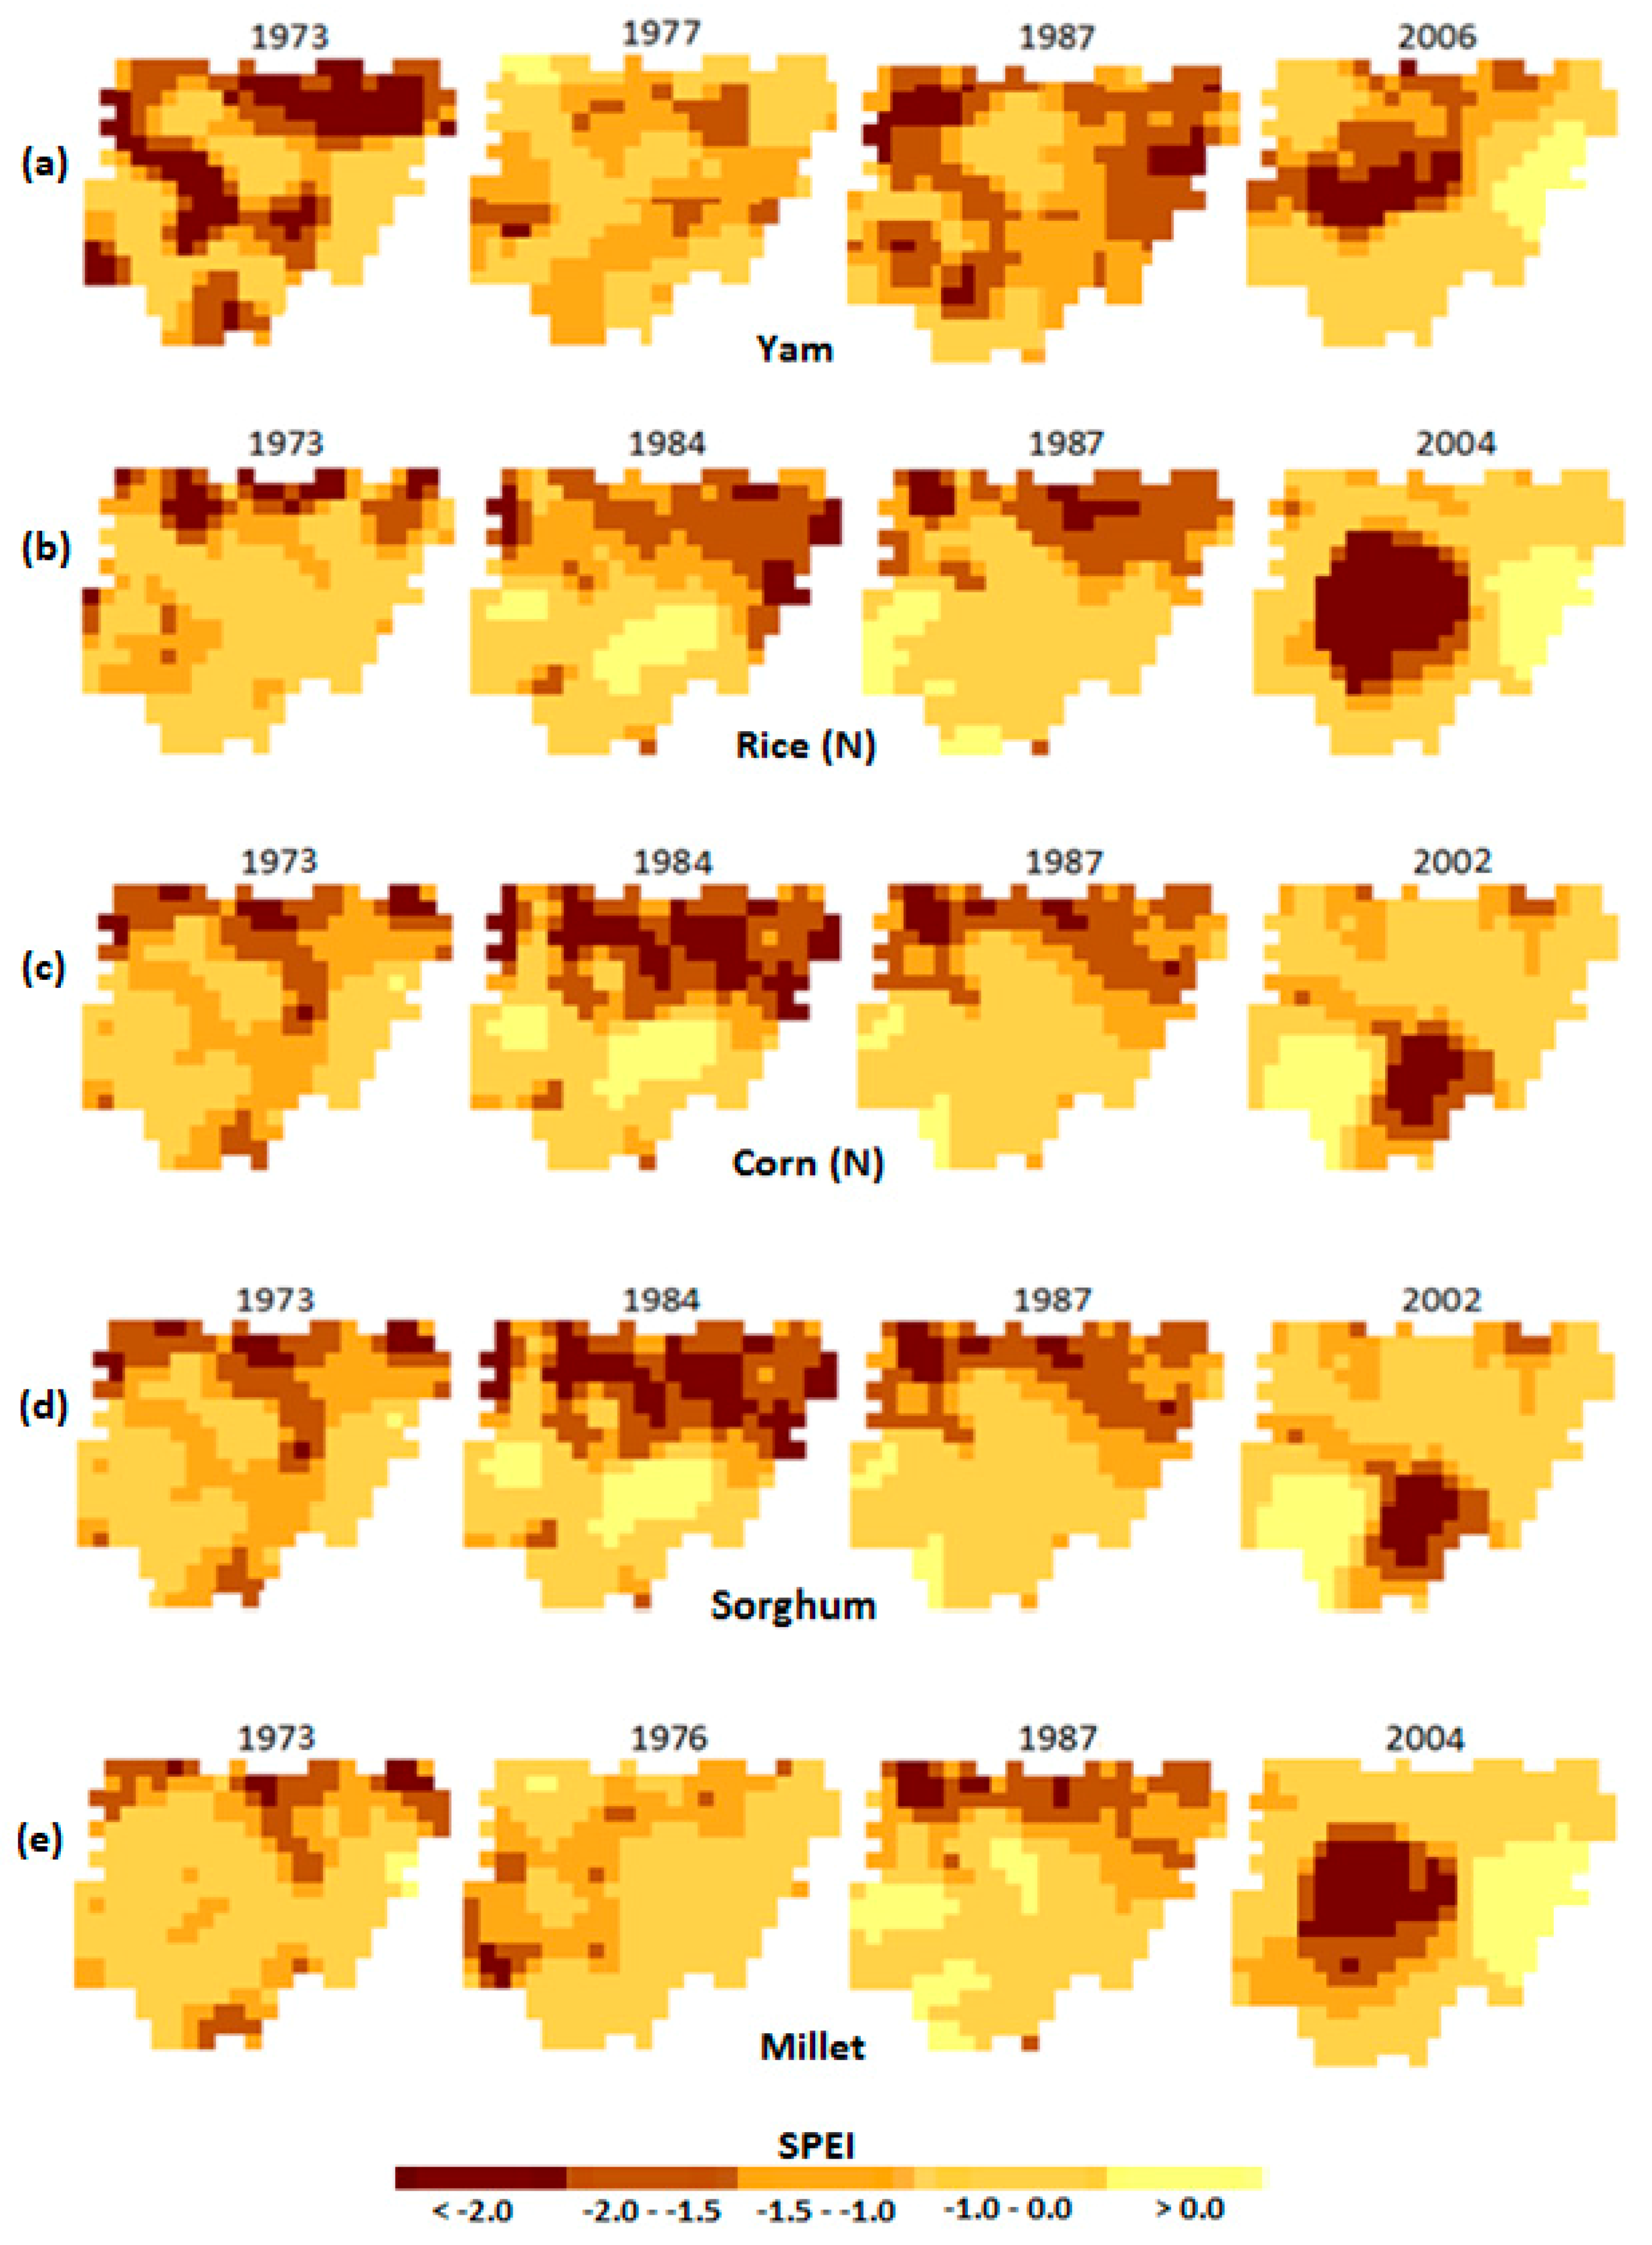
The SPEI values for each cropping season for all of the years between 1961–2010 were calculated for each grid point, and the maps of drought-affected areas for all of the years were prepared. While the cropping seasons are the same for some crops—including yam, sorghum, and millet, the cropping seasons are different for rice and corn for the north and the south. Therefore, the maps were scrutinized to estimate the areas covered by various severities of droughts during different crop growing seasons. The spatial results for four selected years for yam, rice (N), corn (N), sorghum, and millet are shown in Figure 3. The drought-affected years in Figure 3 were chosen, considering that the areas affected by moderate droughts are at least 30% of the total area for those years. The spatial distribution of the different classes of droughts varied for the various crops within Nigeria for all of the crops and for the selected years. However, the affected areas by droughts during the rice (N) cropping seasons were similarly affected by droughts for the cropping season for sorghum in the same years. The north–central part of Nigeria was severely affected by extreme droughts in the year 2004 during the rice cropping season in the northern part of Nigeria. Drought severities and affected areas were least for the years 1973 and 1976 for the millet cropping season, and 1977 for the yam cropping season.
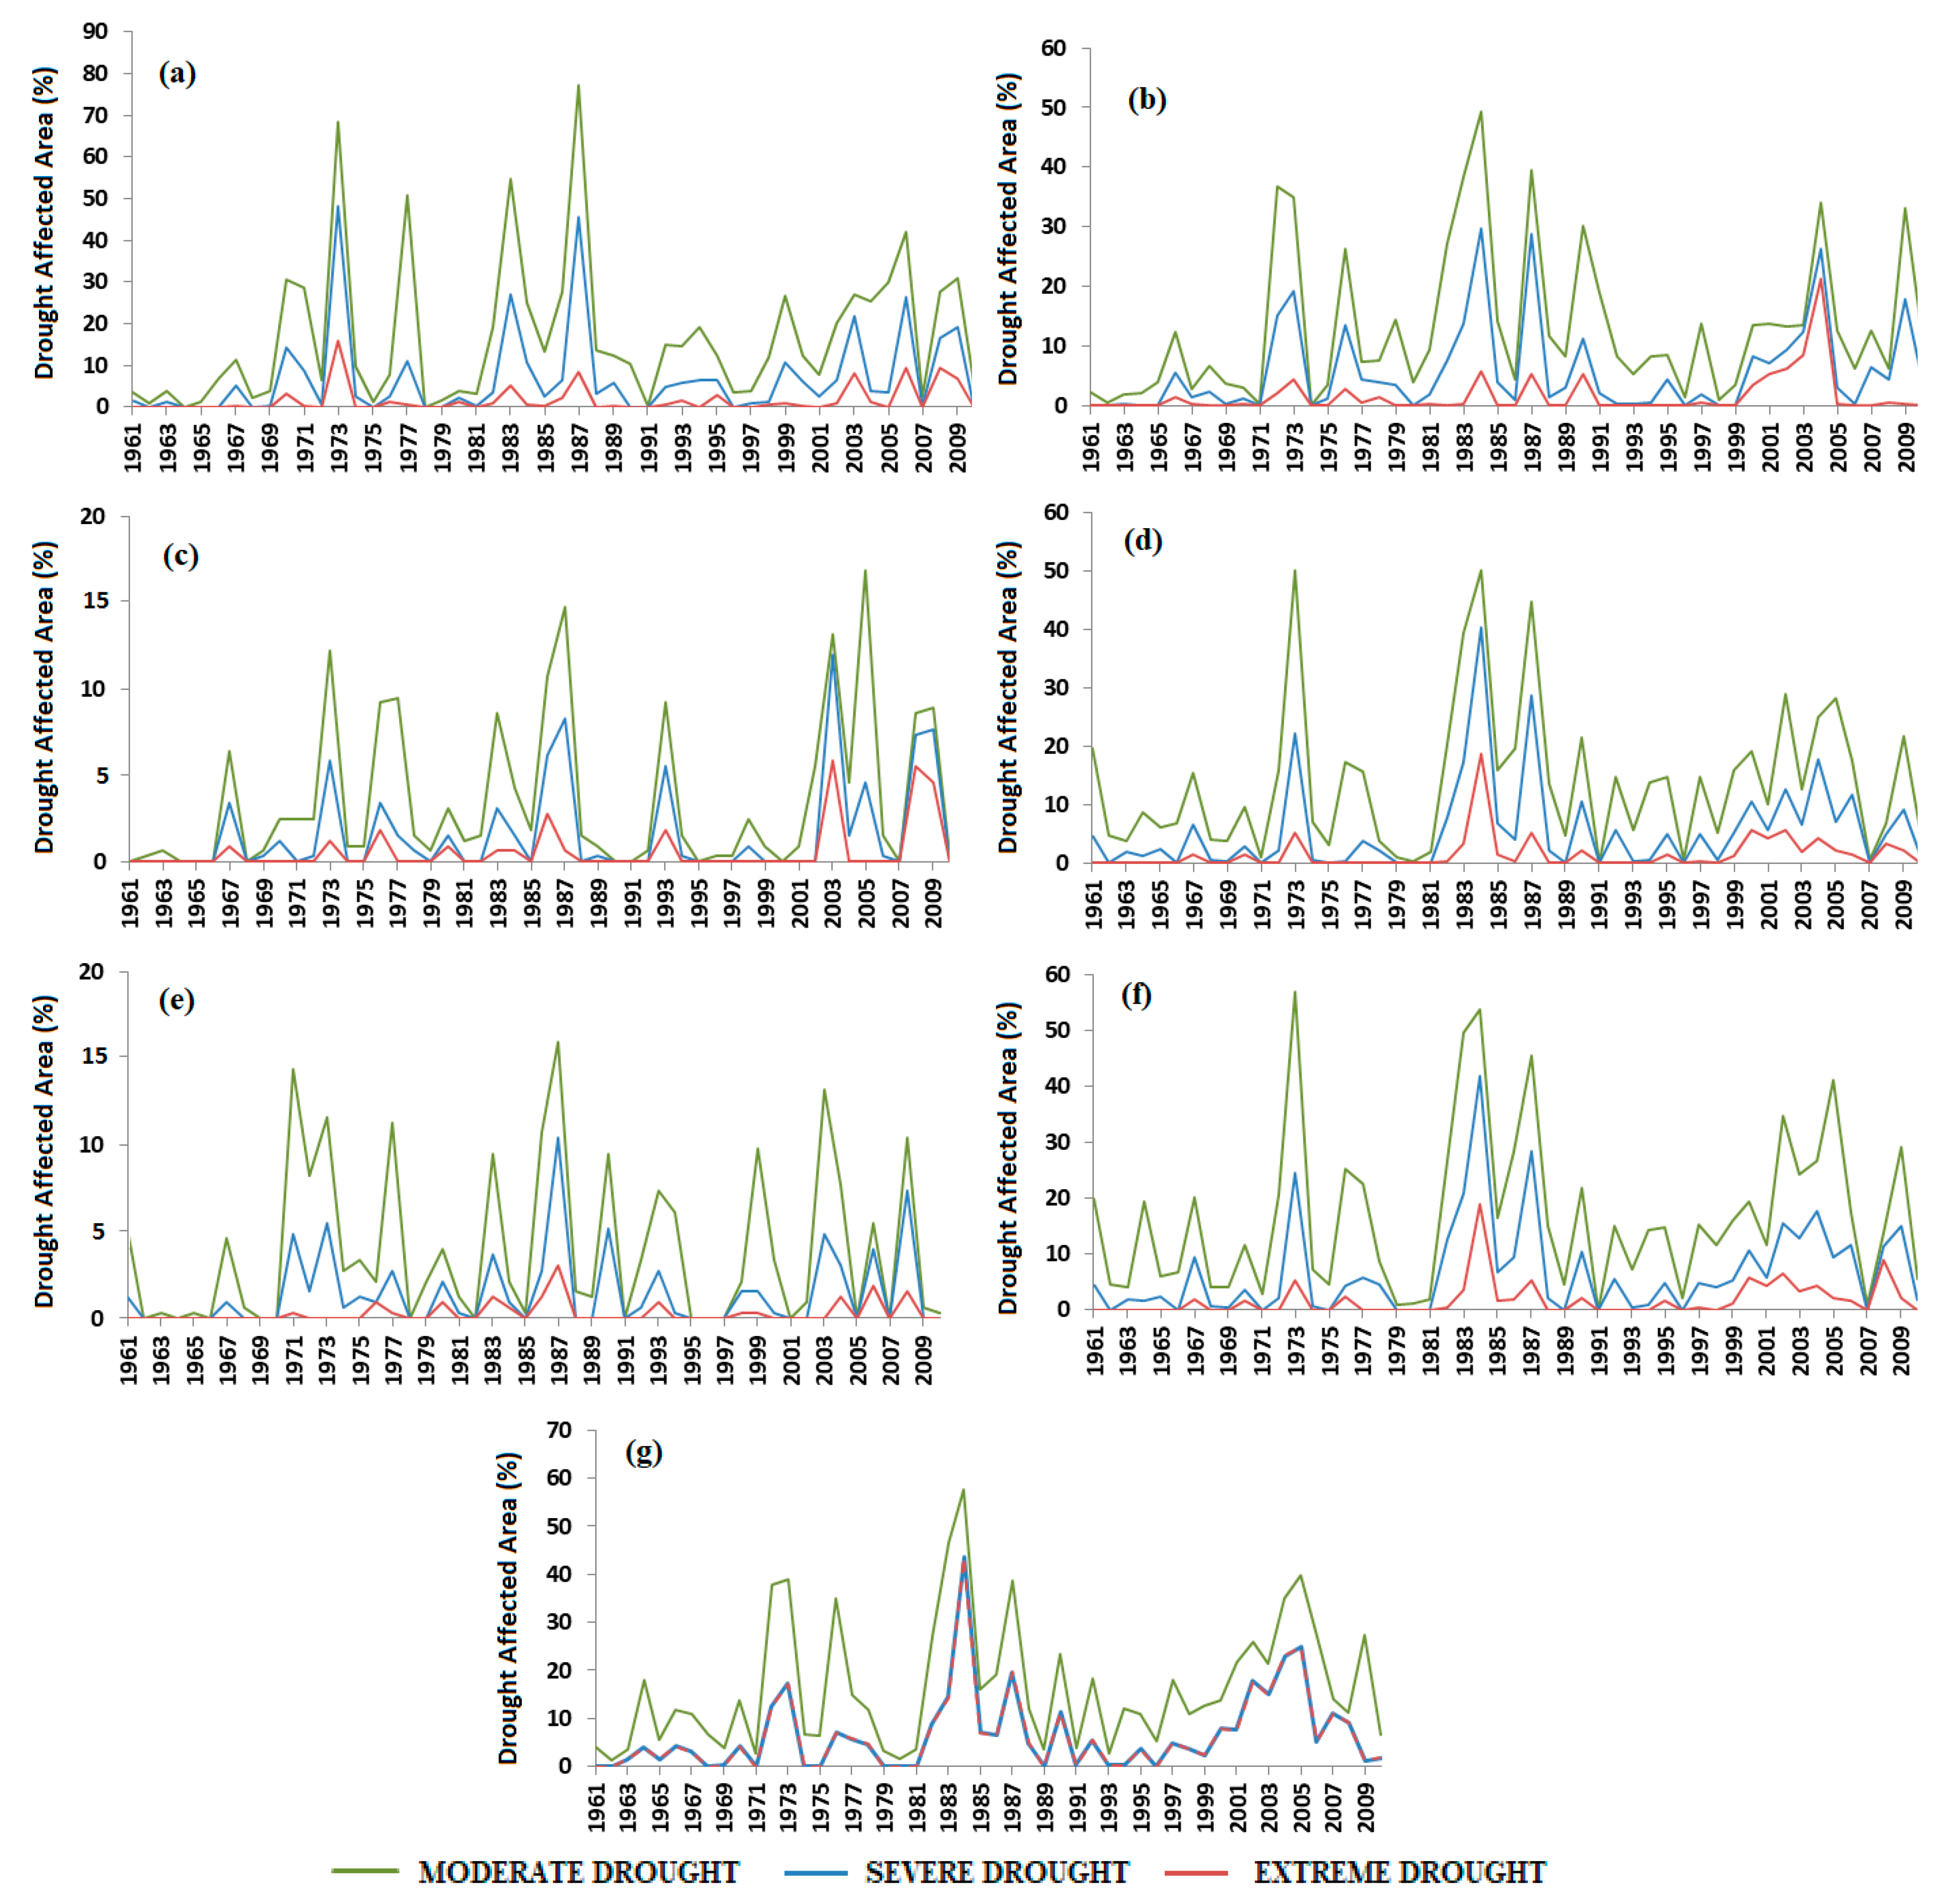
The areas affected by droughts of different severities in each year between 1961–2010 were estimated through preparing the drought time series of the affected areas during different cropping seasons, as shown in Figure 4. These identified the drought years for different crops. For example, a significant portion of Nigeria was affect by droughts during the yam-growing period in years 1970, 1973, 1977, 1983, 1987, and 2006 (Figure 4a). Similarly, the droughts during the rice-growing period in the north was found to occur in the years 1972–1976, 1982–1984, 1987–1988, 2003–2004, and 2009 (Figure 4b).
4.2. Trends in Drought Affected Area
The MK trend test results on the drought time series of affected areas are given in Table 2. The numbers in the table indicate the changes in the drought-affected areas in km2/decade. The bold numbers indicate a significant change at a 95% level of confidence. The table shows the increases in the drought-affected areas for all of the crop growing seasons, except for rice (S) and corn (S). The highest increases in drought-affected areas were observed for moderate yam droughts, at 10.38 km2/decade. The highest increase in severe droughts was observed for sorghum at 4.11 km2/decade, while the highest increase in extreme droughts was for millet, at 3.33 km2/decade. The severe and extreme drought-affected areas were found to increase for all of the crop growing seasons, except for those of rice (S) and corn (S), while the moderate drought-affected areas are increasing during the yam, rice (N), and millet crop-growing seasons.
4.3. Trends in Occurrence of Droughts
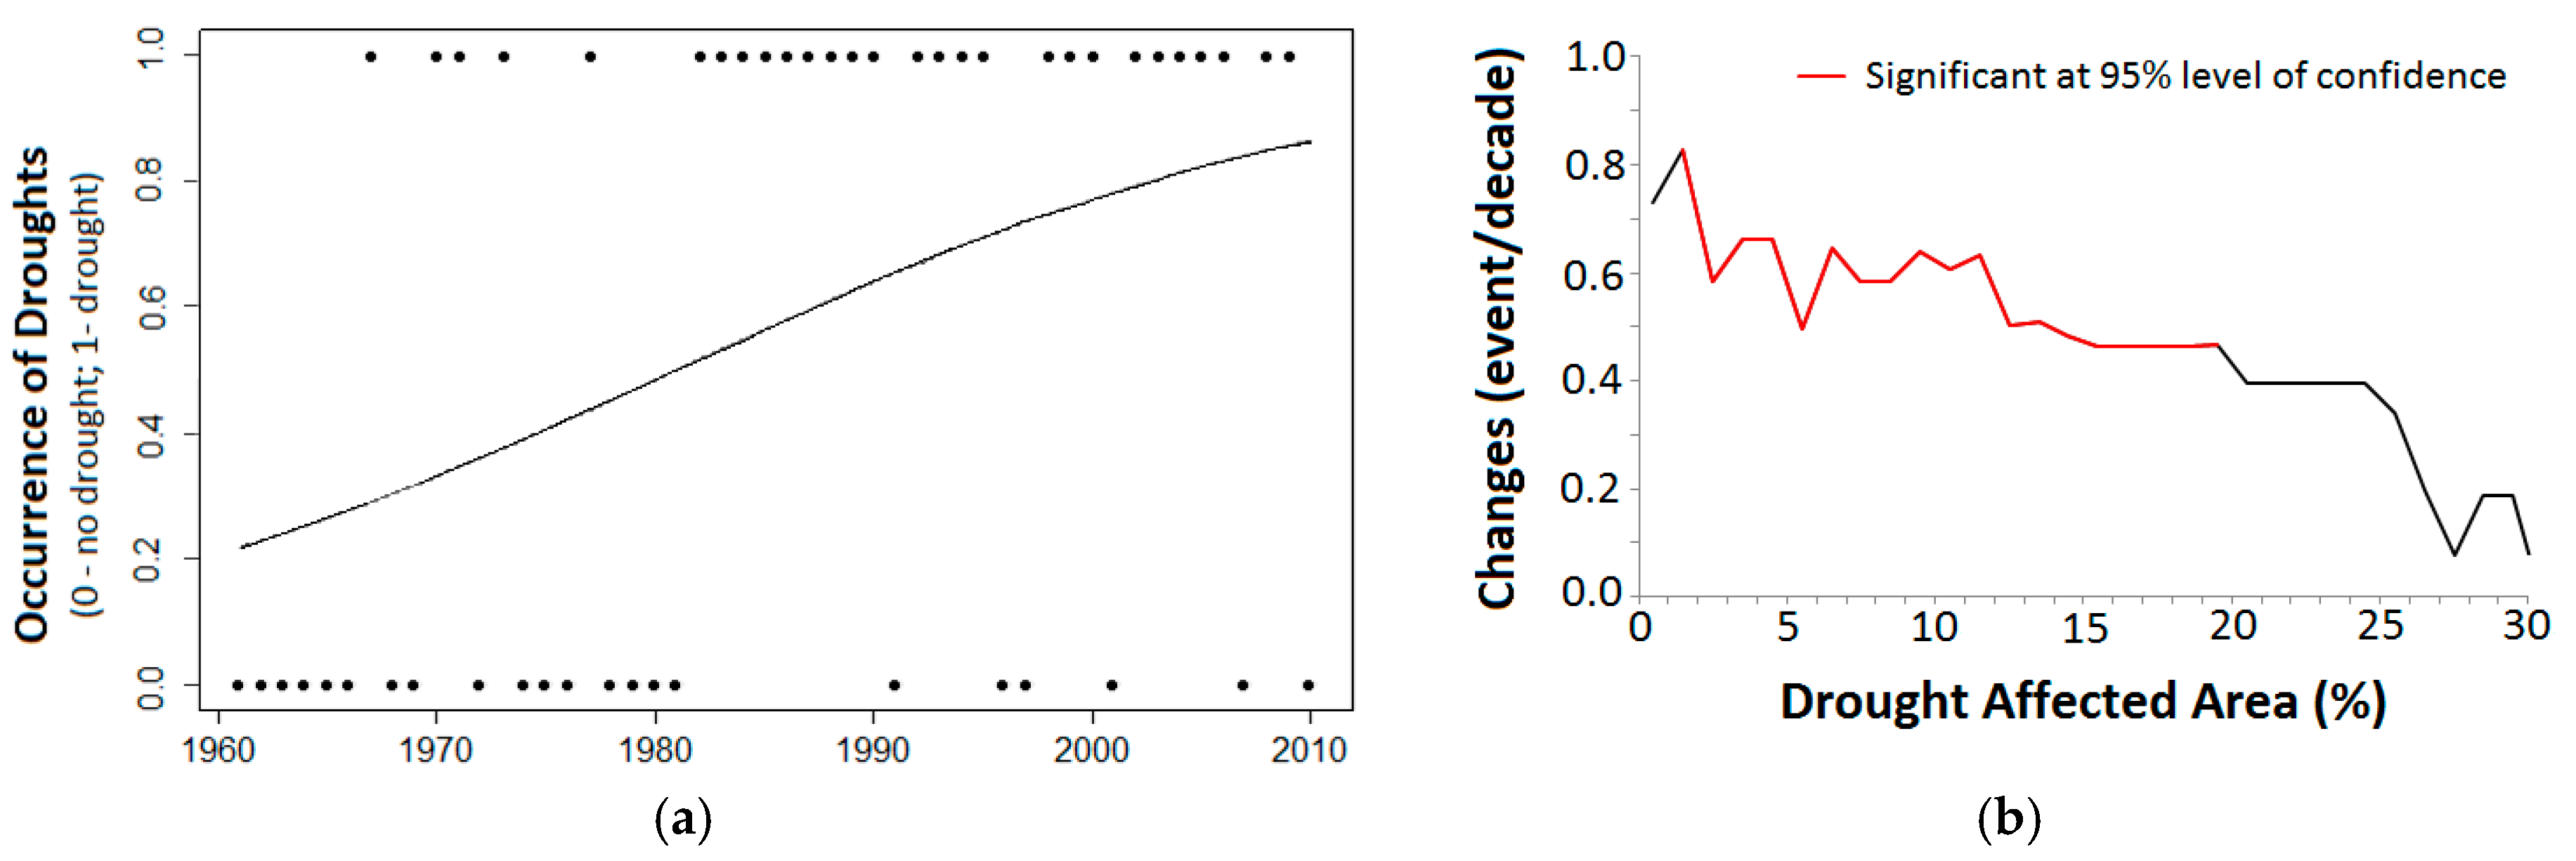
Trends in the occurrence of droughts with different areal thresholds were assessed using logistic regression to understand regional changes in all of the crop drought frequencies. For this purpose, a binary time series of occurrence of droughts with different areal thresholds were prepared for all of the severities of droughts for all of the seasons. For example, a binary time series of occurrence of moderate yam droughts that affected at least 10% of the area of Nigeria is shown in Figure 5a. The occurrence of drought in a year is represented as 1, and no drought or droughts affecting less than 10% of the area of Nigeria is represented as 0 in the figure. The best-fit logistic regression line for this binary time series is also shown in Figure 5a. The slope coefficient of regression Equation (1) gave the changing probability of drought events.
The rate of change in the probability of the occurrence of a drought event and its significance are estimated for areal thresholds ranging from 1% to 30%. A trend analysis was not conducted for droughts of areal extents of more than 30%, due to their rare occurrences. Changes in the probability of occurrence of moderate yam droughts with different areal thresholds are shown in Figure 5b. For the preparation of the figure, a separate binary time series of occurrence of yam droughts with an areal extent of less than 1%, 2%, 3%, etc. were prepared. Therefore, a total of 30 binary time series were prepared for areal thresholds ranging from 1% to 30%. Logistic regression was conducted over each of the 30 binary time series in order to assess the rate of change in the occurrence of droughts with different areal extents, as well as the significance of the change. The magnitudes of changes in droughts for different areal thresholds are shown in Figure 5b. The changes in drought events are very slow phenomena. It may not be noticeable for a short interval of time, which can be up to several years. Therefore, changes in droughts are presented in this paper as events/decade instead of events/year. The significant changes are presented in red in the figure, which shows that the occurrence of moderate yam droughts with areal extents in the range of 2% to 20% are significantly increasing in Nigeria.
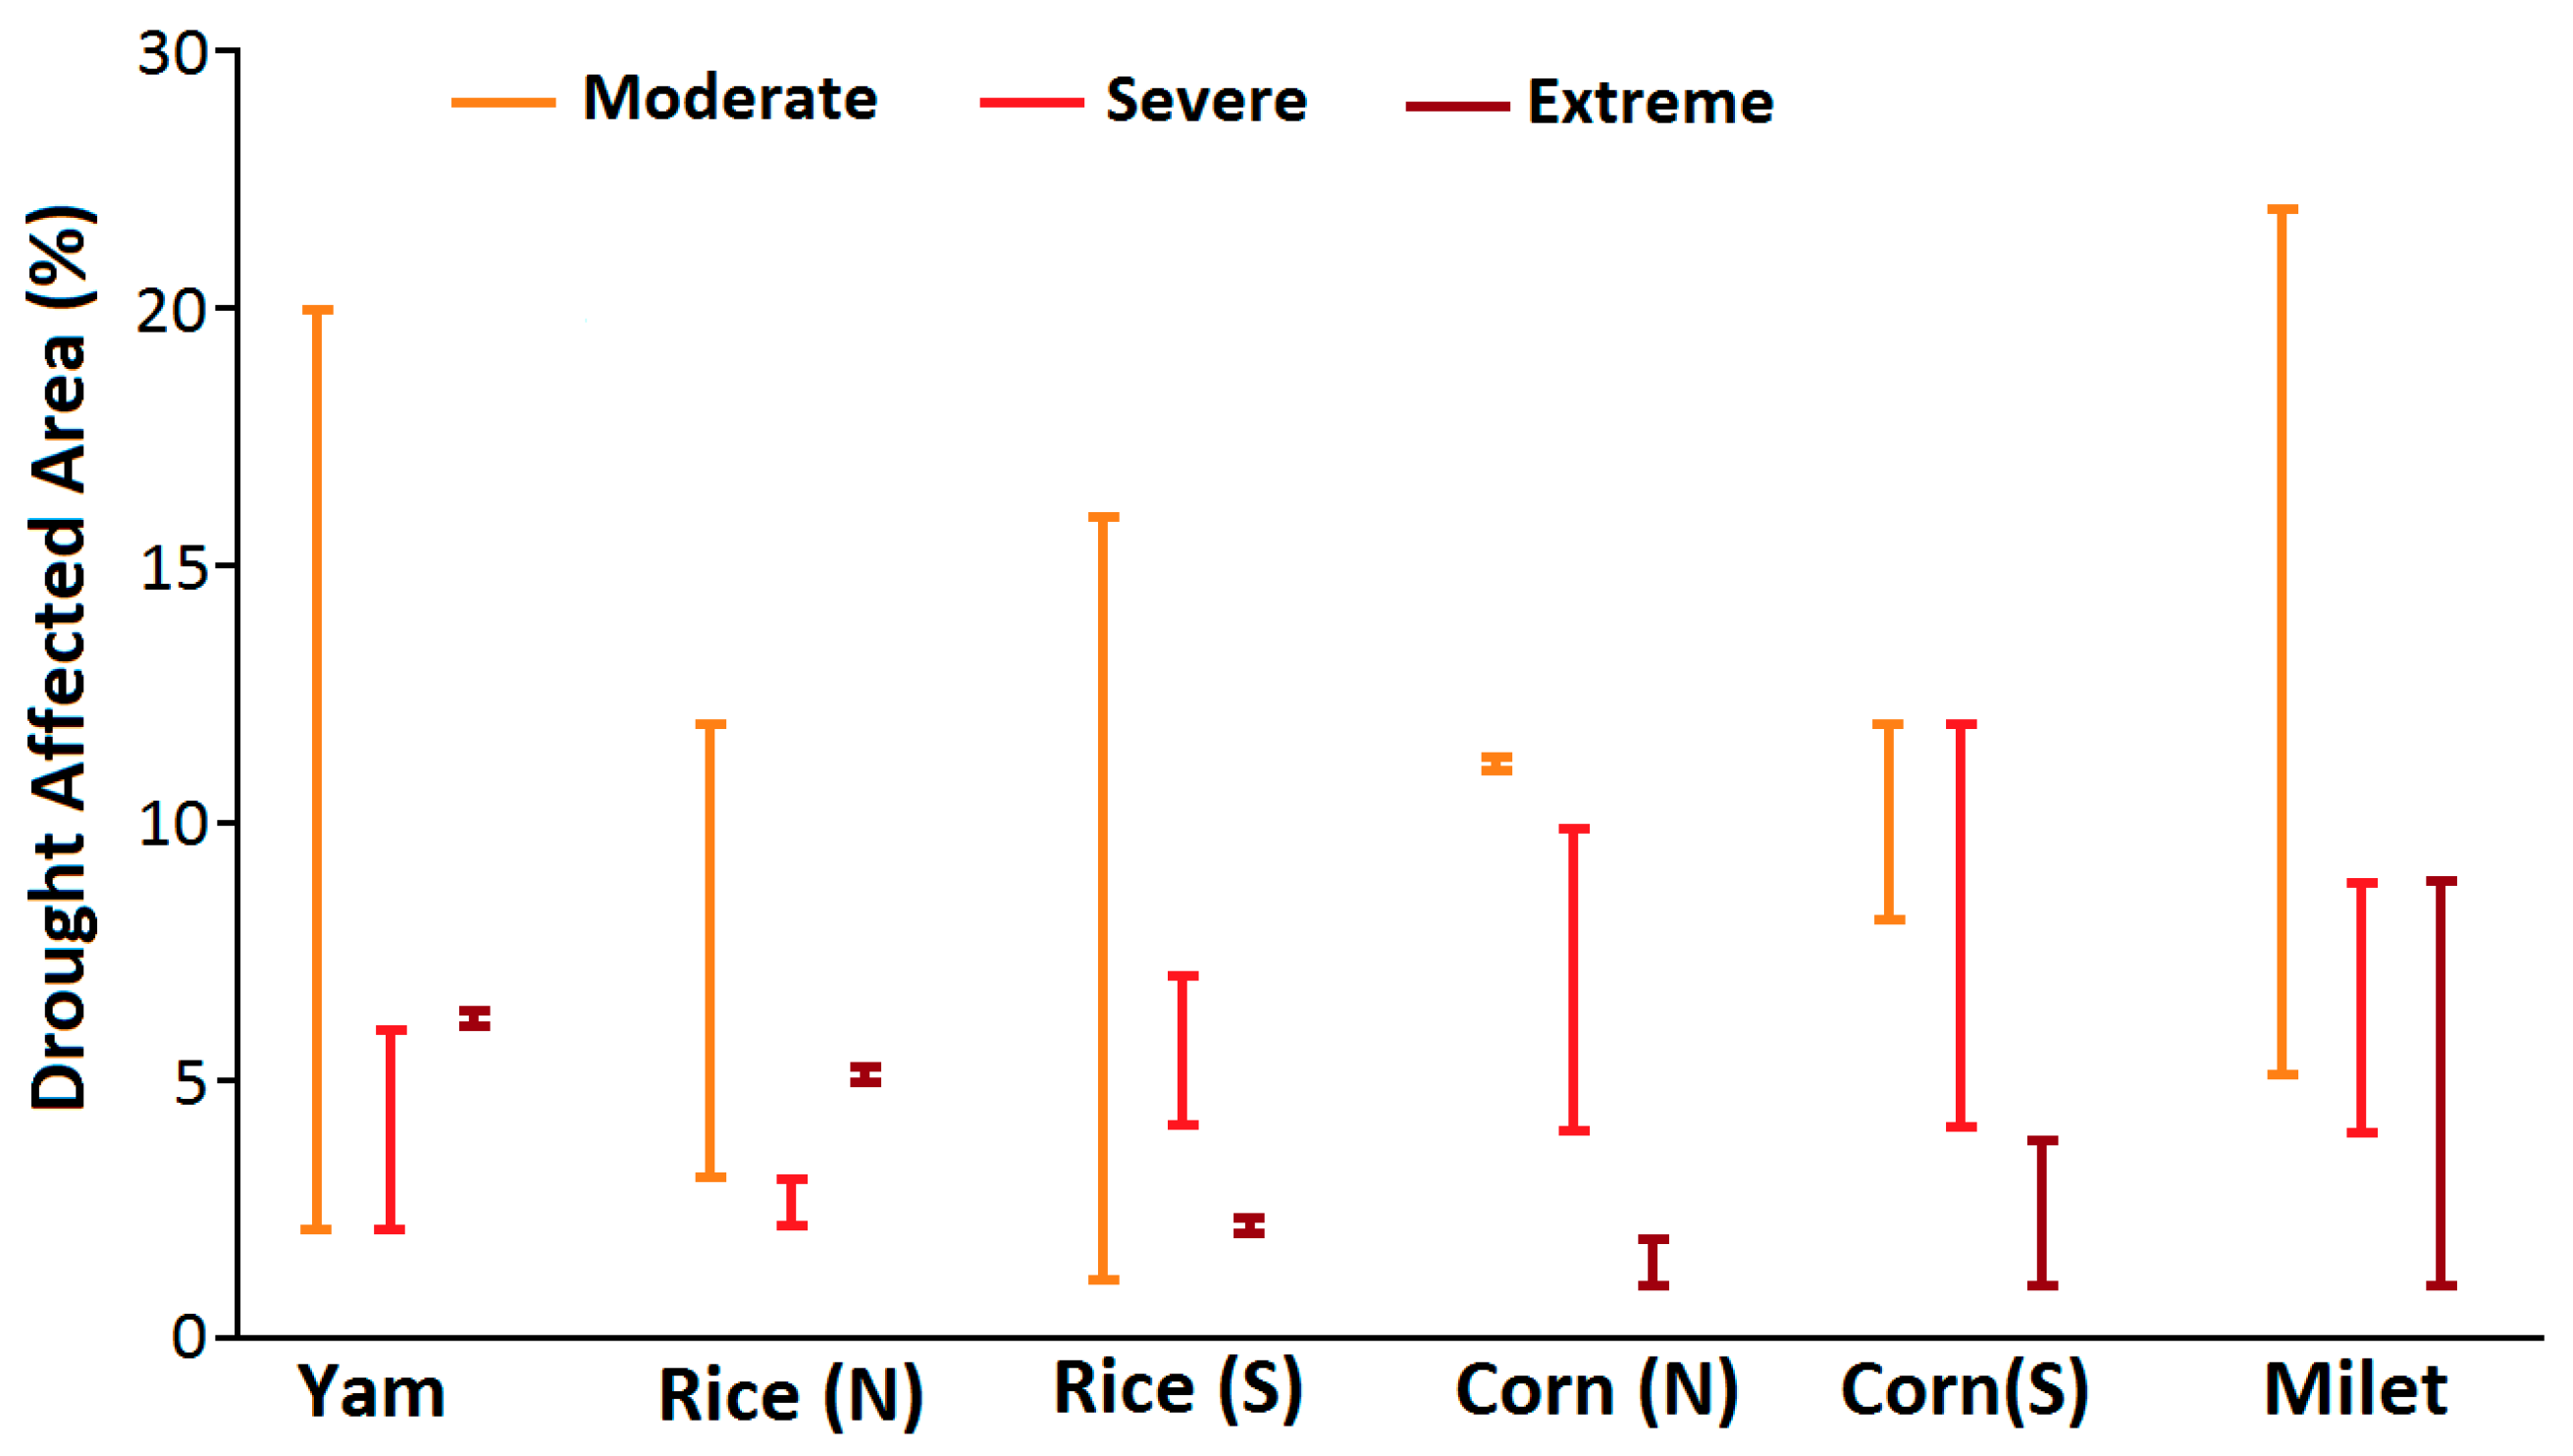
A similar analysis was conducted for different droughts severities for all of the crop growing seasons. Droughts were found to significantly increase for a certain range of areal threshold for all of the cases. No significant decrease was found for any case. Obtained results are summarized in Figure 6. The bars represent the areal extents for which different severities of crop droughts are increasing significantly.
Figure 6 shows that the occurrence of regional moderate droughts is increasing for a wide range of areal threshold for all of the crop growing seasons, except for corn (N). On the other hand, increases in extreme droughts occurred in limited areal thresholds. The increases in the areal extents of extreme droughts were found to be high only for corn (S) and millet, which indicates that these two crops are more vulnerable to water stress. The occurrence of moderate droughts is increasing for a wider range of areal extents during the yam, millet, and rice (S) crop growing seasons. Meanwhile, the occurrence of severe droughts is increasing for a wider range of areal extents during the corn (S), corn (N), and millet crop-growing seasons, and the occurrence of extreme droughts increasing for a wider range of areal extents during the millet and corn (S) crop growing seasons. Overall, the results revealed that the occurrence of droughts, particularly moderate droughts with various areal extents, is increasing in Nigeria. Increasing occurrences of various severities of droughts were found for a wider range of areal extents during the millet crop growing season, and were found to be the least during the corn (N) crop growing season. Though the areal extents of the droughts for some seasons are not changing in Nigeria (Table 1), the occurrences of all of the severities of droughts for a certain areal extent are increasing for all of the seasons.
4.4. Changes in Rainfall and Temperature
Rainfall, temperature, and SPEI trends during different crop growing seasons were assessed using the MK test in order to understand the climate change impacts on the occurrences of droughts in Nigeria. Spatial patterns in the trends of total rainfall, mean temperature, and SPEI values during the yam growing season are shown in Figure 7. It shows that there is an increase in the mean temperature all over Nigeria (Figure 7b), but an insignificant change in rainfall, except in a small patch in the southeast and the northeast of the country (Figure 7a). The changes in the SPEI during the yam growing season shows the significant decrease in the SPEI values or the increase in drought severity at a few grid points distributed in different parts of the country. The SPEI values were found to decrease mainly in the regions where rainfall was decreasing. Increasing drought severities at a few other grid points were due to the increase in temperature. The percentages of grid points showing a significant decrease in rainfall and increase in temperature and SPEI values during different crop growing seasons are summarized in Table 3. Though the temperature has increased in most parts of Nigeria, changes in rainfall are still very rarely visible. The increases in rainfall at a higher (8.6%) number of grid points were found for the sorghum and rice (N) growing seasons. This indicates a significant increase in rainfall in some parts of Nigeria in the beginning of the rainy season. However, the increases in temperatures during the different crop growing seasons have changed the SPEI values at a small number of grid points over Nigeria. The decrease in SPEI values occurred mainly due to the decrease in rainfall. This has only significantly changed droughts with smaller areal extents.
Although the significant changes in SPEI values are visible only at a few grid points, the decreasing tendency of SPEI values was found all over Nigeria for all of the cropping seasons. The trends regarding rising temperatures may cause a continuous decrease in the SPEI values, which would make it significant for most parts of Nigeria. Decreasing SPEI values may affect droughts of all areal extents, and may cause an increase in the occurrence of more severe droughts.
5. Conclusions
The impacts of recent (1961–2010) climate changes on droughts in Nigeria have been assessed in this study. Results revealed that temperatures are increasing all over Nigeria, and rainfall is changing only in some small regions during different crop growing seasons. However, the SPEI values were found to decrease only for droughts covering 1.5–9.2% of the country, which indicates that changes in the climate over the period 1961–2010 had less influence on drought severity in Nigeria. The SPEI value was found to decrease mainly in the region where the rainfall was decreasing, which indicates that rising temperature so far has affected SPEI values at only a few locations. However, there are decreasing tendencies of the SPEI values in many parts of the country due to rising temperatures. This indicates that the continuous increase in temperatures as predicted by global climate models would significantly decrease the SPEI values in most parts of the country in the near future, which would make the droughts with large areal extents more frequent. Recent changes in climate have already increased drought-affected areas during different crop growing seasons. The increases were found to be more prominent for moderate droughts with smaller area extents. Climate change may affect the droughts of all of the areal extents, and may make all severities of droughts more frequent. Due to the unavailability of district or sub-state level crop production time series data, it was not possible to assess the impacts of droughts on crop yield in Nigeria. Such study can be conducted in the future in order to verify the results presented in this study.
Climate change impacts on droughts are not visible in many regions such as Nigeria. The prolonged absence of severe droughts often misleads, as it appears to imply a trend of decreasing droughts frequency in recent years. A detailed analysis has been conducted in this study to assess the impacts of the changing climate on the severity and occurrence of droughts of different areal extents during the growing seasons of crops in Nigeria. The methodology presented in this study can be applied to any other region for the better assessment of changing characteristics of droughts. Global warming-induced changes in climate have caused a sharp rise in natural hazards, including droughts, which in turn has affected the livelihoods of the large portion of the global population that are dependent on agriculture. Understanding the changing characteristics of droughts due to climate change is very important for mitigation and adaptation planning. The methodology proposed in this study can be used for the better assessment of droughts, which in turn can be useful for planning adaptation strategies to climate change and achieving sustainability in agriculture.
Acknowledgments
This study was supported by the Research Program funded by the SeoulTech (Seoul National University of Science and Technology).
Author Contributions
Mohammed Sanusi Shiru conducted the study and made the first draft of the article. Shamsuddin Shahid and Noraliani Alias supervised the study and helped in preparation of first draft of the article, while Eun-Sung Chung prepared the final version of the article.
Conflicts of Interest
The authors declare no conflict of interest.
References
- Dulamsuren, C.; Hauck, M.; Khishigjargal, M.; Leuschner, H.H.; Leuschner, C. Diverging climate trends in Mongolian taiga forests influence growth and regeneration of Larix sibirica. Oecologia 2010, 163, 1091–1102. [Google Scholar] [CrossRef] [PubMed]
- Wang, X.J.; Zhang, J.Y.; Shahid, S.; Amgad, E.; He, R.M. Water resources management strategy for adaptation to droughts in China. Mitig. Adapt. Stratg. Glob. Chang. 2012, 17, 923–937. [Google Scholar] [CrossRef] [Green Version]
- Shahid, S. Rainfall Variability and the Trends of Wet and Dry Periods in Bangladesh. Int. J. Climatol. 2010, 30, 2299–2313. [Google Scholar] [CrossRef]
- Freire-González, J.; Decker, C.; Hall, J.W. The economic impacts of droughts: A framework for analysis. Ecol. Econ. 2017, 132, 196–204. [Google Scholar] [CrossRef]
- National Centers for Environmental Information. Billion-Dollar Weather and Climate Disasters: Table of Events, 2017. Available online: https://www.ncdc.noaa.gov/billions/events/US/1980-2017 (accessed on 16 May 2017).
- Zhang, L.; Xiao, J.; Li, J.; Wang, K.; Lei, L.; Guo, H. The 2010 spring drought reduced primary productivity in Southwestern China. Environ. Res. Lett. 2012, 7, 045706. [Google Scholar] [CrossRef]
- Telesca, L.; Vicente-Serrano, S.M.; López-Moreno, J.I. Power spectral characteristics of drought indices in the Ebro river basin at different temporal scales. Stoch. Environ. Res. Risk Assess. 2013, 27, 1155–1170. [Google Scholar] [CrossRef]
- Liu, Y.; Hwang, Y. Improving drought predictability in Arkansas using the ensemble PDSI forecast technique. Stoch. Environ. Res. Risk Assess. 2015, 29, 79–91. [Google Scholar] [CrossRef]
- Nam, W.-H.; Hayes, M.J.; Svoboda, M.D.; Tadesse, T.; Wilhite, D.A. Drought hazard assessment in the context of climate change for South Korea. Agric. Water Manag. 2015, 160, 106–117. [Google Scholar] [CrossRef]
- Touma, D.; Ashfaq, M.; Nayak, M.A.; Kao, S.-C.; Diffenbaugh, N.S. A multi-model and multi-index evaluation of drought characteristics in the 21st century. J. Hydrol. 2015, 526, 196–207. [Google Scholar] [CrossRef]
- Emergency Events Database (EM-DAT). CRED International Disaster Database 2010; Universite Catholique de Louvain: Brussels, Belgium, 2010. [Google Scholar]
- Dilley, M.; Chen, R.; Deichmann, U.; Lerner-Lam, A.; Arnold, M. Natural Disaster Hotspots: A Global Risk Analysis; Disaster Risk Management Series; World Bank: Washington, DC, USA, 2005. [Google Scholar]
- Abatan, A.A.; Abiodun, B.J.; Lawal, K.A.; Gutowski, W.J. Trends in extreme temperature over Nigeria from percentile-based threshold indices. Int. J. Climatol. 2016, 36, 2527–2540. [Google Scholar] [CrossRef]
- Oguntunde, P.G.; Abiodun, B.J.; Lischeid, G. Rainfall trends in Nigeria, 1901–2000. J. Hydrol. 2011, 411, 207–218. [Google Scholar] [CrossRef]
- Masih, I.; Maskey, S.; Mussá, F.E.F.; Trambauer, P. A review of droughts on the African continent: A geospatial and long-term perspective. Hydrol. Earth Syst. Sci. 2014, 18, 3635–3649. [Google Scholar] [CrossRef]
- Prothero, R.M. Some perspectives on drought in north-west Nigeria. Afr. Aff. 1974, 73, 162–169. [Google Scholar] [CrossRef]
- Sonuga, J.O. Hydrological aspects of the drought event in Nigeria-1972/1973. Hydrol. Sci. J. 1977, 22, 487–502. [Google Scholar] [CrossRef]
- Ayoade, J.O. Perspectives on the recent drought in the Sudano-Sahelian region of West Africa with particular reference to Nigeria. Archiv. Meteorol. Geophys. Bioklimatol. 1977, 25, 67–77. [Google Scholar] [CrossRef]
- Watts, M. Hazards and crises: A political economy of drought and famine in northern Nigeria. Antipode 1983, 15, 24–34. [Google Scholar] [CrossRef]
- Adefolalu, D.O. Further aspects of Sahelian drought as evident from rainfall regime of Nigeria. Arch. Meteorol. Geophys. Bioclimatol. 1986, 36, 277–295. [Google Scholar] [CrossRef]
- Acheampong, P.K. Climatological drought in Nigeria. Geojournal 1990, 20, 209–219. [Google Scholar] [CrossRef]
- Oladipo, E.O. Some aspects of the spatial characteristics of drought in northern Nigeria. Nat. Hazards 1993, 8, 171–188. [Google Scholar] [CrossRef]
- Ashley, J.; Shugaba, M.A. Coping with drought in north eastern Nigeria. Appropr. Technol. 1994, 21, 30–33. [Google Scholar]
- Oladipo, E.O. Some Statistical Characteristics of Drought Area Variations in the Savanna Region of Nigeria. Theor. Climatol. 1995, 50, 147–155. [Google Scholar] [CrossRef]
- Adeyemi, A.S. Spatial Patterns of droughts in south western Nigeria. Malays. J. Trop. Geogr. 1996, 27, 1–10. [Google Scholar]
- Tarhule, A.; Woo, M.-K. Towards an Interpretation of Historical Droughts in Northern Nigeria. Clim. Chang. 1997, 37, 601–616. [Google Scholar] [CrossRef]
- Keylock, C. Towards an Interpretation of historical droughts in Northern Nigeria: A comment on a paper by Aondover Tarhule and Ming-Ko Woo. Clim. Chang. 1999, 41, 259–260. [Google Scholar] [CrossRef]
- Adeaga, O. Management of drought risk in the Sudano-Sahelian region of Nigeria. 2002. In Flow Regimes from International Experimental and Network Data [FRIEND], 2002—Regional Hydrology. Bridging the Gap between Research and Practice, Proceedings of the Fourth International FRIEND Conference, Cape Town, South Africa, 18–22 March 2002; International Association of Hydrological Sciences IAHS Publ.: Oxfordshire, UK, 2002. [Google Scholar]
- Medugu, N.I.; Majid, M.R.; Johar, F. Drought and desertification management in arid and semi-arid zones of Northern Nigeria. Manag. Environ. Qual. Int. J. 2011, 22, 595–611. [Google Scholar] [CrossRef]
- Adeaga, O. Drought risks and impact on water resources in part of northern Nigeria. In Climate and Land Surface Changes in Hydrology, Proceedings of the H01, International Association of Hydrological Sciences[IAHS]-International Association for the Physical Sciences of the Oceans [IAPSO]-International Association of Seismology and Physics of the Earth’s Interior[IASPEI] Assembly, Gothenburg, Sweden, 22–26 July 2013; IAHS Publ.: Oxfordshire, UK, 2013; pp. 124–130. [Google Scholar]
- Usman, M.T.; Abdulkadir, A. Review: An experiment in intra-seasonal agricultural drought monitoring and early warning in the Sudano-Sahelian Belt of Nigeria. Int. J. Climatol. 2014, 34, 2129–2135. [Google Scholar] [CrossRef]
- Okorie, F.C.; Ezedike, E.C.; Nnaji, A.O. Analysis of drought episode in Borno State of North Eastern Nigeria. In Drought: Research and Science-Policy Interfacing; Andreu, J., Solera, A., Paredes-Arquiola, J., Haro-Monteagudo, D., van Lanen, H., Eds.; Taylor and Francis Group: London, UK, 2015. [Google Scholar]
- Adeniyi, M.O.; Uzoma, E.K. Assessment of severity of drought in some northern Nigeria states using Drought Severity Index (DSI5). Ghana J. Sci. Technol. Dev. 2016, 4, 1–10. [Google Scholar]
- Oloruntade, A.J.; Mohammad, T.A.; Ghazali, A.H.; Wayayok, A. Analysis of meteorological and hydrological droughts in the Niger-South Basin, Nigeria. Glob. Planet. Chang. 2017, in press. [Google Scholar] [CrossRef]
- Mishra, V.; Cherkauer, K. Retrospective droughts in the crop growing season: Implications to corn and soybean yield in the Midwestern United States. Agric. For. Meteorol. 2010, 150, 1030–1045. [Google Scholar] [CrossRef]
- Alamgir, M.; Shahid, S.; Hazarika, M.K.; Shamsudin, S. Analysis of meteorological drought pattern during different climatic and cropping seasons in Bangladesh. J. Am. Water Resour. Assoc. 2015, 51, 794–806. [Google Scholar] [CrossRef]
- Ahmed, K.; Shahid, S.; Harun, S.; Wang, X. Characterization of seasonal droughts in Balochistan Province, Pakistan. Stoch. Environ. Res. Risk Assess. 2015, 30, 747–762. [Google Scholar] [CrossRef]
- McKee, T.B.; Doesken, N.J.; Kleist, J. The relationship of drought frequency and duration of time scales. In Proceedings of the Eighth Conference on Applied Climatology, American Meteorological Society, Anaheim, CA, USA, 17–23 January 1993; pp. 179–186. [Google Scholar]
- Vicente-Serrano, S.M.; Beguería, S.; López-Moreno, J.I. A multiscalar drought index sensitive to global warming: The standardized precipitation evapotranspiration index. J. Clim. 2010, 23, 1696–1718. [Google Scholar] [CrossRef]
- Homdee, T.; Pongput, K.; Kanae, S. A comparative performance analysis of three standardized climatic drought indices in the Chi River basin, Thailand. Agric. Nat. Resour. 2016, 50, 211–219. [Google Scholar] [CrossRef]
- Tian, L.; Yuan, S.; Quiring, S.M. Evaluation of six indices for monitoring agricultural drought in the southcentral United States. Agric. For. Meteorol. 2018, 249, 107–119. [Google Scholar] [CrossRef]
- Beguería, S.; Vicente-Serrano, S.M.; Reig, F.; Latorre, B. Standardized precipitation evapotranspiration index (SPEI) revisited: Parameter fitting, evapotranspiration models, tools, datasets and drought monitoring. Int. J. Climatol. 2014, 34, 3001–3023. [Google Scholar] [CrossRef]
- Mohsenipour, M.; Shahid, S.; Chung, E.-S.; Wang, X.-J. Changing Pattern of Droughts during Cropping Seasons of Bangladesh. Water Resour. Manag. 2018, 32, 1555–1568. [Google Scholar] [CrossRef]
- Yang, H.; Wang, H.; Fu, G.; Yan, H.; Zhao, P.; Ma, M. A modified soil water deficit index (MSWDI) for agricultural drought monitoring: Case study of Songnen Plain, China. Agric. Water Manag. 2017, 194, 125–138. [Google Scholar] [CrossRef]
- Tian, Y.; Xu, Y.-P.; Wang, G. Agricultural drought prediction using climate indices based on Support Vector Regression in Xiangjiang River basin. Sci. Total Environ. 2018, 622–623, 710–720. [Google Scholar] [CrossRef] [PubMed]
- Prabnakorn, S.; Maskey, S.; Suryadi, F.X.; Fraiture, C. Rice yield in response to climate trends and drought index in the Mun River Basin, Thailand. Sci. Total Environ. 2018, 621, 108–119. [Google Scholar] [CrossRef] [PubMed]
- World Bank Group. Agriculture, Value Added (% of GDP). Available online: http://data.worldbank.org/indicator/NV.AGR.TOTL.ZS (accessed on 11 March 2018).
- National Bureau of Statistics. Annual Abstract of Statistics, 2010; National Bureau of Statistics: Abuja, Nigeria, 2010.
- Tukimat, N.N.A.; Harun, S.; Shahid, S. Comparison of different methods in estimating potential évapotranspiration at Muda Irrigation Scheme of Malaysia. J. Agric. Rural Dev. Trop. Subtrop. 2012, 113, 77–85. [Google Scholar]
- Stagge, J.H.; Tallaksen, L.M.; Xu, C.-Y.; Van Lanen, H.A.J. Standardized precipitation-evapotranspiration index (SPEI): Sensitivity to potential evapotranspiration model and parameters. In Hydrology in a Changing World: Environmental and Human Dimensions, Proceedings of the Flow Regimes from International Experimental and Network Data [FRIEND]-Water 2014, Montpellier, France, 7–10 October 2014; International Association of Hydrological Sciences [IAHS] Publ.: Oxfordshire, UK, 2014. [Google Scholar]
- Kendall, M.G. Rank Correlation Methods; Charles Griffin Book Series; E. Arnold: London, UK, 1975. [Google Scholar]
- Ford, T.; Labosier, C.F. Spatial patterns of drought persistence in the Southeastern United States. Int. J. Climatol. 2013, 34, 2229–2240. [Google Scholar] [CrossRef]
Figure 1.
The topography and climatic zones of Nigeria.

Figure 2.
Calendar for selected crops of Nigeria. N: north; S: south.

Figure 3.
Spatial distributions of different severities of droughts for crops (a) yam; (b) rice (N); (c) corn (N); (d) sorghum; and (e) millet for selected years. The SPEI values between −1.0 to −1.5 indicate a moderate drought, −1.5 to −2.0 indicate a severe drought, and less than −2.0 indicate an extreme drought.

Figure 4.
Time series of the drought-affected areas (%) during the cropping seasons of (a) yam; (b) rice (N); (c) rice (S); (d) corn (N); (e) corn (S); (f) sorghum; and (g) millet.
Figure 4.
Time series of the drought-affected areas (%) during the cropping seasons of (a) yam; (b) rice (N); (c) rice (S); (d) corn (N); (e) corn (S); (f) sorghum; and (g) millet.

Figure 5.
(a) Trends in moderate yam droughts that affected at least 10% of the area of Nigeria; (b) changes in the probability of occurrence of moderate yam droughts having different areal thresholds. The red segment represents significant change.
Figure 5.
(a) Trends in moderate yam droughts that affected at least 10% of the area of Nigeria; (b) changes in the probability of occurrence of moderate yam droughts having different areal thresholds. The red segment represents significant change.

Figure 6.
The areal extents of different categories of droughts during different crop growing seasons with a significant increase in occurrence over the period 1961–2010.
Figure 6.
The areal extents of different categories of droughts during different crop growing seasons with a significant increase in occurrence over the period 1961–2010.

Figure 7.
Trends in (a) total rainfall; (b) mean temperature; and (c) SPEI values during the yam growing season of Nigeria.
Figure 7.
Trends in (a) total rainfall; (b) mean temperature; and (c) SPEI values during the yam growing season of Nigeria.


Table 1.
The periods used for the calculation of the standardized precipitation evapotranspiration index (SPEI) values in order to estimate droughts during different crop growing seasons.
Table 1.
The periods used for the calculation of the standardized precipitation evapotranspiration index (SPEI) values in order to estimate droughts during different crop growing seasons.
| Crop | Season | Period (Month) |
|---|---|---|
| Corn (S) | March–May | 3 |
| Corn (N) | May–July | 3 |
| Millet | June–August | 3 |
| Rice (N) | June–October | 5 |
| Rice (S) | April–July | 4 |
| Sorghum | May–August | 4 |
| Yam | February–September | 8 |
Table 2.
Trends in affected area by various severities of droughts during different crop growing seasons. The bold numbers in the table indicate a significant change at a 95% level of confidence.
Table 2.
Trends in affected area by various severities of droughts during different crop growing seasons. The bold numbers in the table indicate a significant change at a 95% level of confidence.
| Crop | Change in Drought-Affected Area (km2/decade) | ||
|---|---|---|---|
| Moderate | Severe | Extreme | |
| Yam | 10.38 | 2.78 | 1.65 |
| Rice (N) | 5.88 | 2.22 | 2.07 |
| Rice (S) | 0.76 | 1.62 | 0.90 |
| Corn (N) | 3.70 | 2.72 | 1.39 |
| Corn (S) | 0.68 | 0.68 | 0.28 |
| Sorghum | 5.45 | 4.11 | 1.83 |
| Millet | 7.50 | 3.33 | 3.33 |
Table 3.
Percentage of grid points where total rainfall is decreasing, and daily mean temperature and SPEI values are increasing significantly at a 95% level of confidence during different crop growing seasons.
Table 3.
Percentage of grid points where total rainfall is decreasing, and daily mean temperature and SPEI values are increasing significantly at a 95% level of confidence during different crop growing seasons.
| Cropping Season | Rainfall | Temperature | SPEI |
|---|---|---|---|
| Yam | 3.4 | 100.0 | 3.7 |
| Rice (N) | 8.6 | 100.0 | 9.2 |
| Rice (S) | 4.9 | 100.0 | 4.0 |
| Corn (N) | 1.5 | 100.0 | 1.5 |
| Corn (S) | 2.8 | 100.0 | 4.0 |
| Sorghum | 8.6 | 100.0 | 1.5 |
| Millet | 3.4 | 100.0 | 2.8 |
© 2018 by the authors. Licensee MDPI, Basel, Switzerland. This article is an open access article distributed under the terms and conditions of the Creative Commons Attribution (CC BY) license (http://creativecommons.org/licenses/by/4.0/).
Share and Cite
MDPI and ACS Style
Shiru, M.S.; Shahid, S.; Alias, N.; Chung, E.-S. Trend Analysis of Droughts during Crop Growing Seasons of Nigeria. Sustainability 2018, 10, 871. https://0-doi-org.brum.beds.ac.uk/10.3390/su10030871
AMA Style
Shiru MS, Shahid S, Alias N, Chung E-S. Trend Analysis of Droughts during Crop Growing Seasons of Nigeria. Sustainability. 2018; 10(3):871. https://0-doi-org.brum.beds.ac.uk/10.3390/su10030871
Chicago/Turabian StyleShiru, Mohammed Sanusi, Shamsuddin Shahid, Noraliani Alias, and Eun-Sung Chung. 2018. "Trend Analysis of Droughts during Crop Growing Seasons of Nigeria" Sustainability 10, no. 3: 871. https://0-doi-org.brum.beds.ac.uk/10.3390/su10030871
Note that from the first issue of 2016, this journal uses article numbers instead of page numbers. See further details here.