Article

Landscape Greening Policies-based Land Use/Land Cover Simulation for Beijing and Islamabad—An Implication of Sustainable Urban Ecosystems

1
University of Chinese Academy of Sciences (UCAS), Beijing 101408, China
2
Division of Environmental Health, State Key Laboratory, Institute of Remote Sensing and Digital Earth (RADI), Beijing 100101, China
3
Institute of Geographical Information Systems, National University of Sciences and Technology (NUST), Islamabad 44000, Pakistan
4
Institute of Geographic Sciences and Natural Resources (IGNRR), Beijing 100101, China
*
Author to whom correspondence should be addressed.
Sustainability 2018, 10(4), 1049; https://0-doi-org.brum.beds.ac.uk/10.3390/su10041049
Submission received: 22 February 2018 / Revised: 23 March 2018 / Accepted: 28 March 2018 / Published: 2 April 2018
(This article belongs to the Special Issue Sustainable Land Uses and Rural Governance)

Abstract

:
City green infrastructure (CGI) makes cities more resilient and sustainable, as required by the United Nations’ (UN) Sustainable Development Goal 11–Sustainable Cities and Communities. Based on the CGI policies of Beijing, land use/land cover (LULC) changes of two Asian capitals, Beijing, China and Islamabad, Pakistan, are simulated. LULC maps for 2010 and 2015 are developed by applying object-based image analysis (OBIA) to Landsat imagery. Dynamics of land system (DLS) model was used to simulate the LULC changes for 2020 and 2025 under three scenarios: (1) business-as-usual (BAU); (2) urban green space work plan (UGWP); and (3) landscape and greening policies (LGP). Results reveal that DLS is efficient than other simulation models. The BAU scenario predicts an overall expansion in Beijing’s greenery, while Islamabad will encounter a decline by 7.3 km2 per year. Under the UGWP scenario, urban green spaces and other vegetation area of Beijing will expand by 7.6 km2, while, for Islamabad, vegetation degradation rate will slow down to 6.9 km2 per year. The LGP scenario envisage a massive increase of 23.5 km2 per year in green resources of Beijing and Islamabad’s green land loss rate will further slowdown to 6.1 km2 per year. It is inferred from the results that vegetation degradation in Islamabad need to lessen by implementing LGP policy after basic amendments according to the local conditions and available resources.

1. Introduction

Half of humanity (3.5 billion people) are living in cities, and by 2030 almost 60% of the world’s population will live in urban areas. Rapid urbanization is exerting pressure on fresh water supplies, sewage, living environment and public health. To end poverty, protect the planet and ensure prosperity for all, the United Nations set 17 Sustainable Development Goals (SDGs) on 25 September 2015. Goal 11 of the SDGs is “Sustainable Cities and Communities”; to make cities inclusive, safe, resilient and sustainable [1].
Both land use and land cover (LULC) are basic components of environmental changes around the globe. It directly influences human society, ecology and Earth’s climate [2]. Land cover describes a physical cover on the surface of the Earth, while land use defines its function [3]. Human activities have been the leading force in shaping LULC during recent years [4], although, their affects fluctuate spatially and temporally [5]. In cities, the major driver of LULC change is urbanization. The critical process of rapid urbanization is transforming the natural vegetation of cities into residential and industrial land that leads to serious environmental and ecological problems [6,7]; such as urban heat islands (UHI) [8,9,10], air pollution [11,12,13] and biodiversity loss [14,15]. Vegetation plays a vital role in urban regions from different prospects, i.e., maintaining ecological balance, protecting biodiversity, alleviating thermal impacts and improving quality of living conditions [16,17,18,19,20,21,22,23,24,25,26].
The ecosystem services of urban vegetation provide foster resilience in cities [27] and helps to improve ecoenvironmental conditions, thus provides a good quality of living conditions with ecologically sound environment and fresh air. Urban vegetation also assists in reducing thermal impacts and environmental pressure by producing urban cool islands (UCI) [28,29]. It cools the microclimates through the process of evapotranspiration, photosynthesis and shading [30,31,32], hence improves inhabitant’s health and well-being [29,33,34]. An ample number of studies have been done on the role of urban vegetation in mitigation of urban thermal impacts [28,32,35,36,37,38,39].
In recent times, increasing trends of urbanization, socioeconomic consequences, inappropriate land use policies and lack of landscape management practices in megacities are reducing natural urban greenery at a rapid rate [40]. Besides, it is less likely to expand urban green areas, because urban expansion in megacities consumes their physical space [41]. Consequently, these natural ecological treasures may be protected by appropriate landscape greening policies and management. Urban vegetation such as grasslands, forests, open parks and other types of green land have been recognized as an important component of landscape planning [22,30,35,42].
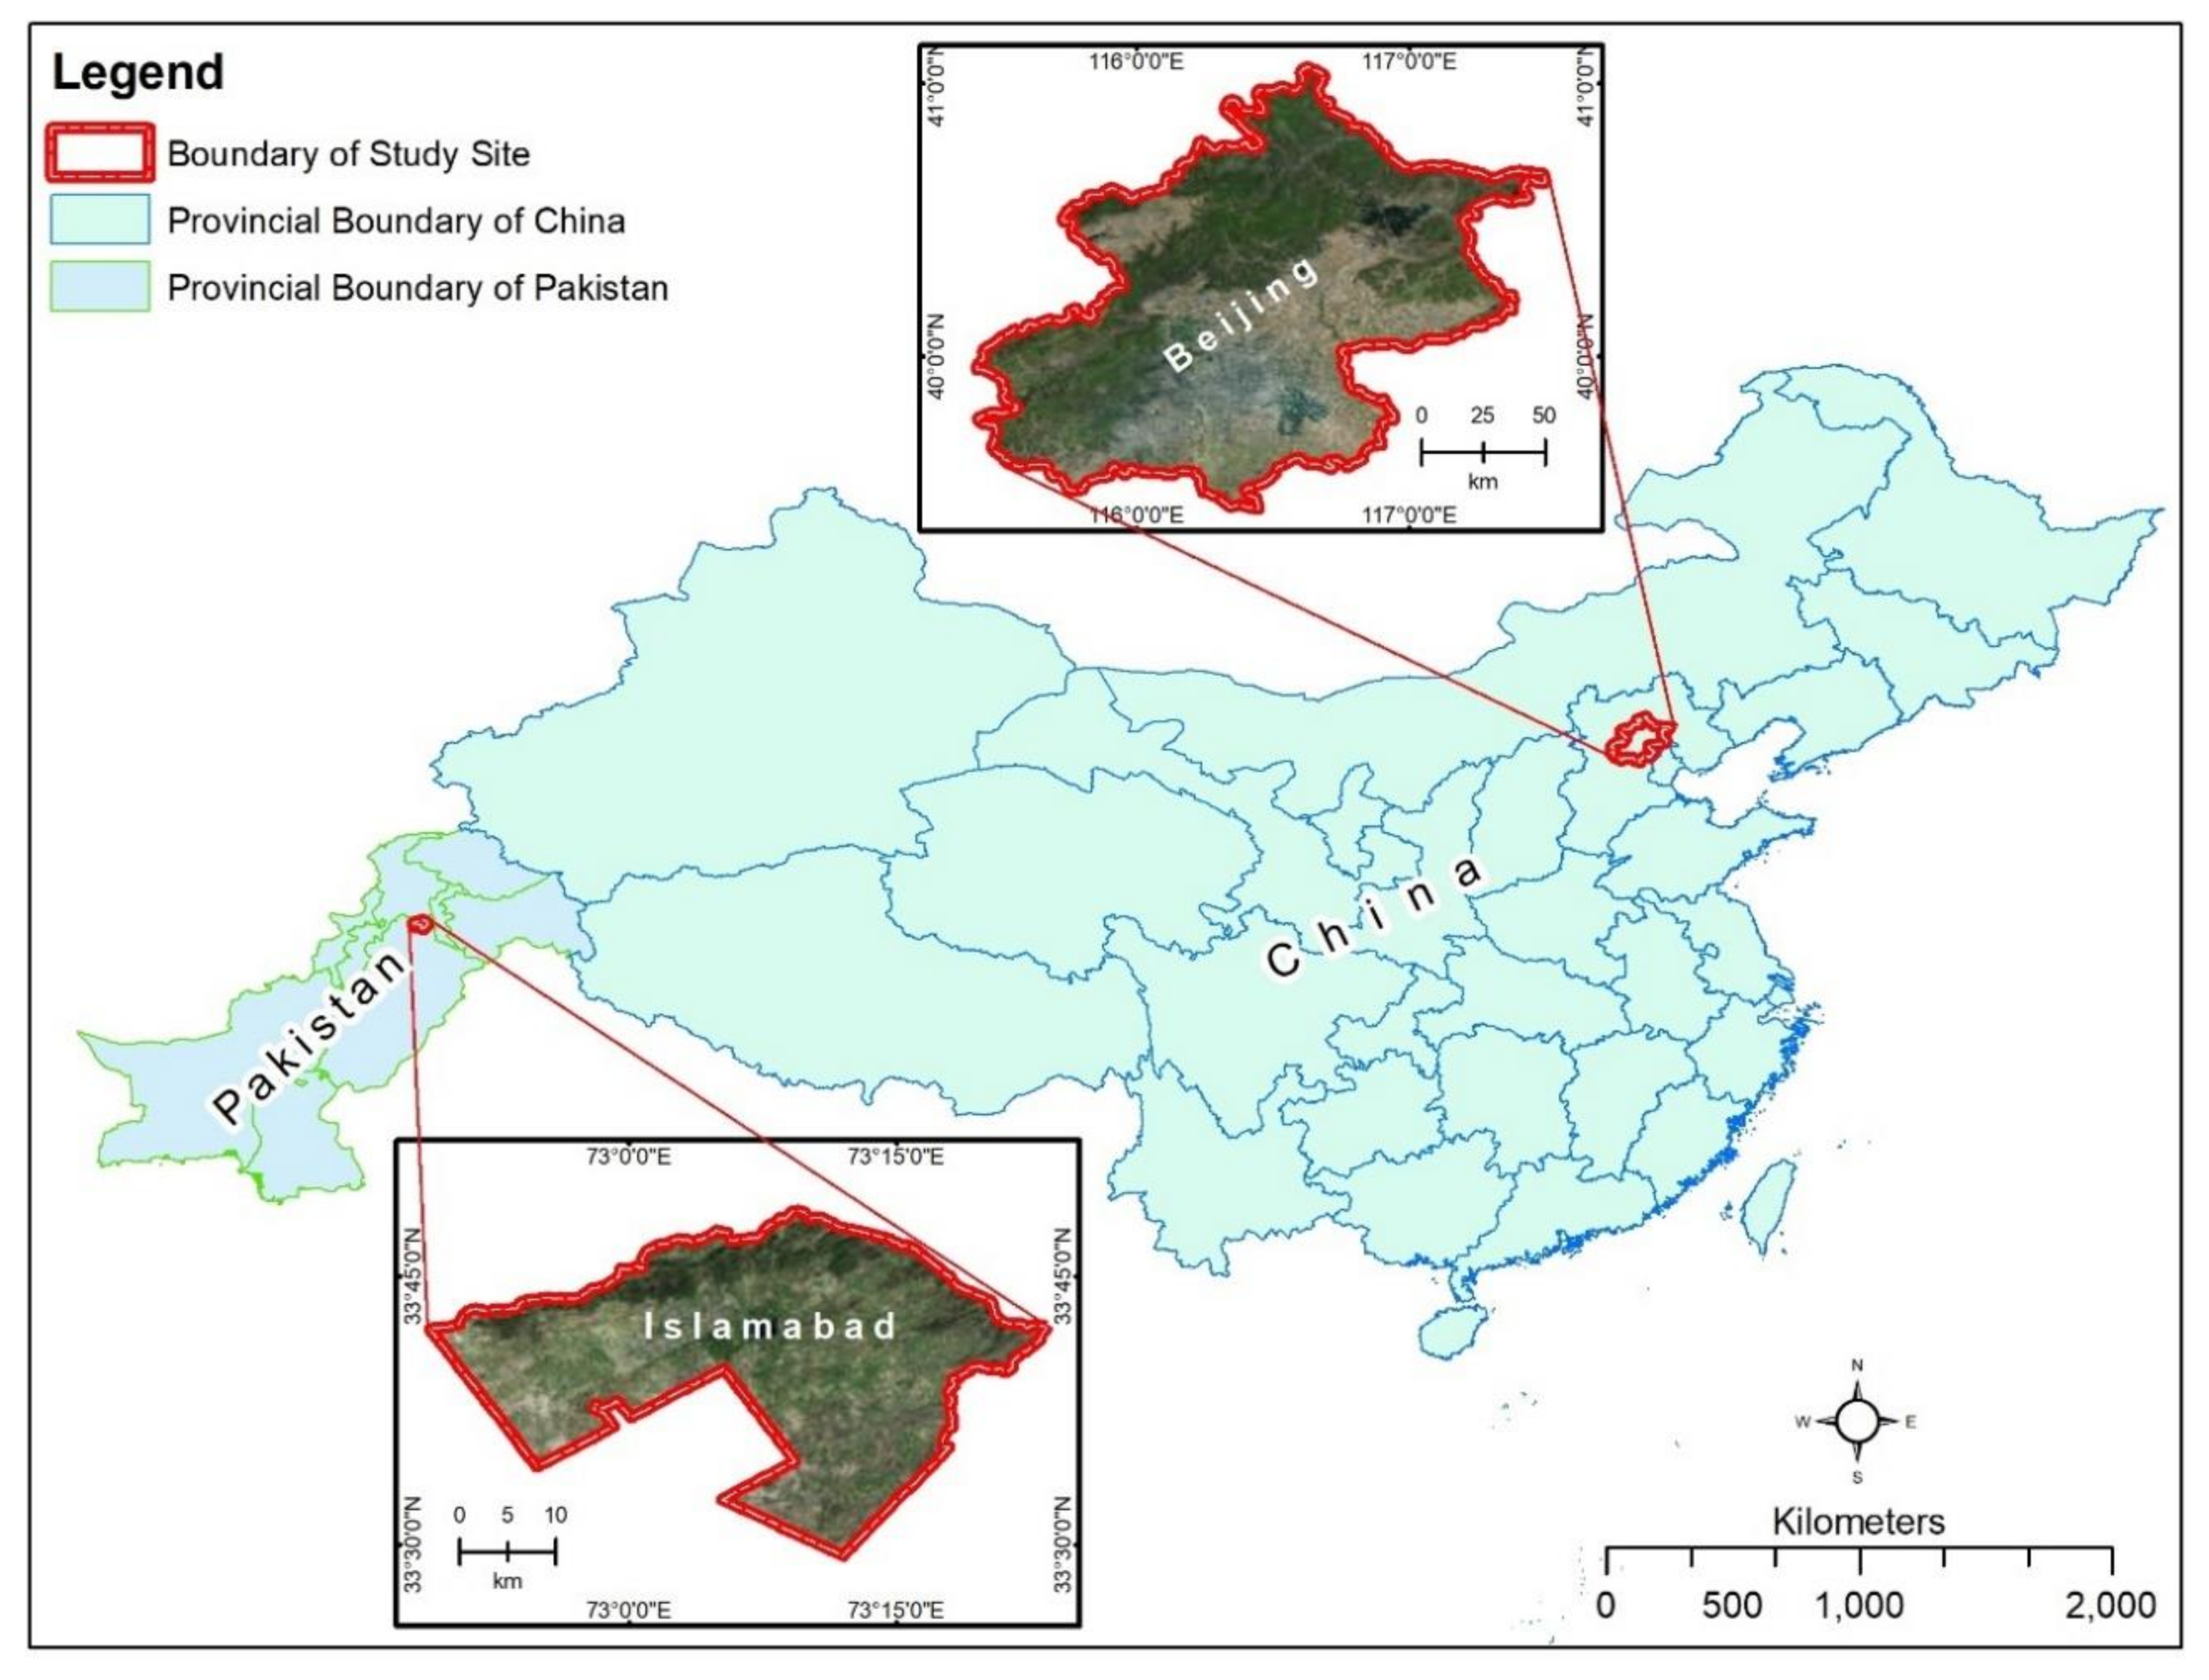
Though Beijing and Islamabad are two distinct cities, they possess many characteristics which express similitude. Both Islamabad and Beijing have matching landscapes: Beijing is surrounded by mountains from three sides i.e., north, northwest and west, while the Margalla Hills fringe the north and northeast of Islamabad (see Figure 1). Both are low altitude cities, and have a big difference in terms of the respective elevation of urban and rural areas. Both cities have comparable humid conditions, Islamabad having relative humidity of 61% and Beijing having 56.8%. Despite all above-mentioned resemblances, population density and city sizes of these capitals are very different. Beijing, being an old capital, has encountered extensive infrastructural developments, thus brought economic revolution coupled with atmospheric pollution and climate degradation. The idea of urban green policies of Beijing is quite fresh as compared to the historic nature of the city. Islamabad, the capital of Pakistan, is in its inception stage in comparison with Beijing. It can be foreseen that Islamabad will experience huge influx of population just like Beijing, bringing challenges for sustainable ecosystem of Islamabad. It can, therefore, implied that Islamabad also needs urban green policies. Government of Beijing has formulated some urban green policies, which are already in the implementation phase.
Several studies have already been conducted on Beijing’s landscape greening policies using remotely sensed data. Some investigations have forecasted the effectiveness of Beijing’s greening policies by various modelling techniques [43,44]. For example, Li et al., (2016) [43] simulated the green space policies of Beijing for 2025; predicting a significant increase in green area, though still wouldn’t be sufficient to cater the need of the city. Authors have deduced that only landscape and greening policy (LGP) [45] of Beijing can approach the state of base year (2000) in 2025 Islamabad. In the absence of any greening policy, deforestation of Islamabad will be much higher than that of Beijing.
The population of Beijing is 21 million as of 2015, and its gross domestic product (GDP) has crossed the target of 7% [46,47]. This rapid economic growth has put enormous pressure on natural resources and the microclimate of Beijing, resulting in different environmental issues and reduced urban green spaces. Dynamic development of green spaces is noticed in Beijing’s downtown [41]. Islamabad, in comparison, has lower economic growth and urbanization; accordingly, overall ecoenvironmental conditions of Islamabad are better than Beijing [48]. However, a high deforestation rate, lack of landscape greening policies, and encroachments of forested area are deteriorating the environmental conditions of Islamabad [49].
A huge challenge for the megacities is to achieve United Nations’ sustainable development goals (SDGs) by balancing the requirements of environment, social economy and green patches. The government of Beijing has developed different landscape greening policies like the “Urban Greenspace Work Plan (UGWP)” [50] and the “Landscape Greening Plan (LGP)” [45], which are now in implementation phase. Notwithstanding that the green space ratio and the total vegetation area of Beijing has increased significantly, still it failed to meet the requirements of city dwellers. Hence, it is inevitable to investigate the effectiveness of these policies. As far as deforestation in Islamabad is concerned, it is alarmingly high [51], with no landscape greening policy in effect to compensate this loss. If the current situation persists, it will impose serious ecoenvironmental issues to Islamabad.
The current study, based on various scenarios, forecast green areas of Beijing and Islamabad for year 2020 and 2025. Considerable attempts have been made by researchers to simulate or forecast through modeling; including the GEOMOD2 model [52], cellular automata [53] and land transformation model [54]. However, these models have spatially complex systems for simulation. Other forecasting methods, such as fuzzy comprehensive evaluation [55], system cluster analysis [56] and principal component analysis [
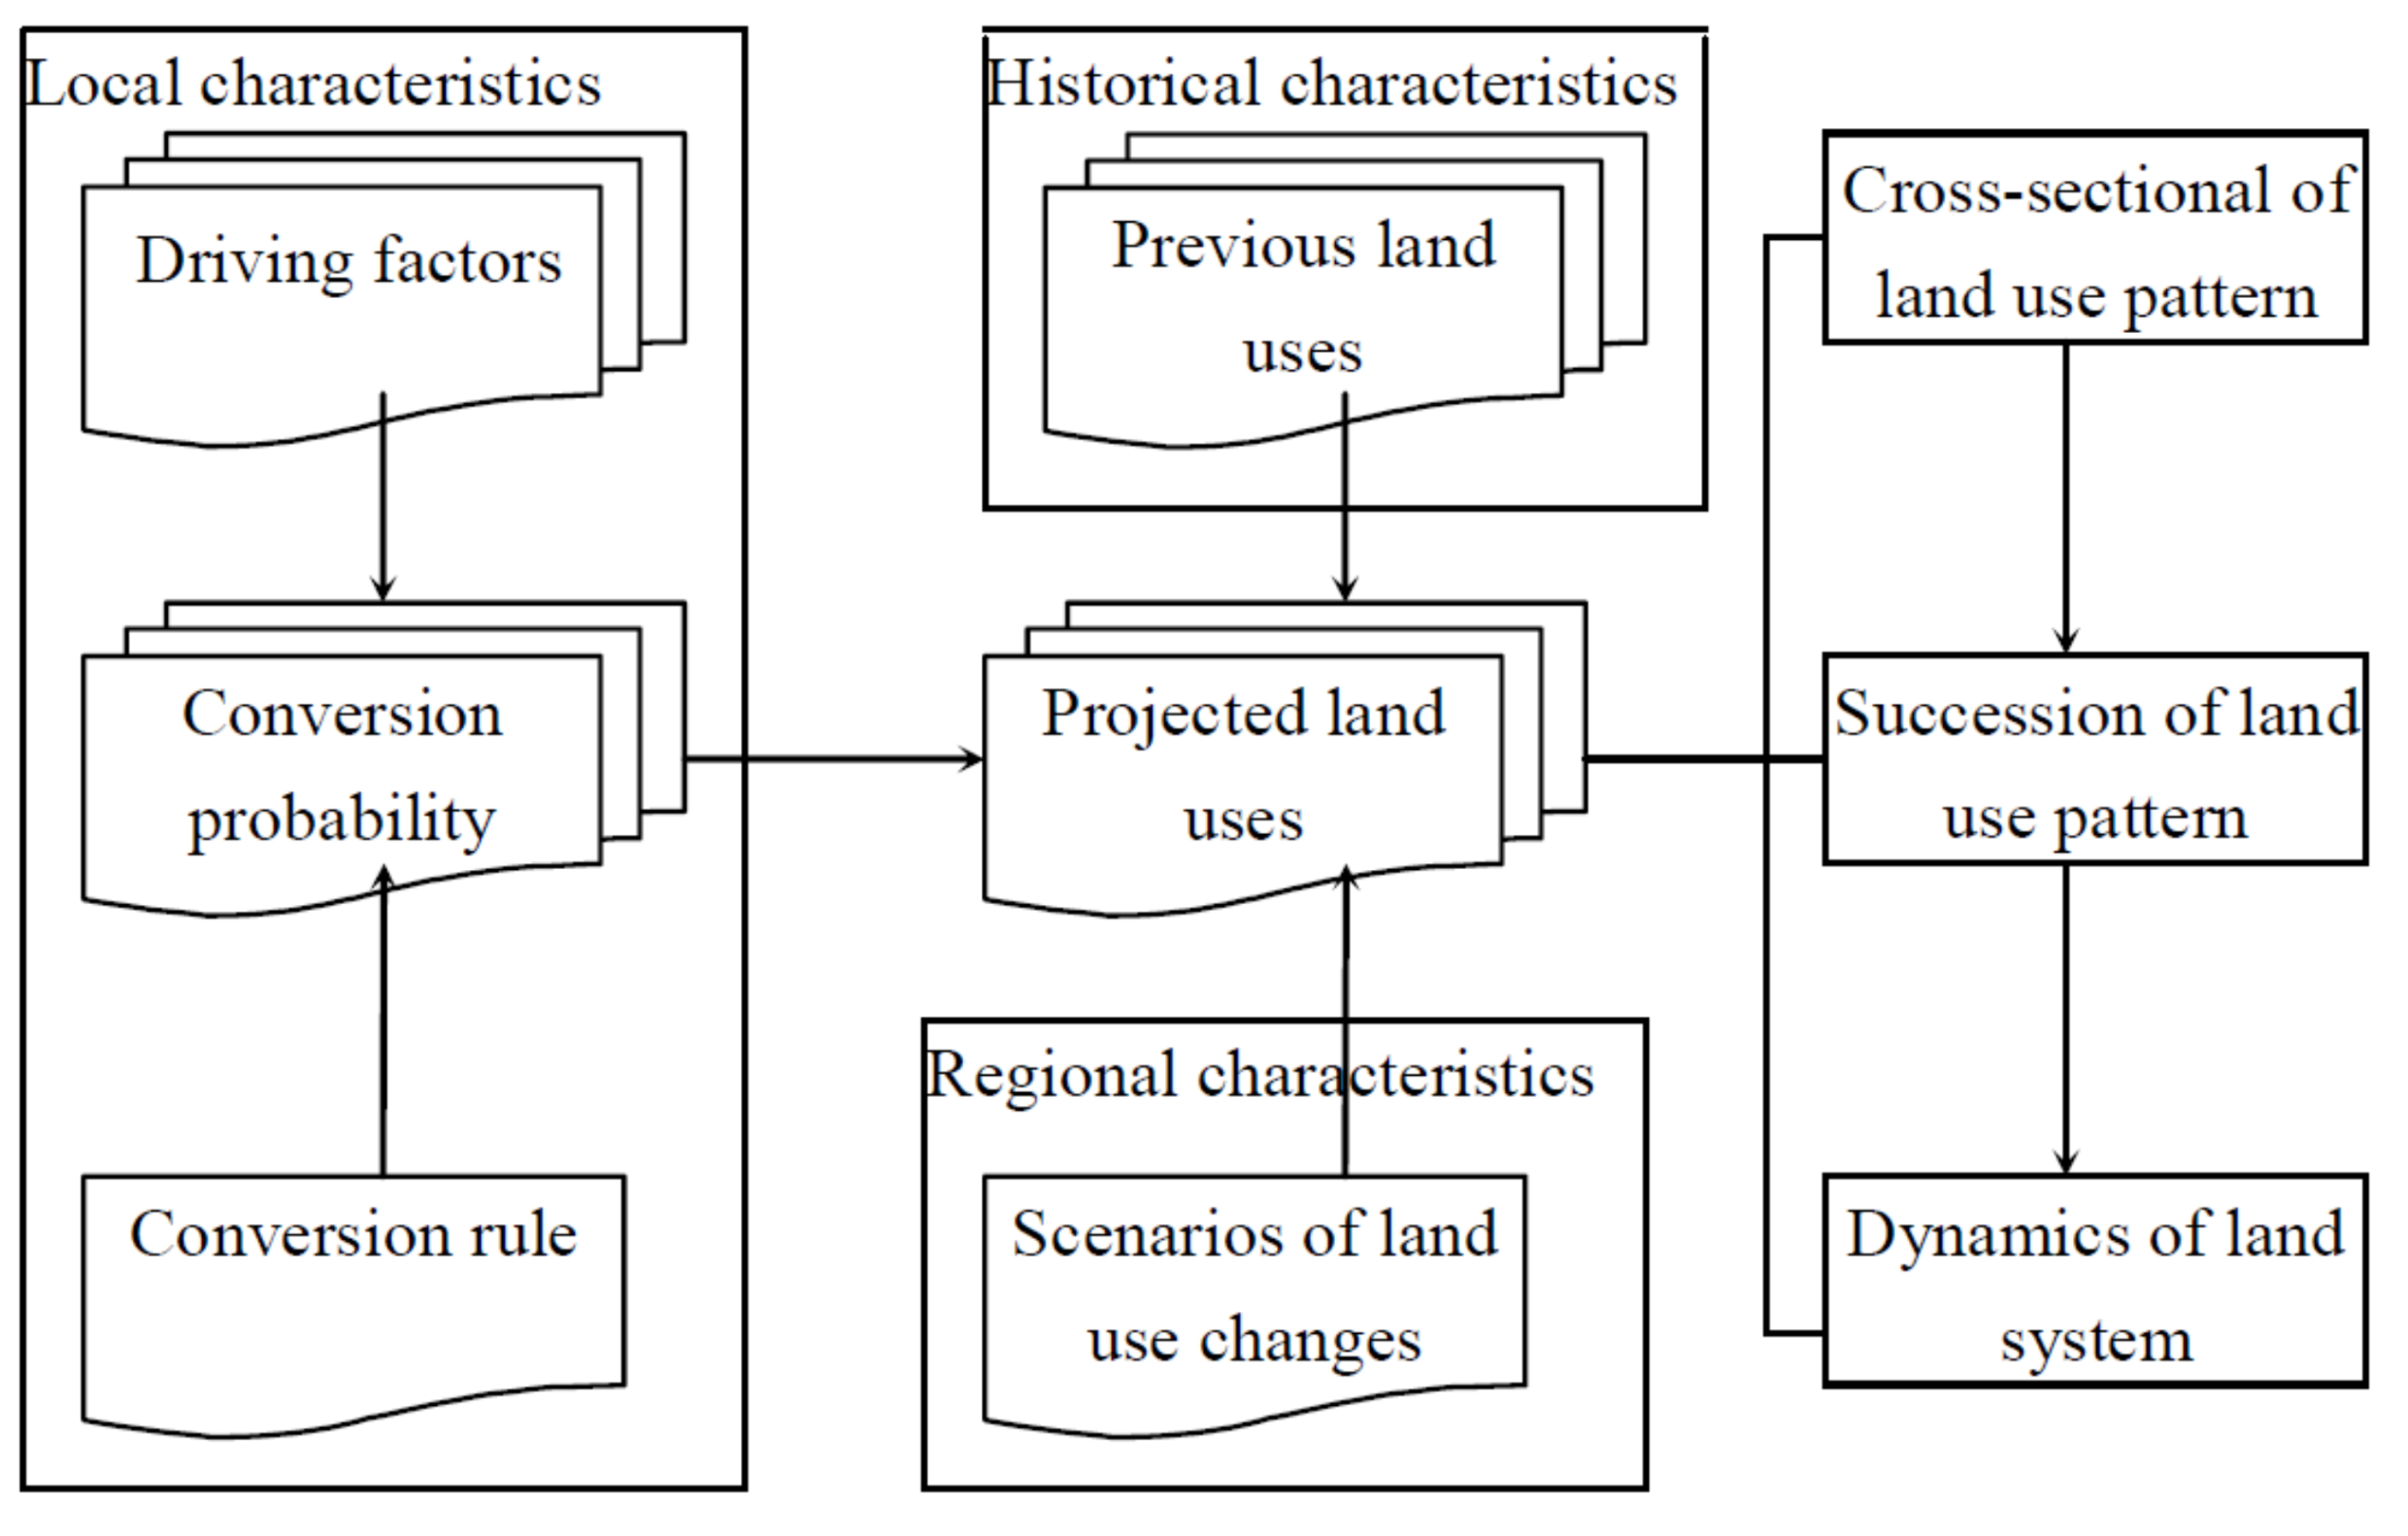
57], can forecast static changes but doesn’t fit for the simulation of a dynamic system. To overcome the above-mentioned limitations, the dynamics of land system (DLS) model was applied to simulate the land cover and land use changes of Beijing and Islamabad for 2020 and 2025. DLS, developed by Deng et al. [58], has capability to overcome some of the problems present in already tested simulation models. Two special features of DLS that discriminate it from other simulation models, are: (1) it analyzes land demand scenarios at a regional level and performs spatial allocation at a pixel level; (2) it utilizes spatial regressions between LULC classes and influential factors. For instance, in the cellular automat model, the transition rules are developed based on an expert’s experience and knowledge and does not count the relationship of historic land covers, which can affect the simulated results [53,59]. The prominent features of DLS are discussed in Section 2.7.
The current study is carried out in two Asian capitals: Islamabad of Pakistan and Beijing of China. Beijing is a megacity and expanding rapidly as compared to Islamabad. Recently, Beijing has been under enormous environmental problems including, air pollution, urban heat island (UHI) and dust storms. To reduce the environmental pressure, Beijing’s government has developed and implemented several landscape greening policies. Islamabad, in comparison to Beijing, is a small city. Though ecoenvironmental conditions of Islamabad are better than Beijing, vegetation degradation is much higher than Beijing. Furthermore, no landscape greening policy has been developed so far to compensate for the vegetation loss. Being a capital city, Islamabad is expanding rapidly and can face similar environmental issues like Beijing. The primary object of this paper is to simulate LULC changes based on Beijing’s landscape greening policies, and investigate which greening policy of Beijing is most suitable for Islamabad. Secondly, to investigate the effectiveness of Beijing’s greening policies by 2025, if the same policies continue after 2020. Our study attempted to forecast the LULC changes based on three scenarios i.e., BAU, UGWP and LGP. BAU was selected particularly for Islamabad to highlight the future situation of the city’s landscape, if government of Pakistan wouldn’t design any greening policy. The UGWP and LGP scenarios are based on two policies developed by the government of China for Beijing. The results of this study will help the land use planners and policy makers to design appropriate city layouts in future.

2. Materials and Methods

2.1. Study Area

Two Asian capitals, Beijing and Islamabad, were selected for this study (see Figure 1). Beijing is the capital city of China and Islamabad is the capital city of Pakistan. Beijing’s green space policies were taken as a model to forecast the greening status of Islamabad, as Islamabad doesn’t have any greening policy. Beijing’s greenspace policies can help to design a suitable policy for Islamabad after modifications.
Beijing is located at 39°26′ N–41°30′ N latitude and 115°25′ E–117°30′ E longitude. Its elevation ranges 50–2500 m and the total area is 16,412 km2. Beijing is basically divided into fourteen administrative units (districts) [45] (Figure 1). The process of rapid urbanization of Beijing is a serious threat for natural resources of the city. Beijing’s permanent population in 2015 was reported to be 21.7 million and the GDP growth rate crossed 7% [46].
Beijing’s government has designed several landscape greening policies for the city. After the Olympics bid in 2001–2002, Beijing has been concentrating on increasing the urban vegetation area to improve the quality of living conditions. For example, the UGWP [50] and LGP [45] indicate that Beijing’s government is fully aware of environmental issues of Beijing and is taking informed decisions.
Islamabad is located at 33°28′1″ N–33°48′36″ N latitude and 72°48′36″ E–73°24′ E longitude. The elevation of Islamabad varies from 400–700 m. The northern side of the city is flanked by the famous Margalla Hills (see Figure 1). The total area of Islamabad is approximately 906 km2. The city is divided into five administrative zones. Islamabad contributes almost 1% of the national economy and its total population was reported about 1.8 million in 2015 [60]. The climate of Islamabad is humid subtropical with four seasons: spring, autumn, summer and winter.
Urban expansion in Islamabad is also a serious threat for natural resources. As the vegetation cover of the city is being replaced by construction land with time. No greening policy has yet designed to overcome this loss. Even though overall environmental condition of the city seems better than Beijing; being a capital rapid expansion is foreseen which will affect the quality of living conditions [48]. A landscape greening policy is inevitable to compensate the vegetation loss consequent to rapid urbanization.

2.2. Satellite Data

The satellite imagery of Landsat-8 (OLI) and Landsat-5 (TM) were acquired for land cover mapping of Beijing and Islamabad. Land covers of 2010 were developed using Landsat-5 (TM) data whereas, Landsat-8 (OLI) data was used for the land cover classification of 2015 for both cities. To minimize the effects due to the incoming solar radiation angle (shadow problem), and phenological differences, satellite data was downloaded (https://earthexplorer.usgs.gov/) for the months of September, while cloud-cover gaps were covered using satellite data for month of October. Satellite data was preprocessed prior to land cover classification. Standard preprocessing steps were followed including atmospheric corrections, image enhancement, area of interest (AoI) truncation and layer stacking. Specifications of satellite data are given in Table 1.

2.3. Landcover Classification

LULC maps were developed by applying object-based image analysis (OBIA). Definiens Developer, a commercial software [61], was used for object-based classification. The OBIA technique has been broadly applied for more than a decade. Initially, it has been used for high resolution (HR) satellite datasets, but is now being used to classify medium resolution data. The key OBIA advantages are noise reduction and time savings [62]. The OBIA approach uses image objects for classification unlike a pixel-based approach, which incorporates individual pixels for image analysis.
Image objects are generated by the process of image segmentation. The segmentation process is handled by different homogeneity criteria including compactness, shape and layer weight [63]. For this study, image objects were classified based on their shape, geometry and texture [63]. Different indices, including the normalized difference vegetation index (NDVI), the normalized difference water index (NDWI) and normalized difference built-up area index (NDBI), were also incorporated to get maximum possible accuracy. Urban green spaces were extracted by manual editing. The LULC maps are shown in Figure 2. Initially, satellite images were classified in to eight classes (forest, shrubs and grasses, urban green spaces, dense built-up area, sparse built-up area, agriculture, water bodies and bare area). To meet the requirements of DLS model, the shrubs and grasses class was merged with forest class while sparse built-up area class was merged with dense built-up area class (see Table 2). Final LULC maps were simulated based on six classes (see Figure 2). The accuracy assessment was done by selecting some randomly sampled points of homogeneous areas for all land cover classes. All the sample points were selected from centers of the segments. As a final step, sample points were visually verified from high resolution Google Earth images [63,64]. Kappa coefficients for LULC of Beijing was 84% for year 2010 and 87% for year 2015 (see Table 3), and for Islamabad, the Kappa coefficient was 86% for year 2010 and 85% for year 2015 (see Table 4).

2.4. Drivers of LULC Changes

Several factors can potentially influence LULC dynamics [65]. The influential factor of four categories (climatic, geophysical, socioeconomic and proximity) were selected for this study. Overall, 12 factors that can influence the LULC changes, particularly vegetation classes, were selected for this study. These factors have generally been considered as forecasters of LULC distributions. The predictors used in simulation for this study are listed in Table 5.
Data for driving factors was collected from diverse sources (see Table 5). The Kriging algorithm was used to interpolate precipitation and temperature [59,72]. The LST was calculated from Landsat-8 and Landsat-5 using split-window algorithms. Slope was calculated from digital elevation model (DEM) that covers both cities. The proximity variables were calculated using ArcGIS 10.1 software. Entire data was resampled according to LULC maps. Finally, logistic regressions were calculated to explore the statistical relationship of LULC types with influential factors using STATA (v12) software. Regression results were then used in DLS model for simulation.

2.5. Spatial Allocation of Landcover Changes

Decision rules were defined for spatial allocation based on 2010 and 2015 LULC changes. Spatial allocation rules were used as a part of simulation inputs; necessary for DLS model. Decision rules values range from 0 to 1. The higher the decision rule value, the lesser the probability of a LULC class to be changed to another class and vice versa. The transition matrices shown in Table 6 and Table 7 indicate the probability of conversion of one LULC class to another, which depends on transitions calculated from the LULC changes of 2010 and 2015 [73]. The transition matrices defined the rules of allocation of one LULC class to anothe for simulation of 2020 and 2025.

2.6. Scenarios Development

The government of China has developed numerous green space policies to tackle Beijing’s environmental problems. Unlike Beijing, Islamabad has not even a single urban landscape greening policy to compete future environmental threats. To anticipate environmental condition in 2020 and 2025, three scenarios were tested both for Islamabad and Beijing. Two scenarios: UGWP [50] and LGP [45], are designed by the government of Beijing, while third scenario, BAU, reflects the simulation of current situation. All three scenarios are discussed below:

2.6.1. Business-As-Usual (BAU)

This scenario reflects the situation of LULC in 2020 and 2025 in the absence of any comprehensive plan or policy. LULC maps were simulated based on changes for a five-year period i.e., 2010–2015. This scenario was formulated particularly for Islamabad to draw attention of policy makers towards the near-future environmental hazards, which would only be mitigated through suitable greening policies.

2.6.2. Landscape and Greening Plan (LGP)

The “13th Five-Year” Landscape and Greening Plan for Beijing [44] reflects a comprehensive increase in greening resources. According to LGP, a 2300-hectare (ha) (23 km2) urban green space area of Beijing will be increased from 2016–2020, while 200,000 (133.3 km2, as 1 mu = 666.67 m2) barren land will be afforested. For simulation, 23 km2 urban green space area and 133.3 km2 mixed vegetation area was added; replacing the built-up area and barren land, respectively, for Beijing. Beijing’s LGP plan was replicated for Islamabad for simulation. For Islamabad, a 3.6-km2 green space area and 8.86-km2 mixed vegetation area was added; replacing built-up area and barren land, respectively.

2.6.3. Urban Green Space Work Plan (UGWP)

The UGWP [50] scenario refracts an increase in green space resources from 2016–2020. The target of UGWP is to increase 432 ha of urban green space area annually (21.6 km2 in five years). This plan also includes an annual increase of 208 ha of public green space area (10.4 km2 in five years) and 261 ha of attached green space area (13.05 km2 in five years). For simulation, 21.5 km2 of urban green space and 23.45 km2 of mixed vegetation area was added; replacing built-up area and barren land, respectively. The UGWP model was then applied on Islamabad for simulation; replacing 3.02 km2 of built-up area to green space area and 3.61 km2 of barren land to mixed vegetation.
According to the “13th Five-Year” National Economy and Social Development Plan (NESP) for Beijing [74], the population of Beijing will be limited to 23 million by 2020. Therefore, the growth rate of population was analyzed statistically and their impact on built-up area growth was calculated; exchanging 32.4 km2 of built-up land to urban green spaces and agricultural land.

2.7. The Dynamics of Land System (DLS) Model

Dynamics of Land System (DLS) model was applied to simulate the LULC maps of 2020 and 2025. DSL was developed by Deng et al. [58] and it has the capability to overcome some of the problems present in already-tested simulation models. Two special features discriminate DLS from other models: (1) it analyzes land demand scenarios at regional level and performs spatial allocation at pixel level. (2) it utilizes spatial regressions between LULC classes and influential factor. These two features discriminate DLS from other simulation models. For examples, in the cellular automat model, the transition rules are developed based on an expert’s experience and knowledge and does not count the relationship of historic LULC maps which can affect the simulation results [59]. Similarly, an agent-based model (ABM) signifies a simple relationship of LULC classes with agents, but the land system is quite complex, therefore, it can affect the simulation accuracy [75]. DLS forecasts LULC patterns at the regional scale as well as at the pixel level. At the regional scale, LULC simulation occurs according to the changing land demand due to socioeconomic activities. At the pixel level, changes in LULC classes happen through the relationship estimated between influential factors (climatic, geophysical, socioeconomic and proximity) and LULC classes. DLS considers external demand as well as influence of adjacent driving forces, it controls random disorders and emphasizes internal suitability. Therefore, this model is robust for LULC simulation in terms of simulation accuracy and expression of mechanism [58,76].
Figure 3 indicates three main modules of DLS including local characteristics, historical characteristics and regional characteristics. In local characteristics, driving factors are listed in Table 3. Spatial regression was performed between LULC classes and driving factors to use them as input in DLS. Conversion probability and conversion rules are shown in Table 4 and Table 5. Historical characteristics include the statistics of historic LULC. Regional characteristics indicate change in LULC classes based on different scenarios (policies).

3. Results

3.1. Performance of DLS Model

Figure 4 indicates actual and simulated LULC for both Beijing and Islamabad. Results of DLS model (simulated LULC for 2015) were validated from LULC classification developed from Landsat images of 2015. In Figure 4, the actual LULC is classified from Landsat imagery of 2015, whereas simulated LULC was prepared using the DLS model, taking 2010 as the base year.
An accuracy assessment was performed on DLS model’s simulated LULC classification for 2015; Landsat image classified LULC was taken as reference. Accuracy assessment matrices were performed both for Beijing (see Table 8) and Islamabad (see Table 9). Altogether, accuracy assessment for both cities is above 87%. Kappa coefficient for Beijing is 94.4%, and for Islamabad 91.9%.

3.2. Simulation of LULC Changes for 2020 and 2025

LULC changes for Beijing and Islamabad were simulated based on three scenarios i.e., BAU, UGWP and LGP. LULC based on BAU scenario were simulated particularly for Islamabad. In the absence of any landscape and greening policy for Islamabad, this scenario will help the government officials to understand the consequences of rapid urbanization and vegetation degradation. UGWP and LGP are CGI policies developed by government of China for Beijing. Besides Beijing, UGWP and LGP were tested for Islamabad as well to investigate the effectiveness of these policies for capital of Pakistan. Scenario-based LULC maps for Beijing and Islamabad are shown in Figure 5 and Figure 6. Visually an urban sprawl is comparatively more prominent LULC class that indicates a clear picture of expansion of the both cities.
Graphical representation of LULC changes from 2010 to 2025 are depicted in Figure 7 and Figure 8. Under the BAU scenario, 1.9 km2 per year decrease in mixed vegetation (all types of vegetation except urban green spaces) area of Beijing was observed, however urban green spaces tend to increase, which ultimately leads towards improvement of CGI of Beijing. Built-up area, bare land and water bodies of Beijing also increases while agricultural land decreases. The mixed-vegetation class of Islamabad exhibited an alarming situation; decreasing at a rate of approximately 5 km2 per year. The agricultural class also forecasted a decline. However urban green spaces cover almost the same area from 2010 to 2025 under the BAU scenario. The built-up area is anticipated to have continuous expansion with minute increase of bare area and water bodies. Hence, the BAU scenario for Islamabad forecast an overall decline of CGI.
The UGWP scenario for Beijing envisioned an increase in overall vegetation area i.e., mixed vegetation class will decrease by 0.27 km2 per year and urban green spaces will increase by 9 km2 per year from 2015 to 2025. The Built-up area class will have a sluggish decline (as illustrated in Figure 7), which is contrary to BAU scenario. Water area is almost the same, while a decreasing trend can be seen for bare area class. To sum up, under UGWP scenario, the CGI of Beijing will improve exponentially. LULC dynamics of Islamabad under UGWP foresee slighter increase in vegetation classes. Thus, it can be deduced that the UGWP scenario is ineffective in increasing green area of Islamabad at required rate; as rate of vegetation degradation in Islamabad is much higher than Beijing. Still an increasing trend can be seen for mixed vegetation and green spaces classes (see Figure 8), and overall vegetation area will improve. The Built-up area is increasing while agricultural land is decreasing following the BAU trend. Water area changes are within 1 km2 for all scenarios, a little increase in water area was observed under UGWP as compared to BAU, while bare area decreases with time. In a nutshell, minor improvement can be claimed in CGI of Islamabad under the UGWP scenario.
The third scenario i.e., LGP will have optimum impact on mixed vegetation class of Beijing than both the BAU and UGWP scenarios. However, greenspaces follow the trend of UGWP. Rapid increase in vegetation area under this scenario is because Beijing’s government has planned to convert 133.3 km2 barren land into forest cover from 2015–2020. Consequently, bare area decreases rapidly, while other classes follow the trend like the UGWP scenario. The vegetation dynamics of Islamabad under LGP indicate a decent increase in mixed vegetation cover (approximately 10 km2) while a significant increase in urban green spaces can also be seen in Figure 8. Overall a noticeable improvement in CGI of Islamabad can be seen in the graphs under LGP scenario. There is a dire need to take serious actions against the drivers of vegetation degradation. Bare area slightly decreases as compared to BAU and UGWP, while other classes follow the trend of UGWP.

4. Discussion

Current research study has forecasted the LULC dynamics based on different vegetation scenarios using the DLS model. LULC changes were simulated under three scenarios; namely BAU, UGWP and LGP for the years of 2020 and 2025. BAU is the continuation of LULC changes occurred during the period of 2010 to 2015, and it was considered particularly for Islamabad to aware the land use planners, policy makers and landscape managers of Islamabad about the alarming situation of the city in near future. UGWP and LGP are based on two CGI policies designed for Beijing. UGWP and LGP policies were tested on Islamabad as well to foresee the landscape scenarios of 2020 and 2025. Simulation was performed for 2020 and 2025; the government of Beijing normally develop their policies for periods of five years [45,50]. A LULC simulation for 2025 was conducted to investigate the efficiency of current policies; if similar policies continue after 2020 i.e.,14th five-year plan.
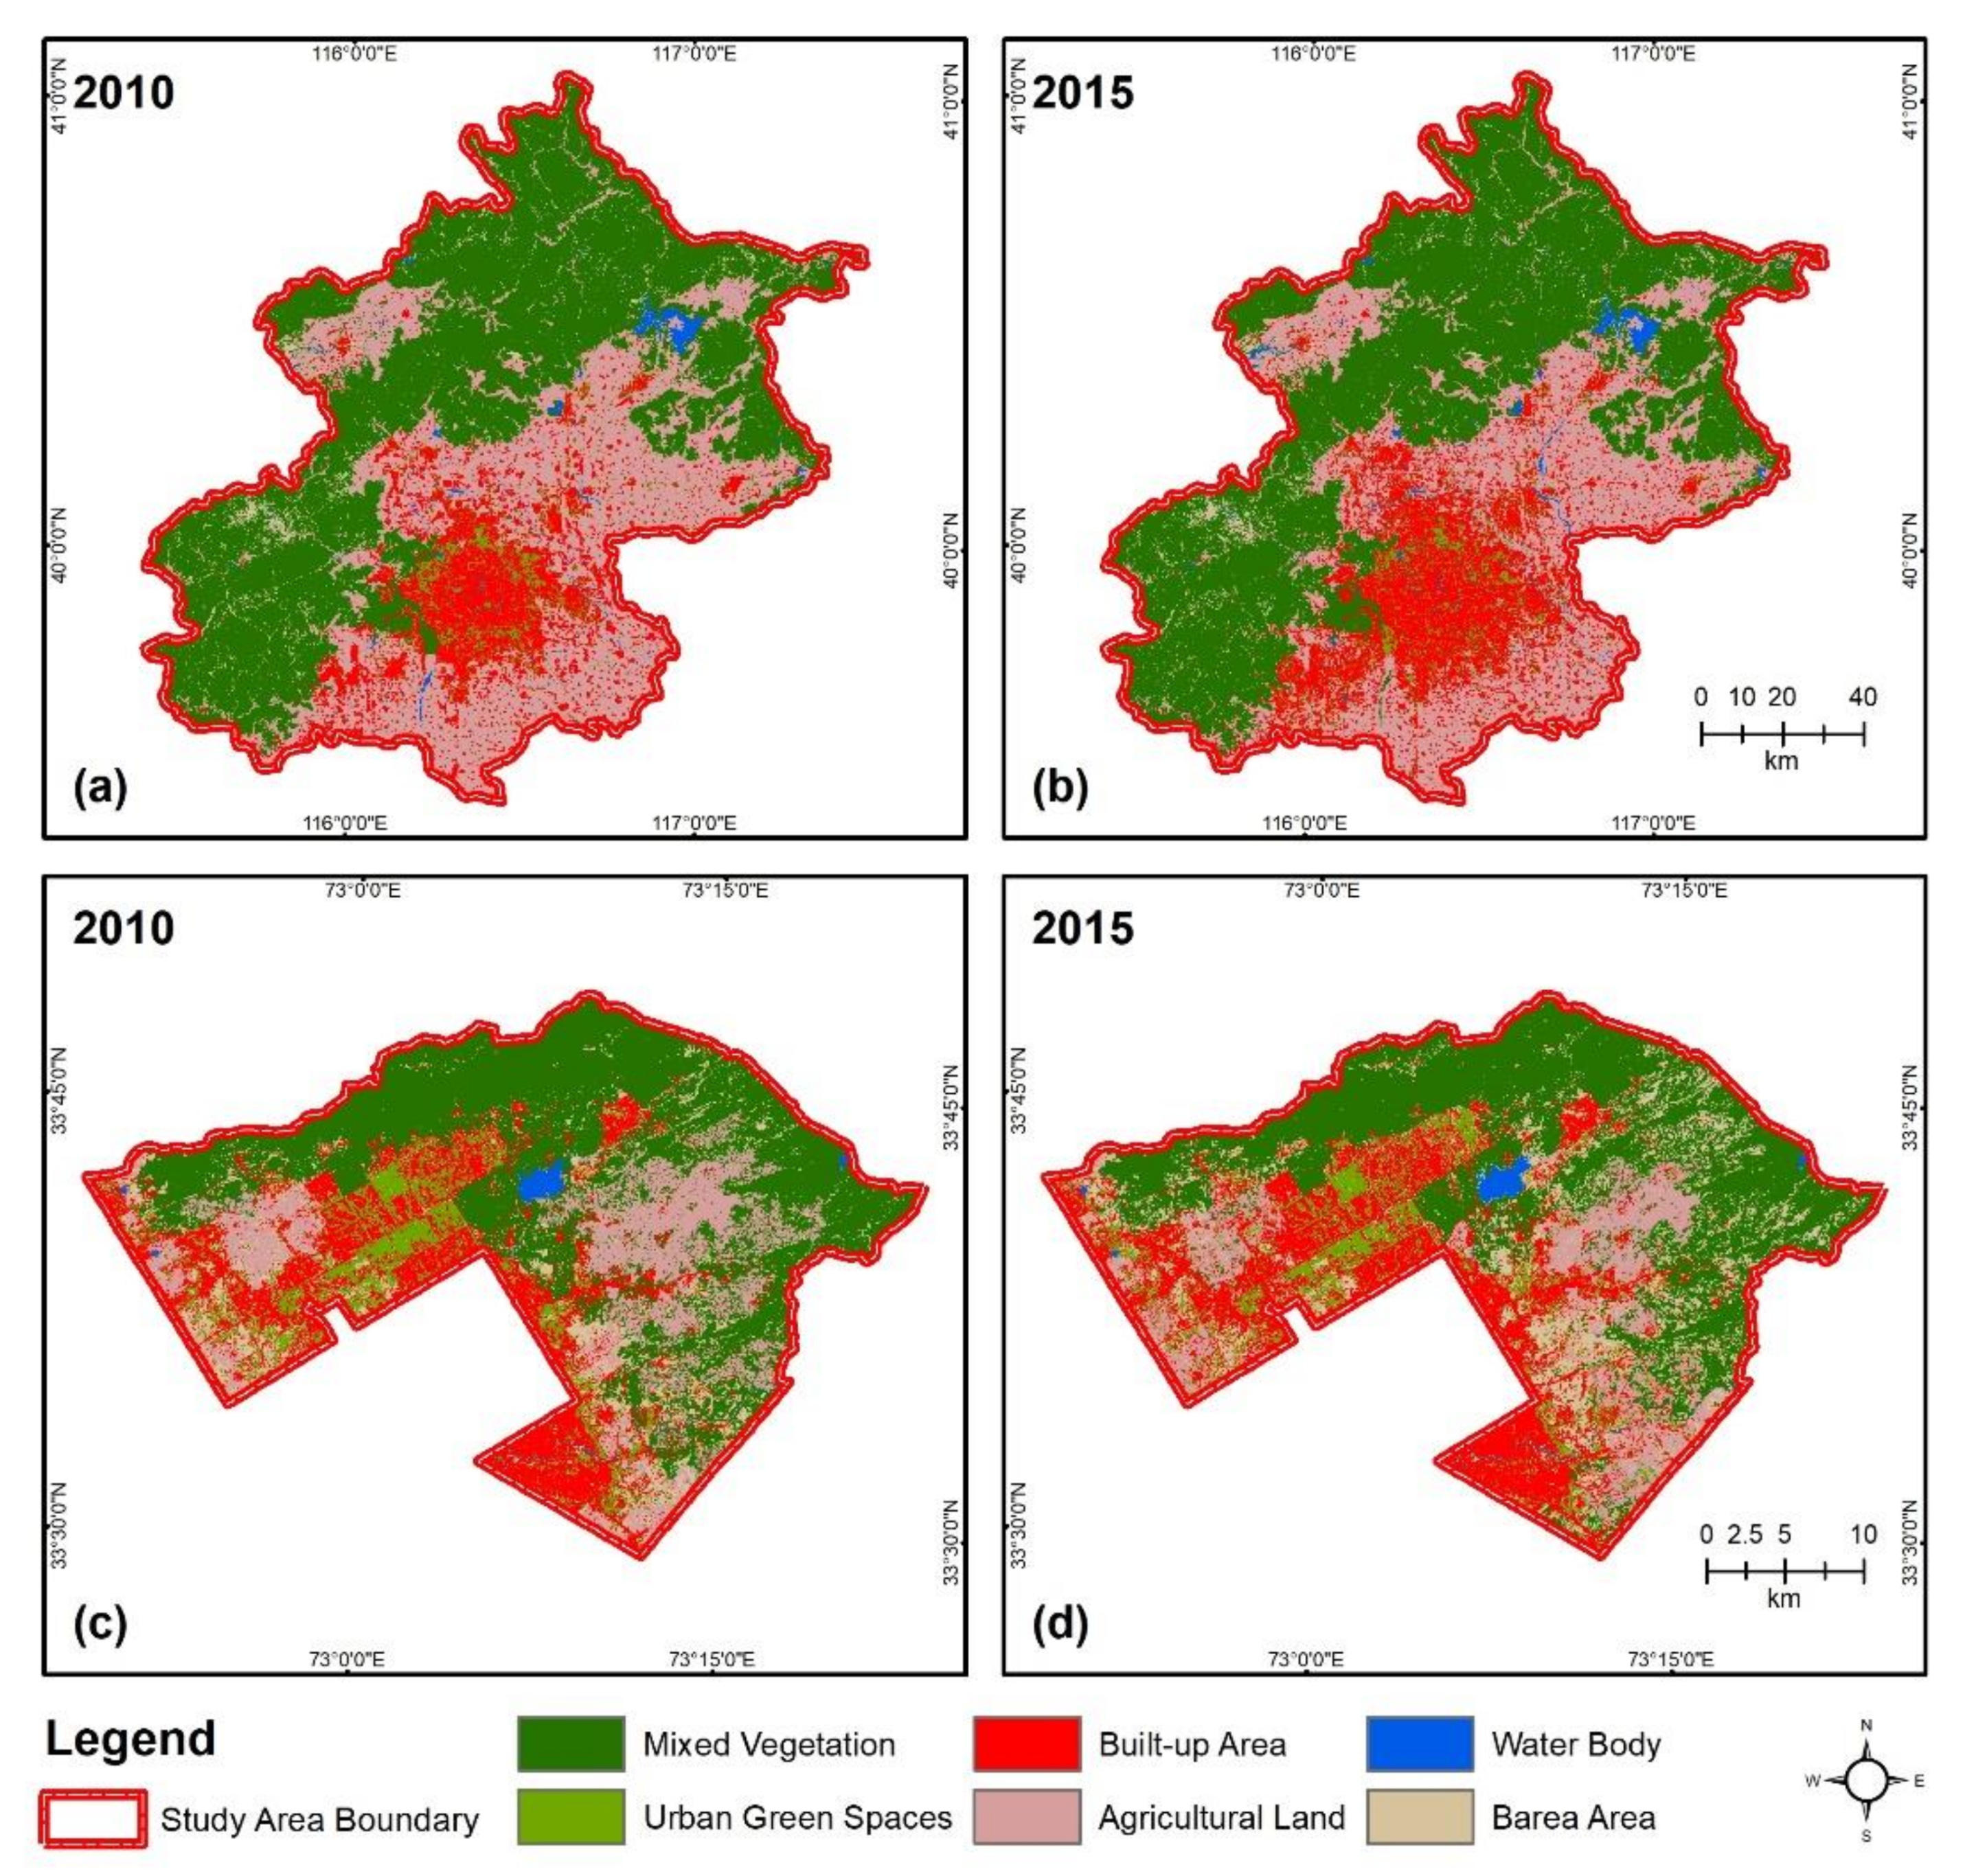
For LULC simulations, 2010 is considered as a base year, and future scenarios are forecasted based on the LULC changes between 2010 and 2015. The accuracy assessment was done by selecting some randomly sampled points of homogeneous areas for all land cover classes. All the sample points were selected from centers of the segments. As a final step, sample points were visually verified from high resolution Google Earth’s images [63,64,65]. Kappa coefficients for LULC of Beijing is 84% for year 2010 and 87% for year 2015 (see 
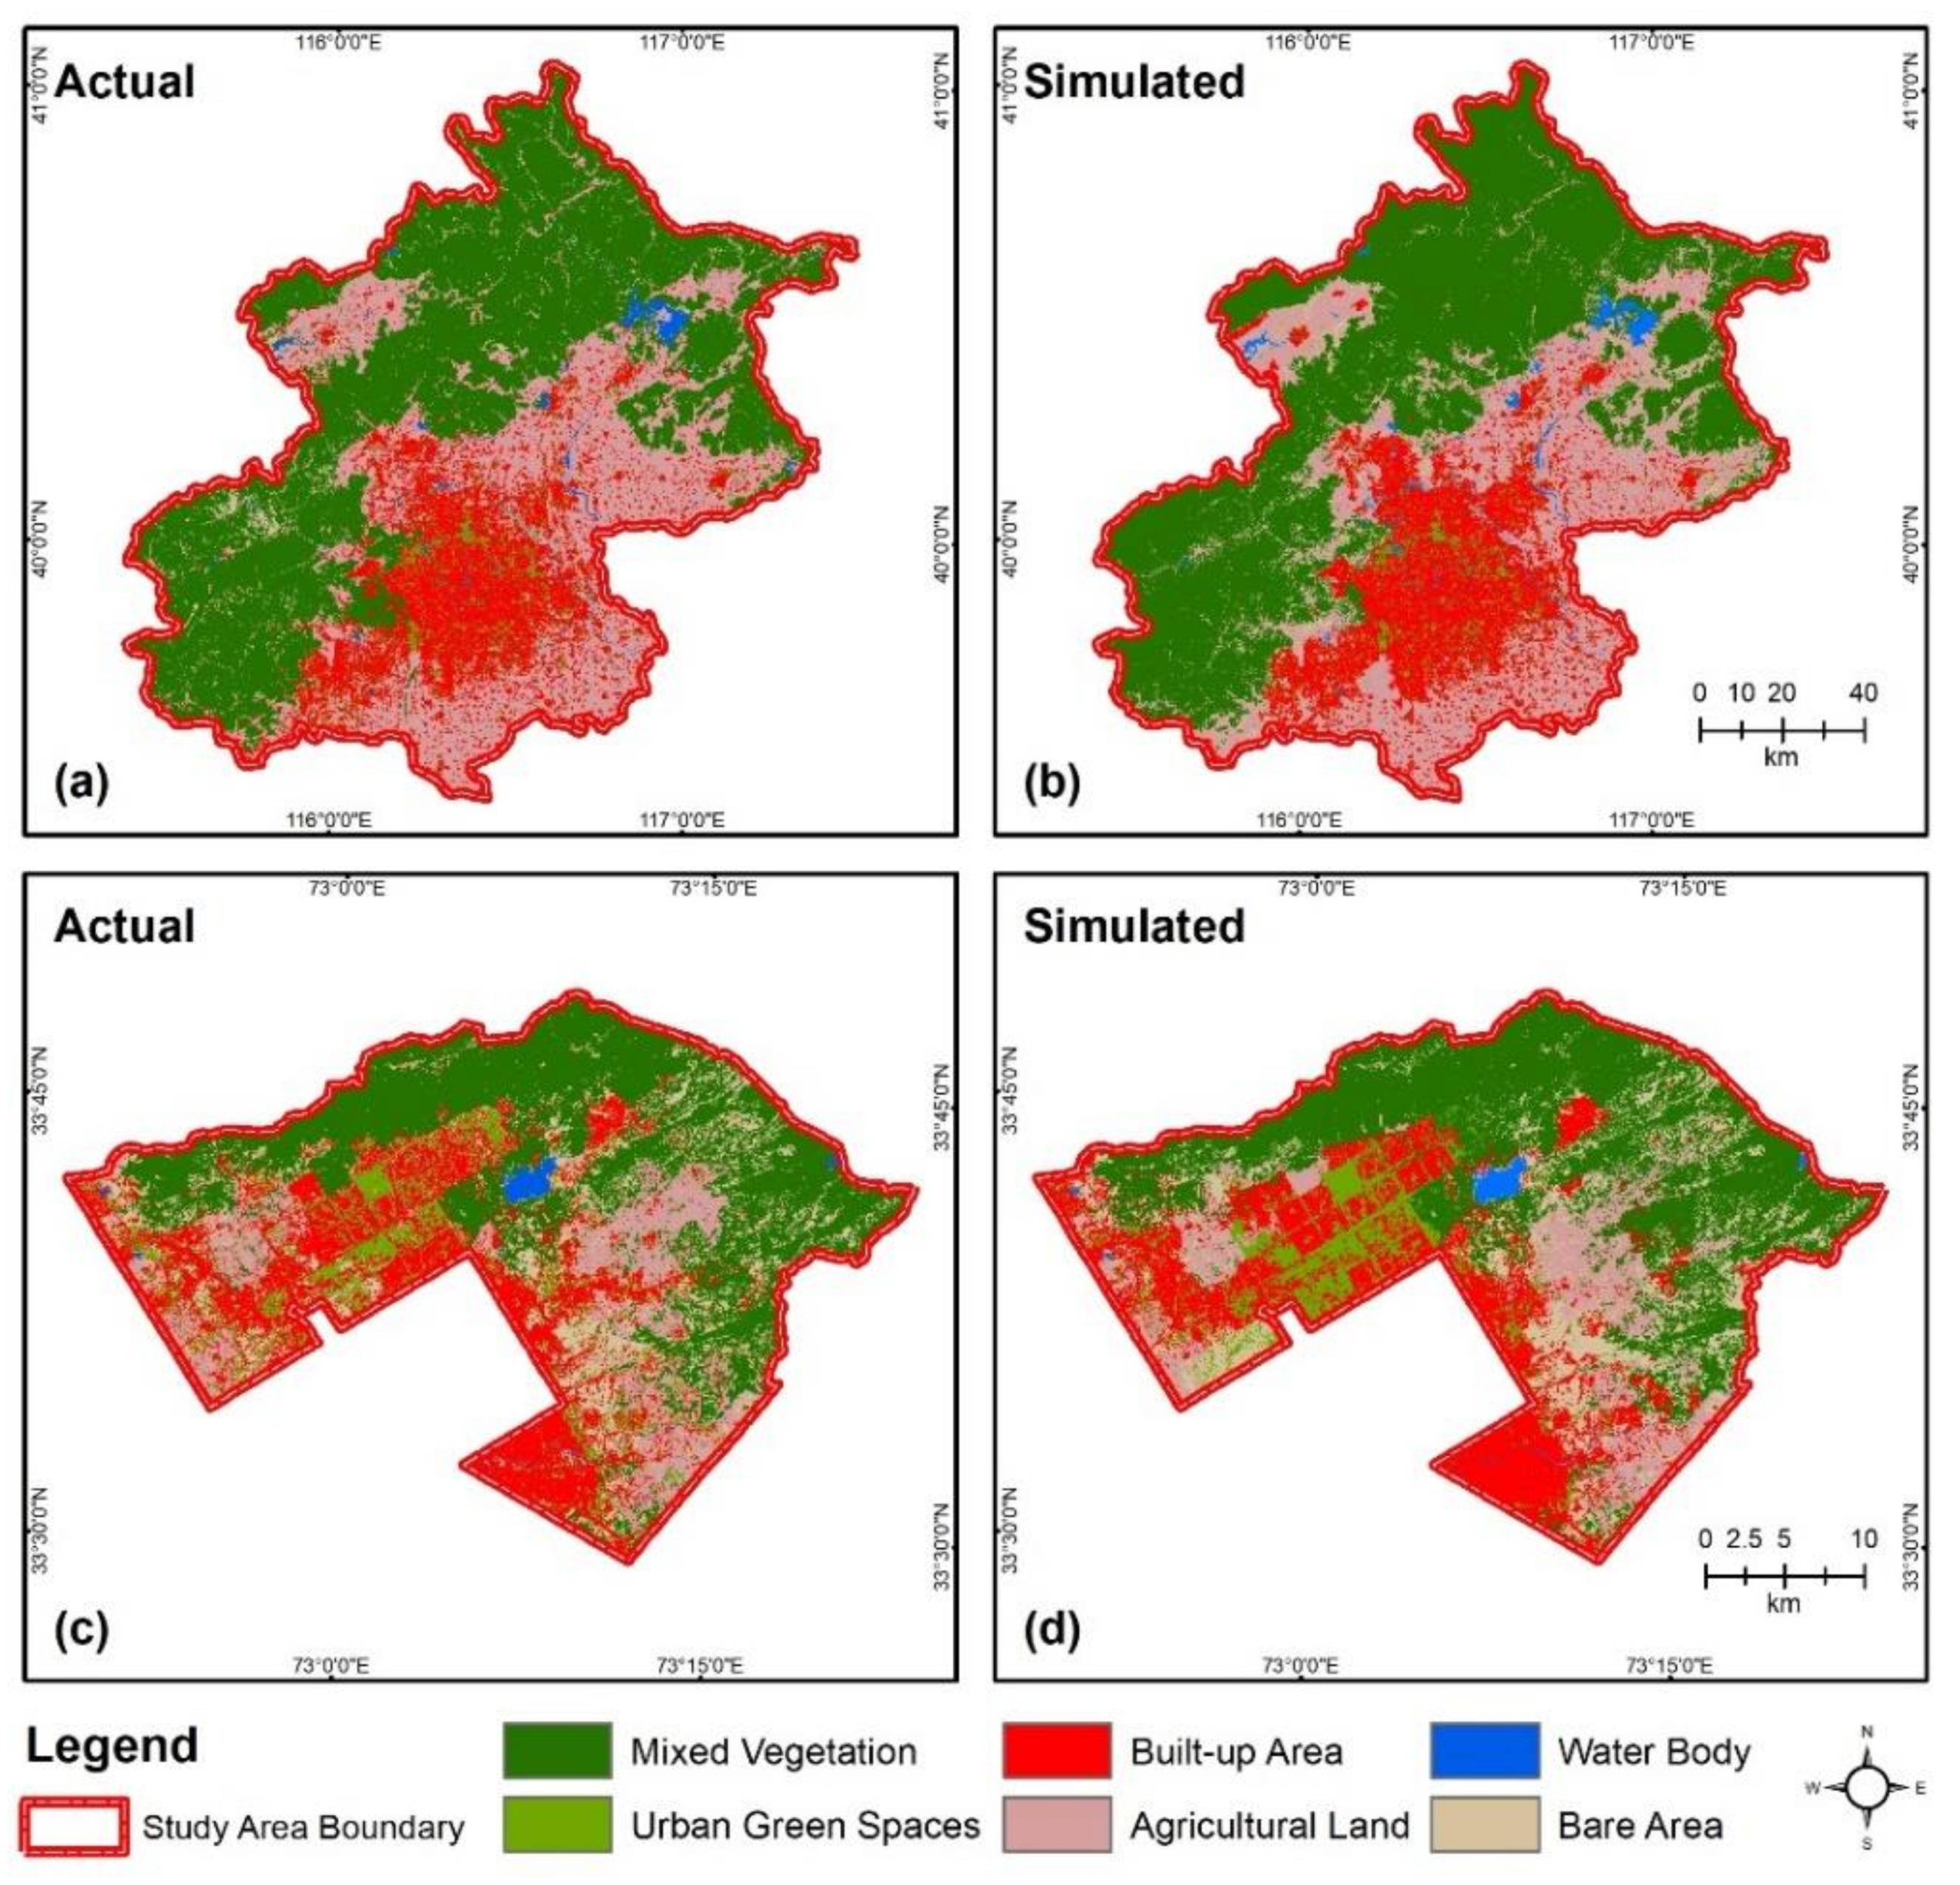
Table 3), and for Islamabad Kappa coefficient is 86% for year 2010 and 85% for year 2015. DLS model’s simulated results present a decent accuracy as Kappa coefficient is more than 90% for both Beijing and Islamabad. These accuracies are better than previously used simulation models [52,53,59,75]. It is because DLS has two special features that other models don’t have: (1) it analyzes land demand scenarios at regional level and performs spatial allocation at pixel level (2) it utilizes spatial regressions between LULC classes and impact factor. These two features discriminate DLS from other simulation models and help to deal with the complexity of city systems [58].
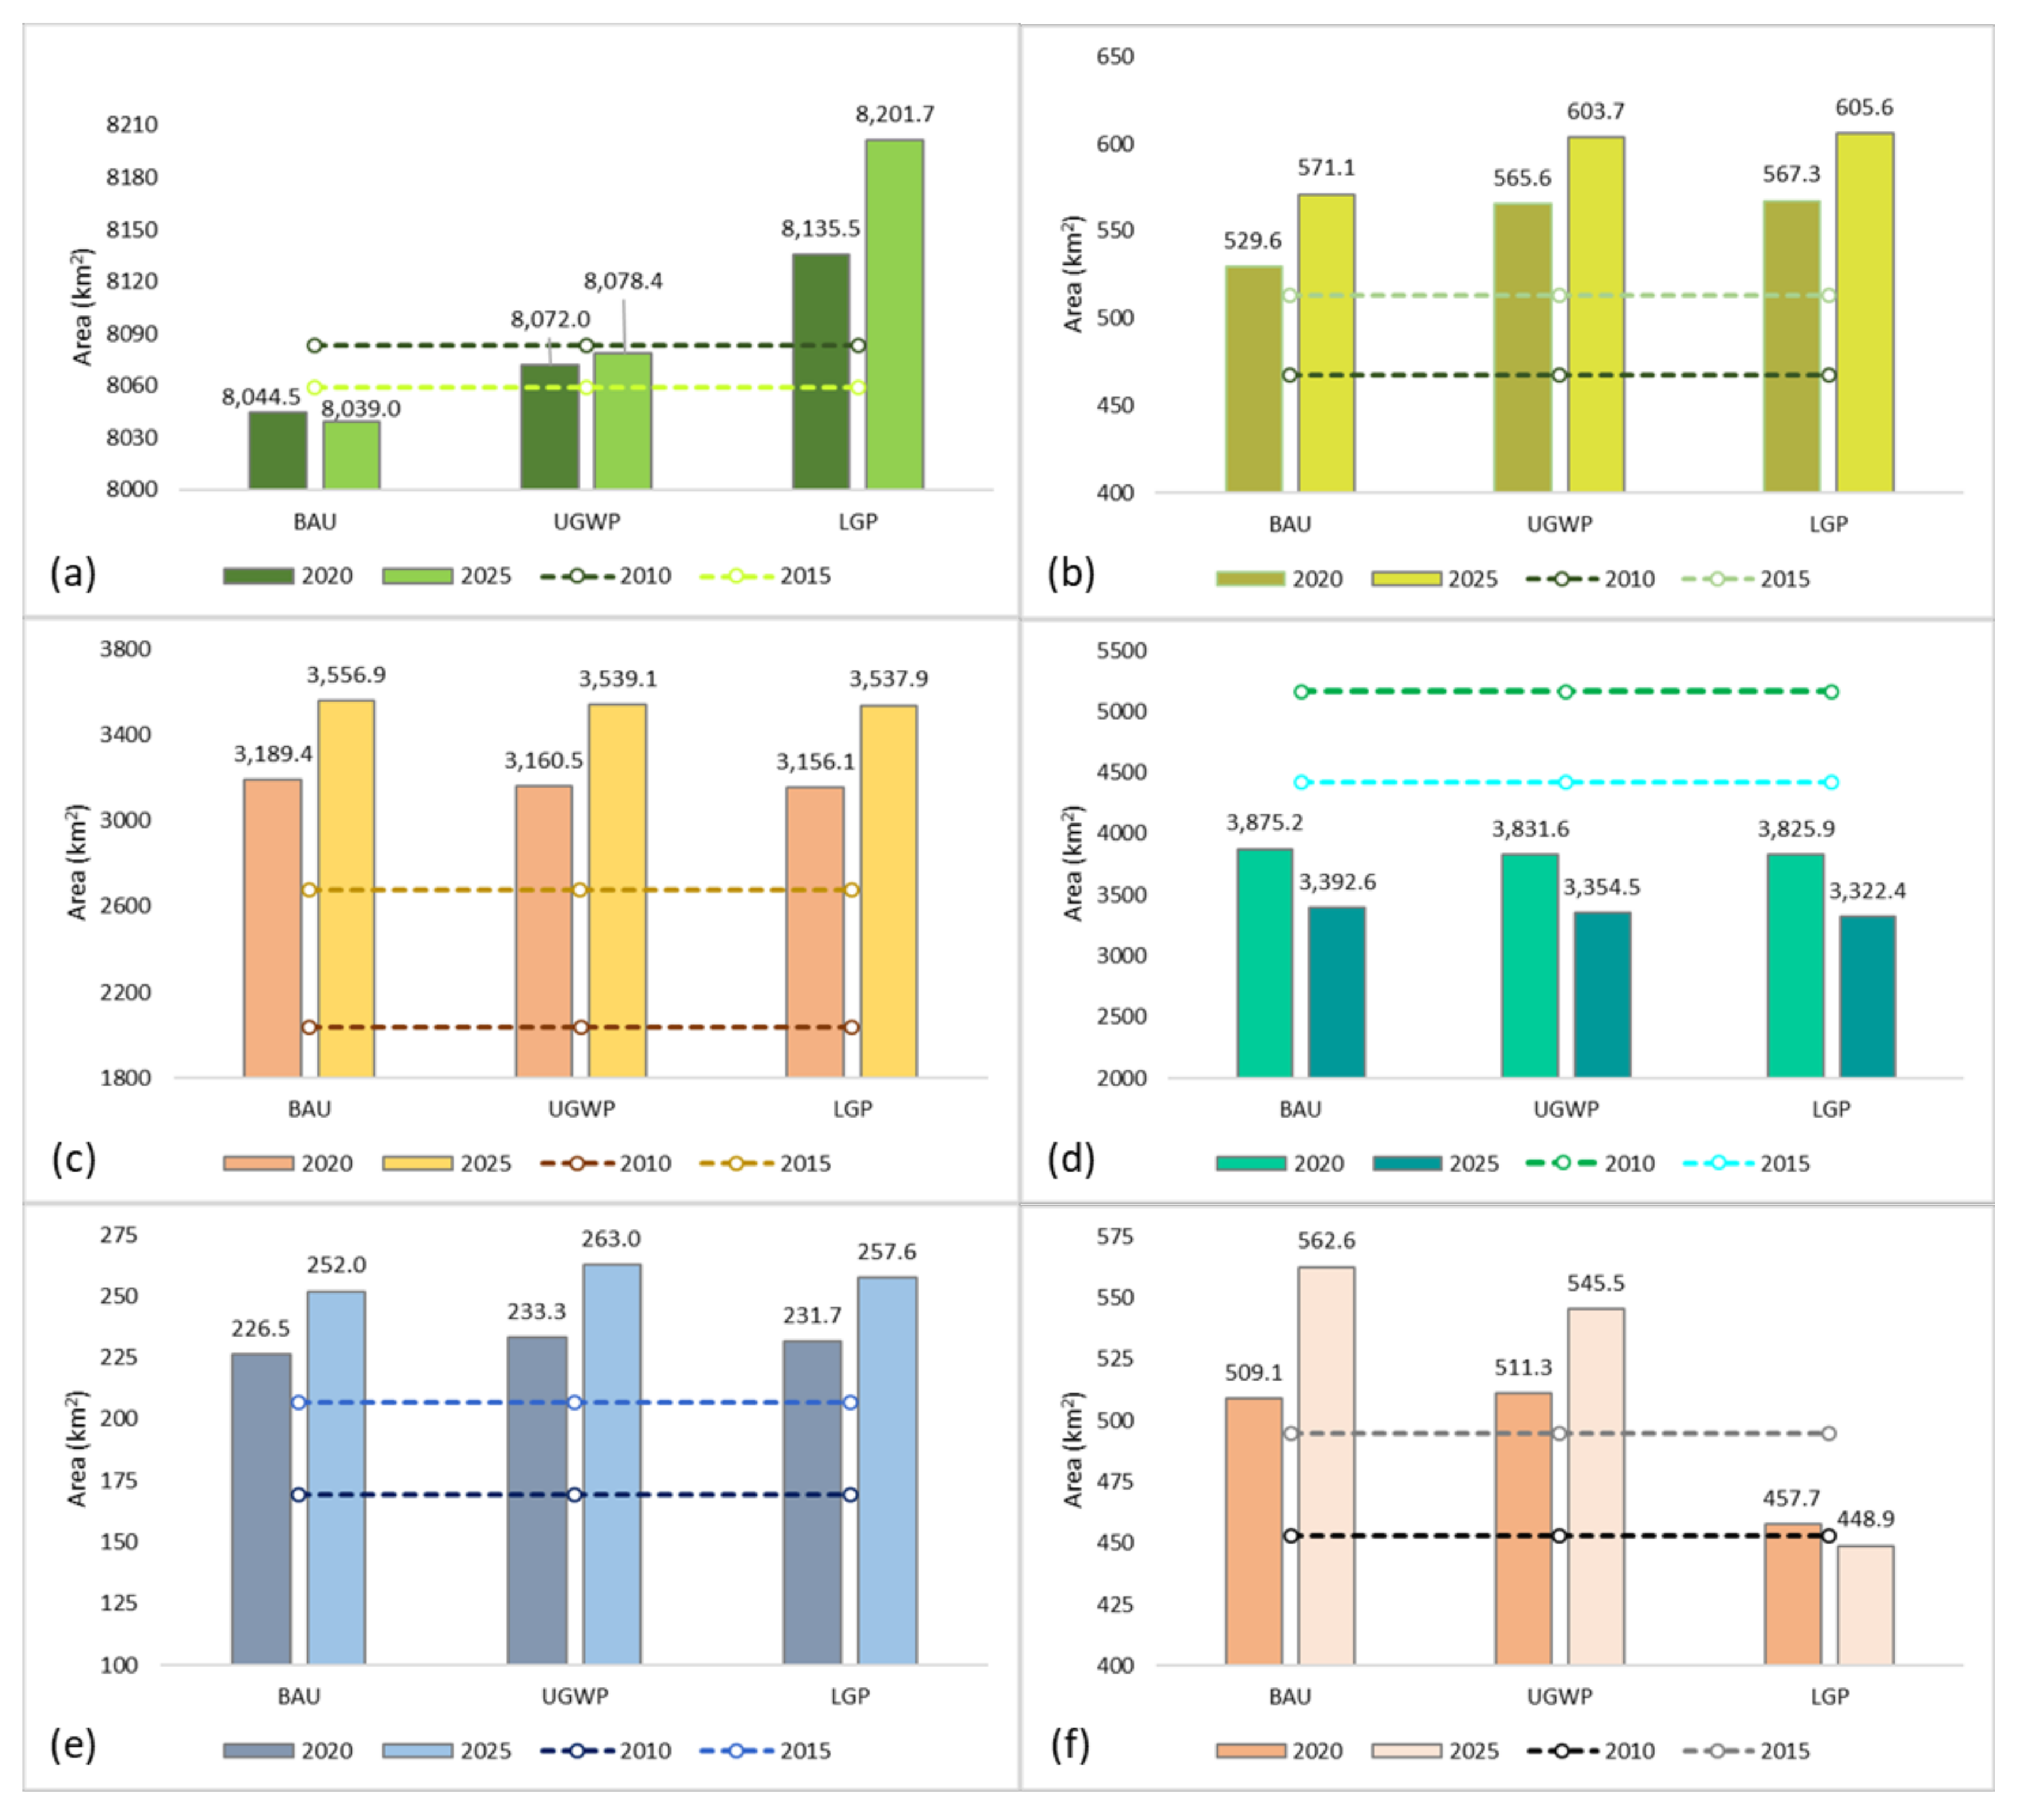
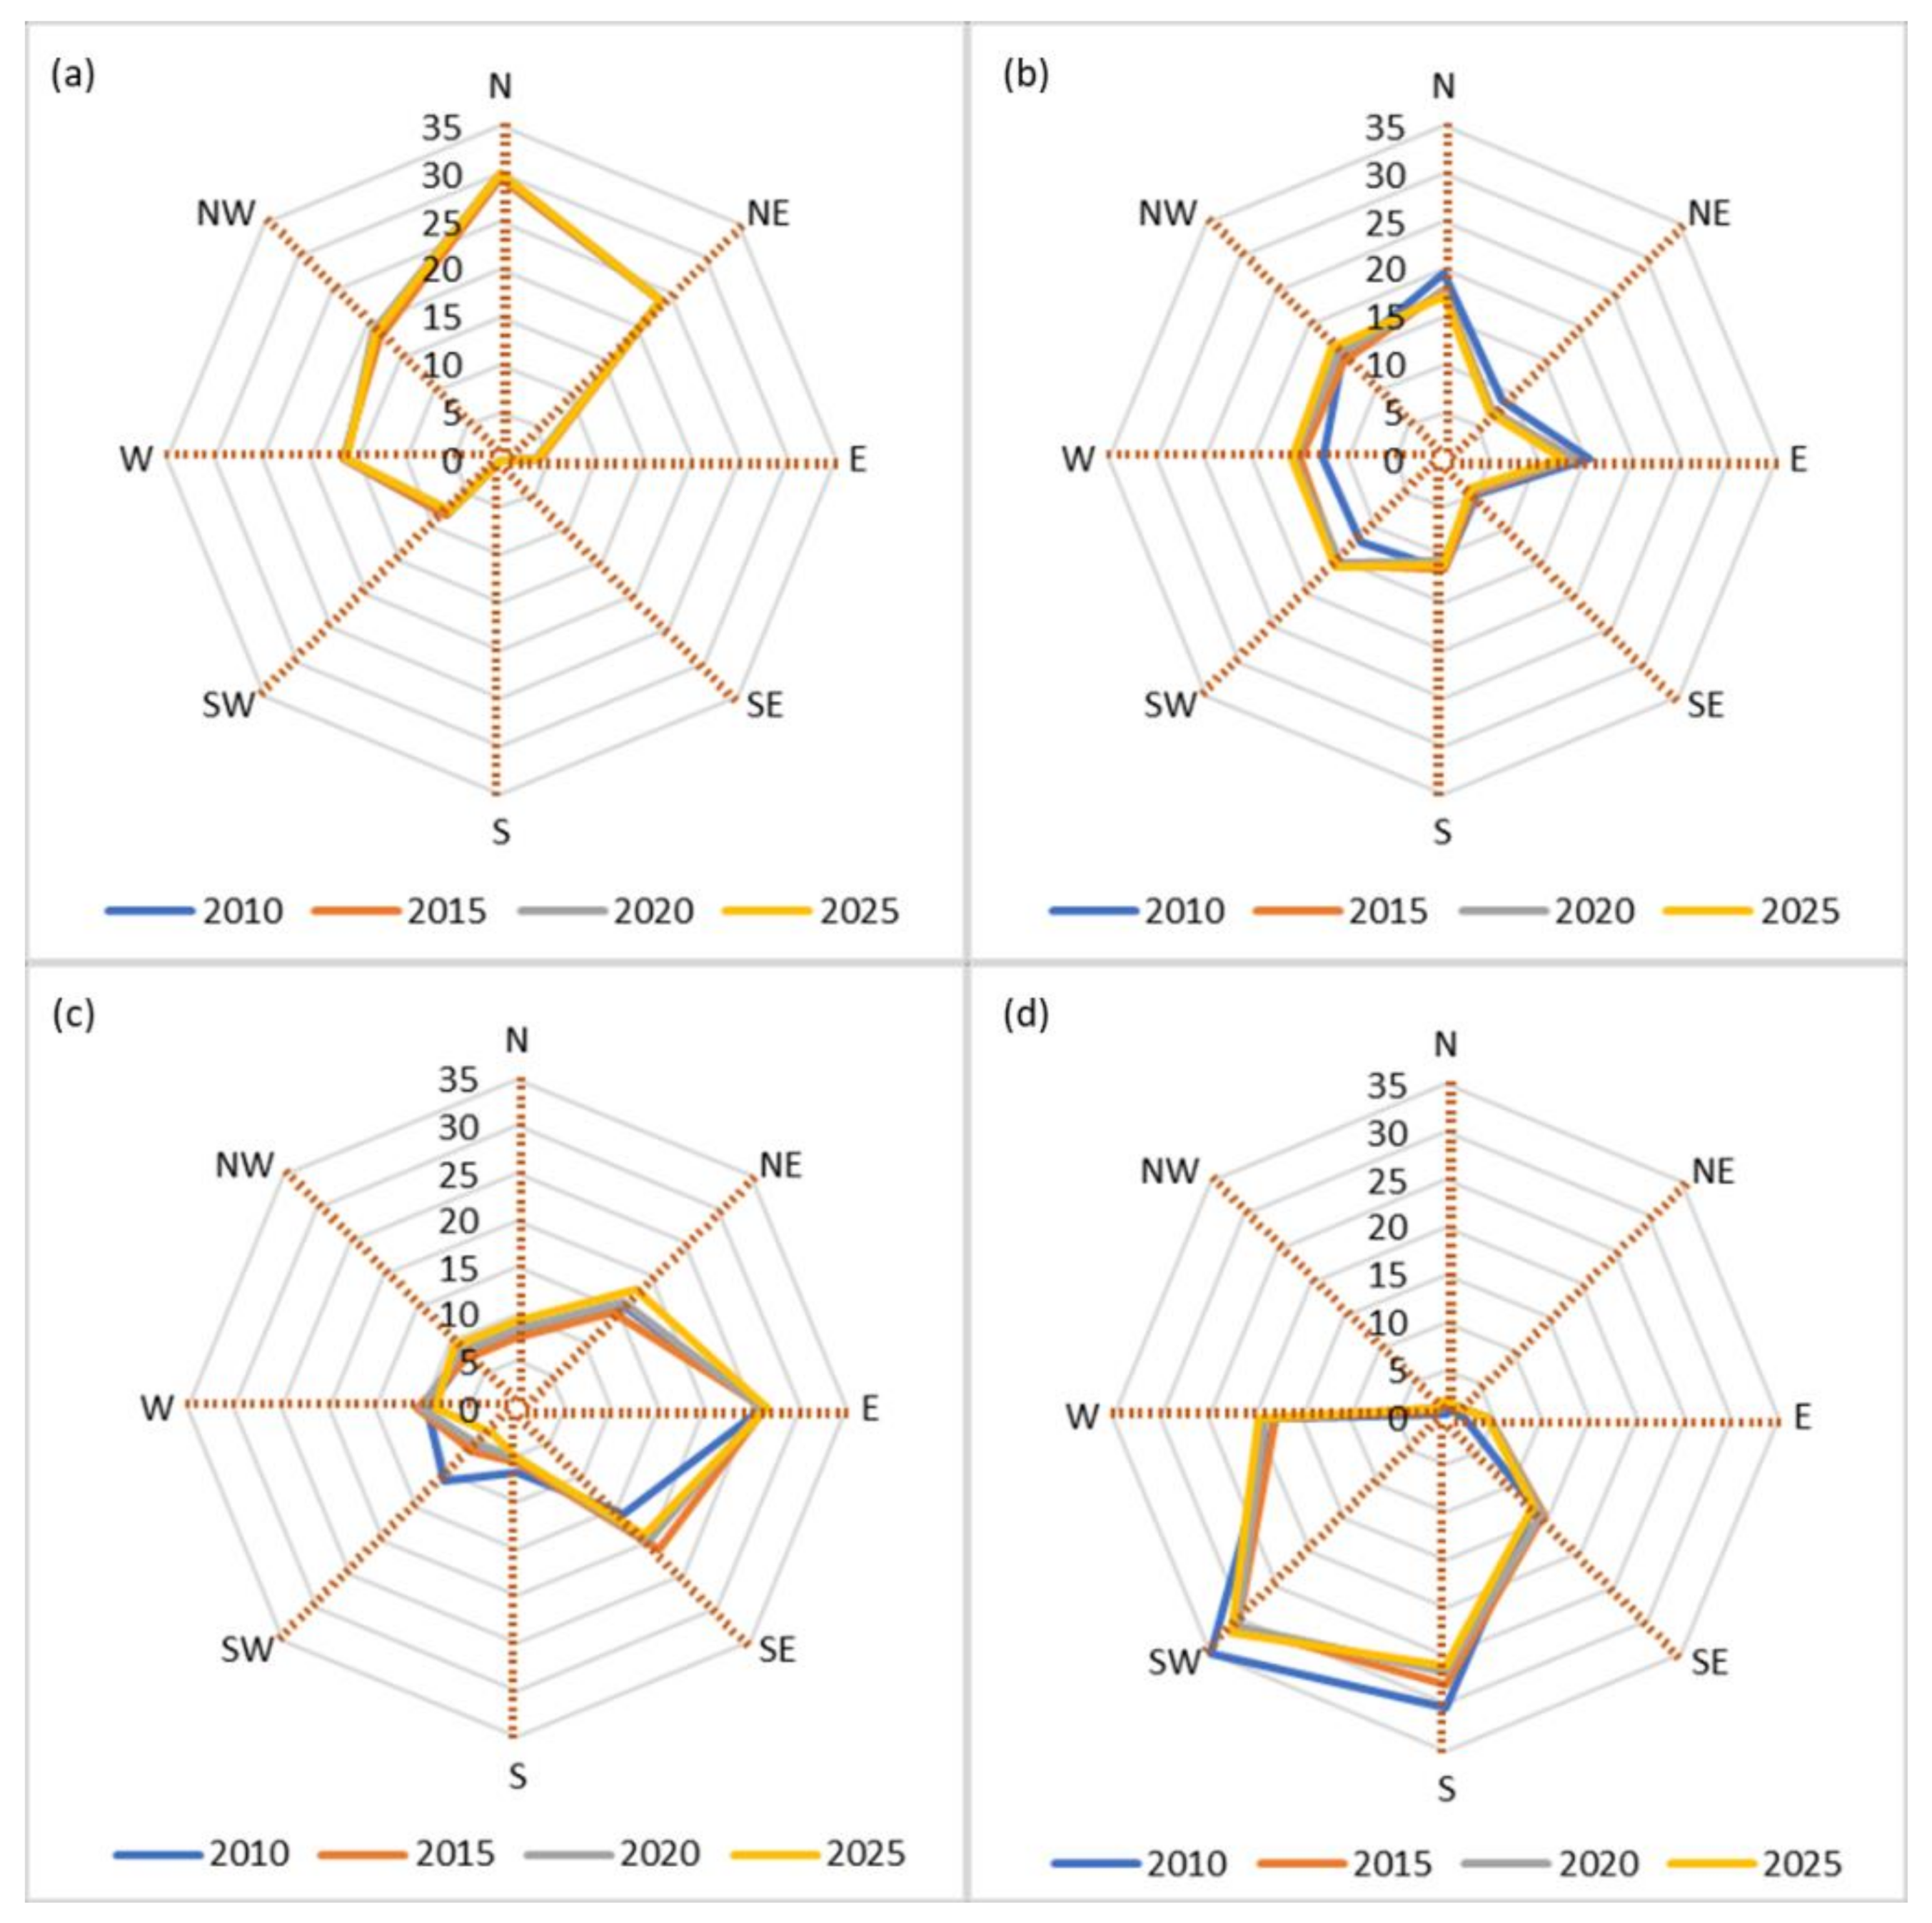
The time interval between 2010–2015 indicates an improvement in CGI of Beijing. Although, there is every chance of vegetation degradation due to LULC changes, the CGI policies seems to be effective in improving the vegetation coverage of the city. Beijing is making earnest efforts to increase urban green spaces through the implementation of several landscape and greening policies. Simulation results of Beijing suggest an increase in green area coverage under all three scenarios. Even the BAU scenario indicates an overall increase in CGI. Directional analysis (see Figure 9) demonstrated that the mixed-vegetation class of Beijing spread in the north and northeast directions, and this directional spread will prevail up to 2025 for BAU. Urban green spaces for Beijing has wider spread than Islamabad; along the east, west, north, south, northwest and southwest directions. Urban green spaces sprawl will further shift slightly towards southwest direction from 2010 to 2025 period. Under the LGP scenario, the green area of Beijing indicates a rapid increase. Under this policy, Beijing’s government has a plan to increase the urban green space area by 23 km2 and 133.3 km2 barren land will be afforested from 2016–2020 [45]. The UGWP policy will also increase almost the same amount of urban green space area (21.6 km2), however, under this policy only 24.5 km2 attached vegetation area will be afforested from 2016–2020. Results of current study indicate that if both policies are implemented successfully, then existing environmental issues might be controlled to a certain degree. However, some studies contradict the perception of our study. For example, Li et al. (2016) [43] simulated the green space policies by taking 2000 as a base year and concluded that only LGP policy can restore enough green space area to cross the green space area base year (2000). Although green space area will increase under other policies, but not enough to meet the requirements of the city. Authors further described that the green space area of Beijing is consistently increasing after the successful Olympic bid in 2001, still it is not enough to control the current environmental issues of the city. Results of the current study also indicate that LGP is the most effective policy in improving the CGI of Beijing; which coincides with conclusions of Li et al. (2016) [43].
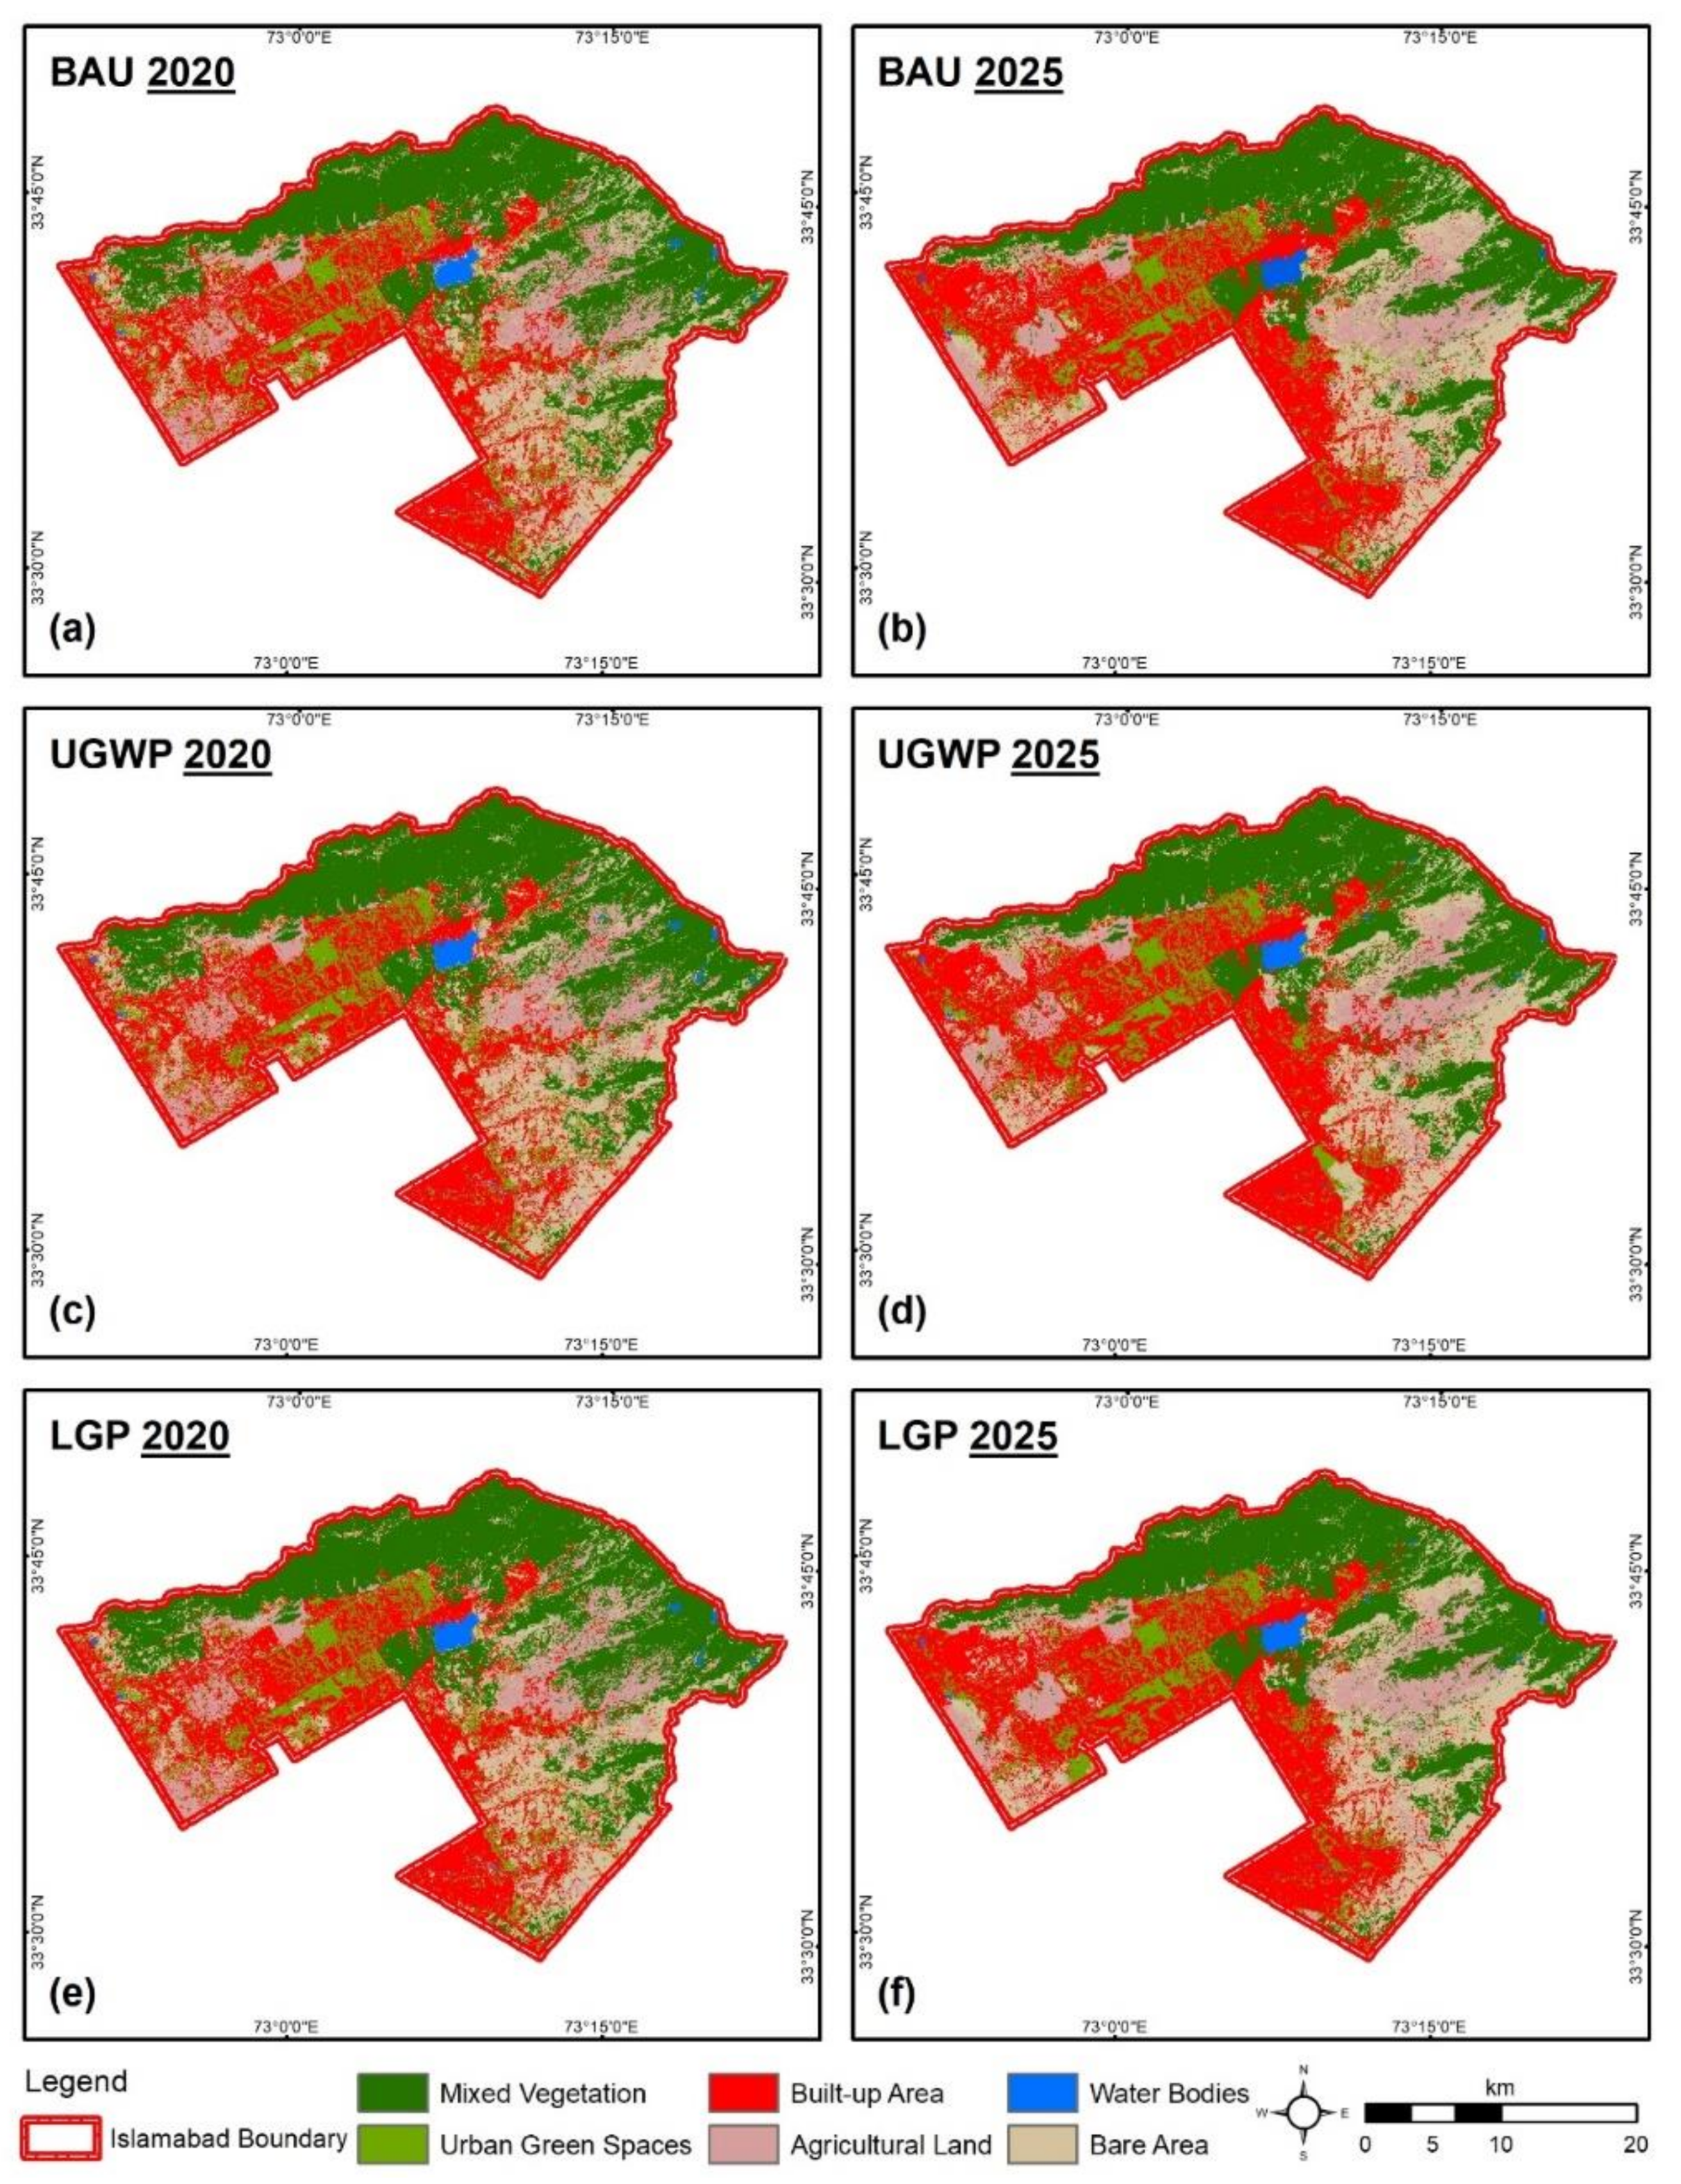
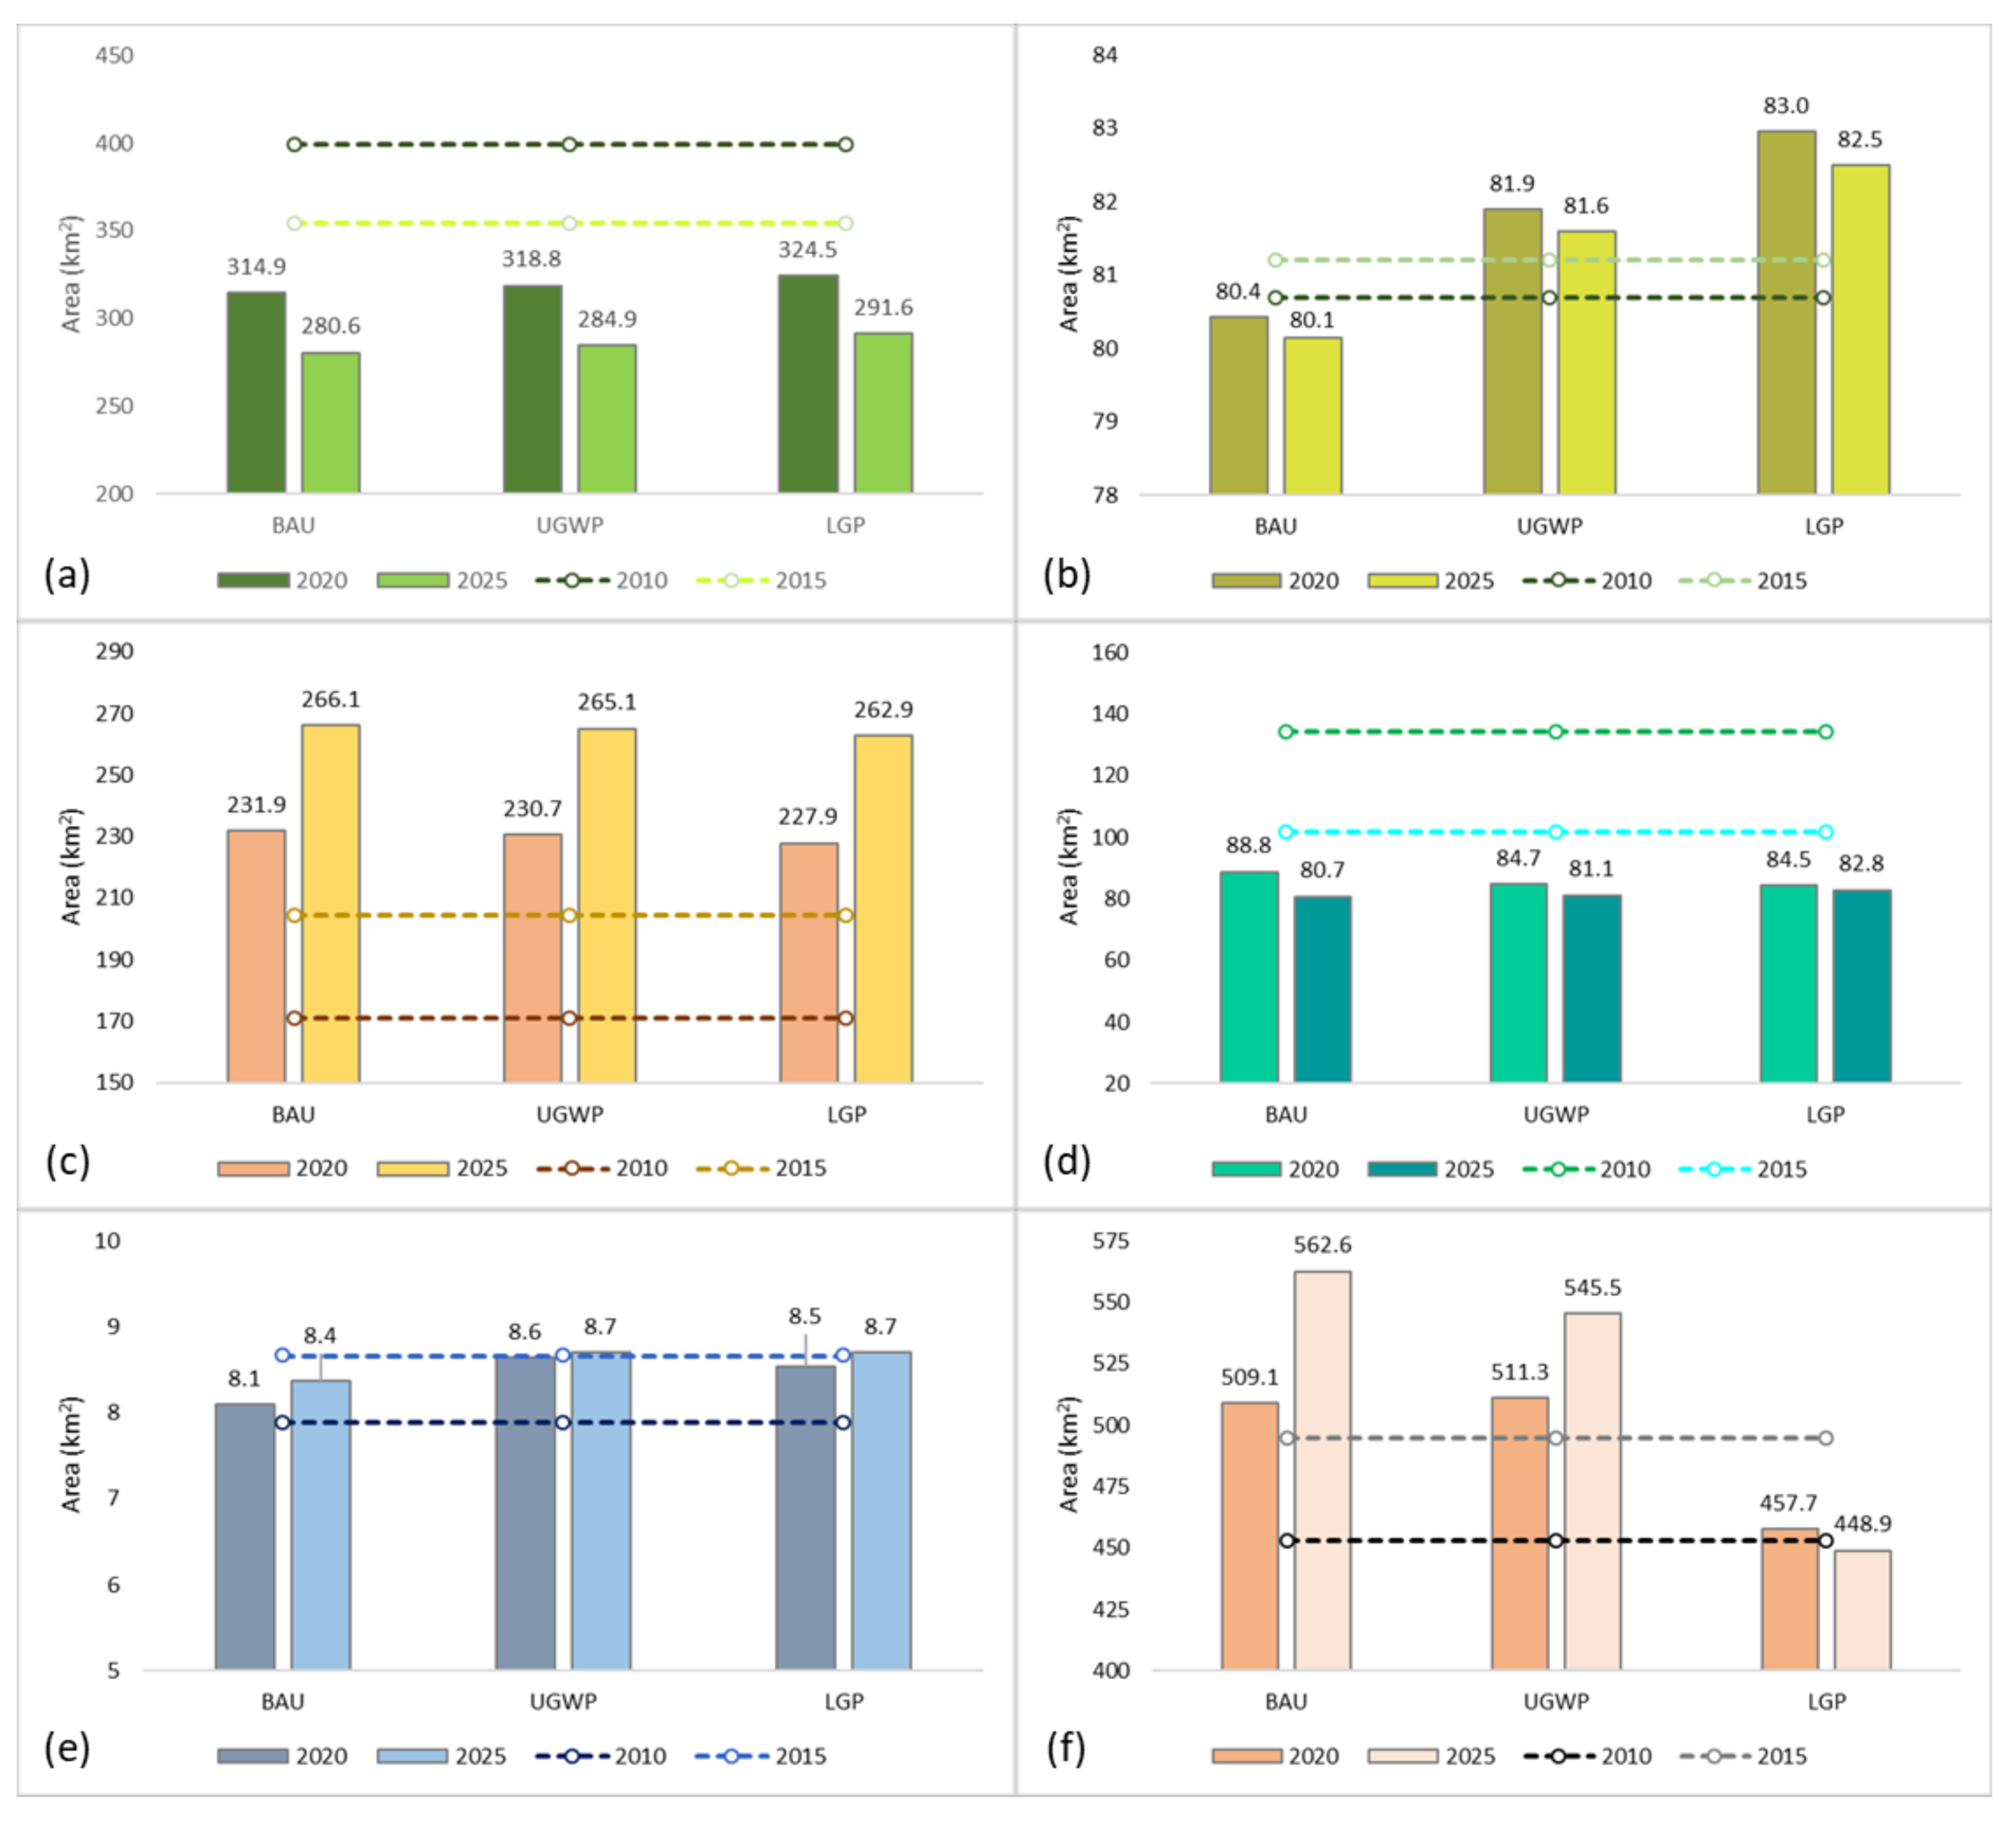
Results of Islamabad indicate a high rate of vegetation degradation during time interval of 2010–2015. BAU scenario envisioned an alarming picture of city’s landscape for 2025; approximately 100 km2 vegetation area is going to be washed out from 2010–2025. BAU scenario forewarns that if vegetation degradation continues at this rate, 26.5% of the total vegetation cover will be converted to other LULC classes by 2025. It is worth mentioning that Islamabad has no CGI policy to compensate for this depletion. Directional analysis of Islamabad (see Figure 9) illustrates that mixed vegetation class sprawl is in eastward direction with some spread in northeast and southwest in 2010. Under the BAU scenario, this directional spread of mixed vegetation class will continue. The spread of urban green spaces of 2010 is along south and southwest and south direction and will sustain up to 2025 under BAU. UGWP and LGP policies don’t seem to fulfil the requirements of the city dwellers until the rate of vegetation loss is minimized. UGWP and LGP policies of Beijing were tested on Islamabad, by increasing vegetation classes to same proportion as of Beijing. Simulated results show a slightly better picture of the Islamabad’s landscape. Due to high rates of vegetation degradation, UGWP does not seem to be effective for Islamabad. Whereas LGP can be implemented on Islamabad after modifying it according to local conditions and available resources. Besides an effective CGI policy, Islamabad also needs proper land use planning and landscape management to conserve existing natural vegetation. Though current ecological and environmental situation of Islamabad is not as shocking as of Beijing [
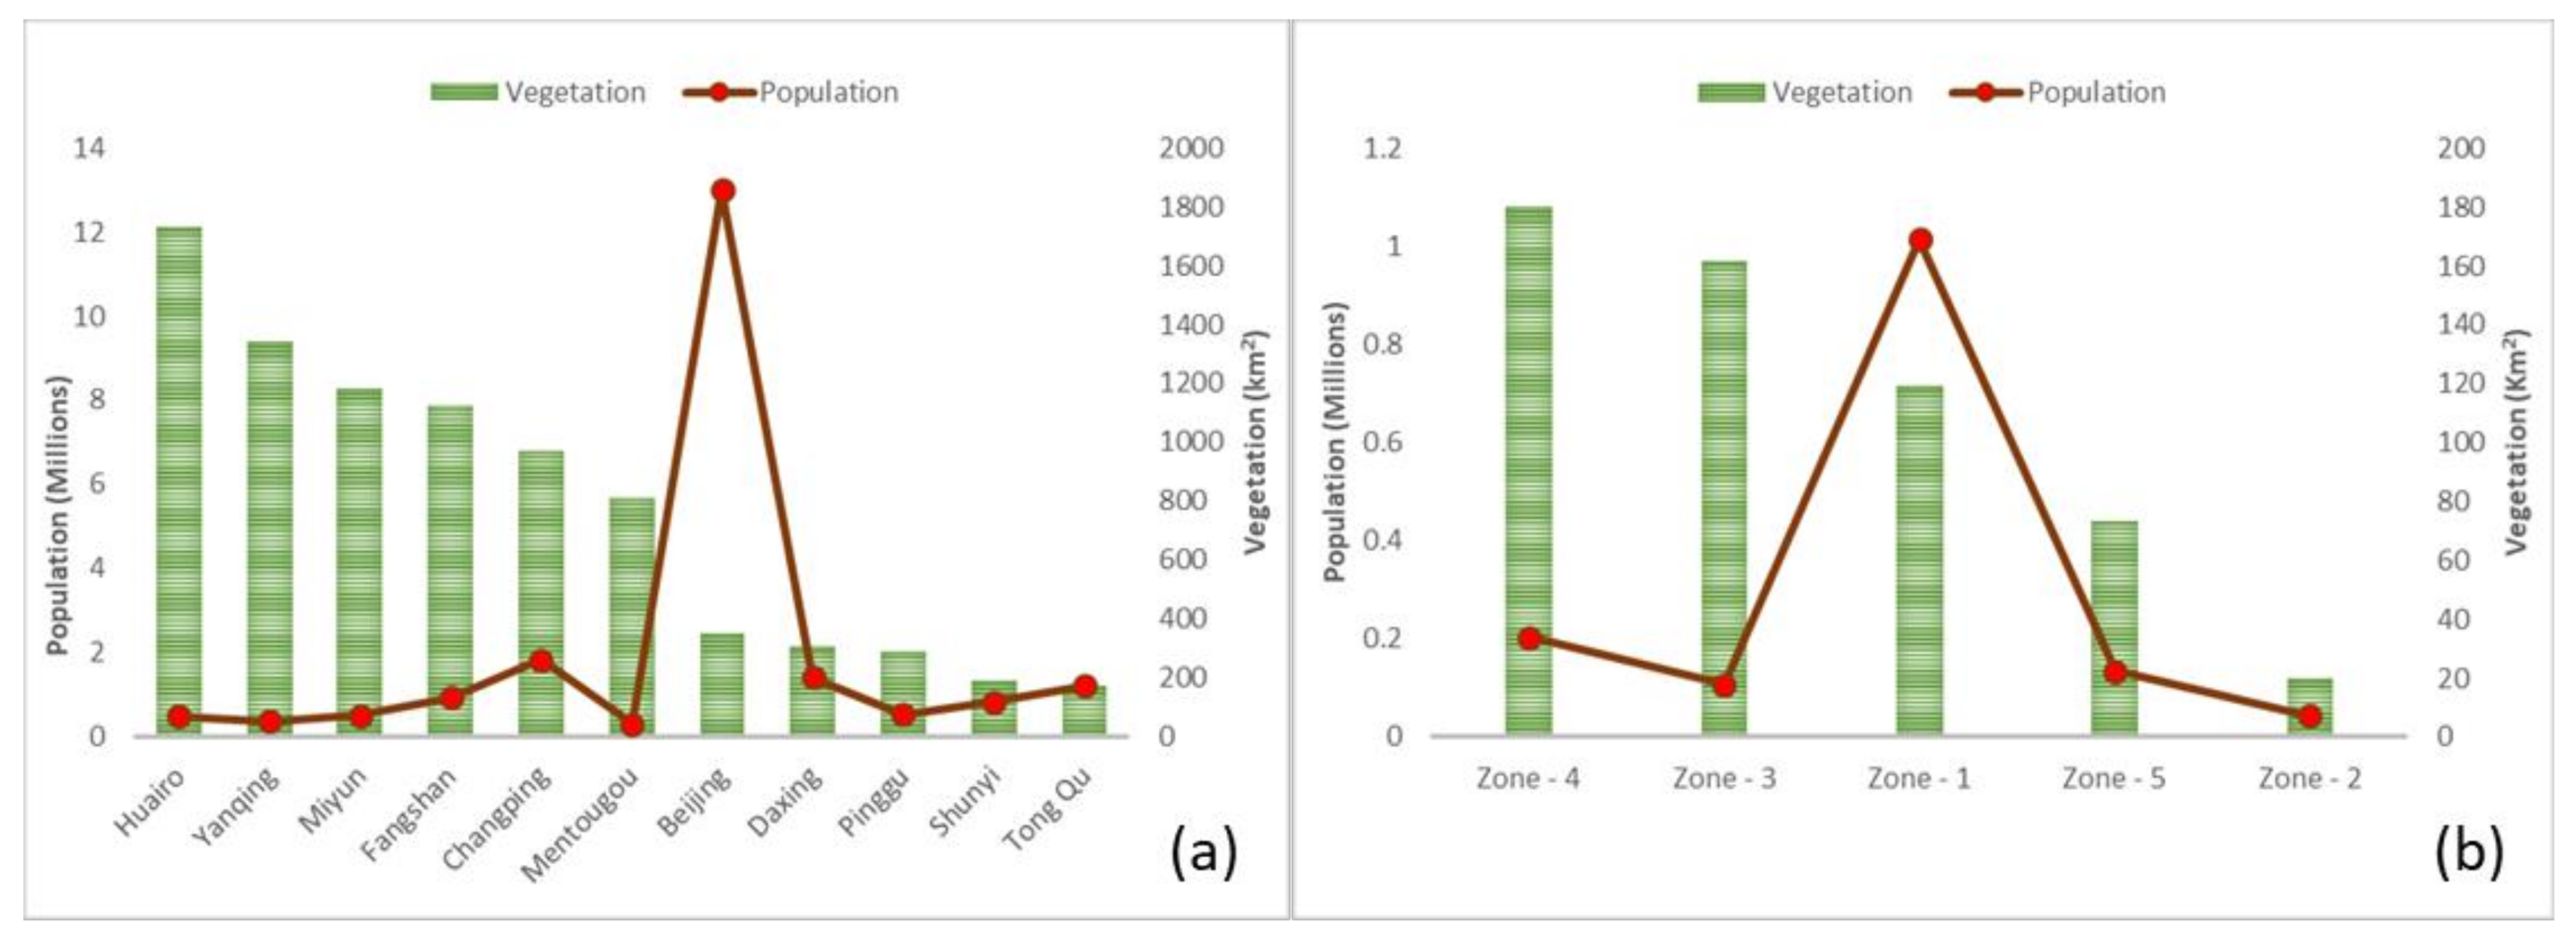
48], yet many environmental issues may arise if the current situation prevails. Comparatively better environmental conditions of Islamabad are due to less population density, low urbanization rate and a higher vegetation area per person (see Figure 10). However, the vegetation area per person ratio is decreasing rapidly with time.
Naeem et al. (2018) [48] compared the ecoenvironmental conditions and cooling effect of vegetation in local climatic zones of Beijing and Islamabad. Authors concluded that the cooling effect of vegetation in urban zones, and overall ecoenvironmental conditions of Islamabad are better than Beijing; which are due to less built-up area cover and higher vegetation fraction of Islamabad. Figure 10 describe the vegetation fraction per person in different administrative units of Beijing and Islamabad.
Though Beijing is a megacity as compare to Islamabad, the compactness of both cities, as determined by Polsby–Popper Test P P = 4 π A p 2 (where A is area and p is perimeter of the city), is comparable with Polsby–Popper score of 0.37 for Islamabad and 0.30 for Beijing [77].
In the absence of any landscape and CGI policy, no policy-based research on green space changes has even been conducted for Islamabad. Contrarily, the Chinese government has developed different land use, landscape and greening policies to mitigate the serious environmental issues of Beijing. For policy-based vegetation dynamics, Islamabad needed a referenced city for basic investigations. China and Pakistan are working on many projects of mutual interest like the China–Pakistan Economic Corridor (CPEC). Therefore, it is more of a possibility for collaboration to reach the UN’s Sustainable Development Goal 11—Sustainable Cities and Communities. The government of Pakistan needs to follow in China’s footsteps and should formulate landscape planning policies. Beijing’s policies can act as baseline while developing policies for Islamabad. Current research study can facilitate policy makers and land use planners, as Beijing’s landscape and greening policies are investigated in detail and situation is simulated for Islamabad. Urban landscape greening policies may be formulated by involving local community, stakeholders and experts through participatory GIS approach. A web-based multicriteria spatial decision support system (SDSS) can be designed to evaluation suitability of various factors like size, shape, location, type of proposed plantation etc. for increasing urban greenery [78,79,80].

5. Conclusions & Recommendations

The primary focus of current research study is Islamabad, as landscape greening policies of Beijing are in already in the implementation phase. These efforts are to inform urban planners and policy makers about the massive loss of natural resources of Islamabad. This study concludes that Beijing’s green area is increasing, and the rate of vegetation expansion is speeding up with time. With the current approach, Beijing will be able to mitigate existing environmental issues to some extent. The LGP policy was found to be more effective as compared to the UGWP and BAU scenarios. Islamabad needs to design landscape and greening policies like Beijing. Direct implementation of Beijing’s UGWP and LGP policies in Islamabad will just conserve or slightly improve the ongoing situation of CGI. There would no significant improvement in developing the green infrastructure of the city. It is therefore concluded that Beijing’s policies cannot be directly implemented on Islamabad, rather Beijing’s greening policies need to be updated according to the local conditions and available resources. With an effective policy, Islamabad’s government must take substantial actions against the drivers or sources of vegetation degradation.
Socioeconomic activities of Islamabad and Beijing are dissimilar, in addition, Beijing’s policies were developed according to the local circumstances. Therefore, results of the current study do not recommend any of Beijing’s CGI policies, even if it shows a perfect landscape scenario. Nevertheless, Beijing’s landscape and greening policies can be considered as a baseline to be updated according to the local circumstances of Islamabad. These policies are being implemented at the same time under different institutions; therefore, a collective effect on green resources would show an even better landscape scenario. This current study will be beneficial for researchers, urban planners and policy makers to design appropriate city layouts with proper management of CGI. If a single policy is not enough to fulfil the needs of city dwellers, then Islamabad should follow Beijing’s model of different policies under different institutions.
For further investigation, a WebGIS-based Spatial Decision Support System (SDSS) can be designed to effectively involve public authorities and stakeholders in the decision-making processes and in the collaborative definition of policies and strategies.

Acknowledgments

The work in this paper was financially supported by Comprehensive Survey of China Marshes Wetland Resource 19 and Ecological and Environmental Benefits (No. 2013FY1118063). Three authors, Shahid Naeem, Omaid Najmuddin and Bipin Kumar Acharya acknowledge the Chinese Academy of Sciences (CAS) and The World Academy of Sciences (TWAS) for awarding the CAS-TWAS President’s Fellowship to carry out the research. Authors also acknowledge SIMLAB (Institute of Geographic Sciences and Natural Resources (IGNRR), Beijing, China) for providing the Dynamics of Land System (DLS) model to simulate LULC changes.

Author Contributions

Shahid Naeem proposed the idea, compiled results and wrote this manuscript. ChunXiang Cao supervised with some fruitful ideas to make this work meaningful. Khunsa Fatima helped in compiling results and manuscript writing. Omaid Njmuddin and Bipin Kumar Acharya supported in data processing and manuscript revision.

Conflicts of Interest

Authors declare no conflicts of interest.

References

  1. Sustainable Development Goals: 17 Goals to Transform Our World. Available online: http://www.un.org/sustainabledevelopment/cities/ (accessed on 16 March 2018).
  2. Ganasri, B.; Aedla, R.; Dwarakish, G. Different approaches for land use land cover change detection: A review. Res. Rev. J. Eng. Technol. 2013, 2, 44–48. [Google Scholar]
  3. Duhamel, C. Land use, Land cover, including their classification. Encylopedia Life Support Syst. 2012, I, 1–9. [Google Scholar]
  4. Meyer, W.B.; Turner, B.I. Changes in Land Use and Land Cover: A Global Perspective; Cambridge University Press: Cambridge, UK, 1994. [Google Scholar]
  5. Paudel, B.; Zhang, Y.L.; Li, S.C.; Liu, L.S.; Wu, X.; Khanal, N.R. Review of studies on land use and land cover change in Nepal. J. Mt. Sci. 2016, 13, 643–659. [Google Scholar] [CrossRef]
  6. Zhou, W.; Huang, G.; Pickett, S.T.A.; Cadenasso, M.L. 90 years of forest cover change in an urbanizing watershed: Spatial and temporal dynamics. Landsc. Ecol. 2011, 26, 645–659. [Google Scholar] [CrossRef]
  7. Grimm, N.B.; Foster, D.; Groffman, P.; Grove, J.M.; Hopkinson, C.S.; Nadelhoffer, K.J.; Pataki, D.E.; Peters, D.P.C. The changing landscape: Ecosystem responses to urbanization and pollution across climatic and societal gradients. Front. Ecol. Environ. 2008, 6, 264–272. [Google Scholar] [CrossRef]
  8. Zhou, W.; Wang, J.; Cadenasso, M.L. Remote sensing of environment effects of the spatial configuration of trees on urban heat mitigation: A comparative study. Remote Sens. Environ. 2017, 195, 1–12. [Google Scholar] [CrossRef]
  9. Huang, G.; Cadenasso, M.L. People, landscape, and urban heat island: Dynamics among neighborhood social conditions, land cover and surface temperatures. Landsc. Ecol. 2016, 31, 2507–2515. [Google Scholar] [CrossRef]
  10. Zhou, W.; Qian, Y.; Li, X.; Li, W.; Han, L. Relationships between land cover and the surface urban heat island: Seasonal variability and effects of spatial and thematic resolution of land cover data on predicting land surface temperatures. Landsc. Ecol. 2014, 29, 153–167. [Google Scholar] [CrossRef]
  11. Seto, K.C.; Güneralp, B.; Hutyra, L. Global forecasts of urban expansion to 2030 and direct impacts on biodiversity and carbon pools. Proc. Natl. Acad. Sci. USA 2012, 109, 16083–16088. [Google Scholar] [CrossRef] [PubMed]
  12. Grimm, N.B.; Faeth, S.H.; Golubiewski, N.E.; Redman, C.L.; Wu, J.; Bai, X.; Briggs, J.M. Global change and the ecology of cities. Science 2008, 319, 756–760. [Google Scholar] [CrossRef] [PubMed]
  13. Han, L.; Zhou, W.; Li, W. Increasing impact of urban fine particles (PM2.5) on areas surrounding Chinese cities. Sci. Rep. 2015, 5, 12467. [Google Scholar] [CrossRef] [PubMed]
  14. Huang, G. PM2.5 opened a door to public participation addressing environmental challenges in China. Environ. Pollut. 2015, 197, 313–315. [Google Scholar] [CrossRef] [PubMed]
  15. Peng, J.; Chen, S.; Lü, H.; Liu, Y.; Wu, J. Spatiotemporal patterns of remotely sensed PM2.5 concentration in China from 1999 to 2011. Remote Sens. Environ. 2016, 174, 109–121. [Google Scholar] [CrossRef]
  16. Nichol, J.; Lee, C.M. Urban vegetation monitoring in Hong Kong using high resolution multispectral images. Int. J. Remote Sens. 2005, 26, 903–918. [Google Scholar] [CrossRef]
  17. Small, C. Estimation of urban vegetation abundance by spectral mixture analysis. Int. J. Remote Sens. 2001, 22, 1305–1334. [Google Scholar] [CrossRef]
  18. Zhang, X.; Feng, X.; Jiang, H. Object-oriented method for urban vegetation mapping using IKONOS imagery. Int. J. Remote Sens. 2010, 31, 177–196. [Google Scholar] [CrossRef]
  19. Tigges, J.; Lakes, T.; Hostert, P. Urban vegetation classification: Benefits of multitemporal rapid eye satellite data. Remote Sens. Environ. 2013, 136, 66–75. [Google Scholar] [CrossRef]
  20. Alonzo, M.; Bookhagen, B.; Roberts, D.A. Urban tree species mapping using hyperspectral and lidar data fusion. Remote Sens. Environ. 2014, 148, 70–83. [Google Scholar] [CrossRef]
  21. Tooke, T.R.; Coops, N.C.; Goodwin, N.R.; Voogt, J.A. Extracting urban vegetation characteristics using spectral mixture analysis and decision tree classifications. Remote Sens. Environ. 2009, 113, 398–407. [Google Scholar] [CrossRef]
  22. Li, X.; Shao, G. Object-based urban vegetation mapping with high-resolution aerial photography as a single data source. Int. J. Remote Sens. 2013, 34, 771–789. [Google Scholar] [CrossRef]
  23. Johansen, K.; Coops, N.C.; Gergel, S.E.; Stange, Y. Application of high spatial resolution satellite imagery for riparian and forest ecosystem classification. Remote Sens. Environ. 2007, 110, 29–44. [Google Scholar] [CrossRef]
  24. Höfle, B.; Hollaus, M.; Hagenauer, J. Urban vegetation detection using radiometrically calibrated small-footprint full-waveform airborne lidar data. ISPRS J. Photogramm. Remote Sens. 2012, 67, 134–147. [Google Scholar] [CrossRef]
  25. Powell, R.L.; Roberts, D.A.; Dennison, P.E.; Hess, L.L. Sub-pixel mapping of urban land cover using multiple endmember spectral mixture analysis: Manaus, Brazil. Remote Sens. Environ. 2007, 106, 253–267. [Google Scholar] [CrossRef]
  26. Rosa, D.L.; Wiesmann, D. Land cover and impervious surface extraction using parametric and non-parametric algorithms from the open-source software R: An application to sustainable urban planning in Sicily. GISci. Remote Sens. 2013, 50, 231–250. [Google Scholar]
  27. Bolund, P.; Hunhammar, S. Ecosystem services in urban areas. Ecol. Econ. 1999, 29, 293–301. [Google Scholar] [CrossRef]
  28. Chang, C.-R.; Li, M.-H. Effects of urban parks on the local urban thermal environment. Urban For. Urban Green. 2014, 13, 672–681. [Google Scholar] [CrossRef]
  29. Akpinar, A.; Barbosa-Leiker, C.; Brooks, K.R. Does green space matter? Exploring relationships between green space type and health indicators. Urban For. Urban Green. 2016, 20, 407–418. [Google Scholar] [CrossRef]
  30. Santamouris, M. The role of green spaces. In Energy and Climate in the Urban Built Environment; James & James: Springdale, AR, USA, 2001; pp. 145–159. [Google Scholar]
  31. Chen, X.; Su, Y.; Li, D.; Huang, G.; Chen, W.; Chen, S. Study on the cooling effects of urban parks on surrounding environments using landsat TM data: A case study in Guangzhou, Southern China. Int. J. Remote Sens. 2012, 33, 5889–5914. [Google Scholar] [CrossRef]
  32. Shashua-Bar, L.; Hoffman, M.E. Vegetation as a climatic component in the design of an urban street: An empirical model for predicting the cooling effect of urban green areas with trees. Energy Build. 2000, 31, 221–235. [Google Scholar] [CrossRef]
  33. Derkzen, M.L.; Teeffelen, A.J.; Verburg, P.H. Review: Quantifying urban ecosystem services based on high-resolution data of urban green space: An assessment for Rotterdam, The Netherlands. J. Appl. Ecol. 2015, 52, 1020–1032. [Google Scholar] [CrossRef]
  34. Zhang, B.; Gao, J.-X.; Yang, Y. The cooling effect of urban green spaces as a contribution to energy-saving and emission-reduction: A case study in Beijing, China. Build. Environ. 2014, 76, 37–43. [Google Scholar] [CrossRef]
  35. Park, J.; Kim, J.-H.; Lee, D.K.; Park, C.Y.; Jeong, S.G. The influence of small green space type and structure at the street level on urban heat island mitigation. Urban For. Urban Green. 2016, 21, 203–212. [Google Scholar] [CrossRef]
  36. Hamada, S.; Ohta, T. Seasonal variations in the cooling effect of urban green areas on surrounding urban areas. Urban For. Urban Green. 2010, 9, 15–24. [Google Scholar] [CrossRef]
  37. Susca, T.; Gaffin, S.; Dell’Osso, G. Positive effects of vegetation: Urban heat island and green roofs. Environ. Pollut. 2011, 159, 2119–2126. [Google Scholar] [CrossRef] [PubMed]
  38. Bertram, C.; Rehdanz, K. The role of urban green space for human well-being. Ecol. Econ. 2015, 120, 139–152. [Google Scholar] [CrossRef]
  39. Weng, Q.; Lu, D.; Schubring, J. Estimation of land surface temperature—Vegetation abundance relationship for urban heat island studies. Remote Sens. Environ. 2004, 89, 467–483. [Google Scholar] [CrossRef]
  40. Seto, K.C.; Woodcock, C.E.; Song, C.; Huang, X.; Lu, J.; Kaufmann, R.K. Monitoring land-use change in the pearl river delta using landsat TM. Int. J. Remote Sens. 2002, 23, 1985–2004. [Google Scholar] [CrossRef]
  41. Qian, Y.; Zhou, W.; Li, W.; Han, L. Understanding the dynamic of greenspace in the urbanized area of Beijing based on high resolution satellite images. Urban For. Urban Green. 2015, 14, 39–47. [Google Scholar] [CrossRef]
  42. Wolch, J.R.; Byrne, J.; Newell, J.P. Urban green space, public health, and environmental justice: The challenge of making cities ‘just green enough’. Landsc. Urban Plan. 2014, 125, 234–244. [Google Scholar] [CrossRef]
  43. Li, F.Z.; Sun, Y.; Li, X.; Hao, X.; Li, W.; Qian, Y.; Liu, H.; Sun, H. Research on the sustainable development of green-space in Beijing using the dynamic systems model. Sustainability 2016, 8, 965. [Google Scholar] [CrossRef]
  44. Li, F.; Lu, S.; Sun, Y.; Li, X.; Xi, B.; Liu, W. Integrated evaluation and scenario simulation for forest ecological security of Beijing based on system dynamics model. Sustainability 2015, 7, 13631–13659. [Google Scholar] [CrossRef]
  45. “13th Five-Year” Landscape and Greening Plan of Beijing. Available online: http://www.xinhuanet.com/local/2016-01/06/c_128600299.htm (accessed on 16 December 2017).
  46. Beijing Municipal Bureau of Statistics (BMBS). In Beijing Statistical Yearbook; China State Statistical Press: Beijing, China, 2015.
  47. Statistical Results of Urban Greening Resources in Beijing. 2015. Available online: http://www.bjyl.gov.cn/zwgk/tjxx/201604/t20160401_178532.html (accessed on 5 April 2016).
  48. Naeem, S.; Cao, C.; Waqar, M.M.; Wei, C.; Acharya, B.K. Vegetation role in controlling the ecoenvironmental conditions for sustainable urban environments: A comparison of Beijing and Islamabad. J. Appl. Remote Sens. 2018, 12, 016013. [Google Scholar] [CrossRef]
  49. Notice of Supreme Court of Pakistan on Illegal Encroachments and Deforestation in Posh Area of Islamabad Near Bani Gala. Available online: https://www.dawn.com/news/1350136 (accessed on 10 January 2018).
  50. Notice of Beijing Municipal Bureau of Landscape and Forestry on Printing and Distributing the Work Plan of Urban Greening in 2016. Available online: http://www.bjyl.gov.cn/zwgk/fgwj/qtwj/201602/t20160202_176411.shtml (accessed on 2 February 2015).
  51. Butt, M.J.; Ahmad, W.; Iqbal, M.F.; Muhammad, G.; Lodhi, M.A.K. Assessment of urban sprawl of Islamabad metropolitan area using multi-sensor and multi-temporal satellite data. Arab. J. Sci. Eng. 2012, 37, 101–114. [Google Scholar] [CrossRef]
  52. Pontius, R.G.; Cornell, J.D.; Hall, C.A.S. Modeling the spatial pattern of land-use change with GEOMOD2: Application and validation for Costa Rica. Agric. Ecosyst. Environ. 2001, 85, 191–203. [Google Scholar] [CrossRef]
  53. Li, X.; Yeh, A.O. Neural-network-based cellular automata for simulating multiple land use changes using GIS. Int. J. Geogr. Inf. Sci. 2002, 16, 323–343. [Google Scholar] [CrossRef]
  54. Pijanowski, B.C.; Brown, D.G.; Shellitoc, B.A.; Manikd, G.A. Using neural nets and GIS to forecast land use changes: A land transformation model. Comput. Environ. Urban Syst. 2002, 26, 553–575. [Google Scholar] [CrossRef]
  55. Onkal-Engin, G.; Demir, I.; Hiz, H. Assessment of urban air quality in Istanbul using fuzzy synthetic evaluation. Atmos. Environ. 2004, 38, 3809–3815. [Google Scholar] [CrossRef]
  56. Lundquist, J.E. Use of fourier transforms to define landscape scales of analysis for disturbances: A case study of thinned and un thinned forest stands. Landsc. Ecol. 2002, 17, 445–454. [Google Scholar] [CrossRef]
  57. Das, M.; Kumar, A.; Mohapatra, M.; Muduli, S.D. Evaluation of drinking quality of groundwater through multivariate techniques in urban area. Environ. Monit. Assess. 2010, 166, 149–157. [Google Scholar] [CrossRef] [PubMed]
  58. Deng, X.Z.; Su, H.B.; Zhan, J.Y. Integration of multiple data sources to simulate the dynamics of land systems. Sensors 2008, 8, 620–634. [Google Scholar] [CrossRef] [PubMed]
  59. Verburg, P.H.; Soepboer, W.V.A.; Limpiada, R.V.A.; Espaldon, V. Modeling the spatial dynamics of regional land use: The CLUE-S model. Environ. Manag. 2002, 30, 391–405. [Google Scholar] [CrossRef] [PubMed]
  60. Memon, G.R. Education in Pakistan: The key issues, problems and the new challenges. J. Manag. Soc. Sci. 2007, 3, 47–55. [Google Scholar]
  61. Baatz, M. Multiresolution segmentation: An optimization approach for high quality multiscale image segmentation. In Angewandte Geographische Informations-Verarbeitung XII; Strobl, J., Blaschke, T., Griesbner, G., Eds.; Wichmann Verlag: Karlsruhe, Germany, 2000; pp. 12–23. [Google Scholar]
  62. Lang, S.; Tiede, D. Definiens developer. In GIS Business 9/2007; ABC Verlag: Munich, Germany, 2007; pp. 12–23. [Google Scholar]
  63. Neubert, M.; Herold, H.; Meinel, G. Assessing image segmentation quality—Concepts, methods and application. In Object-Based Image Analysis; Springer: Berlin/Heidelberg, Germany, 2008; pp. 769–784. [Google Scholar]
  64. Yang, Z.Q.; Dong, J.; Liu, J.; Zhai, J.; Kuang, W.; Zhao, G.; Shen, W.; Zhou, Y.; Qin, Y. Accuracy assessment and inter-comparison of eight medium resolution forest products on the Loess Plateau, China. ISPRS Int. J. Geo-Inf. 2017, 6, 152. [Google Scholar] [CrossRef]
  65. Zhen, L.; Deng, X.; Wei, Y.; Jiang, Q.; Lin, Y.; Helming, K.; Wang, C.; König, H.; Hu, J. Future land use and food security scenarios for the guyuan district of remote western China. iForest 2014, 7, 372–384. [Google Scholar] [CrossRef]
  66. Jin, M.J.; Li, J.; Wang, C.; Shang, R. A practical split-window algorithm for retrieving land surface temperature from Landsat-8 data and a case study of an urban area in China. Remote Sens. 2015, 7, 4371–4390. [Google Scholar] [CrossRef]
  67. Pakistan Meteorological Department (PMD) and China Meteorological Administration (CMA): Data of China. Available online: http://www.cma.gov.cn/ (accessed on 14 July 2017).
  68. Earth Data Search. Available online: https://search.earthdata.nasa.gov/ (accessed on 13 November 2017).
  69. ISRIC: World Soil Information. Available online: https://www.soilgrids.org/#!/?layer=PHIHOX_M_sl2_250m (accessed on 11 October 2016).
  70. Lloyd, C.T.; Sorichetta, A.; Tatem, A.J. High resolution global gridded data for use in population studies. Sci. Data 2017, 4, 170001. [Google Scholar] [CrossRef] [PubMed]
  71. DIVA-GIS. Roads Data. Available online: http://www.diva-gis.org/gdata (accessed on 10 October 2016).
  72. Eric, P.J.; Beurs, K.M.B.; Hartkamp, A.D. Kriging and thin plate splines for mapping climate variables. Int. J. Appl. Earth Obs. Geoinform. 2001, 3, 146–154. [Google Scholar]
  73. Samie, A.; Xiangzheng, D.; Siqi, J.; Dongdong, C. Scenario-based simulation on dynamics of land-use-land-cover change in Punjab province, Pakistan. Sustainability 2017, 9, 1285. [Google Scholar] [CrossRef]
  74. Development Proposal of Beijing Municipal Party Committee on the 13th Five-Year National Economy and Social Development Plan of Beijing. Available online: http://bj.people.com.cn/n/2015/1208/c82837–27272223.html (accessed on 8 December 2015).
  75. Ligtenberg, A.; Bregt, A.K.; Lammeren, R.V. Multi-actor-based land use modeling: Spatial planning using agents. Landsc. Urban Plan. 2001, 56, 21–33. [Google Scholar] [CrossRef]
  76. Zhan, J.; Deng, X.; Jiang, Q.; Shi, N. The application of system dynamics and CLUE-S model in land use change dynamic simulation: A case study in Taips County, Inner Mongolia of China. In Proceedings of the Conference on System Science, Management Sciences and System Dynamics: Sustainable Development and Complex System, Shanghai, China, 19–25 October 2007; pp. 2781–2789. [Google Scholar]
  77. Polsby-Popper Test. Available online: https://www.revolvy.com/main/index.php?s=Polsby-Popper%20Test (accessed on 23 March 2018).
  78. De Longueville, B. Community-based geoportals: The next generation? Concepts and methods for the geospatial Web 2.0. Comput. Environ. Urban Syst. 2010, 34, 299–308. [Google Scholar] [CrossRef]
  79. Pollino, M.; Modica, G. Free web mapping tools to characterise landscape dynamics and to favour e-participation. In International Conference on Computational Science and Its Applications; Springer: Berlin, Germany, 2013; pp. 566–581. [Google Scholar]
  80. Modica, G.; Paolo, Z.; Salvatore, D.F. The e-participation in tranquillity areas identification as a key factor for sustainable landscape planning. In International Conference on Computational Science and Its Applications; Springer: Berlin, Germany, 2013; pp. 550–565. [Google Scholar]
Figure 1. Study area map highlighting Islamabad and Beijing.
Sustainability 10 01049 g001
Figure 2. LULC classification of (a) Beijing for year 2010; (b) Beijing for year 2015; (c) Islamabad for year 2010; (d) Islamabad for year 2015.
Sustainability 10 01049 g002
Figure 3. DLS modules for LULC simulation (Source Deng et al. [58]).
Sustainability 10 01049 g003
Figure 4. Actual and simulated LULC for 2015: (a) Actual LULC classification of Beijing; (b) Simulated LULC classification of Beijing; (c) Actual LULC classification of Islamabad; (d) Simulated LULC classification of Islamabad.
Sustainability 10 01049 g004
Figure 5. LULC change simulation of Beijing—under three scenarios: (a) Business-as-usual 2020; (b) Business-as-usual 2025; (c) Urban Green Space Work Plan 2020; (d) Urban Green Space Work Plan 2025; (e) Landscape and Greening Plan 2020; (f) Landscape and Greening Plan 2025.
Sustainability 10 01049 g005
Figure 6. LULC change simulation of Islamabad city under three scenarios: (a) Business-as-usual 2020; (b) Business-as-usual 2025; (c) Urban Green Space Work Plan 2020; (d) Urban Green Space Work Plan 2025; (e) Landscape and Greening Plan 2020; (f) Landscape and Greening Plan 2025.
Sustainability 10 01049 g006
Figure 7. Statistics of Beijing: (a) mixed vegetation; (b) urban green spaces; (c) built-up area; (d) agricultural land; (e) water bodies; (f) bare area.
Sustainability 10 01049 g007
Figure 8. Statistics of Islamabad: (a) mixed vegetation; (b) urban green spaces; (c) built-up area; (d) agricultural land; (e) water bodies; (f) bare area.
Sustainability 10 01049 g008
Figure 9. Directional analysis of LULC classes sprawl under BAU scenario. (a) Mixed vegetation class of Beijing; (b) urban green spaces of Beijing; (c) mixed vegetation class of Islamabad; (d) urban green spaces of Islamabad.
Sustainability 10 01049 g009
Figure 10. Graphical representation of vegetation area per person for (a) Beijing; (b) Islamabad.
Sustainability 10 01049 g010
Table 1. Spectral and spatial characteristics of Landsat (TM) and Landsat-8 (OLI).
Satellite NameSpectral ModeSpatial Resolution
Landsat (TM)Multispectral30 × 30
Panchromatic15 × 15
Thermal infrared120 × 120
Landsat-8 (OLI)Multispectral30 × 30
Panchromatic15 × 15
Thermal infrared100 × 100
Table 2. Class names along description for LULC mapping.
Class NameDescription
Mixed vegetationThis class includes all the forest types, shrubland and grassland outside the urban periphery
Urban green spacesThis class consists of all the green land inside the urban periphery. For example, green belts, parks, grounds etc.
Built-up areaBuilt-up area class includes all kinds of construction land. For example, industrial land, residential land, commercial land, metallic roads etc.
AgricultureIt is the area covered by all types of crop land (cultivated or maintained) and orchards
Water bodiesArea covered by lakes, rivers and drainages
Bare AreaArea covered by barren rocks, sand, and bare soil.
Table 3. Accuracy assessment of LULC classification based on OBIA of Beijing for years 2010 and 2015.
Beijing
20102015
Class NameNo. of SamplesTotal AreaUser’s AccuracyProducer’s AccuracyTotal AreaUser’s AccuracyProducer’s Accuracy
Mixed Vegetation237106.0290.7093.06111.9191.7493.85
Urban Green Spaces8744.0285.2284.3348.4187.4586.68
Built-up Area17279.1284.0986.0580.7285.4087.22
Agriculture Area9657.1686.5487.9372.2890.0191.08
Water Bodies6626.4679.8275.6624.3879.5175.31
Others11051.6081.7675.9360.3085.6380.75
Overall Accuracy85.9988.01
Kappa (k)0.840.87
Table 4. Accuracy assessment of LULC classification based on OBIA of Islamabad for years 2010 and 2015.
Islamabad
20102015
Class NameNo. of SamplesTotal AreaUser’s AccuracyProducer’s AccuracyTotal AreaUser’s AccuracyProducer’s Accuracy
Mixed Vegetation13573.9090.2493.5671.3587.9191.96
Urban Green Spaces6934.4689.7386.1943.2990.1686.74
Built-up Area12161.1486.2587.2159.6183.0484.18
Agriculture Area6845.1290.3591.7152.4890.0091.41
Water Bodies4618.6478.7774.4623.8680.0775.94
Others9642.6483.3980.0749.3682.6779.23
Overall Accuracy87.5586.19
Kappa (k)0.860.85
Table 5. Variables along their influential factors for simulation of LULC classification.
CategoryInfluential FactorDescriptionSource
Climatic variablesLand Surface Temperature (LST)Calculated using split-window algorithms [66]Landsat (OLI) and Landsat (TM)
Air TemperatureAnnual average air temperature (°C)Pakistan Meteorological department (PMD) and China Meteorological Administration (CMA) [67]
PrecipitationTotal annual precipitation (mm)
Geophysical variablesElevationASTER Digital Elevation Model (DEM) 30 m[68]
Slope
Soil pHSoil depth for pH is 0.05 mWorld Soil Information [69]
Soil DepthSoil depth up to 2 m
Soil Content(2 to 50 micro-meter) mass fraction (%) [0.05 m depth]
Socio-economic VariablesPopulation DensityEstimates of number of people per grid square (persons/km2) [70][70]
Proximity VariablesDistance from urban centersEuclidian distance from the city center (km)DIVA-GIS [71]
Distance from the intercity roadsEuclidian distance from the highway and expressway (km)
Distance from the highwaysEuclidian distance from the city center (km)
Table 6. Transition matrix of LULC classes for year 2010 and 2015—Beijing city.
2015→
2010↓Class NameMixed VegetationUrban Green SpacesBuilt-Up AreaAgricultureWater BodiesBare Area
Mixed Vegetation0.9700.0040.0060.0070.0520.340
Urban Green Spaces0.0030.5500.0420.0210.0000.004
Built-up Area0.0040.4040.9190.1210.0030.046
Agriculture0.0040.0260.0140.8390.0090.014
Water bodies0.0000.0090.0030.0070.8500.020
Bare Area0.0180.0070.0150.0050.0860.576
Grand Total1.0001.0001.0001.0001.0001.000
Conversion Rule0.0300.4500.0810.1610.1500.424
Table 7. Transition matrix of LULC classes for year 2010 and 2015—Islamabad city.
2015→
2010↓Class NameMixed VegetationUrban Green SpacesBuilt-Up AreaAgricultureWater BodiesBare Area
Mixed Vegetation0.9700.0030.0090.0070.0520.341
Urban Green Spaces0.0030.6420.0380.0210.0000.003
Built-up Area0.0040.3110.9090.1200.0030.045
Agriculture0.0040.0260.0190.8390.0080.013
Water bodies0.0000.0090.0040.0070.8530.020
Bare Area0.0180.0090.0210.0050.0830.578
Grand Total1.0001.0001.0001.0001.0001.000
Conversion Rule0.0300.3580.0910.1610.1470.422
Table 8. Accuracy assessment matrix between image classified and DLS’s simulated LULC classes of Beijing city for 2015.
Classification by Landsat Image
Simulation by DLS ModelClass NameMixed VegetationUrban Green SpacesBuilt-Up AreaAgricultural LandWater BodiesBare Area
Mixed Vegetation98.1112.4073.4100.8071.6111.577
Urban Green Spaces0.06689.0021.1390.3280.2290.949
Built-up Area0.5814.14394.4491.6223.8432.313
Agriculture1.1713.7200.49096.3092.5156.177
Water Bodies0.0240.4490.1310.04891.2371.925
Bare Area0.0470.2790.3800.8850.56687.059
Kappa = 94.4%
Table 9. Accuracy assessment matrix for LULC classification of Islamabad city.
Classification by Landsat Image
Simulation by DLS ModelClass NameMixed VegetationUrban Green SpacesBuilt-up AreaAgricultural LandWater BodiesBare Area
Mixed Vegetation95.0950.9020.4380.4642.6194.748
Urban Green Spaces1.81687.4330.5083.0700.5560.203
Built-up Area2.3371.00596.2074.8790.3101.324
Agriculture0.7340.0272.53391.5670.3740.330
Water Bodies0.0130.3580.0150.00995.9270.143
Bare Area0.00410.2740.2990.0120.21493.253
Kappa = 91.9%

