1. Introduction
Desalination and wastewater treatment based on membrane technology comprise one of the approaches that has been extensively explored over the past two decades to tackle the challenges of increasing access to clean drinking water resulting from the rapidly-growing global population, as well as economic development [
1]. It was reported that approximately 50% of the world’s desalination capacity has been installed in the Middle East region [
1]. Kuwait, for instance, has six multi-stage flash (MSF) and two seawater reverse osmosis (SWRO) plants with a total plant capacity of 2 million m
3/day [
2,
3]. This is sufficient for the 3.4 million population’s daily consumption.
Although the reverse osmosis (RO) membrane process has been employed for seawater desalination without significant technical drawbacks since the 1970s, statistics have revealed that its operating cost per cubic meter of water produced is significantly decreased due to the improvements of membrane fabrication techniques and the entire operating system [
4,
5]. Energy consumption being a vital component that characterizes the performance of RO processes, it also influences the produced freshwater costs. Gude et al. [
6] summarized that the use of energy recovery devices (ERDs), high permeable membranes, two pass-two stage RO operations, water recovery options by reuse and recycling the permeate water for multiple uses will reduce the energy consumption and production costs in small and a wide range of applications. A recent work by Karabelas et al. [
7] on the analysis of specific energy consumption (SEC) in RO processes of seawater and brackish water concluded that SEC can be reduced by improving the membrane permeability and efficiency of pumps along with ERD. Management of brine effluents from desalination plants however is still a challenge that needs to be addressed. The MSF process dominates the desalination industry in Kuwait, where 1.47 million m
3/d of the total desalination capacity of 1.65 million m³/d are provided by MSF and 0.17 million m
3/d is only supplied by reverse osmosis (RO) [
3]. Desalination of seawater in Kuwait, in general, produces a brine discharge with a total dissolved solid (TDS) concentration of 70,000 ppm (i.e., almost twice the TDS of seawater) [
8]. This brine of extremely high salinity that gets disposed into Kuwait’s coastal waters would create a negative impact on the marine ecosystem and must be managed sustainably and efficiently [
9]. Numerous studies have shown that appropriate utilization of highly concentrated brine solution with diluted treated wastewater or seawater via pressure-retarded osmosis (PRO) not only can mitigate the severe environmental impacts from brine discharge, but also generate substantial energy output from the feed and draw salinity gradient [
10,
11,
12].
The first mathematical model was proposed by Loeb in 1976 [
13], who studied the simulation of PRO performance with the combination of different solutions such as seawater and fresh water or highly saline bodies such as the Dead Sea and seawater to generate osmotic power. Since then, a few models have been proposed and developed by researchers to improve the performance of using PRO membranes by minimizing the effect of concentration polarization [
14], as well as the salt reversal from the draw to feed side [
15]. In 1981, Lee et al. [
16] developed a zero-dimensional performance model that dealt with the effects of internal concentration polarization (ICP) of the PRO membrane. After that, a similar research study was conducted by McCutcheon [
17] to further determine the combined effects of both internal and external concentration polarization (ECP) on the performance of forward osmosis (FO) and PRO membranes. It was reported that a zero-dimensional (0D) model can be used to investigate the effects of various operating parameters such as the salinity level of feed and draw solutions, flow velocities, hydraulic pressure and membrane characteristics on PRO power generation [
18,
19]. Recently, He et al. [
20] developed a simple PRO model by considering the detrimental effects of ICP, ECP and reverse salt permeation (RSP) to evaluate the actual flux and power density of a PRO system and also to address the behavior of a PRO process at different applied pressures. Naguib et al. [
21], on the other hand, developed a mathematical model for PRO processes in commercial length hollow fiber membranes with respect to the effects of ICP, ECP and RSP. They found that the reduction in the concentration gradient due to polarization and axial variation was proportionately increased at high membrane flux. Addressing the detrimental axial variations helps to minimize polarization, but comes with a cost of increased pumping loads. Previously, our research group [
22] examined the feasibility of using PRO to generate energy from wastewater and desalination plants in Kuwait by performing the sensitivity analysis and calculating the power density using a PRO 0D model. The effects of concentration polarization (CP) and salt leakage (B′) on the power density at varying applied pressures and concentration differences between the feed and draw solutions were studied. The results showed that the effects of CP and B′ on the power fraction were high at lower concentration differences, which might lead to lower flux and salt rejection caused by the decreasing driving force. Therefore, CP and B′ effects can be nullified at a high concentration gradient.
As much of the literature focuses on lab-scale transport through a membrane by assuming that the concentrations along the membrane for both flow streams are constant, which might result in under-sizing exchangers for use in large systems because the average osmotic driving force across a long membrane is lower than the maximum osmotic driving force in a 0D transport model [
23], therefore, a large system must be sized with a model that considers the change in driving force along the membrane length. In 2013, Shaqawy et al. [
24] developed a one-dimensional (1D) analytical expressions for parallel and counterflow PRO mass exchangers with respect to the recovery ratio of the membrane as a function of dimensionless parameters such as mass transfer units (MTU), mass flowrate ratio (MR) and osmotic pressure ratio (SR). They developed the first ε-MTU model for the osmotic mass exchanger, which can be used as a design tool for PRO systems. It was further extended later to estimate the required area of a PRO exchanger to determine the power production at a given feed and draw salinity by considering the effect of CP on the membrane performance [
25]. Similar methods were also used by their research group to acquire the designated area of a forward osmosis (FO) and an assisted forward osmosis (AFO) system on the application of fertigation [
23].
In this study, 1D model equations for parallel flow configuration are employed to determine the required mass transfer units (MTU) to achieve high permeation and power generation using actual operational data from the desalination industry in Kuwait. This study will focus on the relationship between MTU with different dimensionless groups such as mass flowrate ratio (MR), recovery ratio (RR), concentration factors (CF), effectiveness (ε), dilution rate ratio (DRR) and dilution rate (DR), which relate the actual permeation to the draw stream. Furthermore, the maximum work simulated from these analytical expressions will be discussed, as well.
2. Pressure-Retarded Osmosis Mass Exchanger Model in a Parallel-Flow Configuration
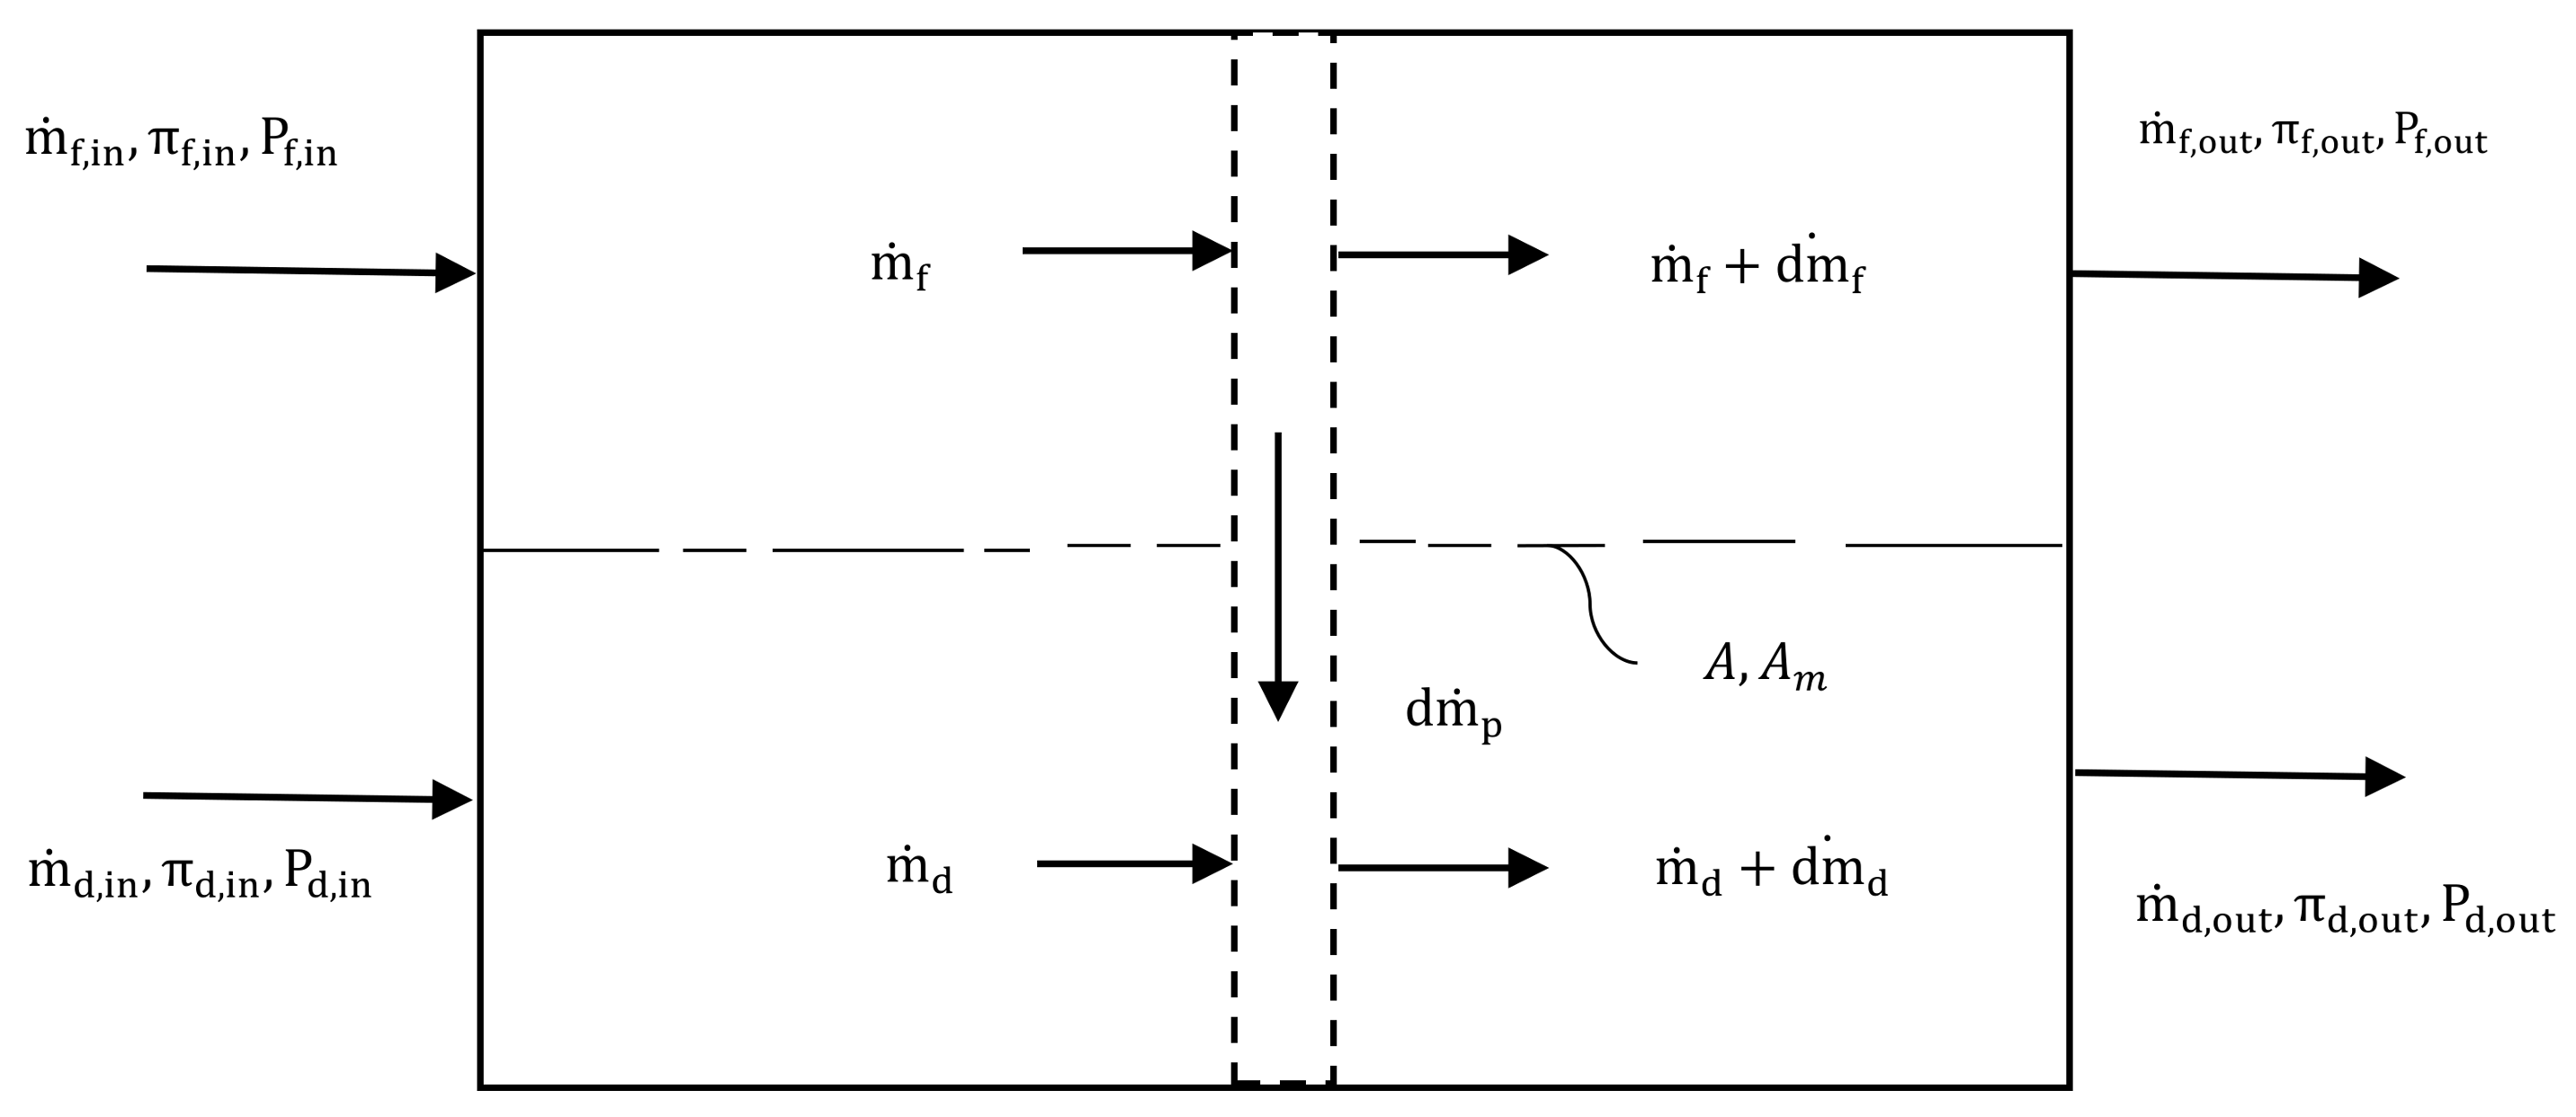
Figure 1 shows the schematic diagram of a PRO mass exchanger device [
23]. Herein, the feed solution of a lower concentration flows into the channel on one side, through a semipermeable membrane. On the other side of the membrane, the draw solution of a higher concentration flows into the channel. The flow direction of the draw solution is in the same direction as that of the feed, and it is called the parallel flow configuration, as shown in
Figure 1.
The differential permeate flowrate in a PRO parallel-flow configuration is given in Equation (1):
where
= permeate mass flowrate through membrane (kg/s),
= water permeability coefficient of the membrane
,
= difference in hydraulic pressure between the draw
and feed
solution
,
= difference in osmotic pressures between the draw
and feed
solution
and
= surface area of the membrane
.
Applying the van’t Hoff law for osmotic pressure as shown in Equation (2),
where
and
are the salt concentration or salinity in
for the feed and draw solution, respectively, while
is the modified van’t Hoff coefficient. Substituting Equation (2) into Equation (1) yields:
We assume that there is 100% salt rejection and only pure water permeates through the membrane. Therefore, the salinity of the permeate is zero. Applying the conservation of solutes to the feed stream between the inlet and any arbitrary location along the flow channel yields,
For the same arbitrary control volume for the feed stream, the conservation of solution requires,
Substituting Equation (5) into Equation (4) yields:
Applying the conservation of solutes and solution on the draw side of the parallel model gives,
Substituting Equations (6) and (7) into Equation (3) gives,
It is required that Equation (8) be cast into dimensionless form, and hence, four parameters are used for this purpose as follows:
- (a)
The recovery ratio (RR) is defined as the ratio of the total mass flowrate of the permeate recovered from the feed stream to the mass flowrate of the incoming feed stream. It represents the amount of pure water that can be recovered from the feed stream [
25]. The RR is given by:
- (b)
The mass flowrate ratio (MR) is the ratio of the mass flowrate of the draw solution to that of the feed solution at the inlet of the PRO mass exchanger. The MR is given by:
- (c)
The osmotic pressure ratio (SR) is defined as the ratio of osmotic pressure at the draw or feed inlet to the difference in hydraulic pressure.
In a PRO operation, SR at the draw side will be greater than the SR at the feed side.
- (d)
Mass transfer units (MTU):
where:
Here, Equation (19) represents the expression to find the mass transfer units and is used to design a mass exchanger.
In order to determine the maximum transfer units allowed through a membrane when the output salinity of the brine is limited to a salinity lower than a certain limit, the concentration factor (CF) is used. The CF at the draw and the feed side are given by Equations (20) and (21).
3. Parallel Flow PRO Effectiveness
The effectiveness of the PRO system can be defined as the ratio of the permeate flowrate to the maximum permeate flowrate [
25], which occurs when MTU is increased to infinity. The maximum permeate flowrate is achieved when
between the feed and the permeate increases to a point such that
at the exit of the channel. The effectiveness can also be defined as the recovery ratio divided by the maximum recovery ratio. The following is a derivation of the effectiveness of the PRO exchanger.
Using Equation (1), the maximum permeate in the case of the parallel flow configuration will occur when the hydraulic pressure difference is equal to the osmotic pressure difference at the outlet, as shown in Equation (22),
Using the van’t Hoff model,
Applying the conservation of solutes and solution on the draw and feed side, one can find that:
Substituting Equations (24) and (25) into Equation (23) and replacing those variables with the dimensional group defined previously can yield Equation (26):
Solving Equation (26) to find RR
max, there are two solutions that can be yielded,
where
and
can be found in Equations (17) and (18), respectively. We notice from Equations (17) and (18) that
is always less than one. Since the recovery ratio must be less than one, the maximum recovery ratio is equal to
. Thus, the effectiveness can be defined as:
By substituting Equation (29) into Equation (19), an expression for MTU as a function of the effectiveness can be obtained as illustrated in Equation (30).
To relate the actual water permeation to the draw stream, a new dimensionless group defined as the dilution rate ratio (DRR) is introduced, which is the ratio of the amount of water permeates, the permeate mass flowrate, through the membrane divided by the mass flowrate of the draw solution, as shown in Equation (31):
Moreover, the actual dilution rate (DR) can be defined as the ratio of the mass feed flowrate (m
f) divided by the mass draw flowrate (m
d), which is equal to the reciprocal of the mass flowrate ratio, 1/MR.
The determination of the power production is similar to that reported in the studies of Banchik and his co-workers [
25], as shown in Equation (33),
where
is the mass flowrate of the permeate,
is equal to the density of the diluted outlet draw stream, ΔP is the pressure drop across the hydro-turbine and η is the combined turbine and generator efficiency.
To plot the graphs using the above-mentioned numerical model, we have to input the feed and draw concentrations based on the real data from the Kuwait desalination industry, as shown in
Table 1. According to Sharqawy et al. [
24], for feed and draw salinities between 1 and 70 g/kg (treated wastewater effluent (TWE)) and 35 and 70 g/kg (seawater), the modified van’t Hoff coefficient is determined to be 78.92 and 76.76 kPa-kg/g, respectively.
4. Results and Discussion
Figure 2 represents the plot of RR with respect to MTU for a parallel flow configuration with different MR contours using TWE and seawater as the feed and brine as the draw solution. As observed from the figure, RR increases with increasing MR values (0.5, 0.75, 1, 2, 3, 4, 5) for both TWE and seawater feed solutions. With respect to the TWE feed stream, RR values of 0.95 and 0.4 are achieved for MR equal to five and 0.5, respectively. Furthermore, for seawater feed stream that has a higher salinity compared to that of TWE, the recovery ratio is lower with a value of 0.22. The fact that the RR value of using the TWE feed stream is higher than the seawater feed stream can be attributed to the higher salinity difference between TWE and the brine draw solution, which leads to larger osmotic driving force and a higher mass flowrate of the permeate. An increasing trend in the value of RR with higher MR values for both TWE and seawater feed streams agrees with previous findings by Banchik et al. [
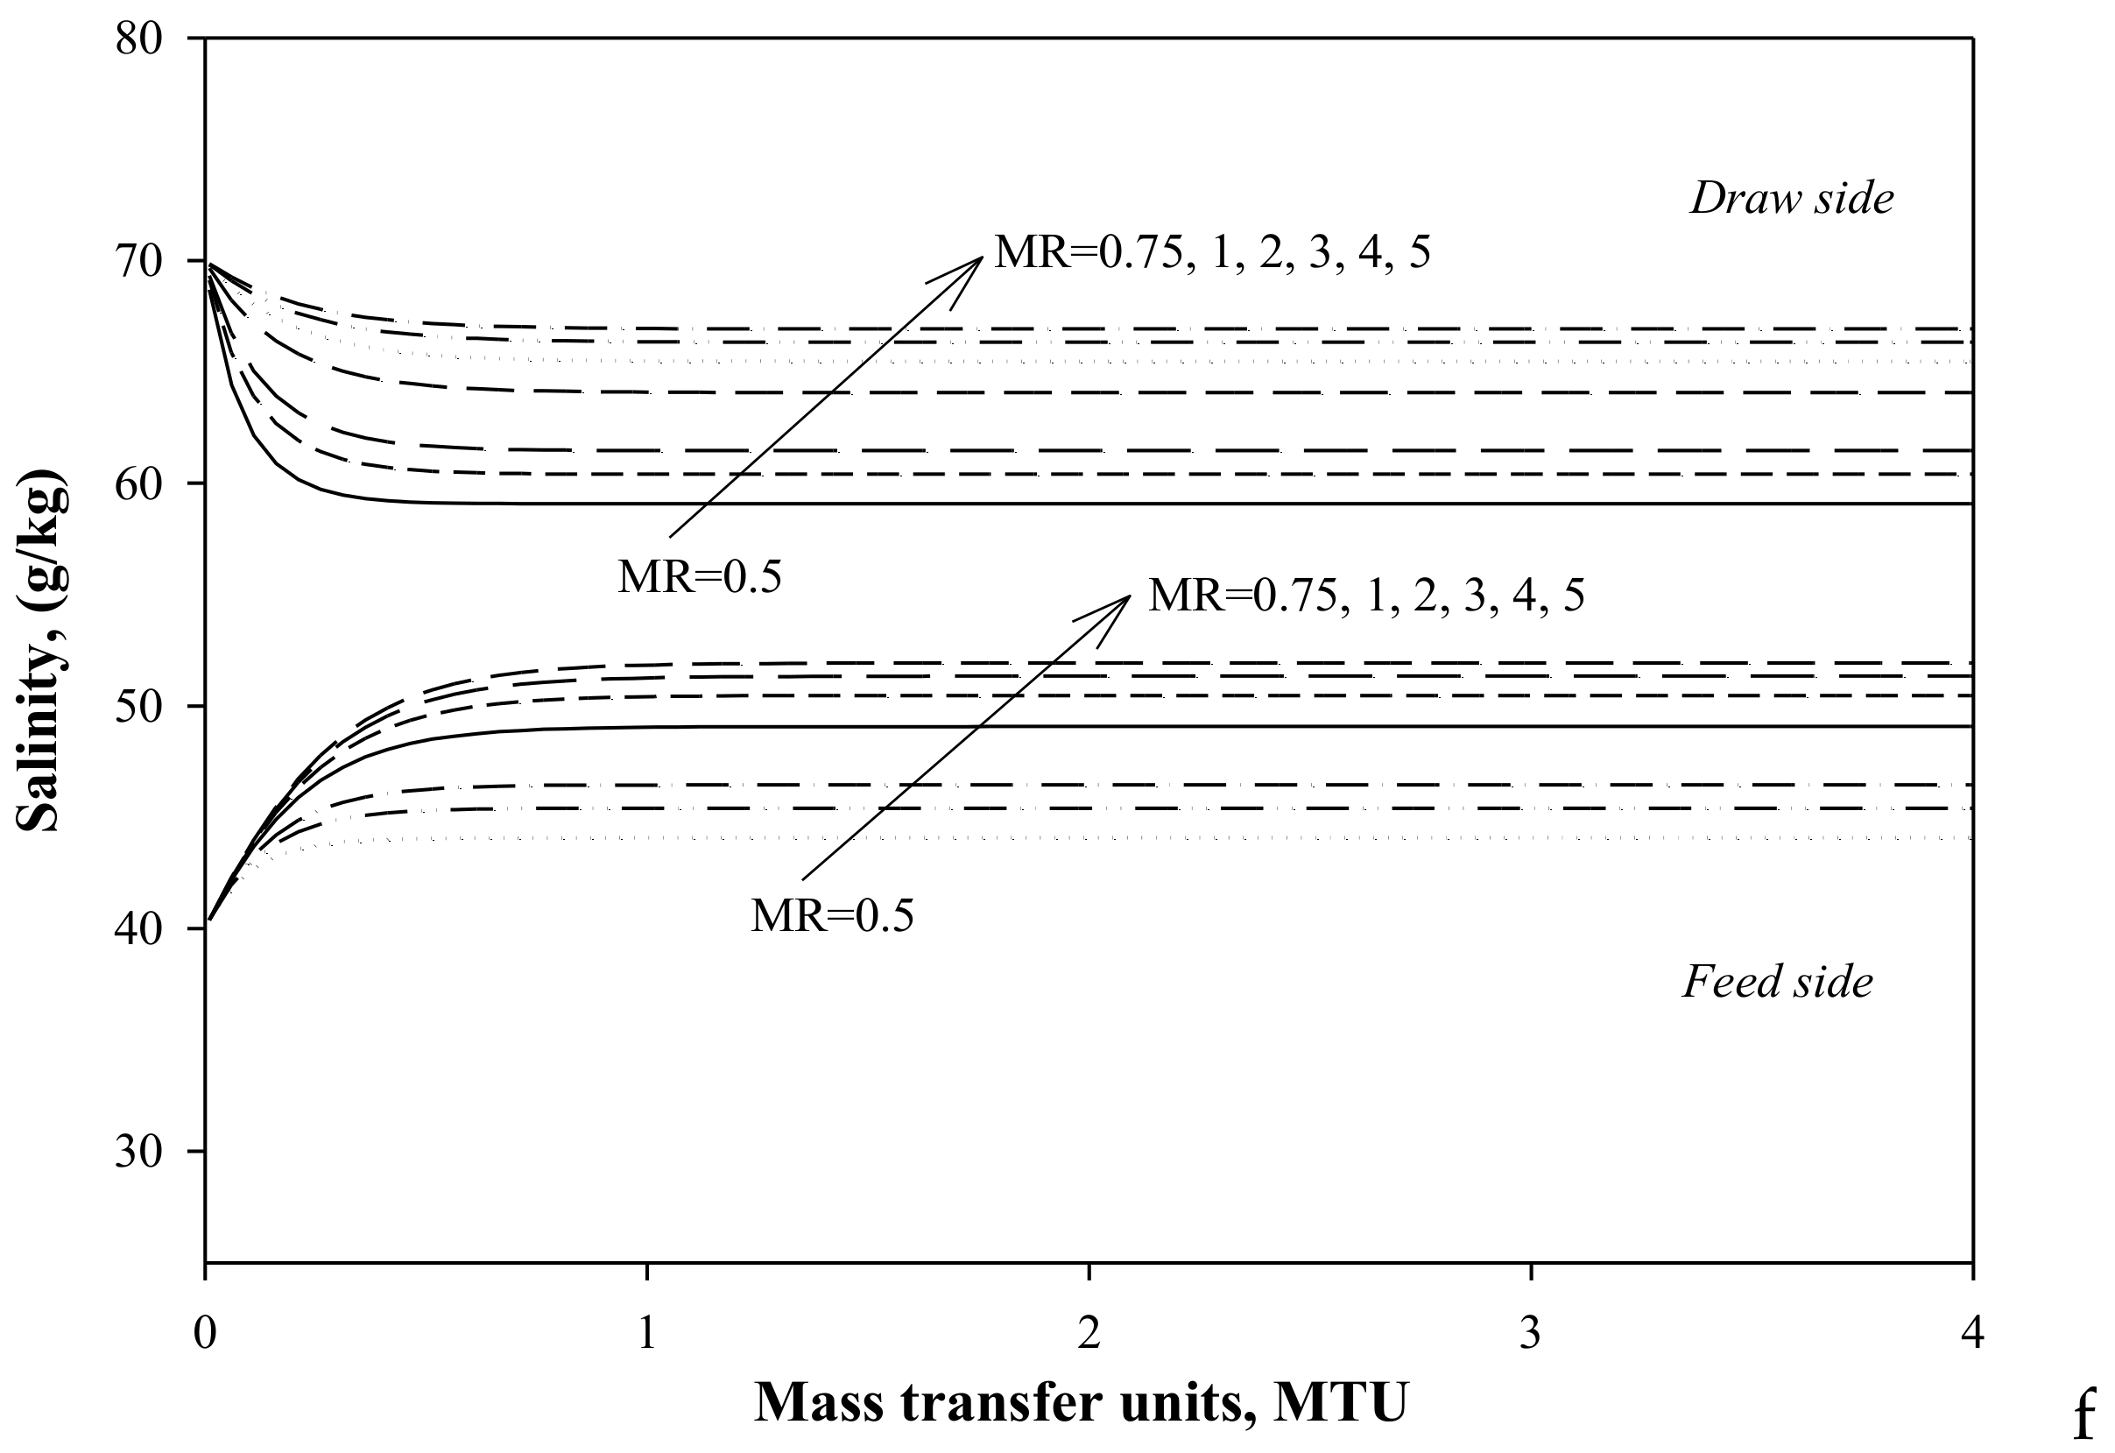
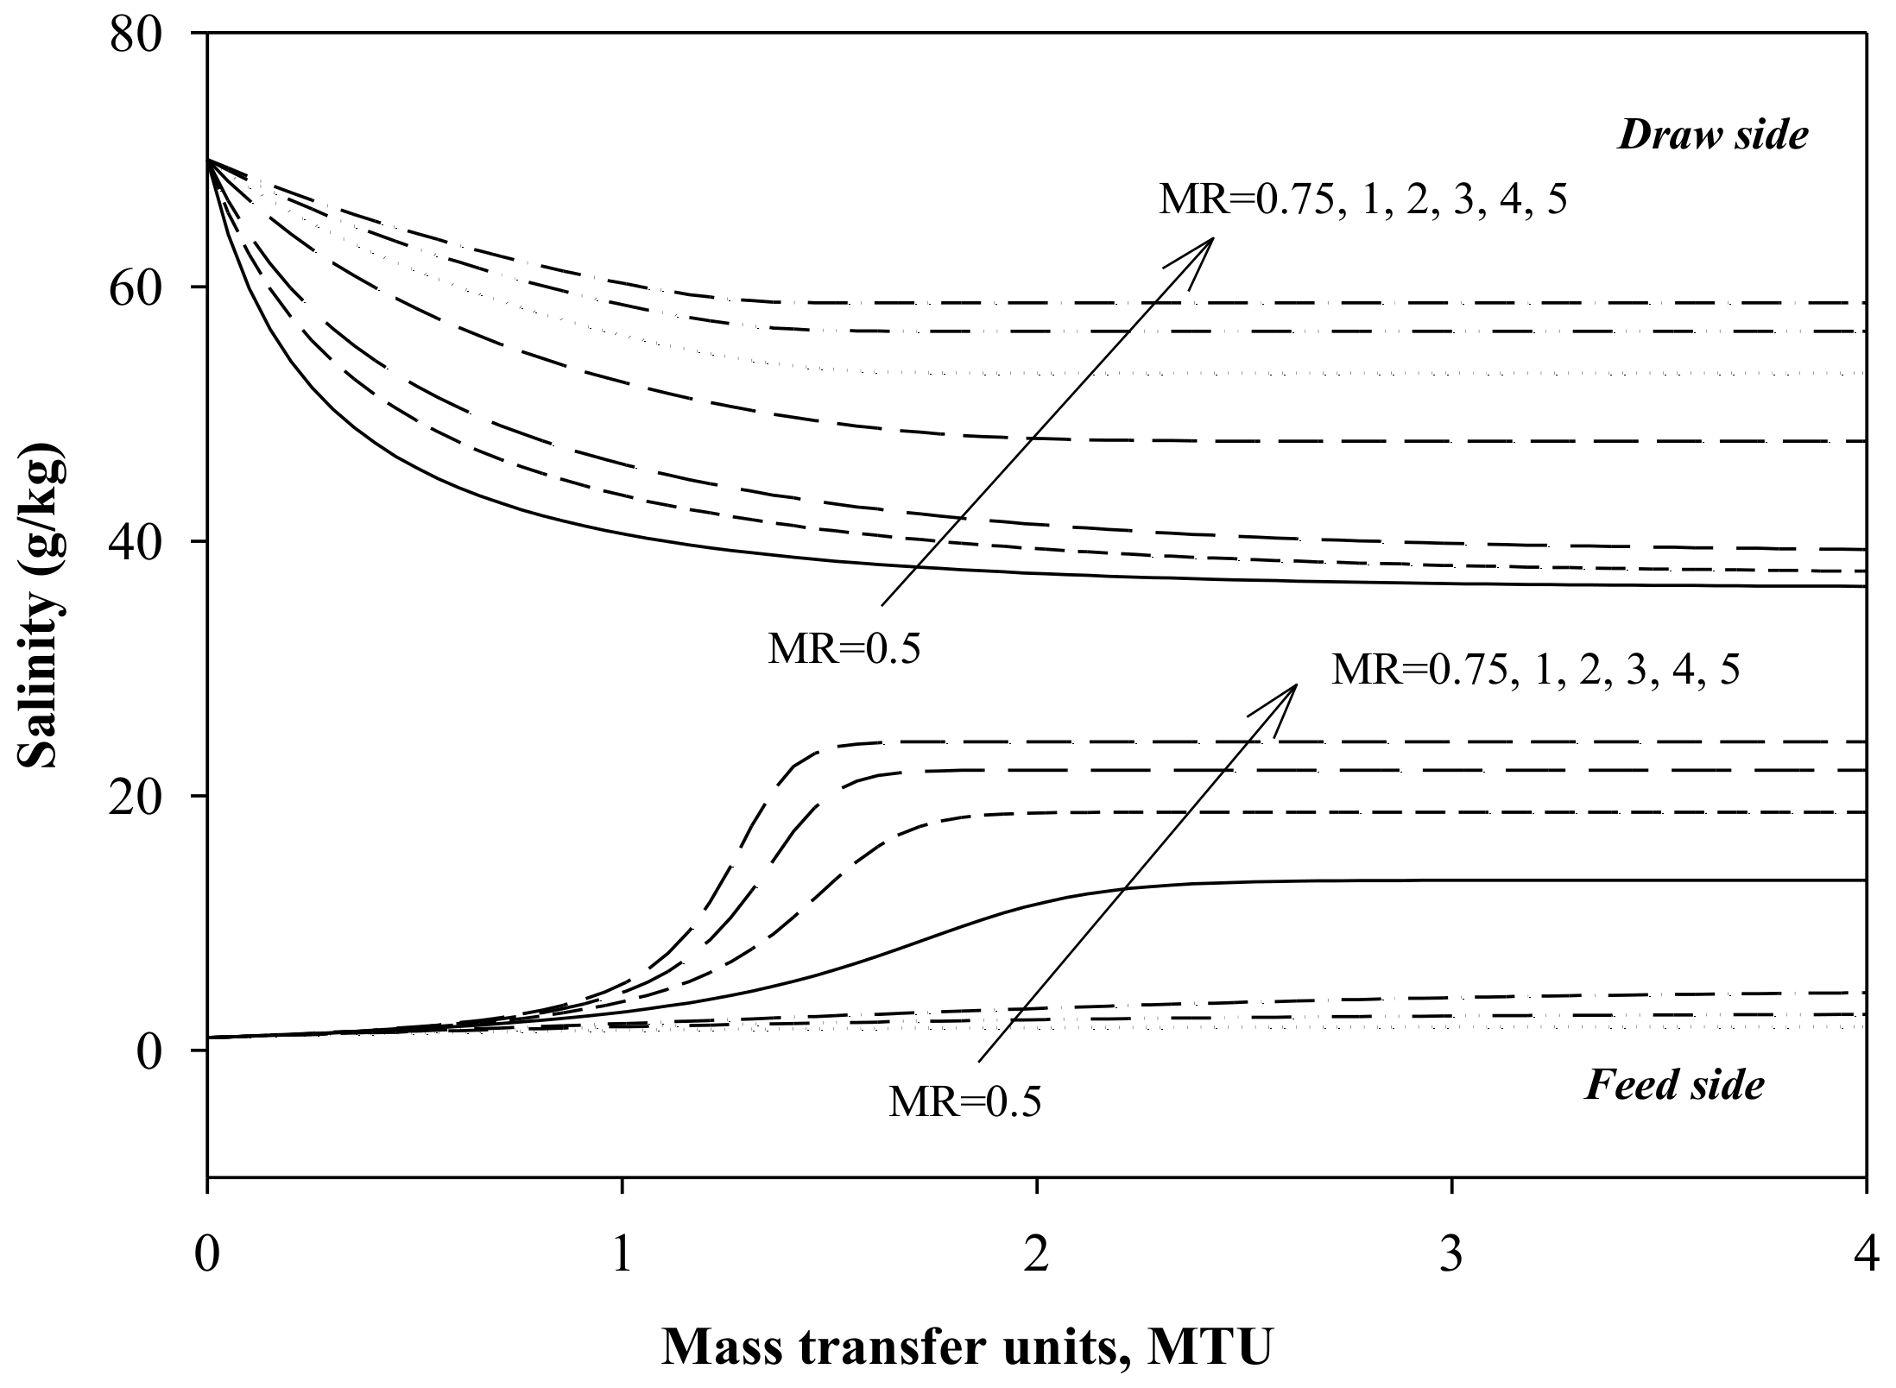
25]. These could be explained by using the outlet feed and draw salinity with respect to MTU, as shown in
Figure 3 and
Figure 4. As observed, the draw solution concentration has smaller changes compared to the feed solution concentration at high MR due to the mass flowrate of the permeate being low compared to the mass flowrate of the draw solution. However, the feed solution will become more concentrated due to the continuous permeation of water molecules across the membrane, which reduces the overall permeation mass flowrate, and hence, RR will require greater MTU for high MR.
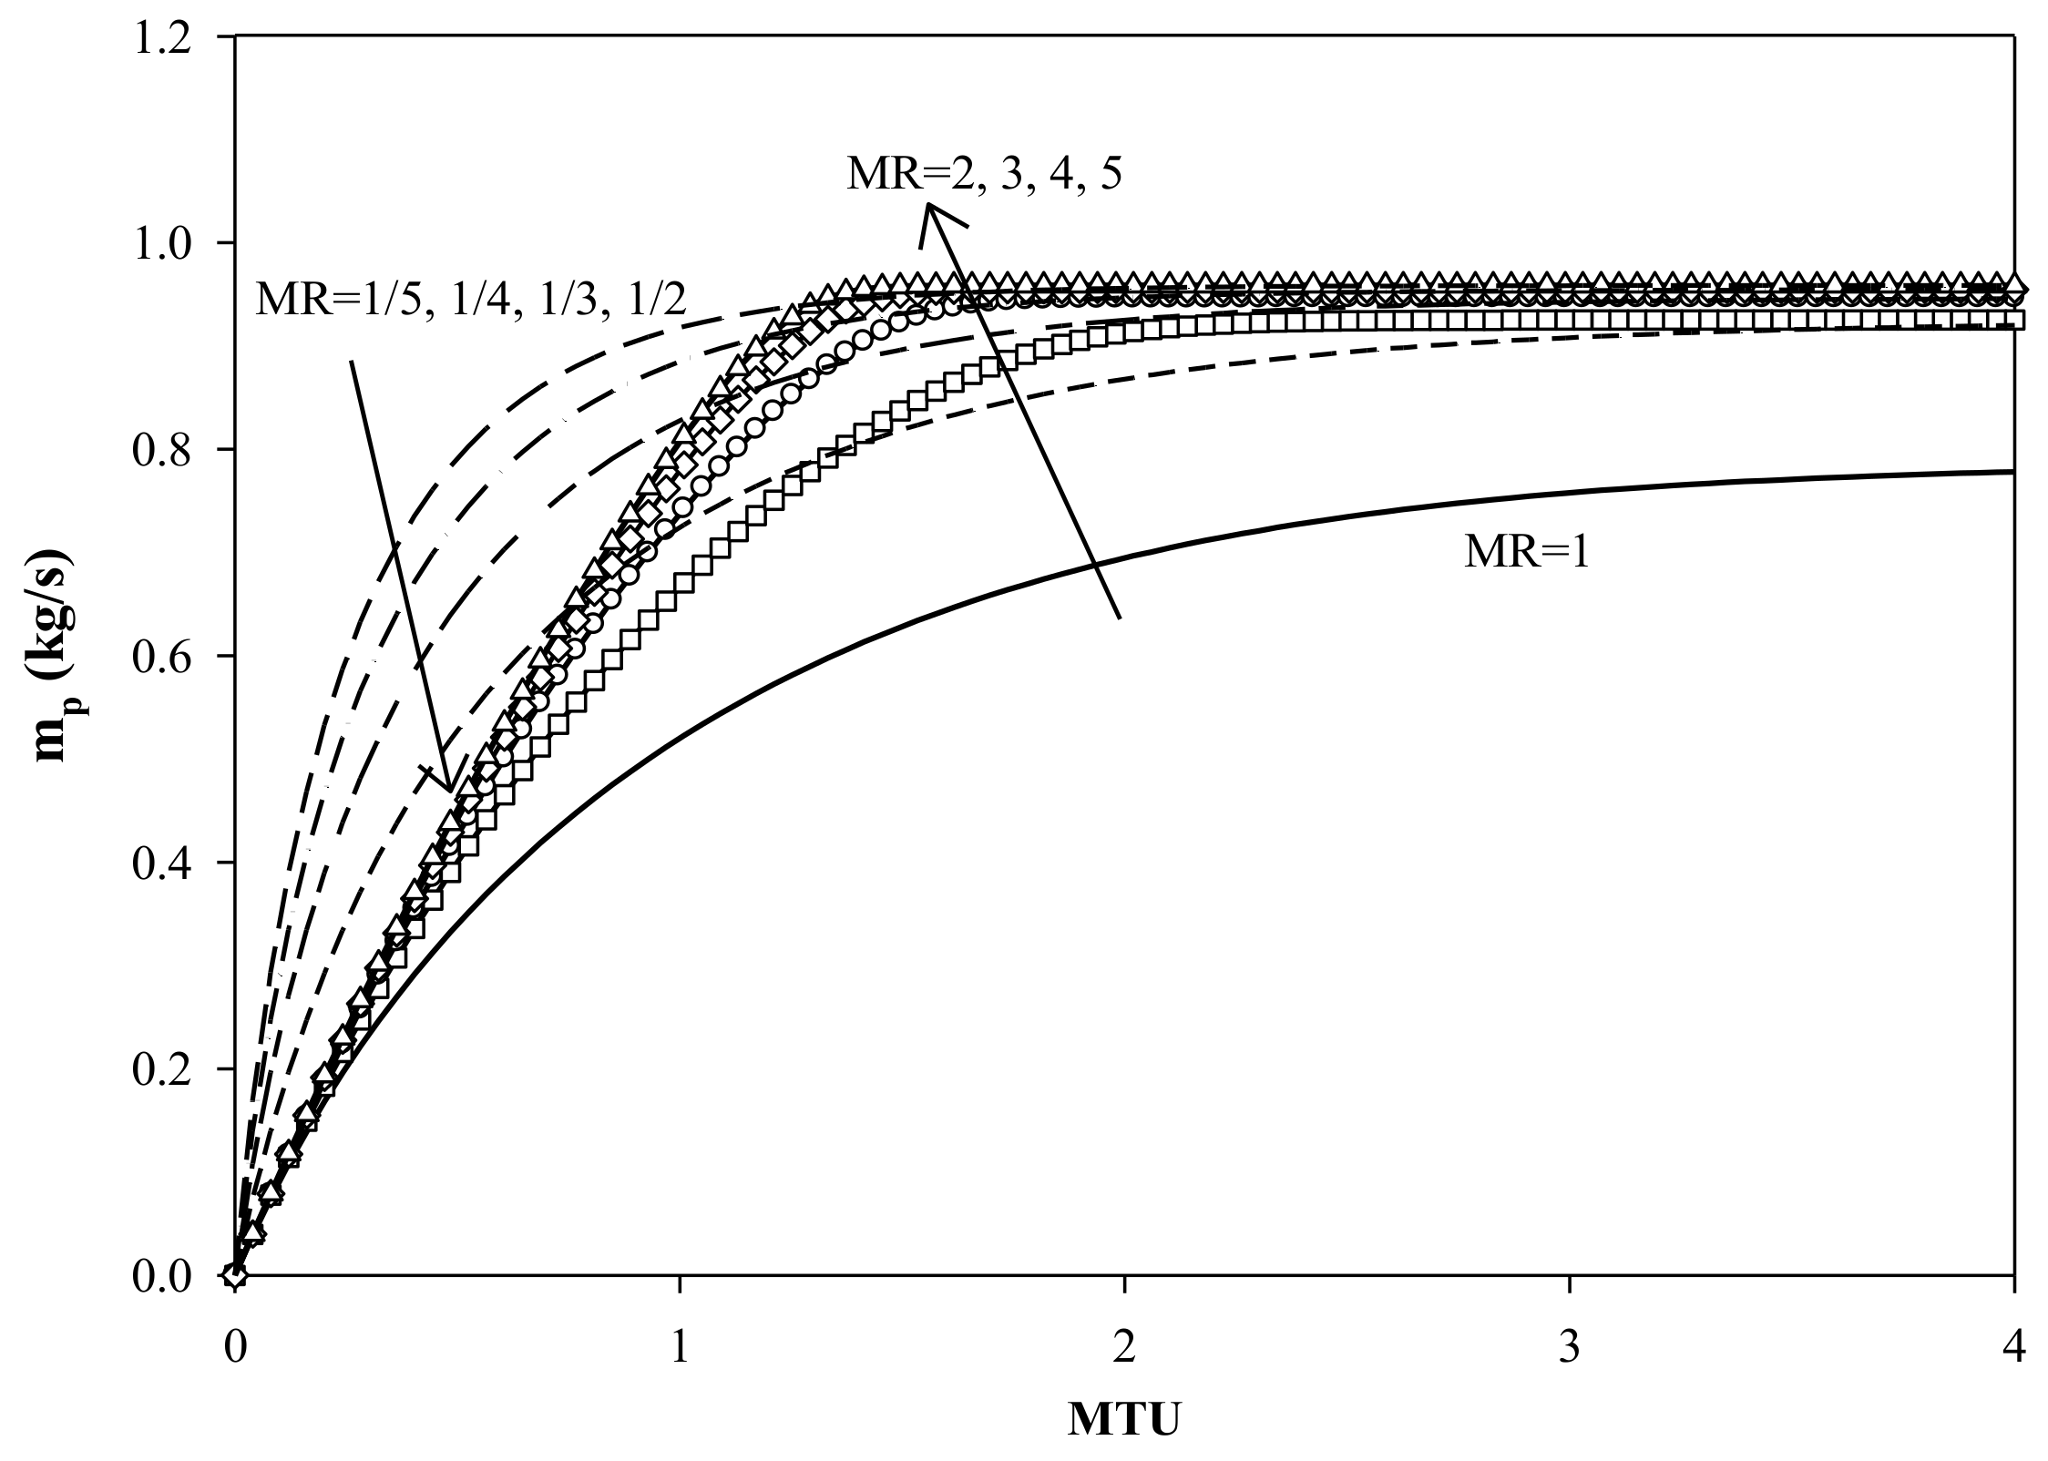
Figure 5 and
Figure 6 depict the plot of the mass flowrate of the permeate versus mass transfer units at varying MR values. From
Figure 5, it can be seen that m
p decreases as MR increases for MR < 1 when using seawater as the feed solution. However, for MR > 1, m
p increases with an increase in MR. More water permeate can be recovered at high MR due to the better restoration of the concentration differences between the feed and draw solution. A similar pattern is found in
Figure 6 when using TWE as the feed solution. The mass flowrate of permeate (m
p) tends to be higher at lower MR for MR < 1. For MR > 1, m
p is increased proportionately with MR. As expected, the m
p of the membrane in the treatment of TWE is much higher than that using seawater due to the larger osmotic driving force produced by the higher salinity difference. Furthermore, as m
p is equal to dimensionless group RR when m
f = 1 kg/s (see Equation (9)), by taking the example of TWE as the feed and brine as the draw solution for MR < 1 and MR > 1 at the highest MTU = 4, the m
p values obtained based on RR from
Figure 2 are compared with those shown in
Figure 6. It is found that different m
p values are obtained for MR = 0.5 (i.e., m
p = 0.4 (
Figure 2) and m
p = 0.9 (
Figure 6)), while the same m
p value (i.e., 0.9 (for both
Figure 2 and
Figure 6)) can be achieved for MR > 1. Hence, it can be concluded that the m
p value obtained using RR does not represent the actual permeation rate for MR < 1. It is necessary to develop another new dimensionless group to relate the actual water permeation across the membrane between the feed and draw solution, which will be discussed in the following sections.
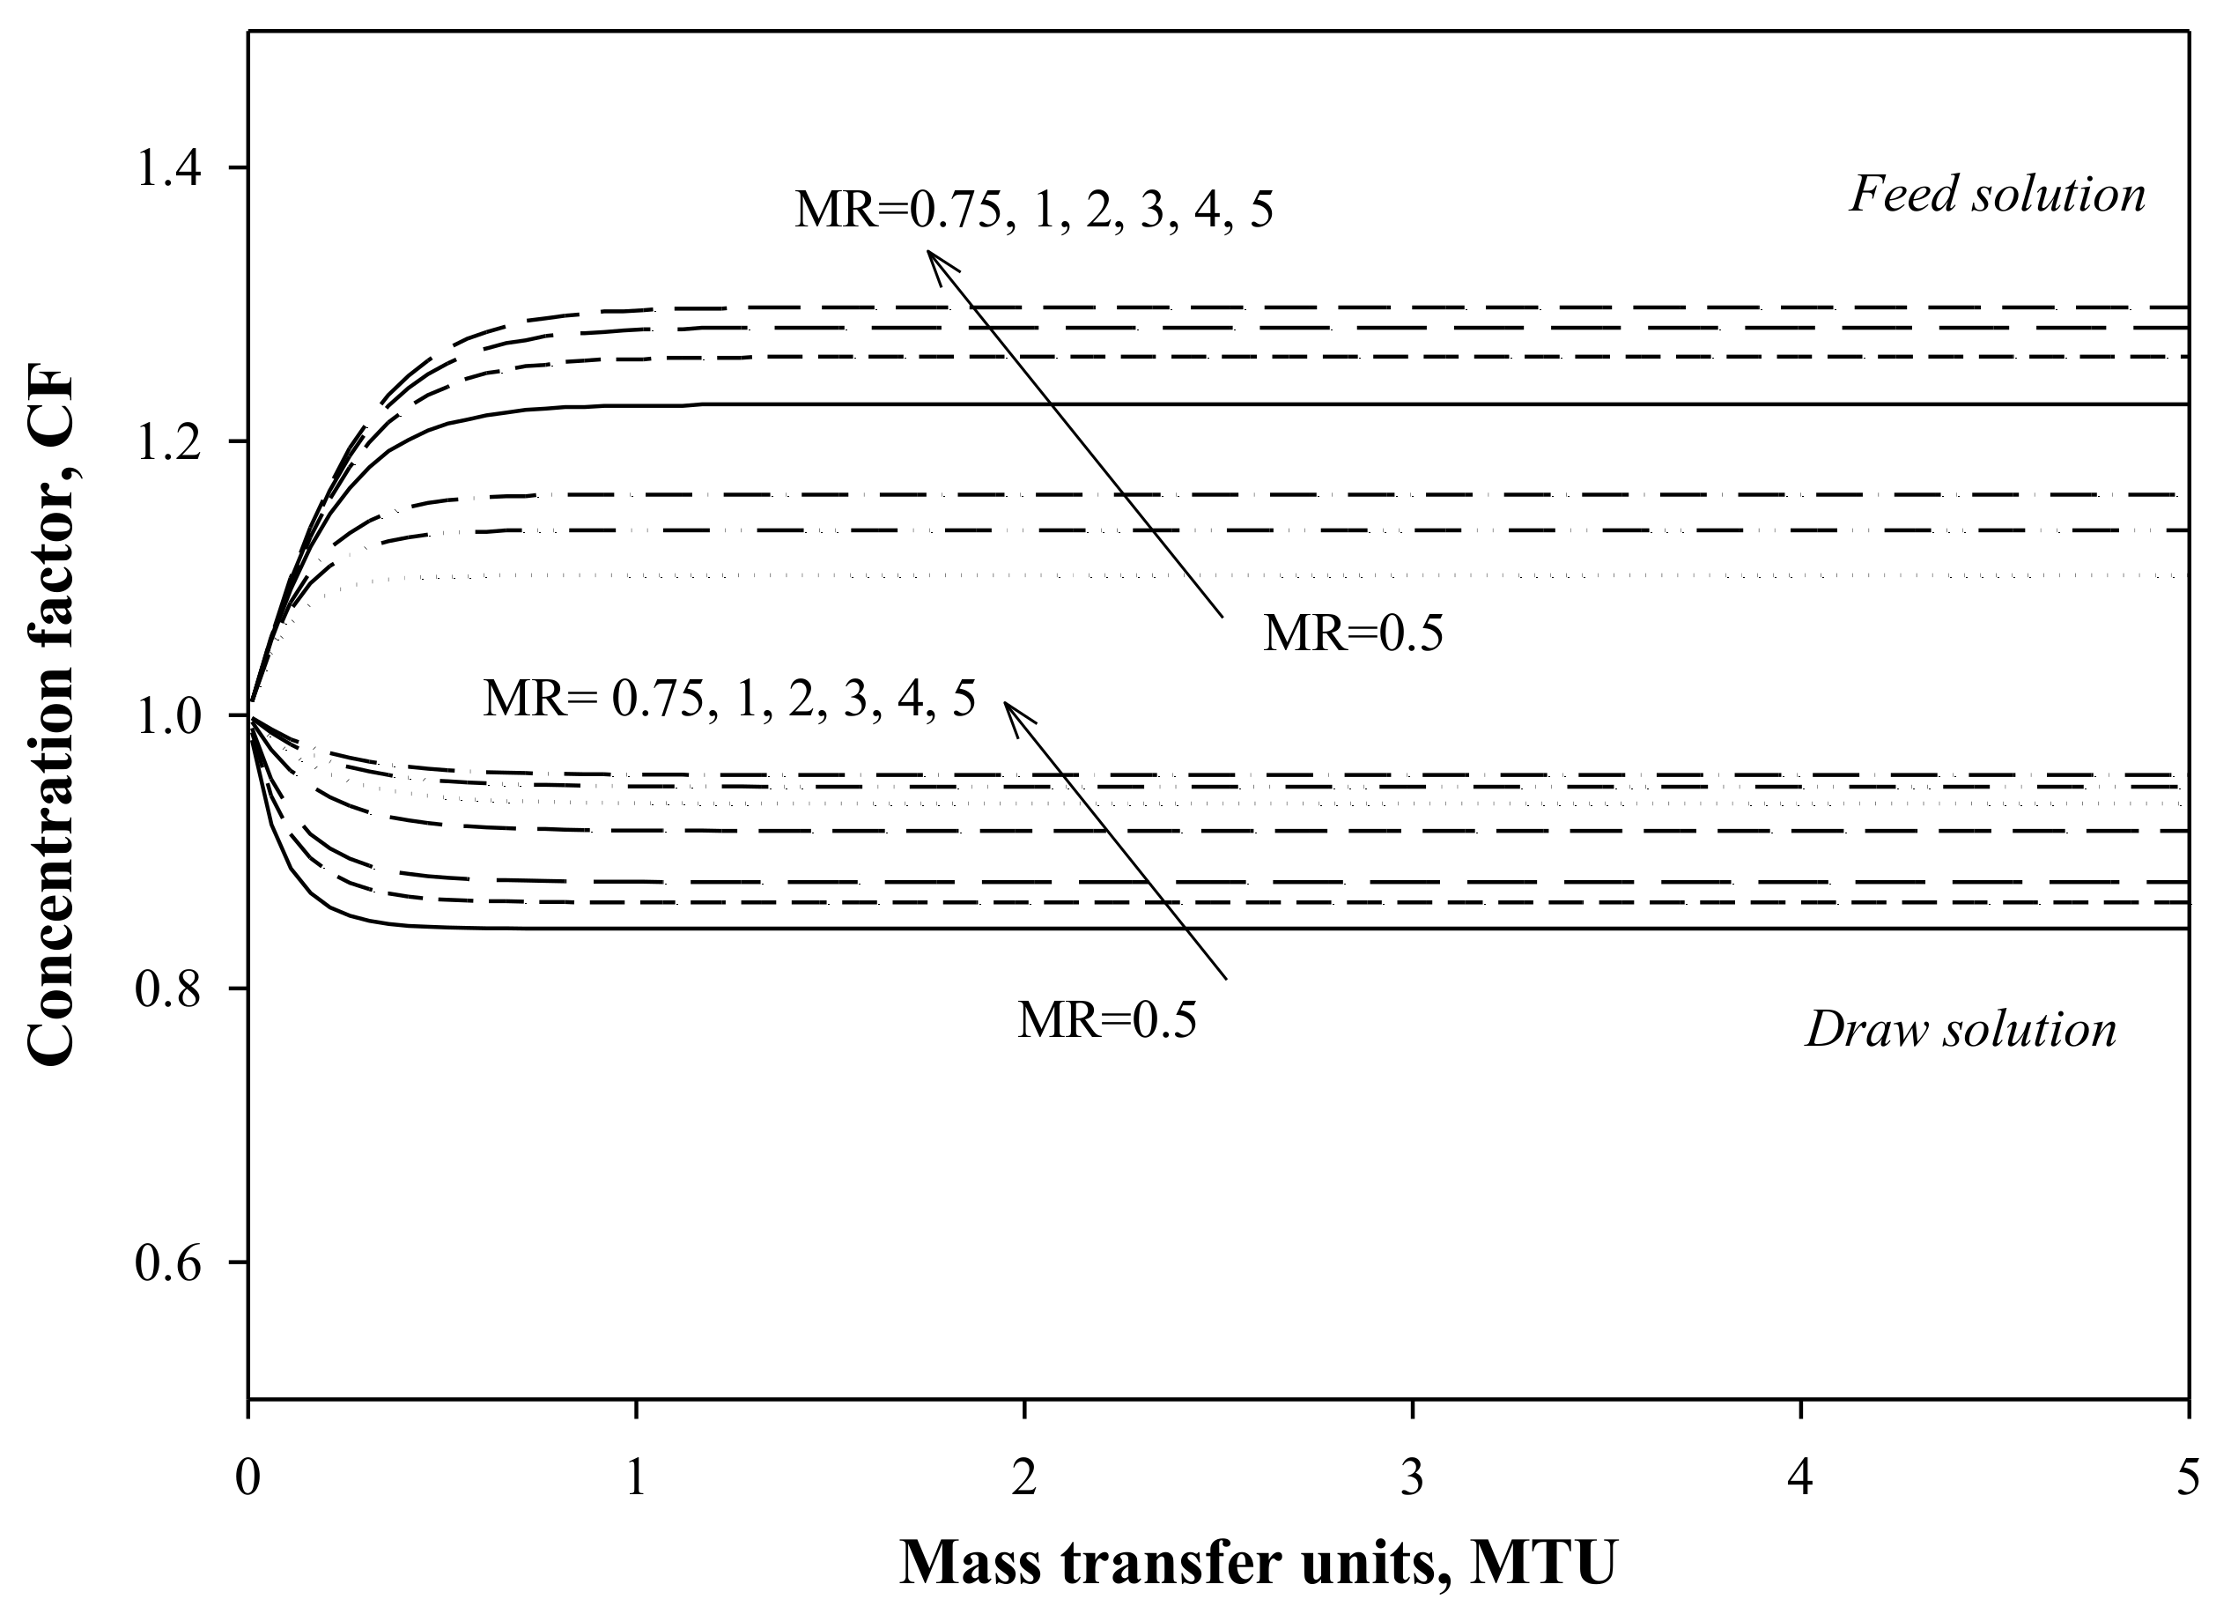
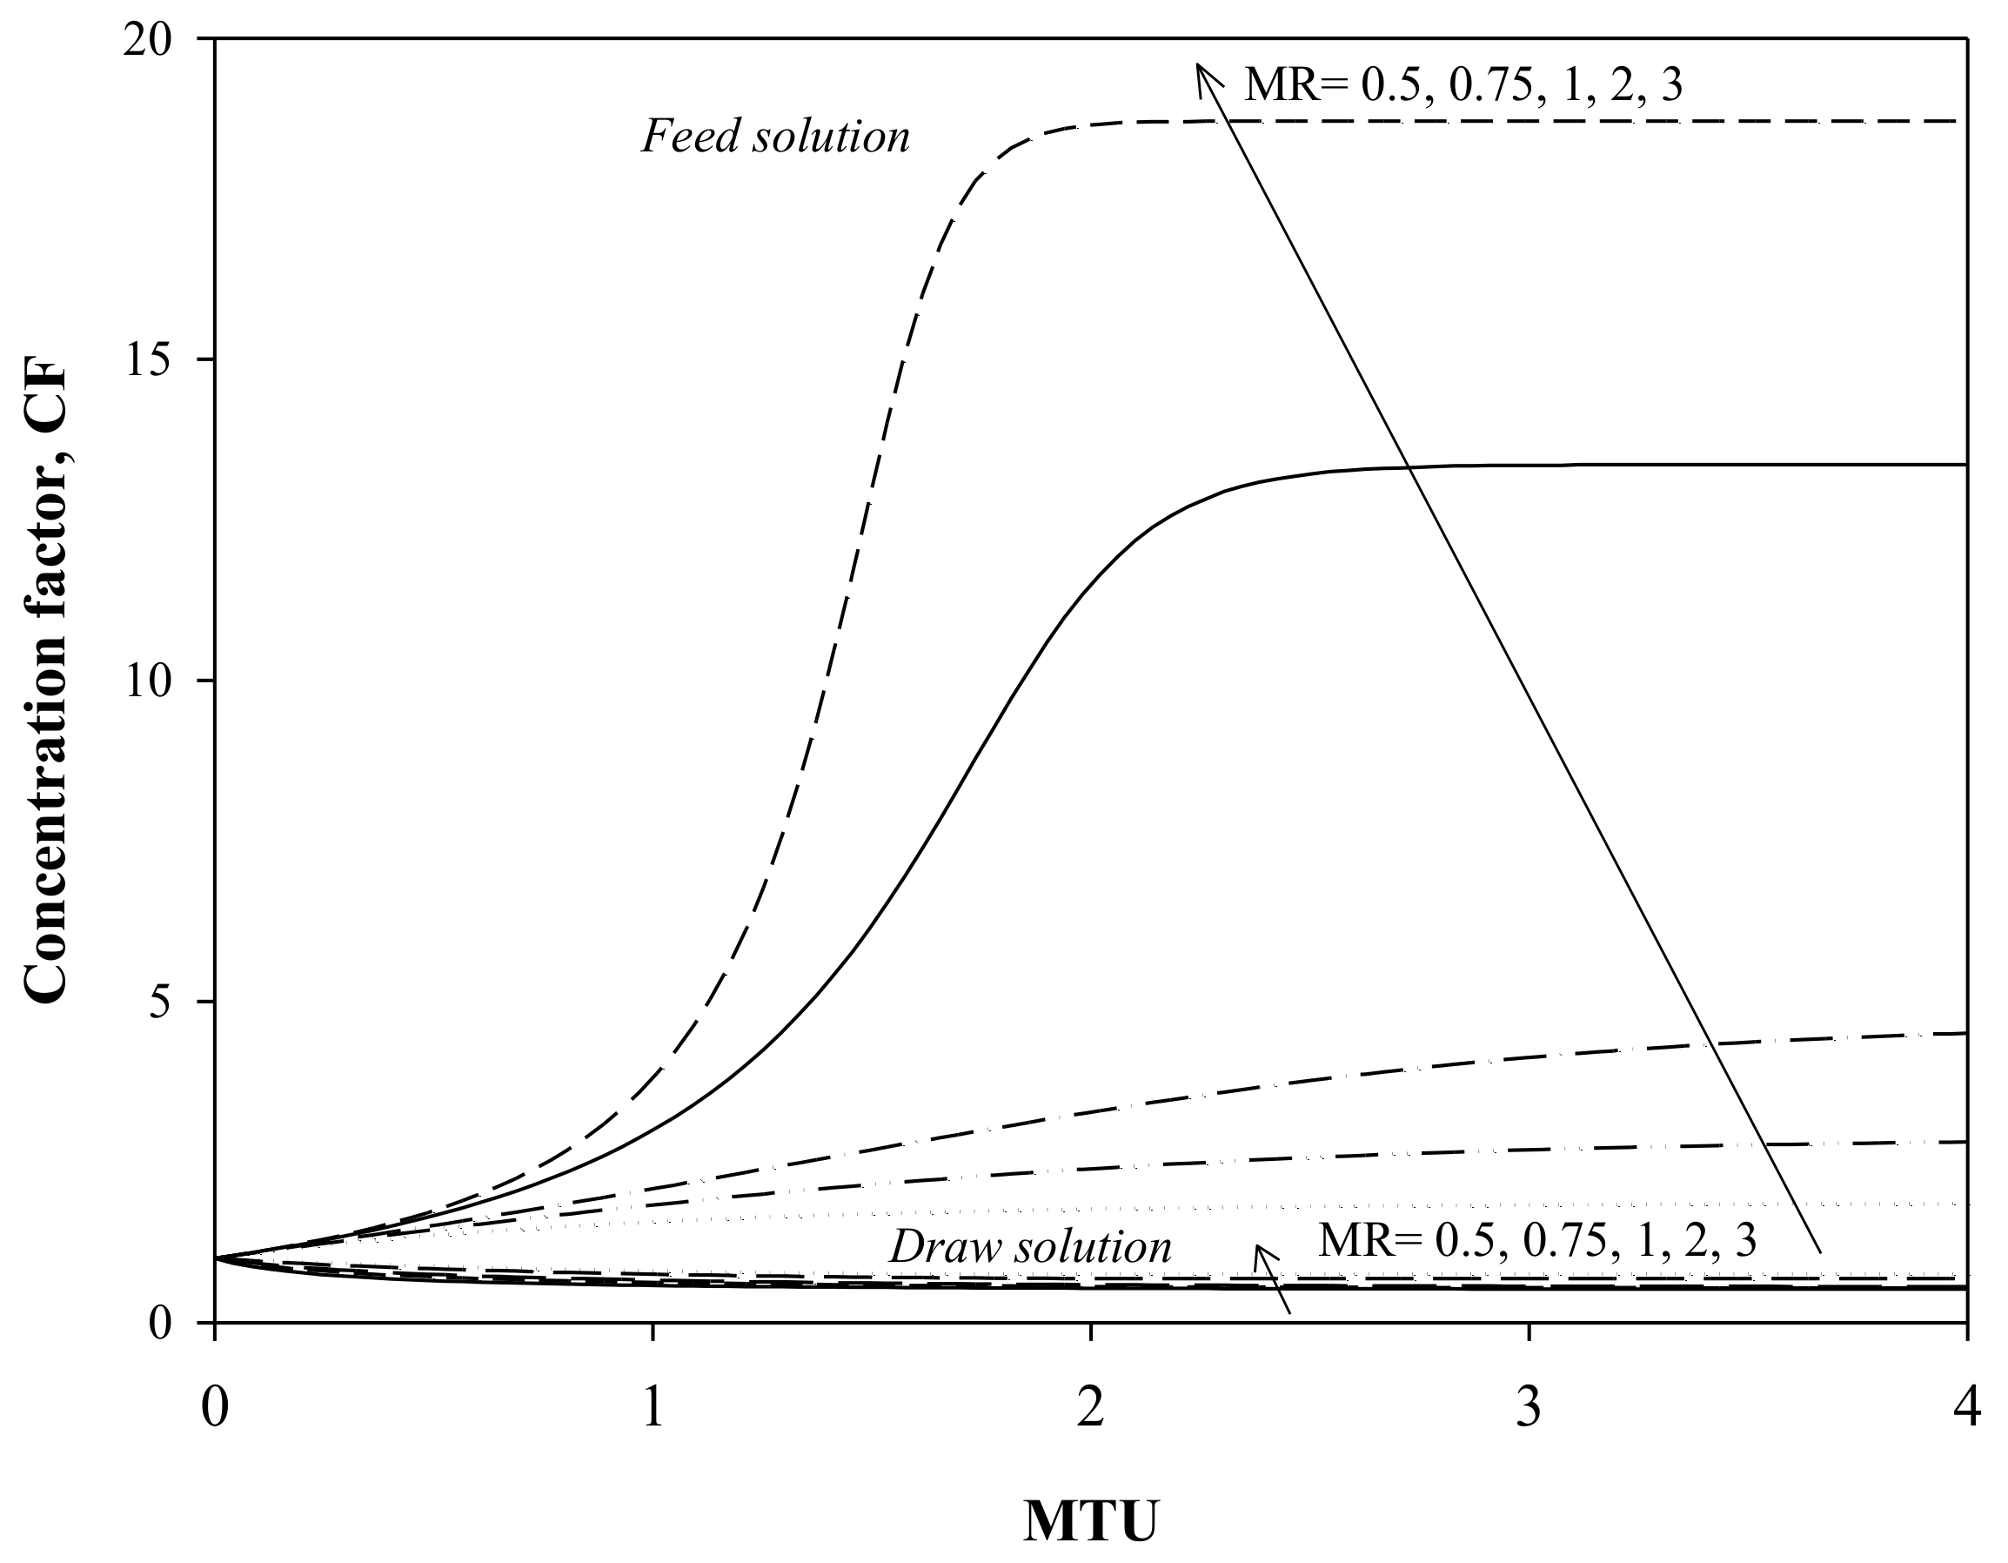
The concentration factor is the ratio of the outlet salinity of a stream to the inlet salinity. Owing to the salinity difference, water molecules would be transported from the feed to draw solution, and this leads to highly diluted draw effluent and more concentrated feed effluent, resulting in lower
and higher
at high MR, as illustrated in
Figure 7 and
Figure 8. It can be observed that the CF when using TWE as the feed is much higher than those using the seawater feed stream. This can be ascribed to the higher salinity difference between TWE and brine, resulting in more water permeation across the membrane and an increase in the final concentration of the feed solution. Furthermore, CF
d becomes very small when using TWE as the feed solution regardless of different MR being able to be attributed to the large dilution of the draw solution at a higher salinity difference between TWE and the brine solution.
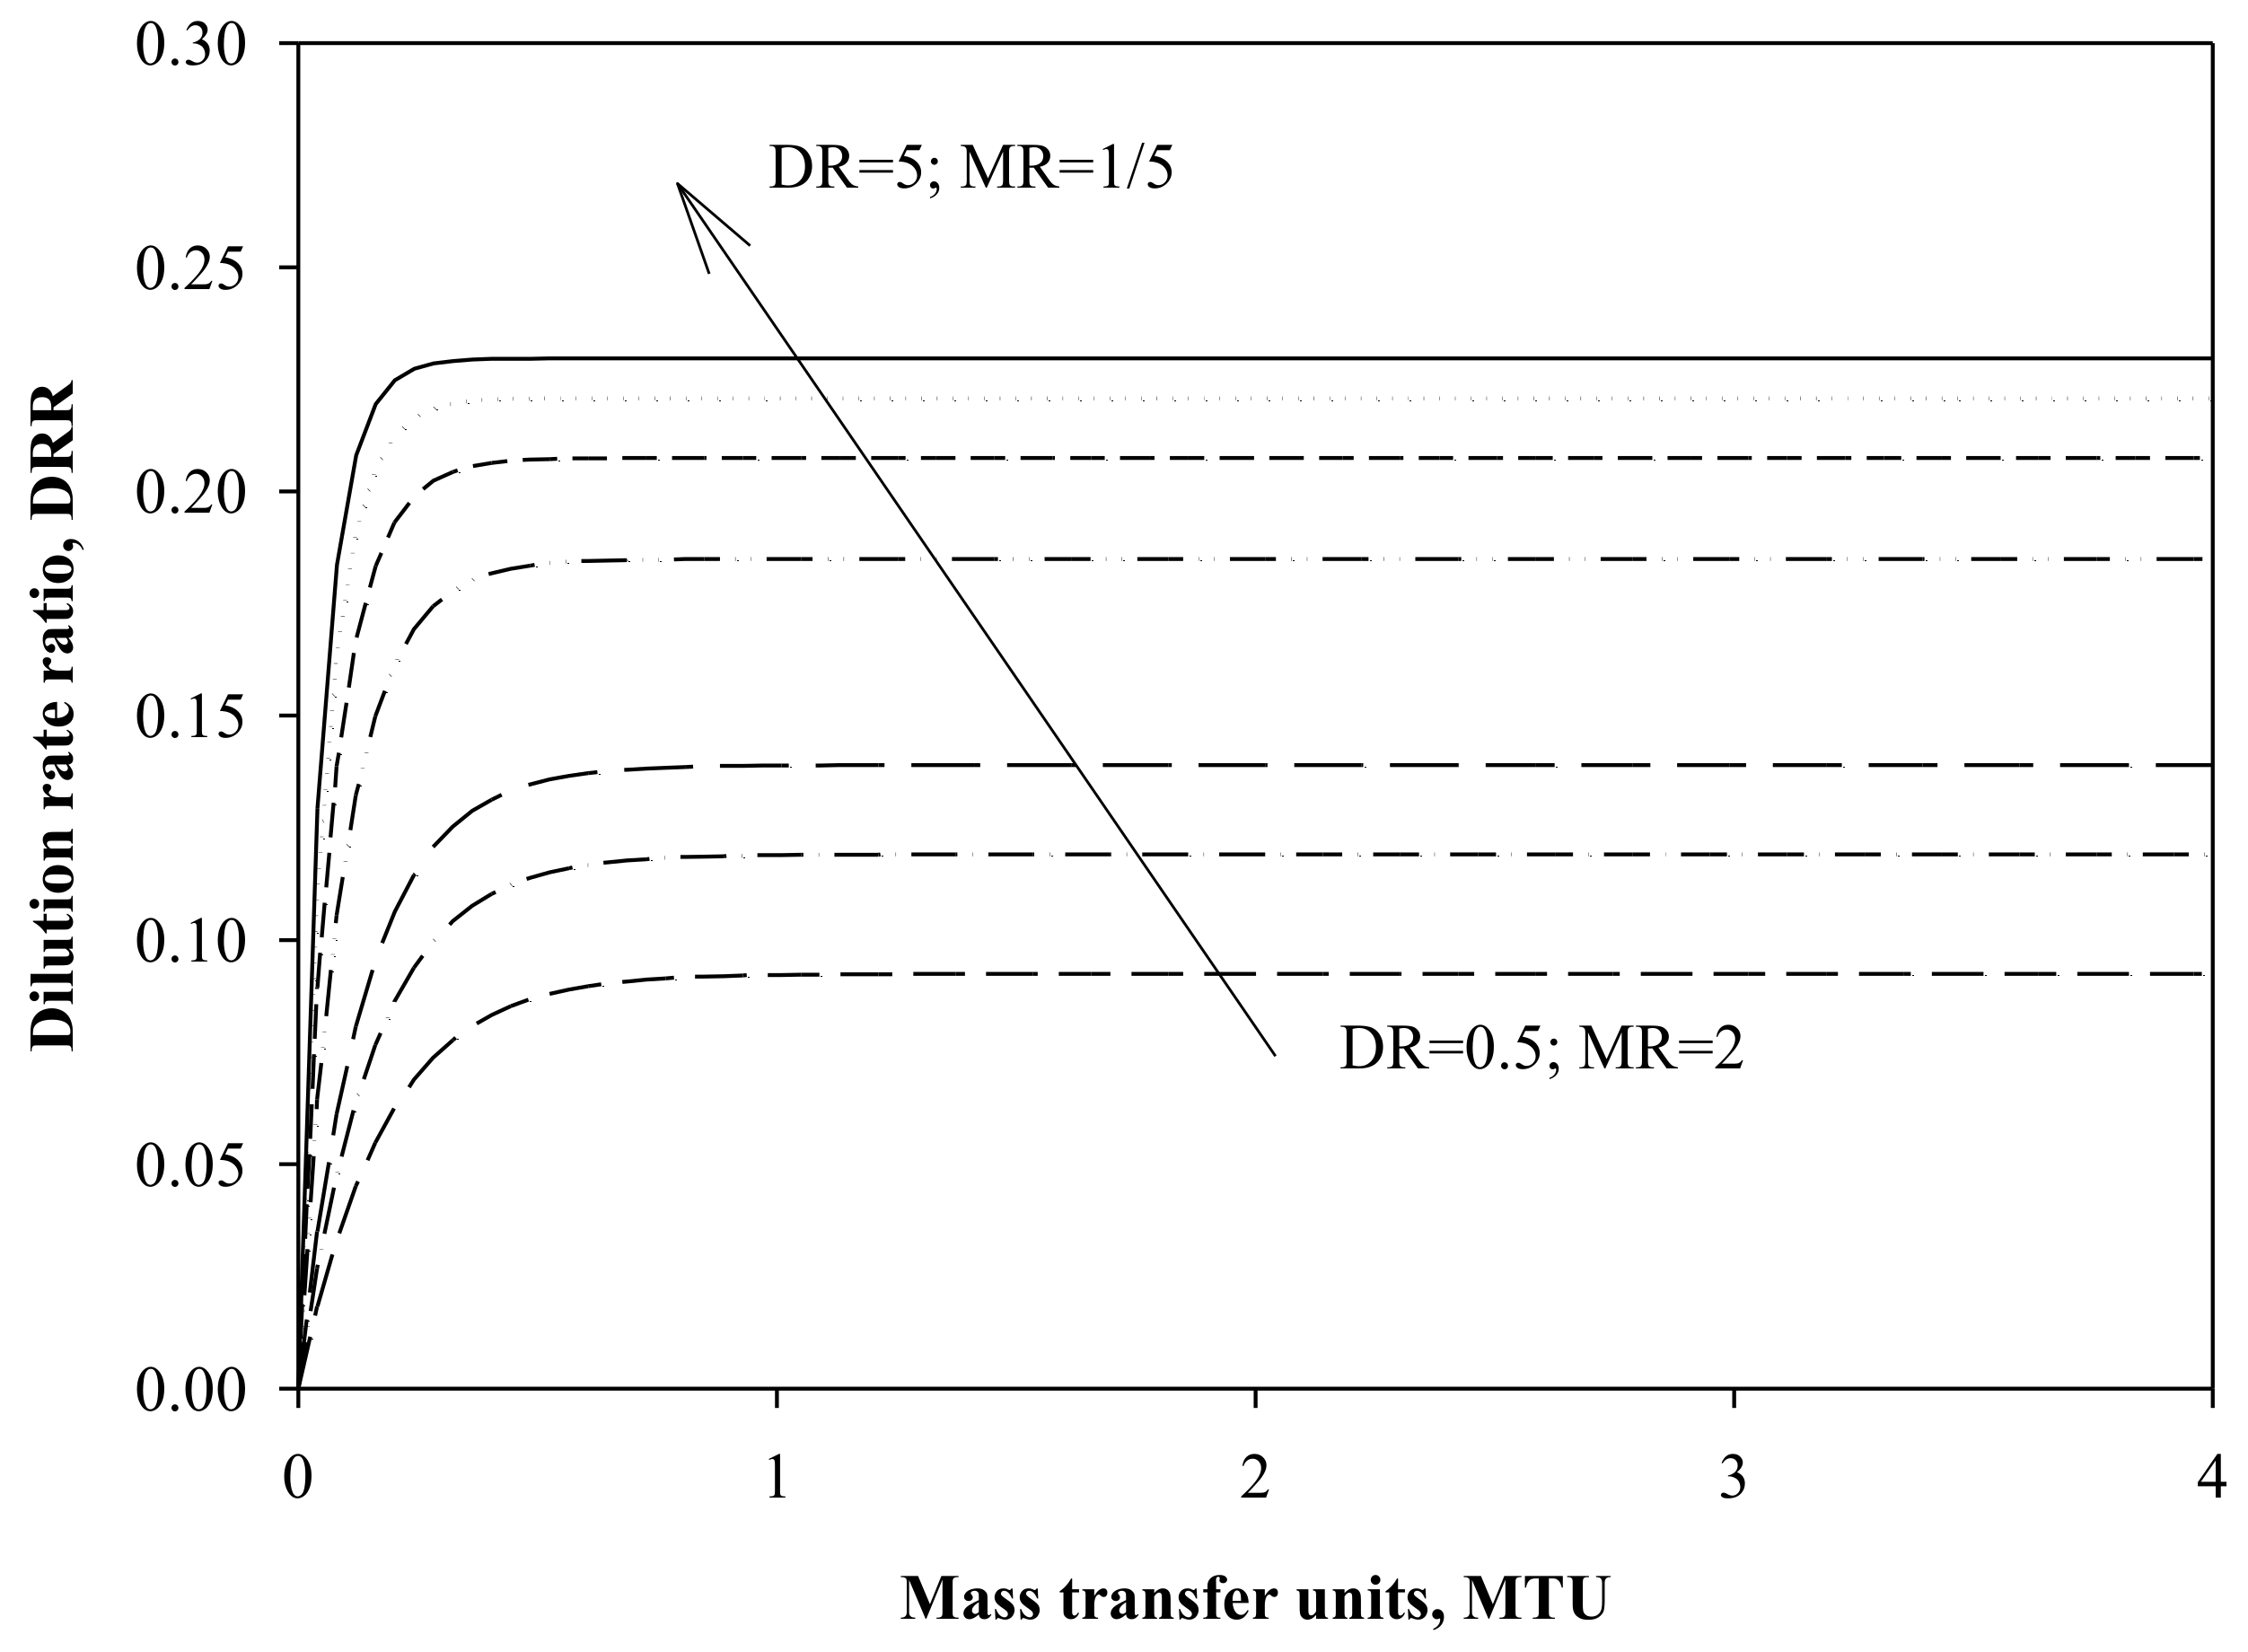
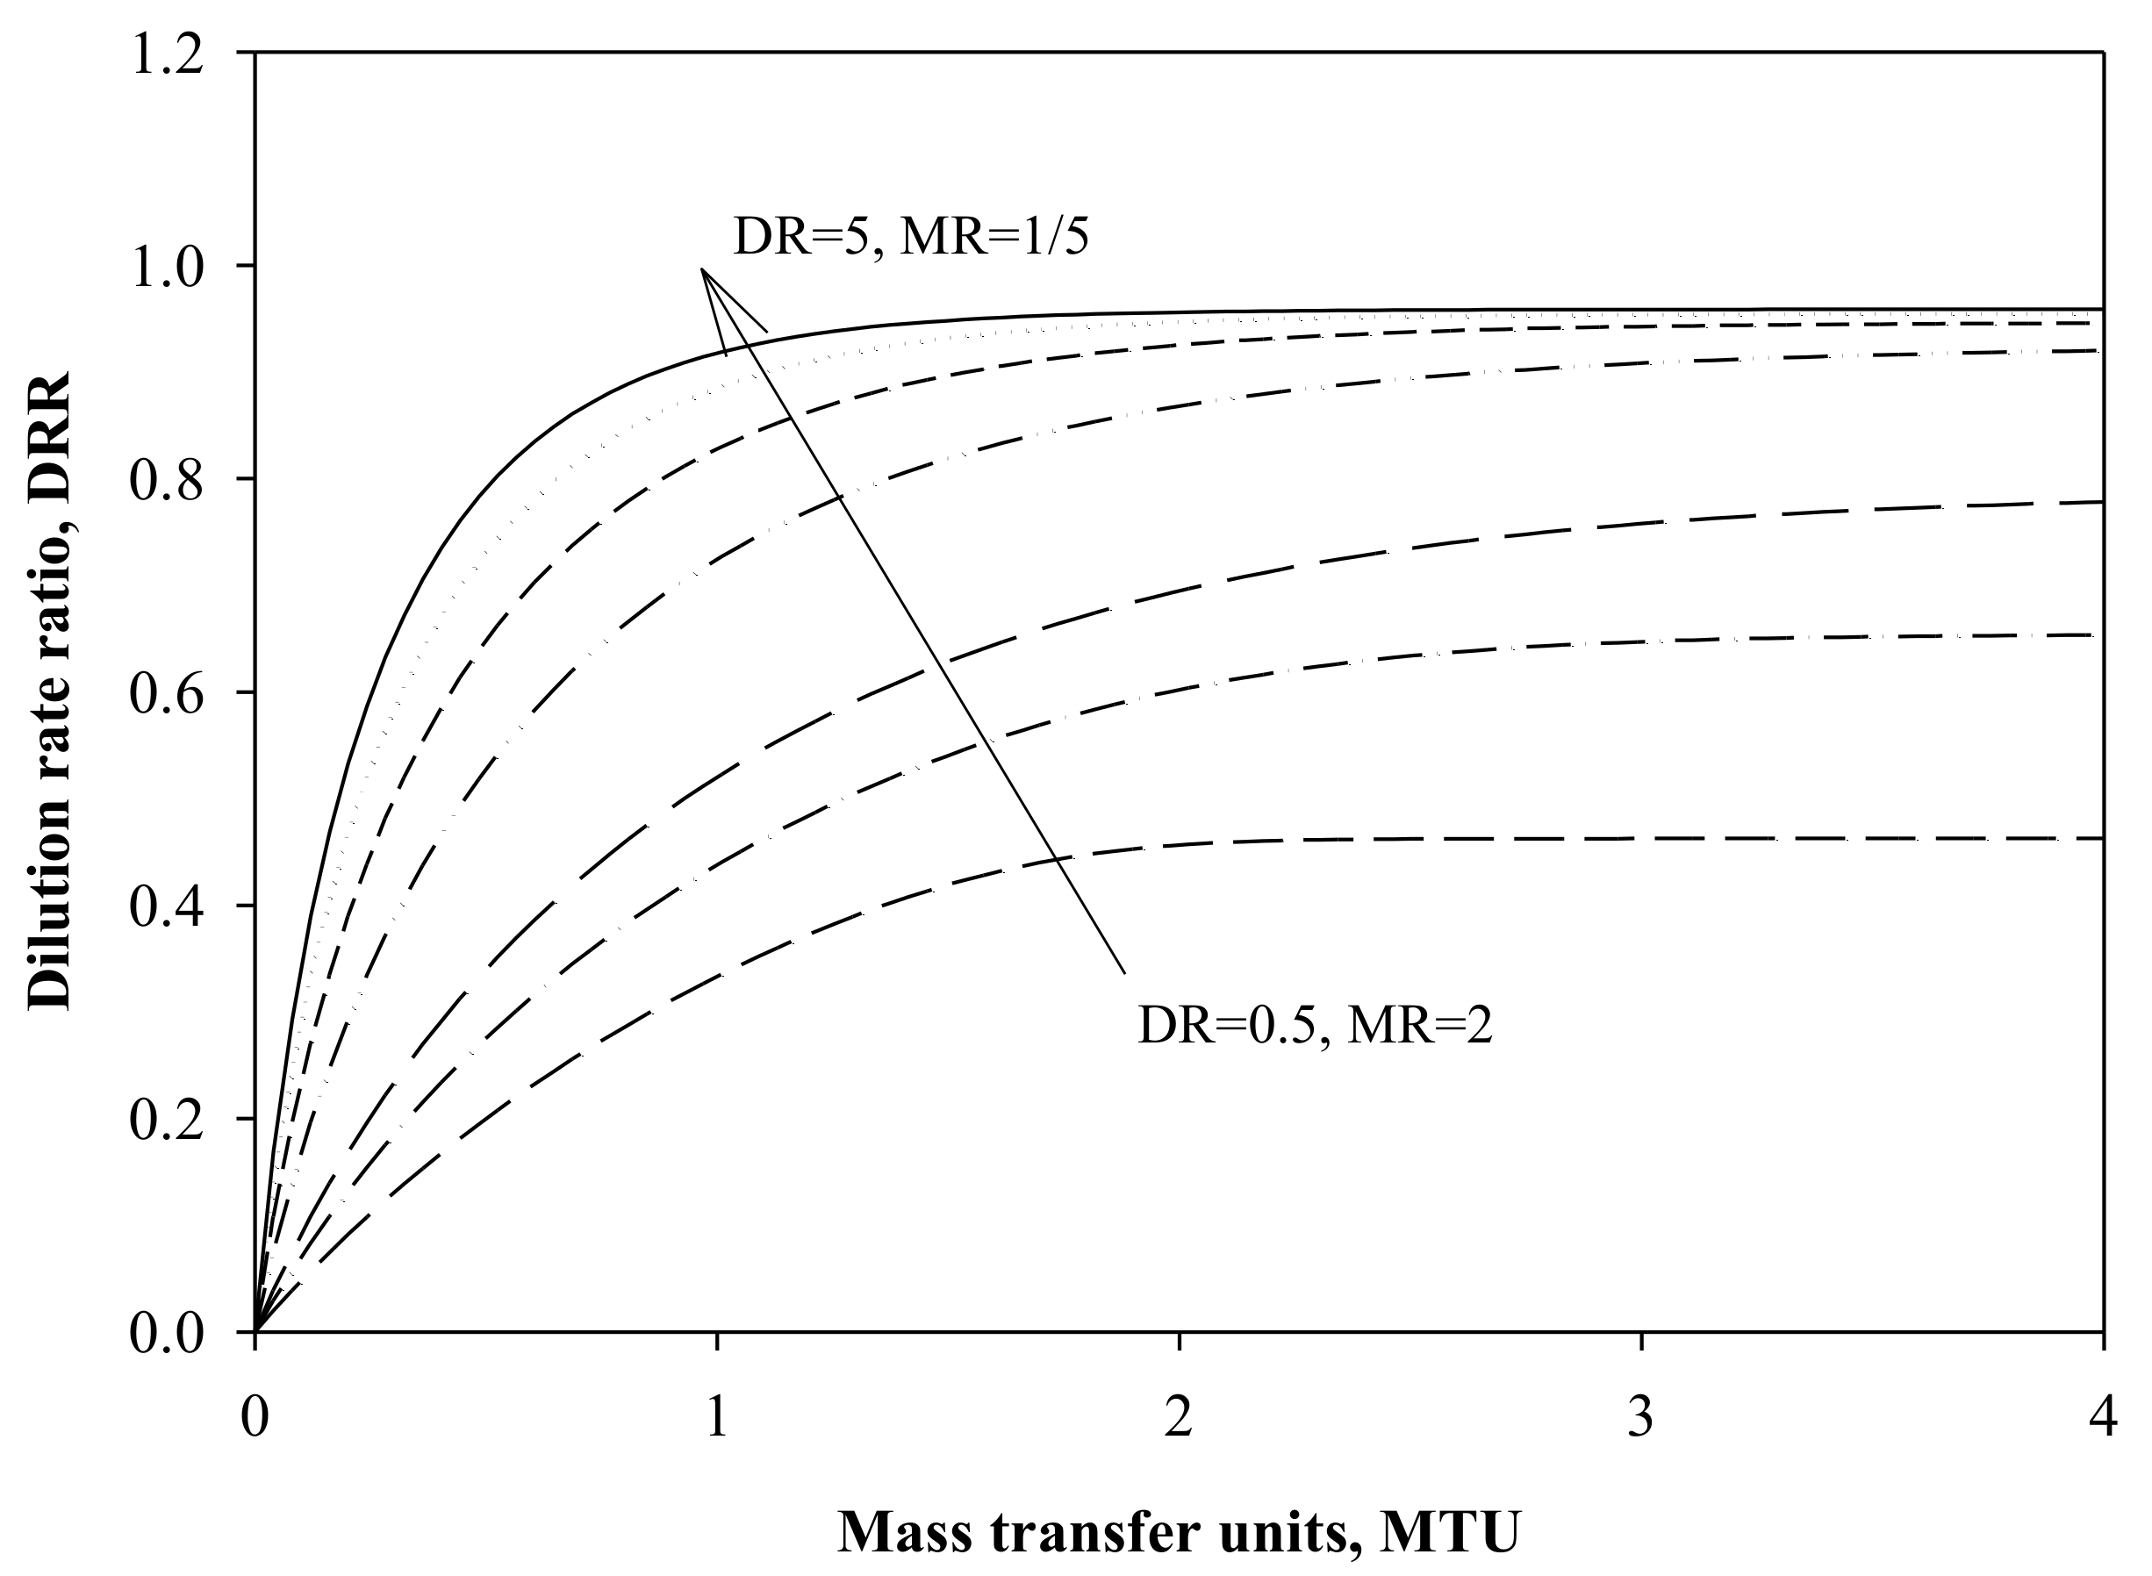
In order to show how high of a dilution rate at the draw side could be achieved, two new dimensionless groups defined as the dilution rate ratio (DRR) and dilution rate (DR) are introduced to relate the actual permeation into the draw stream. From
Figure 9 and
Figure 10, it can be observed that DRR is increased with an increase in DR, owing to the large amount of feed solution diffusing through the membrane, resulting in highly diluted brine solution. As expected, DRR using TWE as the feed is higher than that using seawater, due to more water molecules being drawn from the feed to the draw side at a higher salinity difference and thus significantly decreasing the draw concentration. In addition, the maximum permeation rate would occur when the hydraulic pressure is equal to the osmotic pressure at the exit channel [
24]. Thus, it is important to know the effectiveness of a PRO system in order to determine the overall PRO membrane performance.
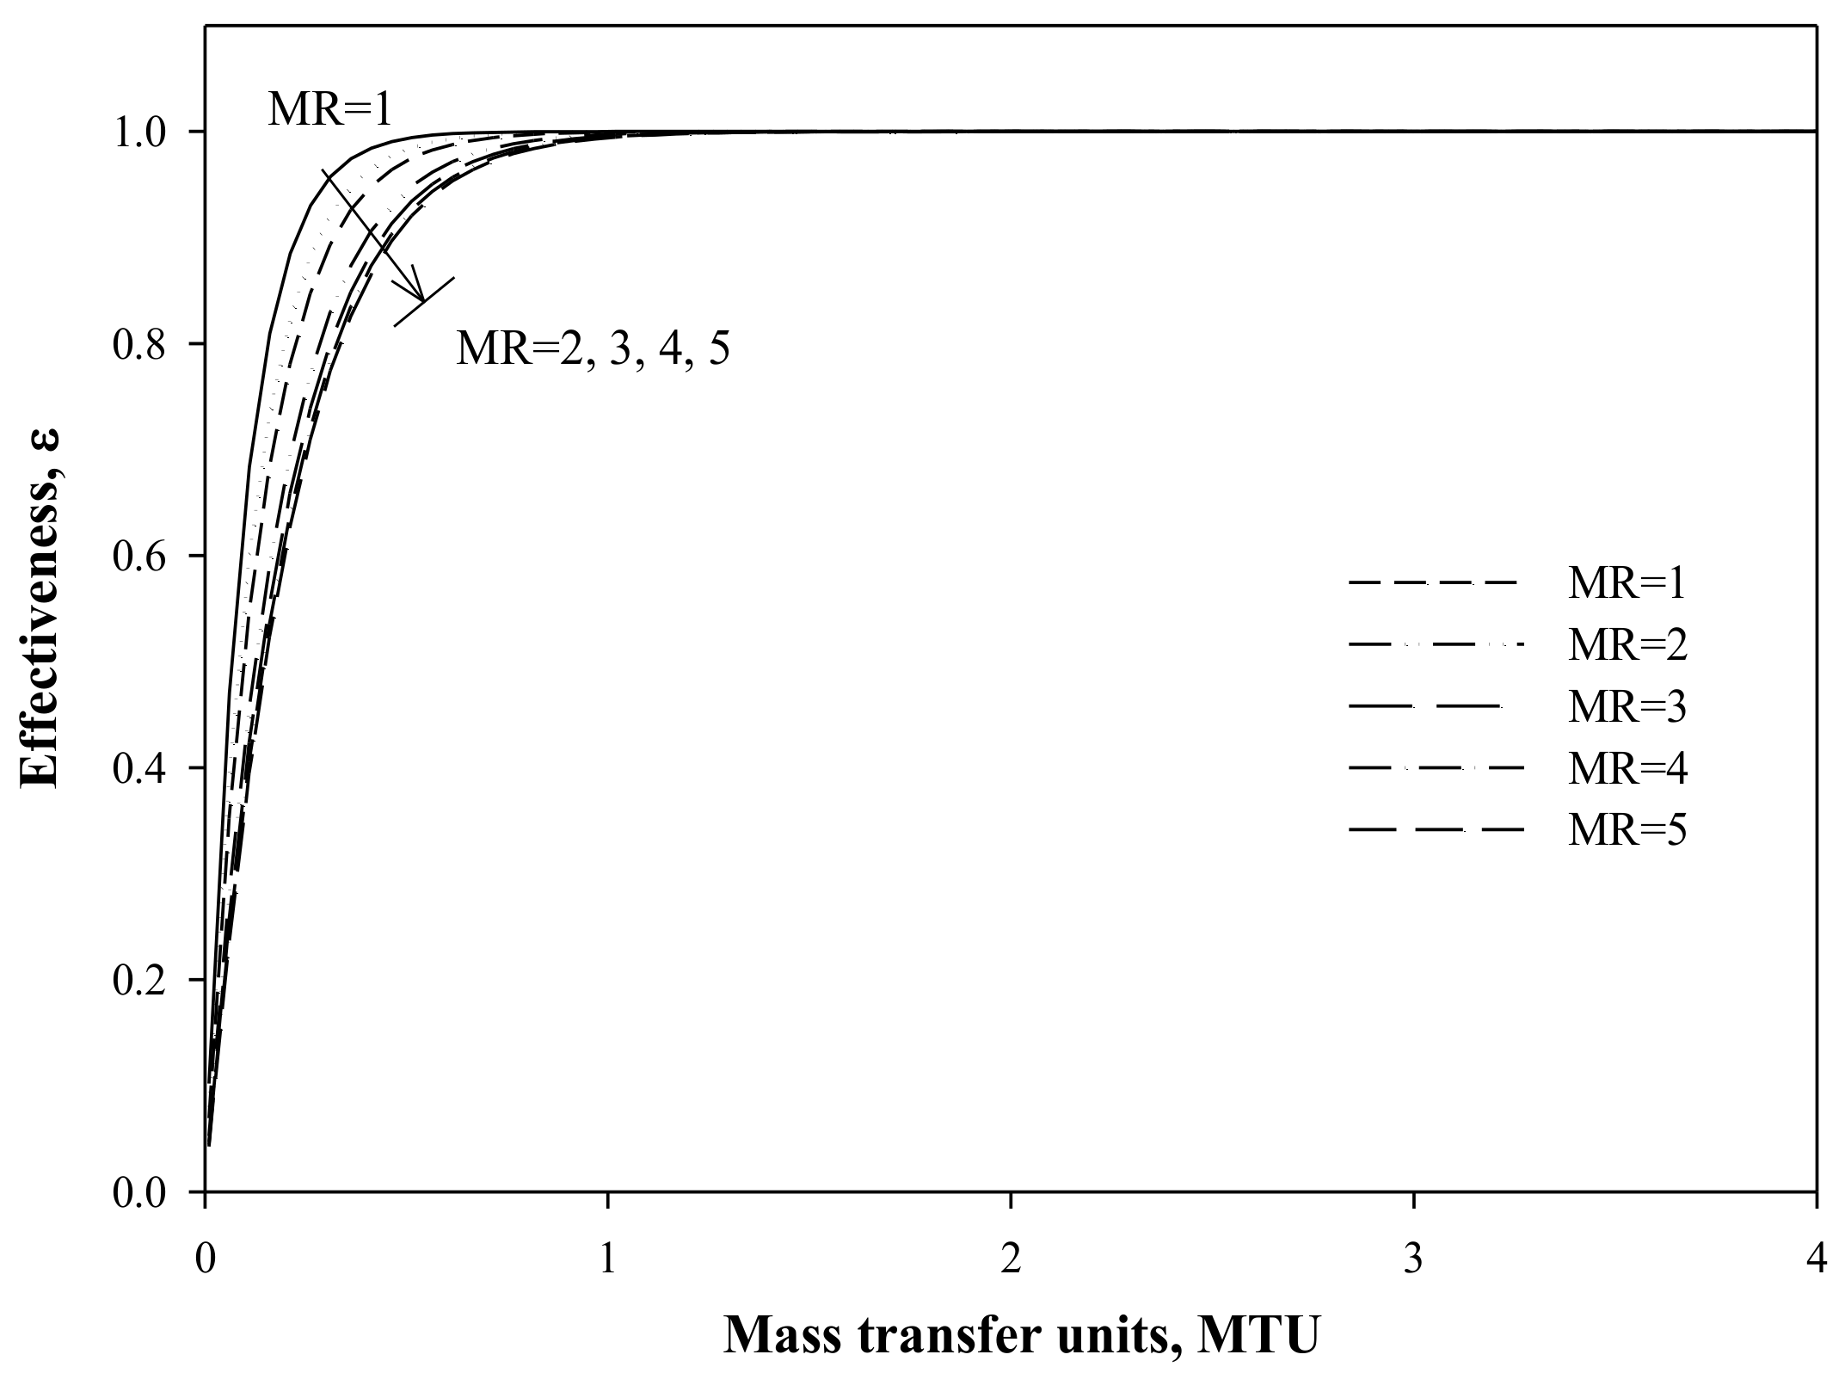
As illustrated in
Figure 11 and
Figure 12, the effectiveness of the PRO system for the treatment of TWE requires larger MTU compared to that of treating seawater as the feed. At higher values of MR (>1), the effectiveness is gradually increased to unity at larger MTU values. High MR means a higher draw flowrate than the feed flowrate, and hence, the draw solution concentration will not experience a drastic change because the permeate flowrate is low compared to the draw flowrate at high MR. However, the feed solution will become more concentrated due to continuous water permeation, which reduces the overall permeation mass flowrate, hence requiring greater MTU. Moreover, for the treatment of TWE and brine solution, more water permeates across the membrane due to larger osmotic pressure caused by the concentration difference between TWE (1 g/kg) and the brine solution (70 g/kg), which can lead to a higher concentration of the feed solution. As a result, both the ICP effect and transport resistance increase, and a larger MTU is required to achieve the same desired effectiveness as obtained in the treatment of seawater and brine solution.
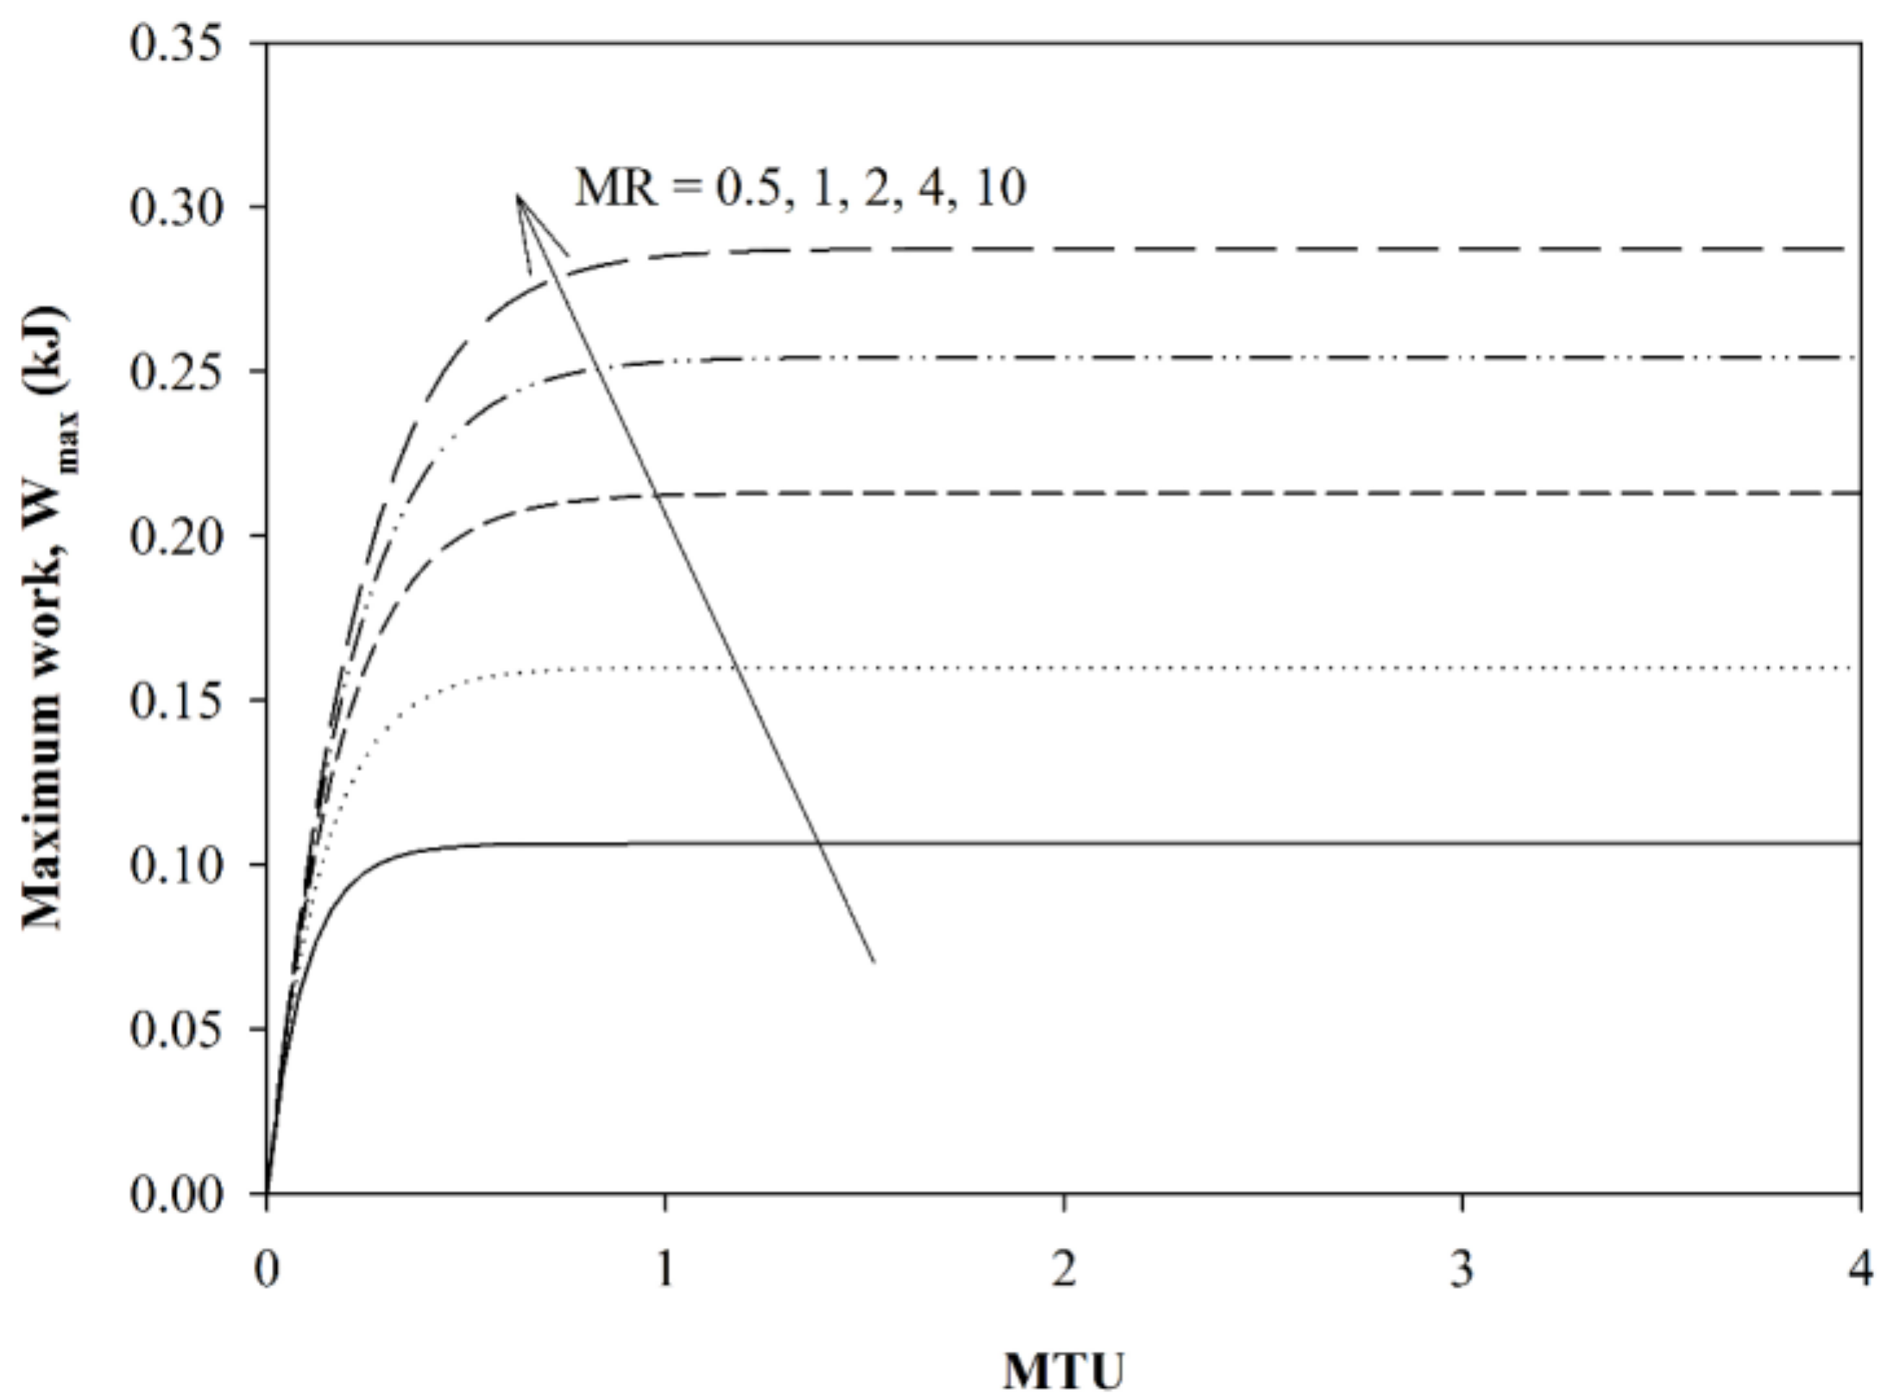
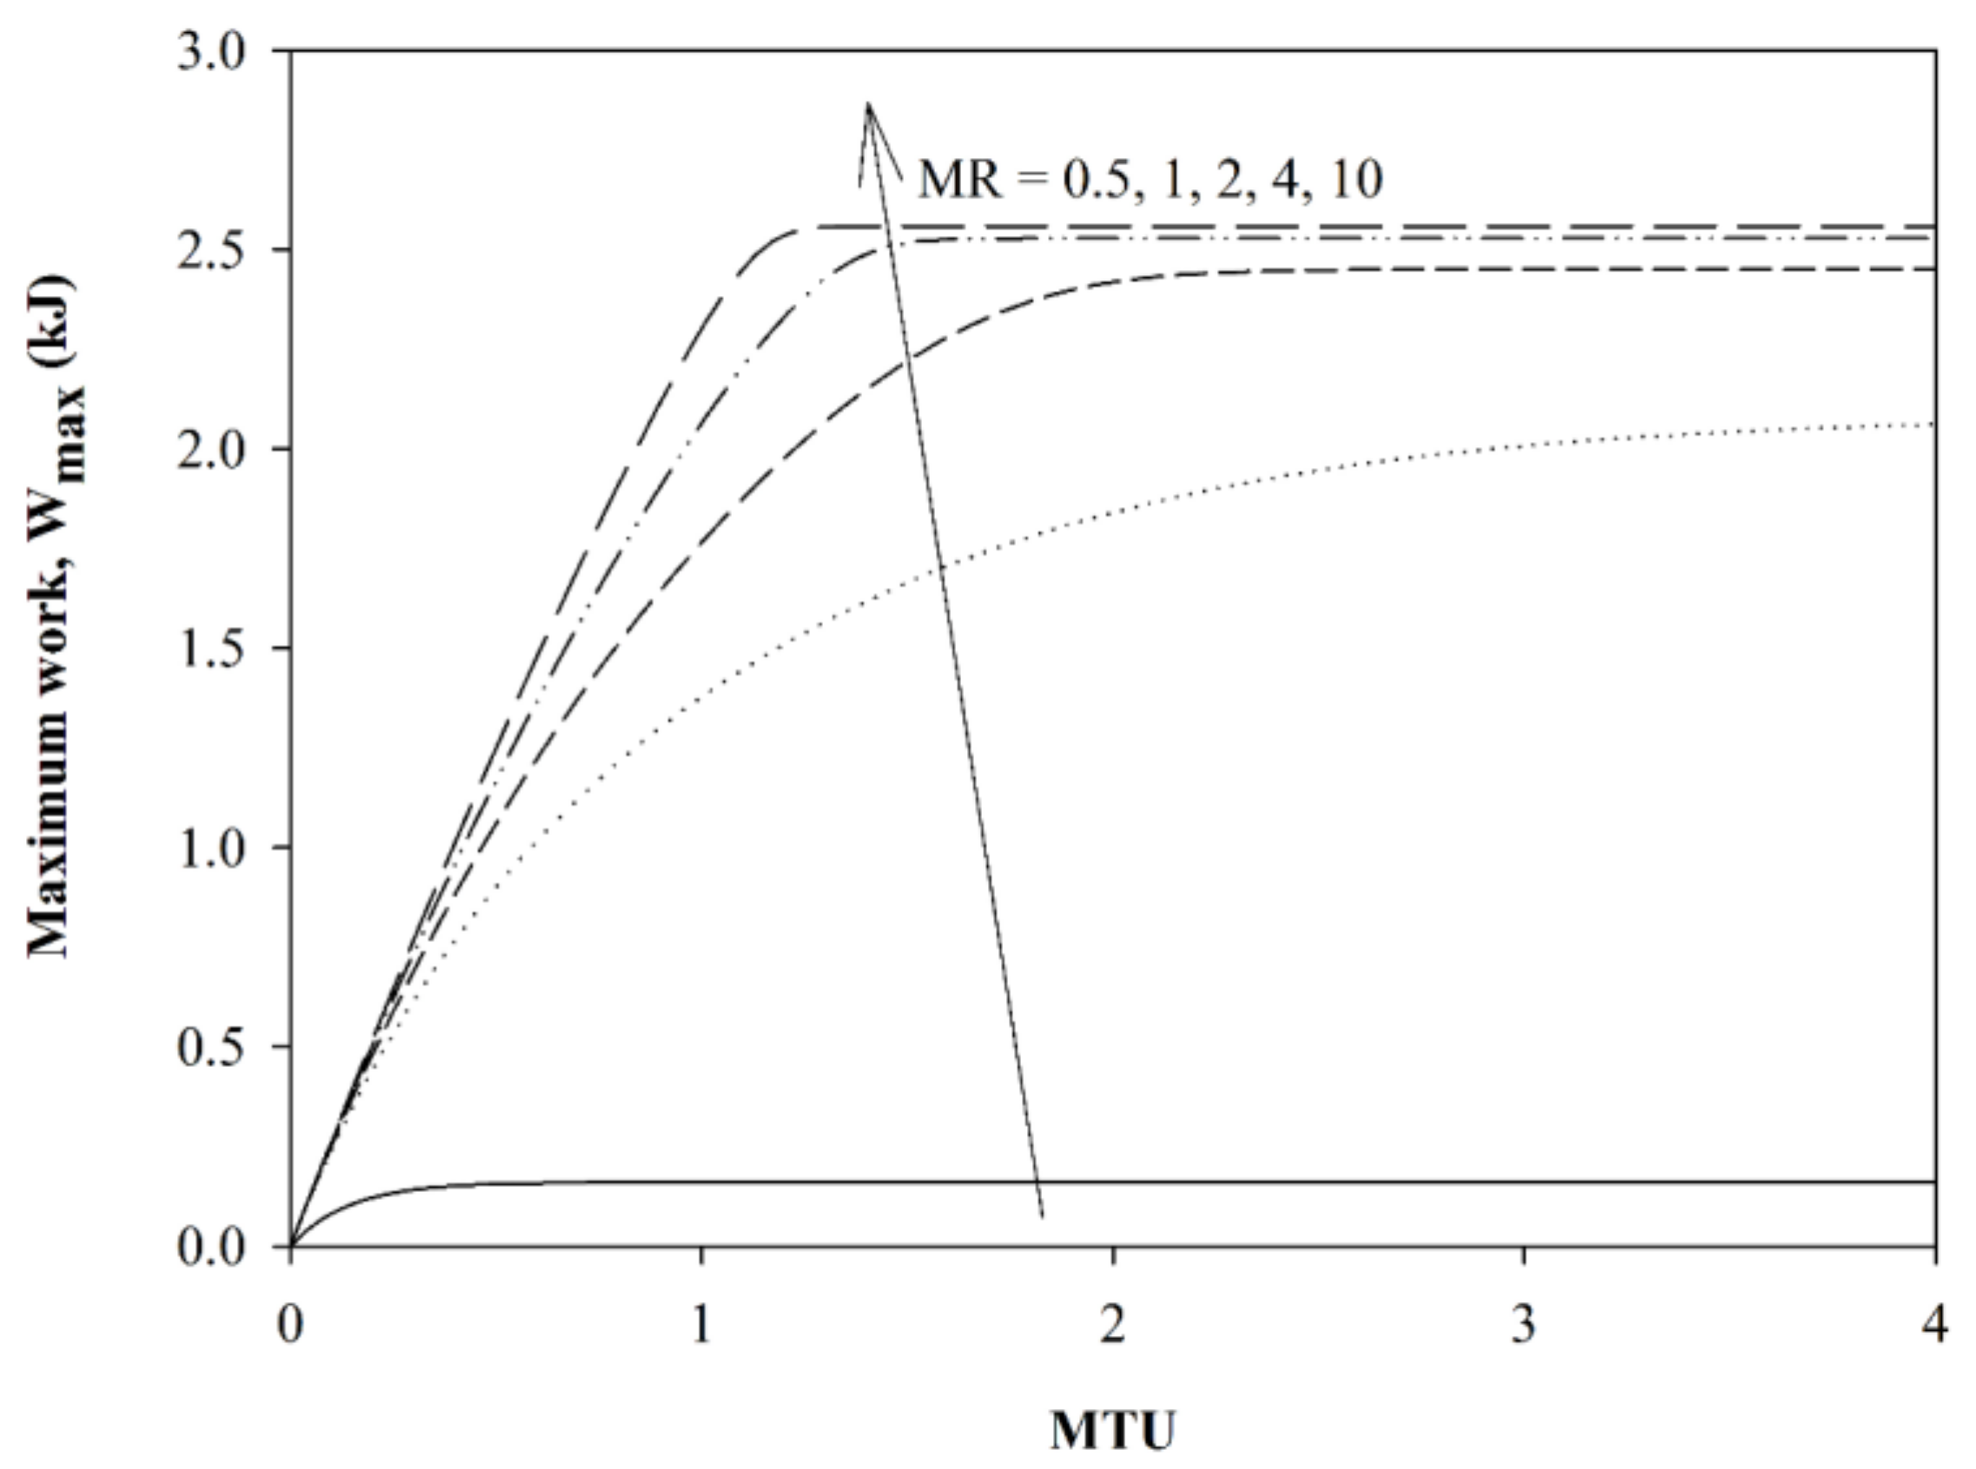
One of the most important features in the PRO system is generating power using osmotic pressure differences.
Figure 13 and
Figure 14 show the maximum work versus MTU with MR contours using TWE and seawater as the feed, respectively, and brine as the draw solution. As observed, the treatment of seawater and brine solution produced significantly lower work compared to the combination of TWE and brine solution. The maximum work is found to be increased with MTU and MR values. As seen from Equation (33), the power generated per unit membrane area is proportional to the water flux produced and the pressure drop across the membrane. With respect to the TWE feed stream, a maximum power of 2.6 kJ is attained at MR = 10. However, for the seawater feed stream, the maximum work of 0.28 kJ at the same MR is attained, which is significantly lower than that of the TWE feed stream. It is clear that higher water flux can be produced when TWE is used as the feed and brine as the draw solution due to the larger salinity difference; hence, more power can be obtained after depressurizing these permeates through a hydro-turbine [
18]. A similar trend was obtained by Banchik et al. [
25] that the power generation is proportionately increased with the feed salinity difference and MR values.


