Polycentric Development and the Role of Urban Polycentric Planning in China’s Mega Cities: An Examination of Beijing’s Metropolitan Area

1
Institute of Geographic Sciences and Nature Resources Research, Chinese Academy of Sciences, Beijing 100101, China
2
Key Laboratory of Regional Sustainable Development Modeling, Chinese Academy of Sciences, Beijing 100101, China
3
College of Resources and Environment, University of Chinese Academy of Sciences, Beijing 100049, China
4
Department of City and Regional Planning, University of North Carolina, Chapel Hill, NC 27599-3140, USA
*
Author to whom correspondence should be addressed.
Sustainability 2018, 10(5), 1588; https://0-doi-org.brum.beds.ac.uk/10.3390/su10051588
Submission received: 28 April 2018
/
Revised: 8 May 2018
/
Accepted: 10 May 2018
/
Published: 16 May 2018
(This article belongs to the Section Sustainable Urban and Rural Development)
Abstract
:An emerging polycentric spatial structure in China’s mega cities has been confirmed in the literature, but few studies have addressed the linkage between the change in spatial structure and urban development policies. Using Beijing as a case study, this paper examines the role of urban polycentric planning in the polycentric evolution process from a morphological perspective. We observed that urban polycentric planning significantly promoted the emergence of a polycentric urban form in Beijing’s metropolitan area from 2001 to 2010. Firstly, most of the planned subcenters were identified as real employment subcenters by a relative threshold method in 2001 and 2010 and comprised the majority of the employment subcenters. Secondly, the planned subcenters significantly increased their employment share and influence on employment and population distribution from 2001 to 2010, and their performances referring to these aspects were much better than the unplanned subcenters. Thus, our findings provide evidence that changes in urban spatial structure can be strongly affected by urban development policies, although it is determined by market forces in theory.
1. Introduction
Changes in urban spatial structure are a critical issue because of the social, environmental, and economic impacts involved [1]. Recently, a polycentric urban structure is considered to be useful for alleviating the increasing urban diseases, such as traffic congestion, air pollution, and a lack of affordable housing, and then contribute to the environmental and social sustainability of urban development.
In China, polycentric development has aroused wide interest in urban development practice and academic research. Due to its fast urbanization, China’s mega cities have been suffering from the high pressure of population concentration in the city centers, and this phenomenon is often blamed on the monocentric spatial structures. Inspired by the polycentric practice and research on Western cities, China’s urban planners firmly believe that polycentric development has become a necessary choice for mega cities. Therefore, urban planning, the main carrier of urban development policies, in many large and mega cities has adopted a polycentric spatial development strategy, that is, planning a number of urban subcenters in the suburban areas. At the same time, with the establishment of the land market in the 1980s, the land price in the city center has been soaring, which forced many industries to move to the suburbs [2]. Thus, these planned subcenters have supplied development space for these decentralized firms, which significantly promotes the employment growth in suburbs.
Many studies, mainly empirical studies examining population distribution and land prices [2,3,4,5,6,7,8,9], have investigated the polycentric spatial structure in China’s mega cities, and a few studies have done this from the perspective of employment distribution [10,11,12]. These studies have demonstrated that many mega cities in China have been experiencing polycentric development resulting from the emergence of subcenters and the increasing intensity of development in the suburbs. However, few empirical studies have related the emergence of polycentric spatial structure to urban polycentric planning; thus, the question of whether urban polycentric planning has promoted the emergence of polycentric spatial structure in China’s mega cities largely remains unclear.
Using Beijing as a case study, this paper aims to investigate the role of urban polycentric planning in the process of emerging polycentric spatial structure by answering the following two questions: Have the planned subcenters evolved to real subcenters? And how have the planned subcenters performed, especially compared with the unplanned subcenters? To achieve this objective, we first identified employment subcenters in 2001 and 2010 and then analyzed the spatial match between the identified subcenters and the planned subcenters. Next, we compared the planned and unplanned subcenters in terms of employment growth and the subcenters’ effects in structuring employment and population distribution. This paper may contribute to the understanding of how urban development policies or plans influence the spatial distribution of economic activities and inspire cities that also aim to establish a polycentric spatial structure.
The paper is organized as follows: Section 2 is a brief literature review of the debate on polycentricity and its driving forces. Section 3 introduces the polycentric practice in China’s cities, and Section 4 presents the methodology. Section 5 indicates the results of the identified employment subcenters and urban spatial structure change. The conclusion and discussion are presented in Section 6.
2. Theoretical Background
2.1. Concept of Polycentricity on an Intra-Urban Level and Its Measurement
According to our review of the literature, polycentricity is a flexible concept regarding the definition of spatial scale and how to describe it from various perspectives. The intra-urban scale is a spatial level that scholars have described as the traditional notion of polycentricity, that is, the distribution of economic activities in a metropolitan territory is determined by multiple nodes instead of a single node [13]. On this scale, the concept can be conceptualized from the morphological and functional perspectives. Although the coexistence of more than one urban center is supposed to be the shared characteristics in both cases, differences exist. The morphological perspective describes the spatial distribution of cities or towns in terms of population and employment [14,15], whereas the functional perspective examines the interaction of these places in terms of knowledge-based flows of people, goods, and information [16,17].
Thus, polycentricity on an intra-urban level can be measured from these two perspectives. The morphological refers to the spatial distribution of economic activities across a region. The measurement has been traditionally related to the decentralization of employment, namely, the appearance and identification of centers in metropolitan areas that once were monocentric [18]. The analysis of the relative and absolute job growth of these centers relative to the traditional main center and the remainder of the area has also been conducted to examine the spatial pattern of employment. Additionally, scholars have argued that how the density gradient associated with centers, such as employment and population distribution, has changed over time is more important to confirm the polycentricity of a metropolitan area [19,20]. Notably, a combination form is often adopted to explore whether a monocentric spatial form has transformed into a more polycentric form or a dispersed form.
The functional dimension starts when there are functional linkages among the centers of an urban system [21,22]. In empirical research, the method is typically to measure the commuting flows of people between the centers of the polycentric region. In addition to the distribution of these flows, the key point of analysis is the direction of the linkages among the centers. An equal balanced distribution and two-way flows among centers are the indicators of polycentricity. Several approaches have been developed in empirical studies, such as the entropy index [17], a network density indicator [23], and a gravity model [24,25]; however, although an increasing number of studies have considered functional polycentricity, research on the subject is still in the development phase.
2.2. Spatial Outcomes, Markets Forces, and Planning Tools
The spatial structure and its changes can be affected by factors from two main aspects: market forces and urban development policies. As discussed, in the transformation process from monocentric to polycentric, the most significant feature in a morphological perspective is the emergence of employment subcenters [26,27,28], and it has often been explained in the view of new urban economics theory, which argues that the tension between “agglomeration economies” and “agglomeration diseconomy” determines the growth of employment subcenters [29,30]. Specifically, firms will relocate from the city center due to its agglomeration diseconomy and tend to locate proximal to other firms to gain considerably more benefits, such as knowledge spillovers and services sharing; additionally, then some nodes will gradually grow into subcenters [18]. The locations of these subcenters are often places with certain advantages, such as high accessibility to labor and low transportation costs, and the number of subcenters largely depends on the possibility of replicating the economies agglomeration that existed in the central business district.
Additionally, the prediction of the emergence of a dispersed pattern was also based on the discussion of validity or otherwise of the agglomeration economies [29,31,32]. The main argument has been that the improvements in private transportation and telecommunications reduce the importance of agglomeration economies; thus, the employment tends to increasingly disperse in the spatial.
Although market forces are building cities in the long run, the governments can also influence the employment subcenters’ growth with policy tools, including land use allocation and management, infrastructure investments, and taxation [33,34]. These tools can indirectly shape city spatial structure. For example, increasing land supply and enhancing the accessibility of the suburbs can promote the decentralization of employment from the city center, contributing to the formation of subcenters. By contrast, the measures that reduce traffic congestion, enhance land use efficiency, and limit urban expansion in the suburbs may help the city maintain a monocentric urban form.
In some East Asian countries, urban development has always been strongly affected by state planning policies [35,36,37]. For example, in Tokyo, transit construction supported by a government development project serves as a means of intervention to regulate cities and has produced a strong influence on the spatial structure. In Seoul, the government has employed state-led land and housing development to construct multiple new towns, which has largely promoted the formation of a polycentric city region.
In China, the land use system has given the planners significant power to regulate the development of cities. The land use is strictly controlled by the governments, and the agricultural land can be used for urban construction only after land acquisition by the government [38,39]. In this case, the government has the absolute power to decide the location and use of urban land development. After acquisition, the land use right transfers to land users through bidding and auctions; however, this method of transfer is mostly used in commercial and residential land use. Industrial land is sold according to the so-called “agreement transfer”, which makes the industrial land price much lower than its market value. This situation further strengthens the influence of the government on the geographies of industries [40,41].
Infrastructure construction is another instrument for China’s urban planners to affect the development of cities. The government not only controls the construction of the road networks, including subway lines and highways, but also most of the hospitals, schools, and parks—all of which can be used to shape the distribution of employment and population.
In summary, urban forms are largely determined by market forces in the long term; however, they can be strongly affected by urban development policies or plans. In China, though it has been transforming from a planned economy to a market economy, the government can employ several policy tools to strongly influence the spatial structure. These tools have been employed by many large or mega cities’ urban planners to achieve polycentric development. Thus, it is of both academic and practical value to research whether these plans have enhanced the emerging polycentric spatial structure that was basically driven by the market forces in theory [35].
3. Urban Polycentric Planning Practices in China’s Cities
Polycentricity as a planning concept was introduced in China at the end of the twentieth century. The early attempt to apply polycentricity started in several mega cities (e.g., Beijing and Shanghai) and aimed to overcome the increasing rates of urban diseases in the city centers. Since then polycentric development has been adopted by other large and mega cities in their spatial development strategies [42,43]. On an intra-urban level, the practice was guided by so-called urban master planning, which mainly includes two levels of planning: the city region and the metropolitan area. Nevertheless, the polycentricity practice on an intra-urban level is mainly in the metropolitan areas: the central city, its urban–rural fringe, and some rural areas.
As outlined, on an intra-urban level, polycentricity application often refers to the development of multi-centers in one region; therefore, fostering a number of urban centers has become one of the main aims to achieve polycentric development. This idea can be observed in several terms used in the urban master planning of mega cities, for example, multi-cores, multi-centers, multi-clusters, clustered spatial layout, and multi-spots. In addition, the main functions of these centers such as commercial centers for industry development have also been defined. However, the plans have considered the connections among the main center and subcenters while the connections among subcenters have been largely overlooked. In this sense, the practice can be viewed as morphological polycentricity planning more than a functional version.
Among these mega cities, Beijing is a typical one which has carried out two rounds of master plans both referring to polycentric development [44]. The 1991–2010 vision outlined a “decentralized cluster style”. In this proposal, besides the existing old city, the urban area also consisted of ten edge clusters which were mainly planned to accommodate the expanding population from the city center. Fourteen satellite towns in the suburb area and some development zones were also established as supplements of decentralized development. At the same time, the planning paid attention to controlling the development of the city center. However, with the continued expansion of the city, the city center merged completely with the edge clusters [45], indicating that this practice has been largely unsuccessful. The 2004–2020 vision continued the idea of decentralized development and two major instruments were adopted. One was to promote the development of a number of development zones or high-tech industrial parks, such as Zhongguancun, Shangdi; another was to establish 11 new towns, which were the former satellite towns, to attract the relocated population and industries from the city center. The development zones and the new towns, in essence, played the role of subcenters. To enforce the connections between the city center and these subcenters, many rapid transportation lines were constructed.
These planned subcenters have advantages and disadvantages in their development processes compared with other areas. Regarding the advantages, firstly, the planned subcenters are already in a position to receive urban construction land, and this provides them with a solid foundation to attract firms. Secondly, the government provides considerable financial aid to support the construction of traffic facilities, which can significantly increase the accessibility of these subcenters in just a few years. Last but not the least, the new-industry firms, especially high-tech firms, have usually been required to locate in these planned subcenters. On one hand, these subcenters can continue to attract additional firms to expend their size; on the other hand, the existing firms often have a relatively high growth potential.
Regarding the disadvantages, some of the development zones are located in remote suburban areas featuring poor development foundations and lacking facilities. Although the government strongly supports the construction of traffic facilities, public services lag behind due to the single industrial development function, which leads to a poor attraction of highly skilled labors [46,47]. The planned new towns are in a similar situation, although they are much better than the development zones.
From the perspective of the relationship of these development polices and market forces, fostering the development of several employment subcenters is largely in line with the market logic. The land market reform in the 1980s has led to the booming development of commerce in the city center, which has significantly raised the land price. The high land price forced many industries in the city center to move to the suburbs and also prevented the new industries from entering into the city center. In this situation, the industries have a strong willingness to get development space in the suburbs. At the same time, these industries also tend to locate proximal to other firms rather than dispersing in spatial. Thus, the planned subcenters can supply development space for these industries and will be also of benefit to their spatial agglomeration. In other words, the urban form tends to evolve into a decentralized pattern under the market forces, and these polycentric development policies may boost this evolution process.
4. Methodology
The analysis starts with the identification of employment subcenters by a threshold method. To answer the first question, the spatial location of identified employment subcenters is matched to the planned development zones and new towns to determine whether these planned areas have grown into subcenters. For the second question, we first compared the employment growth between the planned and unplanned employment subcenters. Then we established a common polycentric model to investigate the subcenters’ influence on structuring the spatial elements distribution, including employment and population. A similar comparison was also conducted. The higher employment growth and stronger influence of the planned employment subcenters indicate the higher effective degree of the urban polycentric planning in the evolution process.
4.1. Research Area and Data
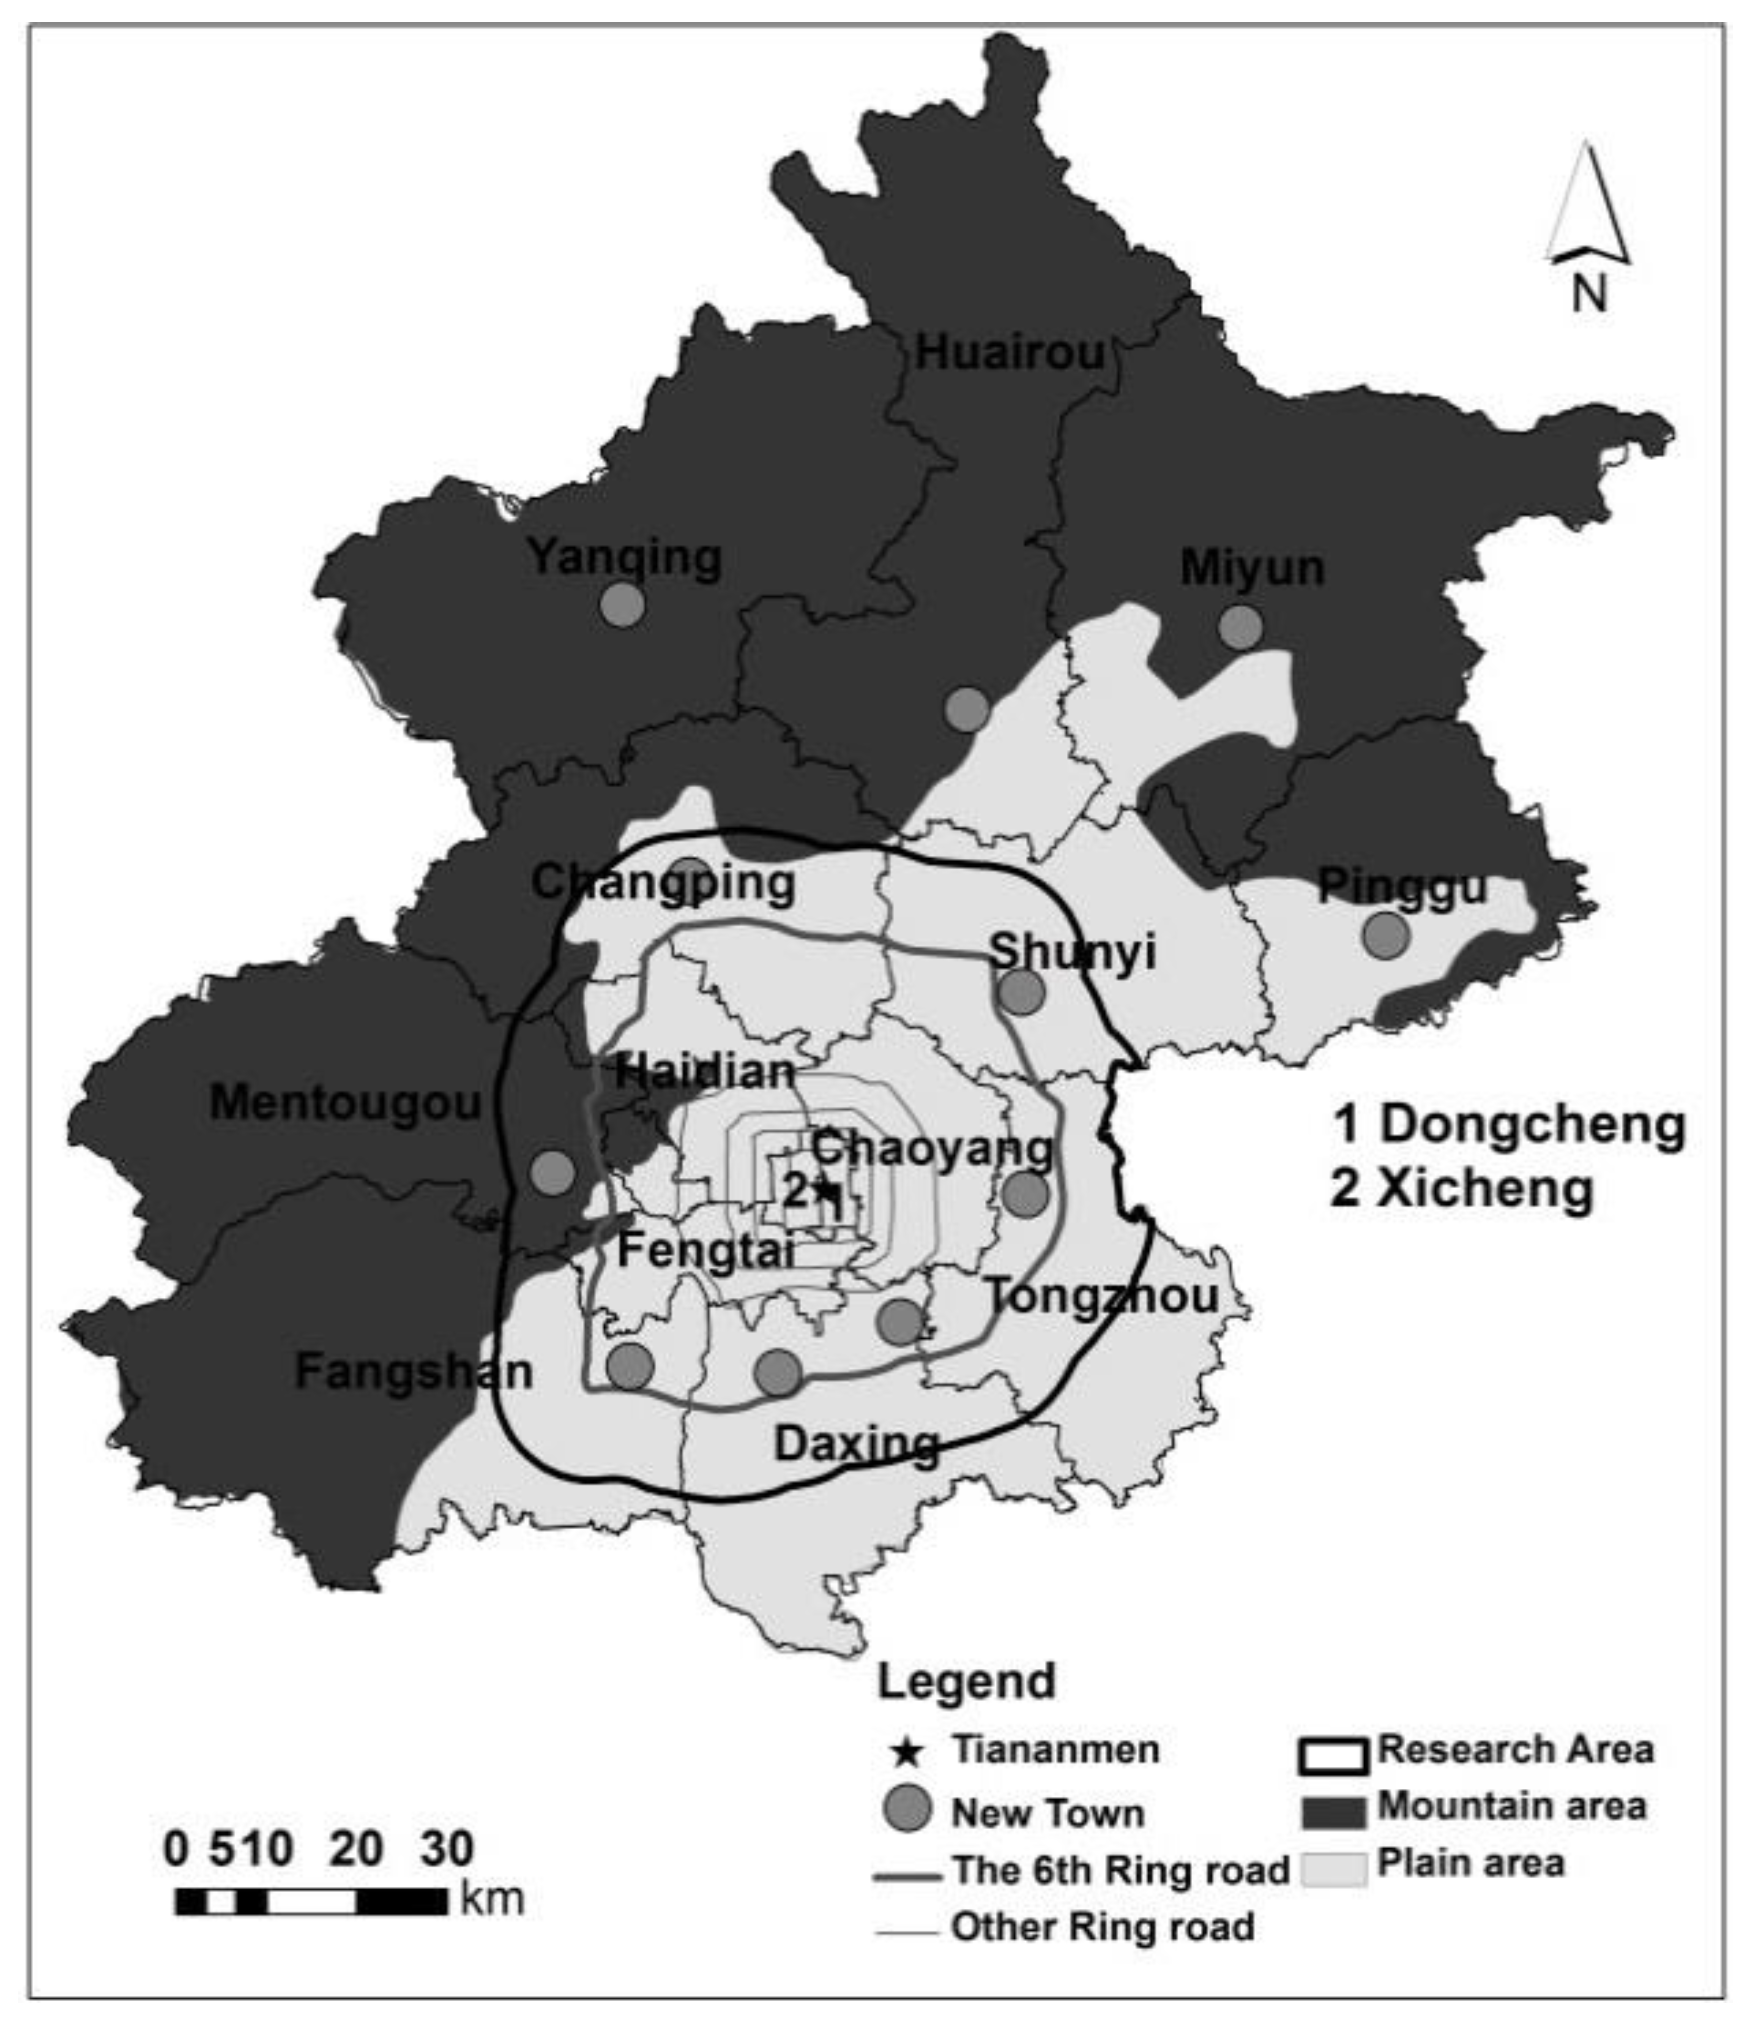
The research area of a city’s spatial structure is often the metropolitan area; however, the metropolitan area of Beijing is not clear. Beijing’s metropolitan area has been defined by its twelve districts: two districts in the central city, four districts in the inner suburbs, and six district in the outer suburbs. This definition is based on the administrative boundaries of the municipal districts and may be too large because it comprises many mountainous regions and areas too remote to commute to the central city (Figure 1). For example, the distance from areas within the Fangshan district and Mentougou district to Tiananmen is greater than 70 km.
According to our understanding of Beijing, we define the research area as the area within the 6th Ring Road and a 10 km outer buffer zone (the average radius is 35 km) (Figure 1). First, this scope is the main developed area of Beijing and comprises approximately 80.9% and 74.5% of the total population and firms in 2010, respectively. Second, the area is a reasonable commuting scope; according to bus-pass data, the majority of transportation flow occurs within this area [48]. Third, this area contains most of the planned subcenters (i.e., the development zones and new towns), except for the four remote new towns, namely, Pinggu, Miyun, Yanqing, and Huairou. Thus, it is a reasonable research area for this study.
The employment data are from the registered enterprises and institutions in 2001 and 2010, and supplied by the Beijing Industry and Commerce Bureau [11,49]. The collected information includes enterprise and institutional names, addresses, employees, turnover, and registered capital. Table 1 presents the number of enterprises & institutions and employment in our research area.
To calculate the employment density, we first defined the research units. Streets (or towns) have often been used as research units in the literature; however, streets (or towns) are too large to identify the employment subcenters, given that their average area is approximately 22 km2. Therefore, we used the road network data to produce a number of blocks as the research units. After excluding certain blocks without employment, we identified 1183 research units from 2001 and 1225 research units from 2010. Next, we calculated the employment density of the units.
The population data are from censuses on the populations at the street level conducted in 2000 and 2010. Due to changes in the boundaries of streets and their borders being unclear, we merged certain streets in the 2010 map to match those in the 2000 street map. As a result, our research units included 190 streets.
4.2. Identifying Employment Subcenters
Since the reform in 1980s, Beijing has experienced rapid population growth and urban sprawl. The city center has grown beyond the scope of “the old city” (Dongcheng and Xicheng) in the urban landscape, and its scope is unclear. In the 1991 version of the city master planning, the area within the 4th Ring road was designated as the city center. In this paper, we also define this area as the city center. Some studies have argued that the areas within the 4th Ring road are actually a large employment center, and the spatial distribution of employment density shows that these areas are more similar to an integration region [11].
Several methods have been adopted to identify employment subcenters in metropolitan areas; however, for the analysis of subcenters over time, the threshold method is usually preferred [19]. Moreover, Muniz et al. argued that instead of specifying fixed numerical values, a relative threshold is particularly appropriate when employment has grown significantly between different years [50]. He selected those municipalities with a gross employment density higher than the metropolitan area average and accounted for at least 1% of the total metropolitan employment as subcenters. The employment of Beijing has also grown significantly between 2001 and 2010; thus, the relative threshold is more suitable for identifying subcenters in Beijing. This paper uses the following standards of thresholds to identify subcenters.
Dt ≥ D (average value of the research area)
Et ≥ 0.5%E (total employment of the research area)
Dt is employment density of the research units, and Et is the total employment of the contiguous high density units at time t.
4.3. Employment Subcenters’ Influence and Changes
In a polycentric model, the most important symbol is the emergence of employment subcenters, and the access to the agglomeration economies generated by them is limited by distance. To test the employment subcenters’ influence, a simple and common polycentric model has been established [20,50].
D(dTAM,dSUB,dX) is the employment density or population density of units; dTAM, dSUB_nearest and dX are the distance from a unit to Tiananmen, the inverse distance of the nearest subcenter and X (X is the infrastructure, such as subway station or highway interchanges), respectively.
To be clear, the dummy variables of the distance to the infrastructure fit the model better than the continuous variable. In this paper, we include dummy variables that equal one when a unit is within 1 km and between 1 and 3 km of the infrastructure. Some of the variables’ descriptive information is presented in Table 2.
Model (3) can be estimated by the ordinary least square and a significant and negative value of the coefficients (γ < 0 and u < 0) would indicate that employment density or population density decreases with the distance increasing from these variables. For the inverse distance to the nearest subcenters, a significant and positive value (δ > 0) of the gradient has the same meaning. Additionally, the higher the absolute values of these coefficients, the higher the influence of these variables on employment and population distribution.
To test whether the influences of the planned and unplanned subcenters are significant and how they change over time, the samples assigned to the planned and unplanned subcenters have been estimated, respectively.
5. Results
5.1. Analysis of Identified Subcenters
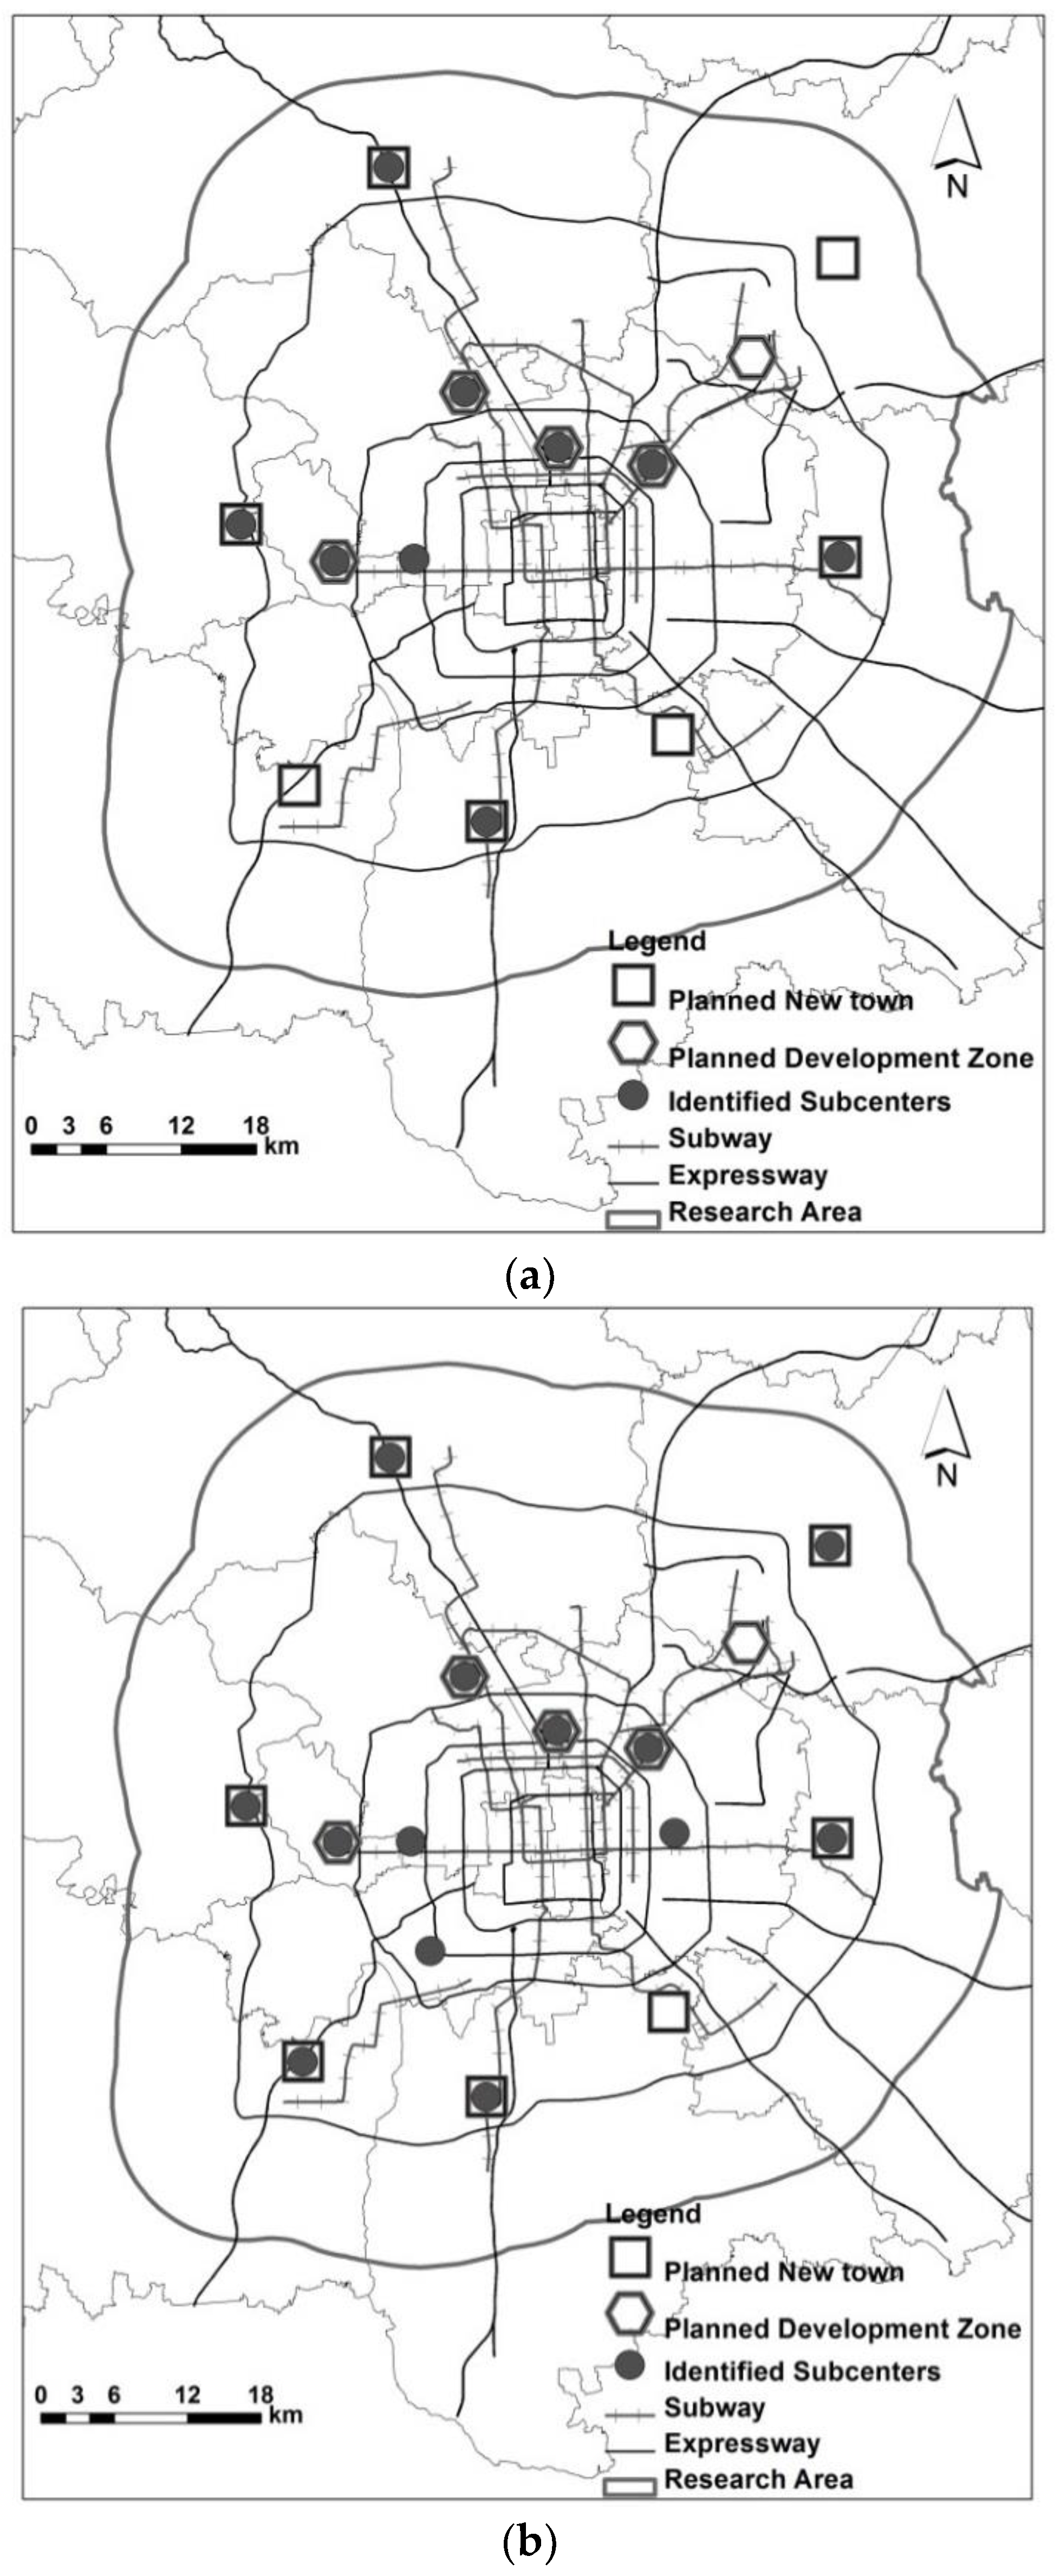
Figure 2a,b and Table 3 present the results of identifying employment subcenters in 2001 and 2010. The main findings are summarized as follows.
First, employment subcenters increased in number and size from 2001 to 2010. The number of employment subcenters increased from 9 in 2001 to 13 in 2010. Most of the subcenters experienced significant growth in employee number and share, and the growth rates of some employment subcenters exceeded 150%. Two subcenters’ employment numbers and share declined, namely, Mengtougou and Shijingshan. Fengtai showed a decline only in employment share, and this may be related to the relocation of several huge industrial firms during this period, like the Capital Metal Factory.
Second, although the subcenters demonstrated the most growth in employment, they had less power compared with the city center. Employment subcenters had a more significant growth during the period (Table 4). The 10.59% employment was concentrated in employment subcenters in 2001, and the same employment subcenters’ percentage increased to 13.39% in 2010: an increase of 2.80%. When we added the new subcenters, the employment share of subcenters increased to 15.29% in 2010; however, the employment share of the subcenters was 15.29%, that is, a low percentage compared with 58.3% of the city center.
Third, most of the identified subcenters were the planned ones in the urban polycentric planning and only three were unplanned. The results from the spatial location match between the planned subcenters and identified subcenters indicated that four of seven new towns were employment subcenters in 2001, and this number grew to 6 in 2010. Four development zones were employment subcenters in 2001 and 2010, except Tianzhu. By contrast, only one employment subcenter was unplanned in the map in 2001, and this number increased to three in 2010. Notably, these subcenters appeared in the area most proximal to the city center, and a possible reason for this may be that residents can enjoy the attractive facilities in these locations and the agglomeration economy from the city center.
Fourth, the subcenters that were planned development zones had the highest employment share compared the other types of subcenters and also the most growth, followed by the new towns. The employment share of the development zones was 5.24% in 2001 and increased to 7.91% in 2010; by contrast, the new and unplanned towns accounted for 3.59% and 1.76% in 2001, respectively, and only slightly increased in 2010. This phenomenon is not surprising considering that most of the industries were encouraged to locate or relocate to these development zones.
5.2. Employment Subcenters’ Influences and Their Changes
5.2.1. Employment Density
The results of all samples are shown in Table 5 (specifications (1) and (2)). The coefficients of the distance to Tiananmen and the subcenters are significant and their absolute value is larger from 2001 to 2010, indicating that Tiananmen and the subcenters both increased their influence from 2001 to 2010. This finding is consistent with the results of employment growth: employment tends to concentrate in the city center and subcenters.
The results of the planned and unplanned subcenters are presented in specifications (3)–(4) and (5)–(6), respectively. Regarding the planned subcenters, the effect of the distance to the planned subcenters was significant in both 2001 and 2010, and its value increased from 2001 to 2010, indicating that the planned subcenters extended their influence on employment distribution. Regarding the unplanned subcenters, their effects were not so significant in 2001 and then significant in 2010; simultaneously, the coefficients also increased from 2001 to 2010. These findings also indicate an increasing effect of these unplanned subcenters.
Compared with the planned and unplanned subcenters, the coefficients of the planned were much higher than that of the unplanned in 2001 and 2010. According to the means of the coefficients, this result indicates that the planned subcenters have more power in structuring employment distribution than the unplanned subcenters.
The control variables, in general, have a significant and positive effect on employment distribution, and the distance to the subway seems to have a larger influence than the distance to the highway. This may be because of the rapid construction of the subway network during the period and the congestion of ground traffic.
5.2.2. Population Density
The results of all the samples are shown in Table 6 (specifications (1) and (2)). The coefficients of the distance to Tiananmen are significant in both specifications, and the absolute value increased from 2001 to 2010, indicating that Tiananmen’s influence on population distribution also increased. By contrast, the effects of subcenters were not significant in 2001 and then became significant in 2010, that is, the subcenters gradually affected population distribution.
The results of the planned and unplanned subcenters are presented in specifications (3)–(4) and (5)–(6), respectively. The effects of the distance to the planned and unplanned subcenters were both not significant in 2001 and then became significant in 2010, indicating their influences on population distribution increased. When comparing the planned and unplanned subcenters, the coefficients of the planned were more significant and had a larger value than that of the unplanned. Thus, the planned subcenters have more power in structuring population distribution than the unplanned subcenters.
The effect of the control variables is generally significant, and the subway has a larger effect on population distribution than the highway. Moreover, in specifications (5)–(6), the effects of the subway and highway were insignificant in 2001, and the effects of the subway became significant in 2010, whereas the highway still had a weak influence. There may be two reasons for these phenomena. On one hand, the not-planned subcenters are relatively proximal to the city center and have a convenient road network that reduces their dependence on the highway and subway. On the other hand, the construction of subways has prioritized enhanced accessibility of planned subcenters followed by the other areas; thus, the subway around the not-planned subcenters may not have been sufficient to produce a strong effect in 2001.
6. Conclusions and Discussion
In China, urban polycentric plans have prevailed in Chin’s mega cities since the late 1990s. Although the recent literature showed that a polycentric spatial structure has been emerging in China’s mega cities, few have investigated the role of these plans in the evolution processes. Using Beijing as a case study, this paper explores the effects of urban polycentric planning on the evolution of spatial structure by examining the growth of planned subcenters and their influences on structuring employment and population distribution.
Our results showed that polycentric planning significantly promoted the transformation of urban forms in Beijing’s metropolitan area. First, most of the planned subcenters grew into real employment subcenters by 2010 and are the majority of the identified subcenters: eight of the nine identified subcenters in 2001 and ten of the thirteen identified subcenters in 2010 were the planned subcenters in urban master planning. Second, the planned subcenters have higher employment growth and a stronger influence on employment and population distribution compared with the unplanned subcenters. In other words, the performance of planned subcenters is better than that of the unplanned subcenters.
We argue that the success of planned subcenters results from the same work direction between market forces and government interventions. With the development of land markets, industrial and residential land uses in city centers gave way to commercial development [6]. In other words, market forces pushed the industries to the suburban areas. Under this case, the plans designate the agglomeration location for the industries, namely, the development zones and new towns. The strong support of land use and infrastructure construction from the government contributes to the rapid formation of these subcenters.
Our results also showed some not successful points in the planning. First, the city center continues to increasingly influence employment and population distribution, although the planning tried to decentralize its employment and population. The employment share of the city center grew from 57.0% in 2001 to 58.3% in 2010; and the absolute value of its coefficients in the polycentric models all increased, indicating employment and population tends to concentrate in the city center. This result can also be explained by the relationship between market forces and government interventions. To obtain the benefits of an agglomeration economy, the commercial or service industries, which can afford high land prices, tend to concentrate in the city center. Thus, the government interventions are in opposition with the market forces. Although the government controls the land supply, they can still increase development space by enhancing land use efficiency.
Second, the planned subcenters have a relatively weak effect in structuring population distribution. Although the effects of planned subcenters on employment distribution were both significant in 2001 and 2010, their effects on population distribution became significant until 2010. This result may be related to the function of the planned subcenters, that is, many are the development zones that aim to decentralize the industries in the city center.
In conclusion, by examining the growth of the planned employment subcenters and their effects in structuring urban elements, this paper demonstrates that urban polycentric planning has promoted the emergence of a polycentric urban form in Beijing, and provides evidence that urban spatial structure can be strongly affected by urban development policies, although it is determined by market forces in theory. Regarding policy implications, we suggest government policies fully consider the law of the market to achieve better effects. In Beijing, we also suggest that additional public services proximal to subcenters should be constructed to further enhance the effect of the planned subcenters in structuring population distribution. These measures may increase the overall efficiency of the city as well as its social wellbeing, and then contribute to urban sustainable development. In future, more studies should discuss the polycentricity of China’s cities from a functional perspective to increase the understanding of urban spatial changes and improve spatial plans.
Author Contributions
Conceptualization, Methodology and Writing-Original Draft Preparation, Z.L.; Writing-Review & Editing, S.L.
Funding
The research is supported by the Funds for International Cooperation and Exchange of the National Natural Science Foundation of China (Grant No. 41661144023).
Acknowledgments
The authors gratefully thank the reviewers and the editor.
Conflicts of Interest
The authors declare no conflict of interest.
References
- Lang, R.E.; LeFurgy, J. Edgeless cities: Examining the Concentered metropolis. Hous. Policy Debate 2003, 14, 427–460. [Google Scholar] [CrossRef]
- Huang, D.; Liu, Z.; Zhao, X.S.; Zhao, P.J. Emerging polycentric megacity in China: An examination of employment subcenters and their influence on population distribution in Beijing. Cities 2017, 69 (Suppl. C), 36–45. [Google Scholar] [CrossRef]
- Sun, B.; Shi, W.; Ning, Y. An empirical study on the polycentric urban structure of Shanghai and strategies in future. Urban Plan. Forum 2010, 23, 58–63. [Google Scholar]
- Yue, W.; Liu, Y.; Fan, P. Polycentric urban development: The case of Hangzhou. Environ. Plan. A 2010, 42, 563–577. [Google Scholar] [CrossRef]
- Feng, J.; Wang, F.; Zhou, Y. The spatial restructuring of population in metropolitan Beijing: Toward polycentricity in the post-reform era. Urban Geogr. 2012, 30, 779–802. [Google Scholar] [CrossRef]
- Wen, H.; Tao, Y. Polycentric urban structure and housing price in the transitional China: Evidence from Hangzhou. Habitat Int. 2015, 46, 138–146. [Google Scholar] [CrossRef]
- Huang, D.; Yang, X.; Liu, Z.; Zhao, X.; Kong, F. The Dynamic Impacts of Employment Subcenters on Residential Land Price in Transitional China: An Examination of the Beijing Metropolitan Area. Sustainability 2018, 10, 1016. [Google Scholar] [CrossRef]
- Liu, X.; Wang, M. How polycentric is urban China and why? A case study of 318 cities. Landsc. Urban Plan. 2016, 151, 10–20. [Google Scholar] [CrossRef]
- Ren, Y.; Berg, P.O. Developing and branding a polycentric mega-city: The case of Shanghai. In Branding Chinese Mega Cities: Policies, Practices and Positioning; Edward Elgar: Cheltenham, UK; Northampton, MA, USA, 2014. [Google Scholar]
- Sun, T.; Wang, L.; Li, G. Characteristics and formation mechanisms of polycentric spatial structure in Beijing metropolitan area. City Plan. Rev. 2013, 7, 28–32. (In Chinese) [Google Scholar]
- Huang, D.; Liu, Z.; Zhao, X. Monocentric or polycentric? The urban spatial structure of employment in Beijing. Sustainability 2015, 7, 11632–11656. [Google Scholar] [CrossRef]
- Lv, Y.; Zheng, X.; Zhou, L.; Zhang, L. Decentralization and polycentricity: Spatial changes of employment in beijing metropolitan area, china. Sustainability 2017, 9, 1880. [Google Scholar] [CrossRef]
- Cladera, J.R.; Duarte, C.R.M.; Moix, M. Urban Structure and Polycentrism: Towards a Redefinition of the Sub-centre Concept. Urban Stud. 2009, 46, 2841–2868. [Google Scholar] [CrossRef]
- Beckmann, M.J. City Hierarchies and the Distribution of City Size. Econ. Dev. Cult. Chang. 1958, 6, 243–248. [Google Scholar] [CrossRef]
- Parr, J. The Polycentric Urban Region: A Closer Inspection. Reg. Stud. 2004, 38, 231–240. [Google Scholar] [CrossRef]
- Van der Laan, L. Changing Urban Systems: An Empirical Analysis at Two Spatial Levels. Reg. Stud. 1998, 32, 235–247. [Google Scholar] [CrossRef]
- Limtanakool, N.; Dijst, M.; Schwanen, T. A Theoretical Framework and Methodology for Characterising National Urban Systems on the Basis of Flows of People: Empirical Evidence for France and Germany. Urban Stud. 2007, 44, 2123–2145. [Google Scholar] [CrossRef]
- Anas, A.; Arnott, R.; Small, K.A. Urban spatial structure. J. Econ. Lit. 1998, 36, 1426–1464. [Google Scholar]
- Mcmillen, D.P.; Lester, T.W. Evolving subcenters: Employment and population densities in Chicago, 1970–2020. J. Hous. Econ. 2003, 12, 60–81. [Google Scholar] [CrossRef]
- Garcia-Lopez, M.A.; Muniz, I. Employment decentralization: Polycentricity or scatteration? The case of Barcelona. Urban Stud. 2010, 47, 3035–3056. [Google Scholar] [CrossRef]
- Kloosterman, R.C.; Musterd, S. The Polycentric Urban Region: Towards a Research Agenda. Urban Stud. 2001, 38, 623–633. [Google Scholar] [CrossRef]
- Lang, R.; Knox, P.K. The New Metropolis: Rethinking Megalopolis. Reg. Stud. 2009, 43, 789–802. [Google Scholar] [CrossRef]
- Green, N. Functional Polycentricity: A Formal Definition in Terms of Social Network Analysis. Urban Stud 2007, 44, 2077–2103. [Google Scholar] [CrossRef]
- Burger, M.J. Functional Polycentrism and Urban Network Development in the Greater South East, United Kingdom: Evidence from Commuting Patterns, 1981–2001. Reg. Stud. 2010, 44, 1149–1170. [Google Scholar]
- Van Oort, F.; Burger, M.; Raspe, O. On the Economic Foundation of the Urban Network Paradigm: Spatial Integration, Functional Integration and Economic Complementarities within the Dutch Randstad. Urban Stud. 2009, 47, 725–748. [Google Scholar] [CrossRef]
- Mcmillen, D.P.; Mcdonald, J.F. Suburban subcenters and employment density in metropolitan Chicago. J. Urban Econ. 1998, 43, 157–180. [Google Scholar] [CrossRef]
- Small, K.A.; Song, S. Population and employment densities: Structure and change. J. Urban Econ. 1994, 36, 292–313. [Google Scholar] [CrossRef]
- Glaeser, E.L.; Kahn, M.E. Decentralized Employment and the Transformation of the American City; Nber Working Paper No. 8117; NBER: Cambridge, MA, USA, 2001; pp. 1–63. [Google Scholar]
- Richardson, H.W. Economies and Diseconomies of Agglomeration; Springer: Berlin/Heidelberg, Germany, 1995. [Google Scholar]
- White, M.J. Chapter 36 urban areas with decentralized employment: Theory and empirical work. Handb. Reg. Urban Econ. 1990, 3, 1375–1412. [Google Scholar]
- Gordon, P.; Richardson, H.W. Beyond Polycentricity: The Dispersed Metropolis, Los Angeles, 1970–1990. J. Am. Plan. Assoc. 1996, 62, 161–173. [Google Scholar] [CrossRef]
- Pfister, N.; Freestone, R.; Murphy, P. Polycentricity or Dispersion? Changes in Center Employment in Metropolitan Sydney, 1981 To 1996. Urban Geogr. 2000, 21, 428–442. [Google Scholar] [CrossRef]
- Agarwal, A. An examination of the determinants of employment center growth: Do local policies play a role? J. Urban Affairs 2014, 37, 192–206. [Google Scholar] [CrossRef]
- Giuliano, G.; Small, K.A. The determinants of growth of employment subcenters. J. Transp. Geogr. 1999, 7, 189–201. [Google Scholar] [CrossRef]
- Li, Y.; Monzur, T. The spatial structure of employment in the metropolitan region of Tokyo: A scale-view. Urban Geogr. 2018, 39, 236–262. [Google Scholar] [CrossRef]
- Lee, Y.S.; Shin, H.R. Negotiating the polycentric city-region: Developmental state politics of new town development in the seoul capital region. Urban Stud. 2012, 49, 855–870. [Google Scholar] [CrossRef]
- Ng, M.K. Political economy and urban planning: A comparative study of Hong Kong, Singapore and Taiwan. Prog. Plan. 1999, 51, 1–90. [Google Scholar]
- Ding, C. Urban spatial development in the land policy reform era: Evidence from Beijing. Urban Stud. 2004, 41, 1889–1907. [Google Scholar] [CrossRef]
- Zhou, Y.; Ma, L.J.C. Economic restructuring and suburbanization in China. Urban Geogr. 2000, 21, 205–236. [Google Scholar] [CrossRef]
- Wu, F.; Phelps, N.A. (post)Suburban development and state entrepreneurialism in Beijing’s outer suburbs. Environ. Plan. A 2011, 43, 410–430. [Google Scholar] [CrossRef]
- Gao, B.; Liu, W.; Dunford, M. State land policy, land markets and geographies of manufacturing: The case of Beijing, China. Land Use Policy 2014, 36, 1–12. [Google Scholar]
- Luo, Z.; Zhu, Z. Understanding Polycentricity by Configuration, Function and Governance. Urban Plan. Int. 2008, 23, 85–88. [Google Scholar]
- Cheng, H.; Shaw, D. Polycentric development practice in master planning: The case of China. Int. Plan. Stud. 2018, 23, 163–179. [Google Scholar] [CrossRef]
- Dong, G. Sixty years and twenty years—review and prospect of the modernization development process in Beijing (2). Beijing Plan. Rev. 2010, 5, 168–171. (In Chinese) [Google Scholar]
- Kuang, W.; Liu, J.; Shao, Q.; Sun, C. Spatio-temporal patterns and driving forces of urban expansion in Beijing central city since 1932. J. Geo-Inf. Sci. 2009, 11, 428–435. [Google Scholar] [CrossRef]
- Xu, C. Innovation-Driven Transformation of Development Zones in Shanghai. Urban Plan. Forum 2012, 7, 203–206. (In Chinese) [Google Scholar]
- Cheng, H.; Liu, Y.; He, S.; Shaw, D. From development zones to edge urban areas in China: A case study of Nansha, Guangzhou City. Cities 2017, 71, 110–122. [Google Scholar] [CrossRef]
- Long, Y.; Yu, Z.; Cui, C. Identifying commuting pattern of Beijing using bus smart card data. Acta Geogr. Sin. 2012, 67, 1339–1352. (In Chinese) [Google Scholar]
- He, C.F.; Liang, J.; Zhang, H. Locational study of foreign enterprises in Beijing based on an ordered probit model. Acta Geogr. Sin. 2005, 60, 122–130. (In Chinese) [Google Scholar]
- Muniz, I.; Garcia-Lopez, M.A.; Galindo, A. The effect of employment sub-centers on population density in Barcelona. Urban Stud. 2008, 45, 627–649. [Google Scholar] [CrossRef]
Figure 1.
The research area.

Figure 2.
(a) Employment subcenters in 2001. (b) Employment subcenters in 2010.


Table 1.
The number of enterprises & institutions and employment in the research area.
| Total | 2001 | 2010 |
|---|---|---|
| Enterprises & Institutions | 214,203 | 410,800 |
| Employment (million) | 8.38 | 13.51 |
Table 2.
Descriptive of the variables.
| Variables | Express | Type | Descriptive |
|---|---|---|---|
| distance to Tiananmen | DTAM | successive | distance between the location of the Street Committee and Tiananmen |
| inverse distance to the nearest subcenter | Dsub | successive | using the geometric center of employment units and location of the Street Committee of population units to measure the distance |
| distance to subway stations between 0–1 km | dsubway1km | dummy | Subway stations operating in period t |
| distance to subway stations between 1–3 km | dsubway3km | dummy | Subway stations operating in period t |
| distance to highway interchanges between 0–1 km | dhighway1km | dummy | Highway includes ring roads and radial roads |
| distance to highway interchanges between 1–3 km | dhighway3km | dummy | Highway includes ring roads and radial roads |
Table 3.
Employment subcenters and their growth from 2001–2010.
| Name | Identified Subcenters | If Planned | Employment Amount (Ten Thousands) | Employment Share (%) | |||||
|---|---|---|---|---|---|---|---|---|---|
| 2001 | 2010 | 2001 | 2010 | Change (%) | 2001 | 2010 | Change | ||
| Daxing | √ | √ | New town | 6.43 | 11.98 | 86.3 | 0.78 | 0.89 | 0.11 |
| Mengtougou | √ | √ | New town | 12.02 | 8.67 | −27.9 | 1.46 | 0.64 | −0.82 |
| Tongzhou | √ | √ | New town | 6.18 | 13.35 | 116.0 | 0.75 | 0.99 | 0.24 |
| Changping | √ | √ | New town | 4.92 | 13.37 | 171.7 | 0.60 | 0.99 | 0.39 |
| Shunyi | × | √ | New town | 4.12 | 11.92 | 127.0 | 0.49 | 0.88 | 0.39 |
| Fangshan | × | √ | New town | 3.00 | 8.65 | 188.3 | 0.36 | 0.64 | 0.28 |
| Olympic park | √ | √ | Development zone | 6.43 | 17.90 | 178.4 | 0.78 | 1.33 | 0.54 |
| Shijingshan | √ | √ | Development zone | 15.30 | 14.35 | −6.2 | 1.86 | 1.06 | −0.80 |
| Shangdi | √ | √ | Development zone | 9.91 | 34.03 | 243.4 | 1.20 | 2.52 | 1.32 |
| Jiuxianqiao | √ | √ | Development zone | 11.50 | 40.45 | 251.7 | 1.40 | 3.00 | 1.60 |
| Fengtai | √ | √ | Unplanned | 14.47 | 14.68 | 1.5 | 1.76 | 1.09 | −0.67 |
| Balizhuang | × | √ | Unplanned | 3.25 | 8.23 | 153.2 | 0.52 | 0.61 | 0.22 |
| Yongding | × | √ | Unplanned | 3.98 | 8.83 | 121.9 | 0.48 | 0.65 | 0.17 |
| Yizhuang | × | × | New town | 3.52 | 6.23 | 77.0 | 0.43 | 0.46 | 0.03 |
| Tianzhu | × | × | Development zone | 2.85 | 4.33 | 51.9 | 0.35 | 0.32 | −0.03 |
Table 4.
Employment subcenters’ changes in employment share (%).
| Subcenters 2001 | Subcenters2010 | Change 2001–2010 | ||||||
|---|---|---|---|---|---|---|---|---|
| 2001 | 2010 | Change | 2001 | 2010 | Change | |||
| The city center | 57.0 | 58.3 | 1.30 | 57.0 | 58.3 | 1.30 | 1.30 | |
| Subcenters | New towns | 3.59 | 4.39 | 0.80 | 4.59 | 5.03 | 0.44 | 1.44 |
| Development zones | 5.24 | 7.91 | 2.67 | 5.24 | 7.91 | 2.67 | 2.67 | |
| Unplanned | 1.76 | 1.09 | −0.67 | 2.76 | 2.35 | −0.41 | 0.59 | |
| Sum | 10.59 | 13.39 | 2.80 | 12.59 | 15.29 | 2.70 | 4.70 | |
| Rest area | 32.41 | 28.31 | −4.10 | 30.41 | 26.41 | −4.00 | −6.00 | |
Table 5.
The result of employment distribution.
| All Samples | Planned Subcenters | Unplanned Subcenters | ||||
|---|---|---|---|---|---|---|
| 2001 (1) | 2010 (2) | 2001 (3) | 2010 (4) | 2001 (5) | 2010 (6) | |
| Constant | 6.755 *** | 7.728 *** | 5.502 *** | 6.621 *** | 8.482 *** | 9.905 *** |
| (34.53) | (35.00) | (21.44) | (25.72) | (28.52) | (24.39) | |
| dTAM | −0.073 *** | −0.094 *** | −0.041 *** | −0.076 *** | −0.117 *** | −0.205 *** |
| (−12.47) | (−15.01) | (−5.31) | (−9.95) | (−12.67) | (−12.68) | |
| dsub−1 | 2.067 *** | 3.595 *** | 3.864 *** | 4.497 *** | 0.560 | 2.015 *** |
| (5.49) | (9.86) | (7.61) | (9.79) | (1.06) | (3.70) | |
| dsubway1km | 1.760 *** | 1.842 *** | 1.426 *** | 1.797 *** | 1.447 *** | 1.351 *** |
| (9.82) | (9.36) | (3.42) | (9.36) | (5.71) | (5.75) | |
| dsubway3km | 0.933 *** | 0.871 *** | 1.034 *** | 1.066 *** | 1.093 *** | 0.444 ** |
| (6.28) | (5.39) | (3.70) | (3.75) | (5.27) | (2.24) | |
| dhighway1km | 0.689 *** | 0.545 *** | 0.754 *** | 0.581 *** | 0.311 | −0.178 |
| (3.47) | (4.45) | (5.15) | (4.04) | (1.72) | (−0.78) | |
| dhighway3km | 0.278 *** | 0.103 | 0.357 *** | 0.170 | −0.114 | −0.396 |
| (2.62) | (0.92) | (2.70) | (1.29) | (−0.66) | (−0.88) | |
| Adjusted R2 | 0.415 | 0.429 | 0.332 | 0.364 | 0.487 | 0.596 |
| F test | 97.88 | 113.45 | 85.12 | 110.32 | 88.69 | 108.32 |
Note: *** and ** denote a 1% and 5% significance level, respectively; and t values are in parentheses.
Table 6.
The result of population distribution.
| All Samples | Planned Subcenters | Unplanned Subcenters | ||||
|---|---|---|---|---|---|---|
| 2001 (1) | 2010 (2) | 2001 (3) | 2010 (4) | 2001 (5) | 2010 (6) | |
| Constant | 8.603 *** | 9.168 *** | 8.492 *** | 9.168 *** | 11.166 *** | 10.118 *** |
| (19.61) | (22.53) | (17.90) | (16.57) | (11.48) | (16.57) | |
| dTAM | −0.064 *** | −0.081 ** | −0.050 *** | −0.076 *** | −0.094 *** | −0.134 *** |
| (−8.36) | (−7.30) | (−6.96) | (−3.96) | (−3.27) | (−4.97) | |
| dsub−1 | 0.233 | 1.326 *** | 0.207 | 1.581 *** | 0.731 | 1.138 ** |
| (0.31) | (3.86) | (0.21) | (4.38) | (0.98) | (2.24) | |
| dsubway1km | 0.860 *** | 0.789 *** | 0.771 ** | 0.941 *** | 0.498 | 0.636 *** |
| (3.65) | (4.07) | (2.62) | (3.04) | (1.29) | (3.44) | |
| dsubway3km | 0.958 *** | 0.727 *** | 1.044 *** | 0.562 ** | 0.161 | 0.886 ** |
| (4.80) | (3.99) | (4.41) | (2.14) | (0.48) | (4.69) | |
| dhighway1km | 0.686 ** | 0.770 *** | 0.777 ** | 0.804 *** | 0.007 | 0.124 |
| (2.45) | (2.97) | (2.31) | (2.64) | (0.31) | (0.54) | |
| dhighway3km | 0.540 | 0.693 *** | 0.579 | 0.693 ** | 0.071 | 0.485 |
| (1.75) | (2.75) | (1.78) | (2.60) | (0.78) | (0.60) | |
| Adjusted R2 | 0.652 | 0.717 | 0.614 | 0.660 | 0.609 | 0.672 |
| F test | 59.97 | 80.76 | 43.20 | 40.20 | 10.04 | 22.10 |
Note: *** and ** denote a 1% and 5% significance level, respectively, and t values are in parentheses.
© 2018 by the authors. Licensee MDPI, Basel, Switzerland. This article is an open access article distributed under the terms and conditions of the Creative Commons Attribution (CC BY) license (http://creativecommons.org/licenses/by/4.0/).
Share and Cite
MDPI and ACS Style
Liu, Z.; Liu, S. Polycentric Development and the Role of Urban Polycentric Planning in China’s Mega Cities: An Examination of Beijing’s Metropolitan Area. Sustainability 2018, 10, 1588. https://0-doi-org.brum.beds.ac.uk/10.3390/su10051588
AMA Style
Liu Z, Liu S. Polycentric Development and the Role of Urban Polycentric Planning in China’s Mega Cities: An Examination of Beijing’s Metropolitan Area. Sustainability. 2018; 10(5):1588. https://0-doi-org.brum.beds.ac.uk/10.3390/su10051588
Chicago/Turabian StyleLiu, Zhen, and Shenghe Liu. 2018. "Polycentric Development and the Role of Urban Polycentric Planning in China’s Mega Cities: An Examination of Beijing’s Metropolitan Area" Sustainability 10, no. 5: 1588. https://0-doi-org.brum.beds.ac.uk/10.3390/su10051588
Note that from the first issue of 2016, this journal uses article numbers instead of page numbers. See further details here.