Greenhouse Gas Emissions Embodied in the Chinese International Trade of Computer Products

1
School of Environmental Science and Engineering, Tianjin University, Tianjin 300350, China
2
School of Architecture & Built Environment; Entrepreneurship, Commercialisation and Innovation Centre (ECIC), The University of Adelaide, Adelaide 5005, Australia
*
Author to whom correspondence should be addressed.
Sustainability 2018, 10(5), 1623; https://0-doi-org.brum.beds.ac.uk/10.3390/su10051623
Submission received: 2 April 2018
/
Revised: 8 May 2018
/
Accepted: 10 May 2018
/
Published: 18 May 2018
(This article belongs to the Special Issue Energy Security and Sustainability)
Abstract
:Previous studies investigated greenhouse gas (GHG) emissions embodied in the trade of large groups of products by using the input–output model. However, very little attention was paid from the product’s perspective via the bottom-up process-based life cycle assessment (LCA) model. In this paper via the process-based LCA approach, GHG emissions embodied in the computer trade between China and its major trade partners were examined over the period 2002 to 2013. Results revealed that China has been the largest net exporter of GHG emissions related to computers over the last decade, where portable computer products made up the main share. In 2002, the largest trade flow of GHG emissions embodied in computers was from Taiwan to the USA, while in 2013 it was from China to the USA. Moreover, technological innovation and geographical variability were taken into consideration as emission factors of computers, as well as the uncertainty analysis. This study found that the main driver of computer-related emissions embodied in international trade is industry transfer. The actual production of computers has shifted steadily away from the USA, firstly to Taiwan and ASEAN, but now almost entirely to China. Results of this study suggest that reduction of carbon emission is destined to be a global responsibility.
1. Introduction
Growing international trade has not only promoted economic development, but also contributed to large amounts of greenhouse gas (GHG) emissions. The total CO2 emissions embodied in global international trade increased from 4.3 Gt CO2 in 1990 to 7.8 Gt in 2008 [1]. The geographical separation of production and consumption complicates the fundamental questions of who is responsible for emissions and how the burden of mitigation ought to be shared. National GHG emissions inventories account for only those emissions produced within sovereign territories, overlooking the benefit conveyed to consumers through international trade [2]. In recognition of this shortcoming, many researchers are concerned with where GHG emissions are embodied in products and where the products are ultimately used [3]. Previous researches on embodied CO2 emissions in trade have shown that China is by far the largest net exporter of emissions [4,5]. As the world’s largest CO2 emitter, China is under enormous pressure to reduce CO2 emissions [6]. Associated with international trade is the export of emissions from the manufacturing countries such as China to consumer countries such as the United States and Europe [2,7,8]. In China, the largest increases in exported emissions were from the electronics sectors between 2002 and 2007 (157.17 Mt), which accounted for 24.53% of the total exported emissions [9]. By contrast, growing imports of electric and electronic goods as well as components contributed to the growth in imported emissions in the US during the same period of time [10]. Indeed, energy embodied in “electric and electronic equipment” and “other equipment” is responsible for the growing total embodied energy in China–U.S. Trade [8]. These researches have shown that the international electronic goods trade plays a crucial role in the embodied GHG. However, there has been a lack of systematic study with the focus on the GHG emissions embodied in the electronic goods trade.
According to the Input and Output Table for 135 sectors in China, it is worth noting that electronics exports related to computers are the largest among all manufacturing sectors in China, which is almost double the second sector (see Table 1 [11]). Moreover, from 2002 to 2013, computer products always ranked first in all net exported goods from China, which increased eight times over this period of time [10].
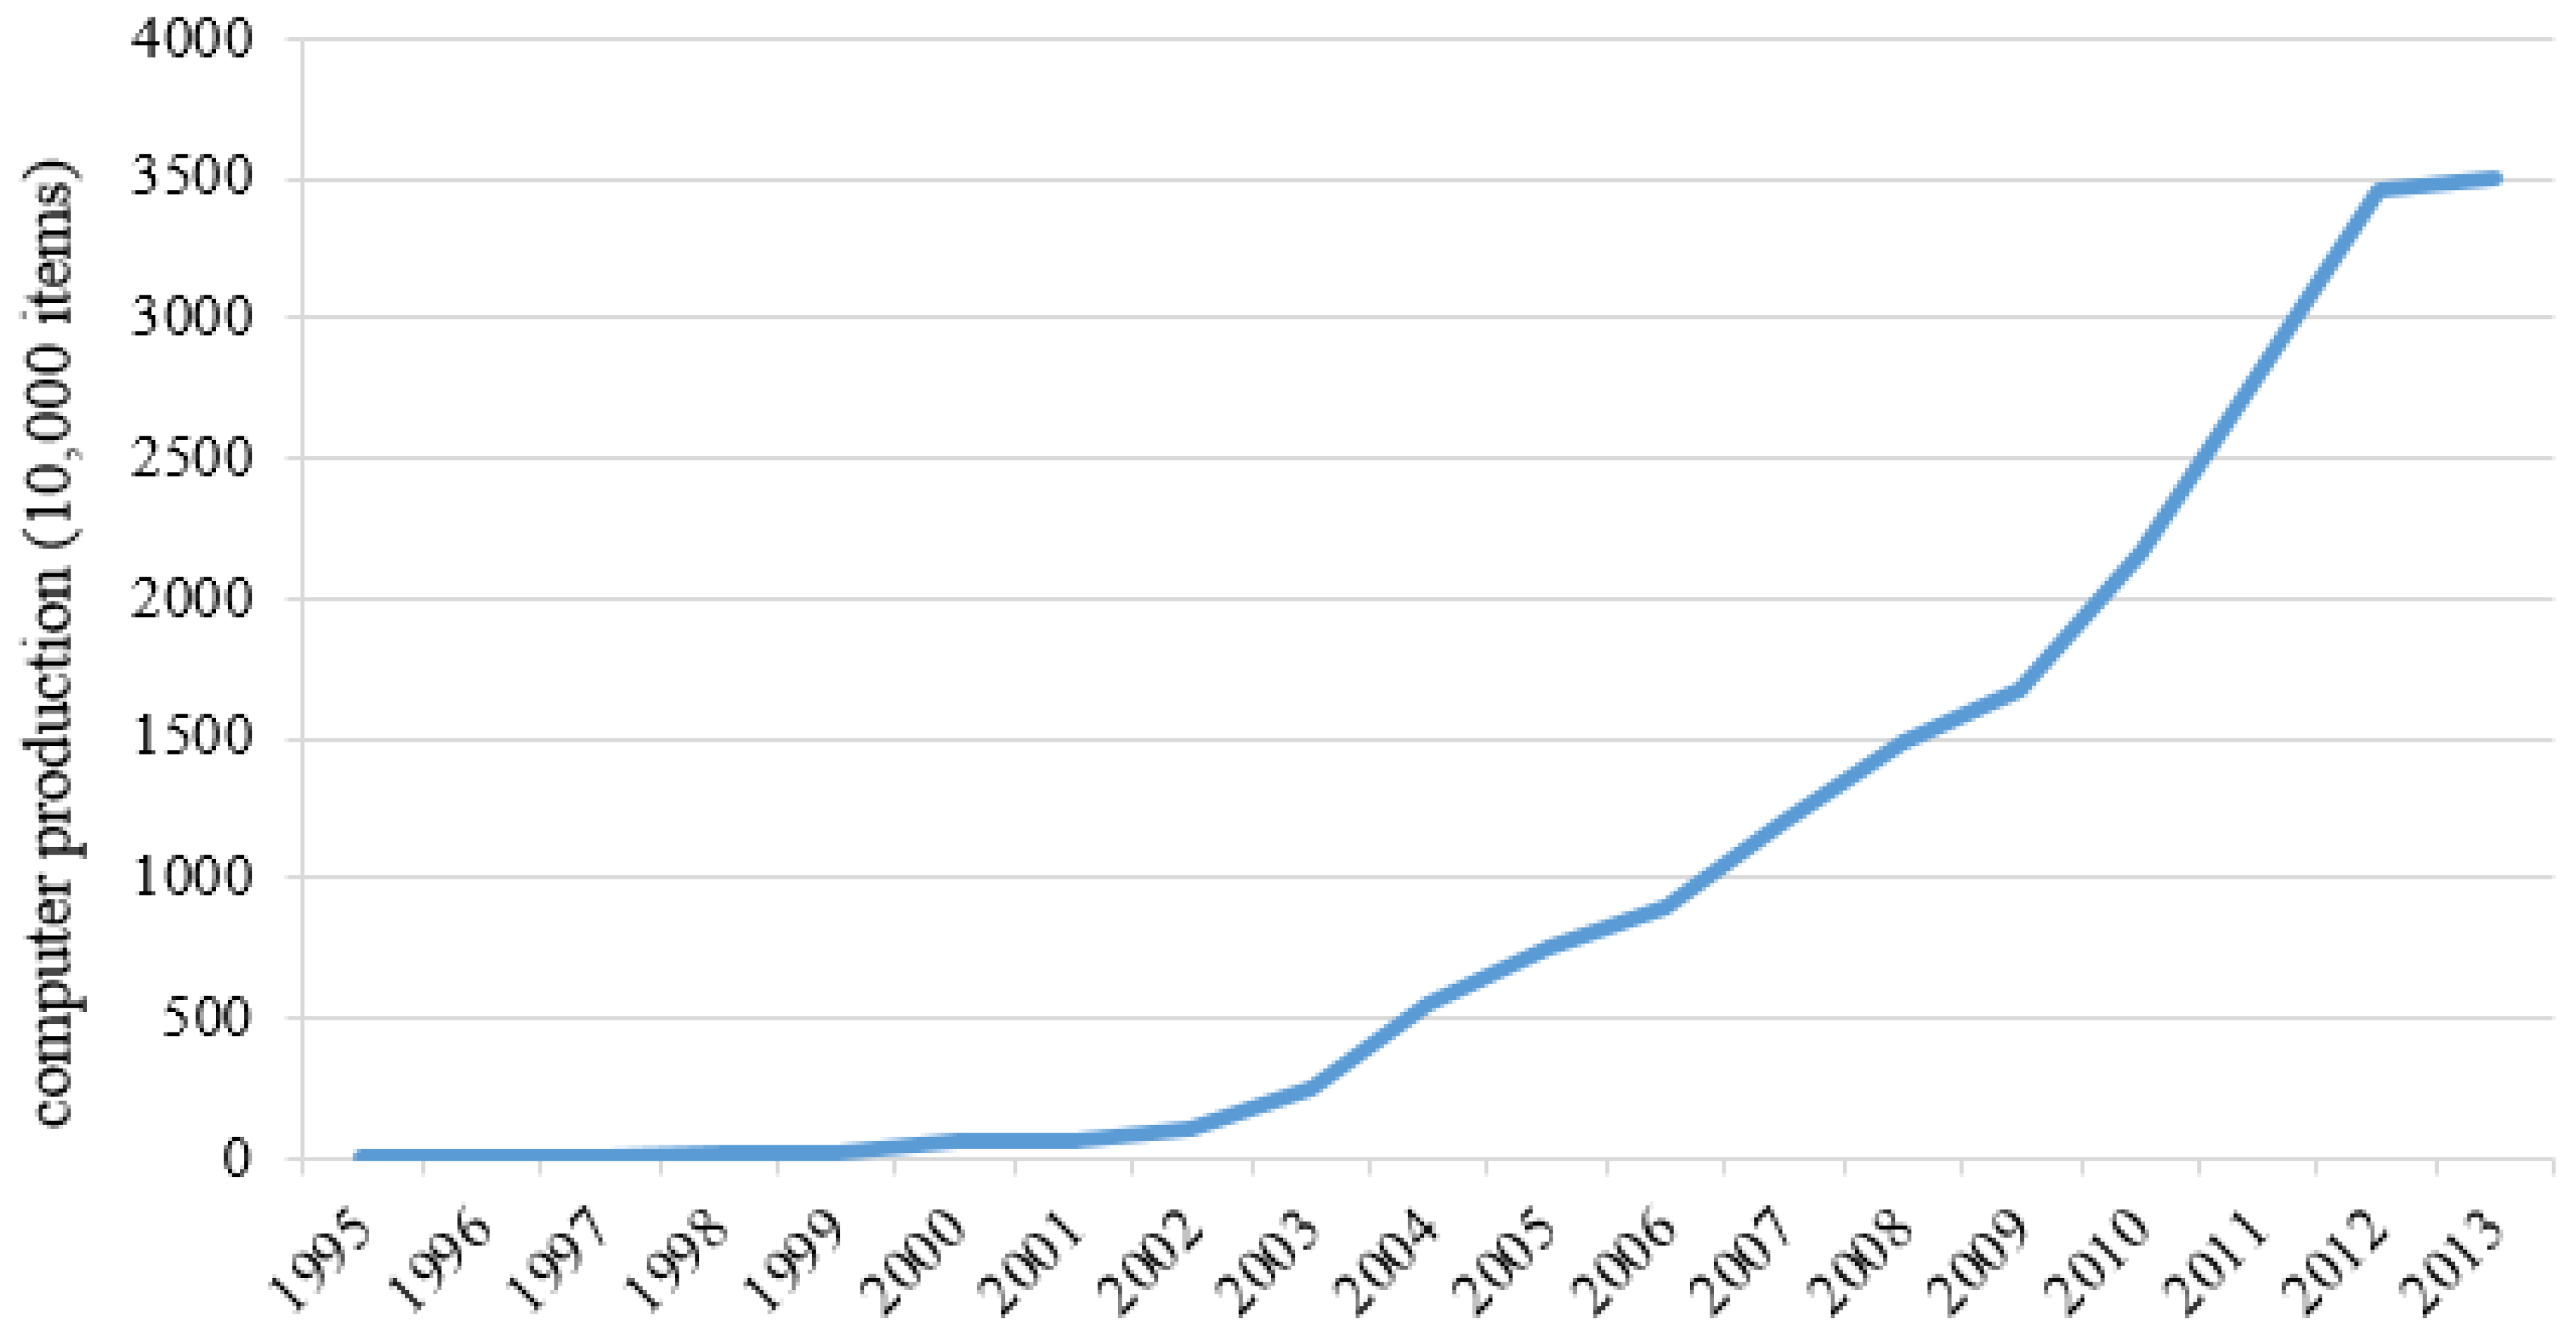
China is the largest country in terms of computer production. Statistics show that computer production in China accounted for more than 80% of world production [12]. As shown in Figure 1, computer production in China has experienced rapid growth since 2002 [13]. Exports accounted for 57% of the total computer production in 2011 in which portable computers and desktops accounted for 71% and 16% respectively [14]. This means most portable computers were exported.
From the global perspective, there are substantial worldwide greenhouse gas (GHG) emissions derived from the information and communications technology (ICT) sector that continue to grow [15]. Therefore, it is imperative to investigate the contribution of the international computer trade to the embodied GHG emissions.
The top-down economic input–output model has been utilized in most recent studies to examine GHG emissions embodied in trade. Economic input–output models characterize the economic relations between industry sectors in mathematical form. Economic input–output models summarize which goods or services (or output) of an industry are consumed by other industries (or used as input) [16,17]. There are a number of advantages associated with the economic input–output model for the assessment of embodied emissions, such as being more time-efficient and having less cutoff error than process-based life cycle assessment [10]. However, the economic input–output model has its drawbacks as well. For example, the Input Output (IO) model experiences difficulties to differentiate between similar products if there is lack of robust economic data, and it has to be adapted to analyze large groups of products. Therefore, detailed process models are required in order to examine a specific kind of product such as a computer.
There is lack of studies on the GHG emissions embodied in trade from the product’s perspective. From the product’s perspective, the most common life cycle assessment (LCA) approach is a process-based LCA method. In a process-based LCA, the production system is regarded as a series of activities that transforms the input (materials and energy resources) into outputs (emissions and wastes to the environment) for a given production process [18,19]. An extensive review has been conducted with literature related to GHG emissions embodied in trade [4,5,6,7,8,9,10,20,21]. Results showed that most of the existing articles used the top-down IO based LCA method. By contrast, very few studies employed the bottom-up process-based LCA method to examine GHG emissions embodied in trade. Nevertheless, as there is a large body of literature related to computer products by employing the process-based LCA method, it is practicable to employ the process-based LCA method to assess GHG emissions embodied in the computer trade. For example, Williams (2004) estimated the energy embodied in a desktop computer by hybrid assessment combining process-based and economic input–output methods [22]. His results indicated that the total energy and fossil fuels used in producing a desktop computer with 17-in. CRT monitor was 6400 megajoules (MJ) and 260 kg respectively. In contrast with home appliances, the life cycle energy use of a computer is dominated by production (81%) as opposed to operation (19%) [22]. Deng, et al. used a similar method to calculate CO2 emissions embodied in a laptop computer., Their study showed that GHG emissions from manufacturing to be between 227 and 270 kg CO2-eq, of which 93−136 kg CO2-eq were accounted for via the bottom-up process LCA [23]. Duan, et al. applied the LCA constructed by SimaPro software version 7.0 and expressed with the Eco-indicator’99 life cycle impact assessment method to investigate the environmental performance of a Chinese desktop personal computer [24]. Weber analyzed quantitative uncertainty assessment in carbon footprinting through a case study of a rack mount electronic server [25]. Teehan and Kandlikar quantified the embodied greenhouse gas (GHG) emissions of 11 computer products based on primary data retrieved from hand disassembly and the ecoinvent v.2.2 database [20].
In this paper, we extend previous research efforts on embodied GHG emissions in trade by: (1) studying embodied GHG emissions in trade from the product’s perspective via the process-based LCA method; (2) estimating the GHG emissions embodied in computer trade between China and its major seven trade partners (i.e., USA, EU, Japan, Australia, Rep. of Korea, Taiwan, and ASEAN) during the period 2002 to 2013; (3) highlighting the greatest flows of GHG emissions related to the computer trade and the driving mechanism.
2. Method and Data
Emissions due to exports and imports are calculated by Equation (1):
where: Emissions are GHG emissions embodied in imports (EEI) and exports (EEE); A is mass data for computer exports or imports (net weight, kg), and EF is GHG emissions per kg of computer products (i.e., GHG emissions intensity) based on the process-based LCA method. The scope of this study is limited to the production phase of the whole life cycle (i.e., excluding the use phase).
Emissions = A × EF
2.1. Data for Computer Exports and Imports
With the rapid development of the Internet, portability has become a core competitiveness of computer products. GHG emissions embodied in newer products are halved compared to corresponding older products as fewer materials are used for manufacturing [20]. GHG emission per computer has declined. However, the overall GHG emissions have been increasing because the GHG emissions growth due to the increasing quantity of computers outpaced the reduction of GHG emissions for each computer. Therefore, mass data (net weight, kg) of the computer trade were used for export or import activity in Equation (1).
Mass data of imported and exported computers for each country between 2002 and 2013 are retrieved from trade data compiled by the United Nations Commodity Trade Statistics Database. In this database, the Harmonized Commodity Description and Coding Systems (HS) codes 8471 (automatic data processing machines, ADP, i.e., computers) include three kinds of ADP machines (Table 2). In order to correspond to the GHG emissions factor reported in this study, three kinds of ADP machines were classified into two categories, i.e., portable computer products (HS code 847130); and other computer products (HS code 847141 and 847149) (see Table 2). The other categories (HS code 847150–847180) in 8471 are units of ADP that are not the main focus of this study.
2.2. GHG Emissions Data per kg of Computers
The process-LCA methods have been utilized in a number of studies related to ICT equipment [20,22,23]. The vast majority of these studies placed focuses on one type of computer product except Teehan and Kandlikar [20]. Teehan and Kandlikar [20] estimated the GHG emissions embodied in a variety of ICT products, ranging from personal computers to network devices. Similarly, they compared modern products within the ICT sector to those in the ecoinvent database which were investigated more than a decade ago. According to the HS code classification shown in Table 2, there are many kinds of products under every subheading of the HS code. For instance, 847130 (Portable digital ADP) includes notebook computers and tablets with different weight and brands. It is impractical to calculate GHG emissions embodied in every type of computer product based on the detailed process-based LCA model. Therefore, in this paper, results from Teehan and Kandlikar’s study were used to estimate the emissions embodied in per kg of computer products rather than per item of computer products [20].
The object of this study is the GHG emission embodied in computer trade flows rather than one commodity. Teehan and Kandlikar identified a quantitative relationship between mass and embodied emissions based on primary data retrieved from hand disassembly and the ecoinvent v.2.2 database [20]. Their study revealed a linear relationship between mass and embodied GHG emissions; an average 37 kg CO2-eq of GHG emissions are embodied in per kg of computer products, with a minimum value of about 15 kg CO2-eq/kg and a maximum value of about 76 kg CO2-eq/kg. Circuit boards including integrated circuits (ICs) contribute to the majority of the embodied GHG emissions in most electrical and electronic devices [20]. It is worth noting that environmental impacts are still associated with integrated circuits even though they have a very small mass [20]. Moreover, the motherboard (mainly the circuit board) accounts for a large proportion of the environmental impact associated with a desktop PC, which accounts for more than half of the total impact of the complete desktop PC [26].
These results suggested that computer products are carbon intensive even if only the production phase of the whole life cycle is taken into consideration (i.e., excluding the use phase). This is comparable to traditional energy intensive products, such as iron and steel production. The carbon intensity of iron and steel production varies significantly according to the production routes, ranging from as low as 0.4 kg CO2/kg for crude steel to as high as 2.5 kg CO2/kg for crude steel. From the perception of computer trade and driving mechanism, a process-based life cycle analysis was conducted in this study. Nevertheless, the coefficients were collected from the public website during the calculation process [27]. These results show that GHG emissions intensity embodied in computer industries is larger than that embodied in traditional energy intensive industries.
Temporal uncertainty and technological specificity are likely to be of particular importance to the electronics industry, as the technology changes much more quickly than in other industries. Technological innovation is likely to be of particular important to the electronics industry [25].
Embodied GHG emission of each laptop is lower than that of each desktop due to the relatively light weight [20,23]. However, the GHG emissions intensity (kg CO2-eq/kg) of portable computer products is higher than that of other computer products (e.g., desktop, server, and so on) (see Table 3). However, no matter portable computer or other computer, their GHG emissions data per kg of computer declined due to the technological innovation witnessed by the last decades. According to Teehan and Kandlikar’s study [20] (see Table 3), the GHG Emissions intensity of portable computer products (2002) was 76 (kg CO2-eq/kg, while GHG Emissions intensity of those products produced in 2009 or 2010 was 33–47 kg CO2-eq/kg. As for other computers, the average GHG Emissions intensity was about 39 kg CO2-eq/kg, which was reduced to about 25 kg CO2-eq/kg over the same period of time [20].
Based on the average value of GHG emissions intensity in Table 3, the GHG emissions intensity from 2002 to 2013 was estimated by means of linear interpolation (please see the Appendixes Table A1).
GHG emissions intensity is also influenced by geographically explicit electricity mixes. An assumption is made that electricity mixes vary geographically as there is lack of information on the geographical variation of productions [25]. The CO2 emissions per kWh of electricity generation in different counties were used to adjust the GHG emissions intensity in each country. This adjustment could reflect the impacts of geographical variability on the GHG emissions intensity (please see the Appendixes Table A2).
where: EFi is GHG emissions per kg of computer products in the ith country; EFaverage is the average value of GHG emissions per kg of computer products in the Appendixes Table A1; EEFi is the CO2 emissions per kWh of electricity generation in the ith country [27]; EEFaverage is the average value of the CO2 emissions per kWh of electricity generation for all countries studied in this paper. The adjustment results are shown in the Appendixes Table A3.
where: BEETi are the balance of embodied GHG emissions in trade, represents exports (in kg of computers exported) from country i, and import represents imports (in kg of computers imported) to country i from country k. As it is necessary to consider the country of origin of imported/exported computers and the GHG emissions related to their production, specific emission intensity should be assigned to give exported and imported computers. This can be achieved by means of applying the emission intensity vector (EF) associated with computer production in each region (kg CO2-eq/kg of computers) (see the Appendixes Table A3).
EFi = EFaverage × EEFi/EEFaverage
3. Results
3.1. Trends of Global GHG Emissions Embodied in Traded Computers
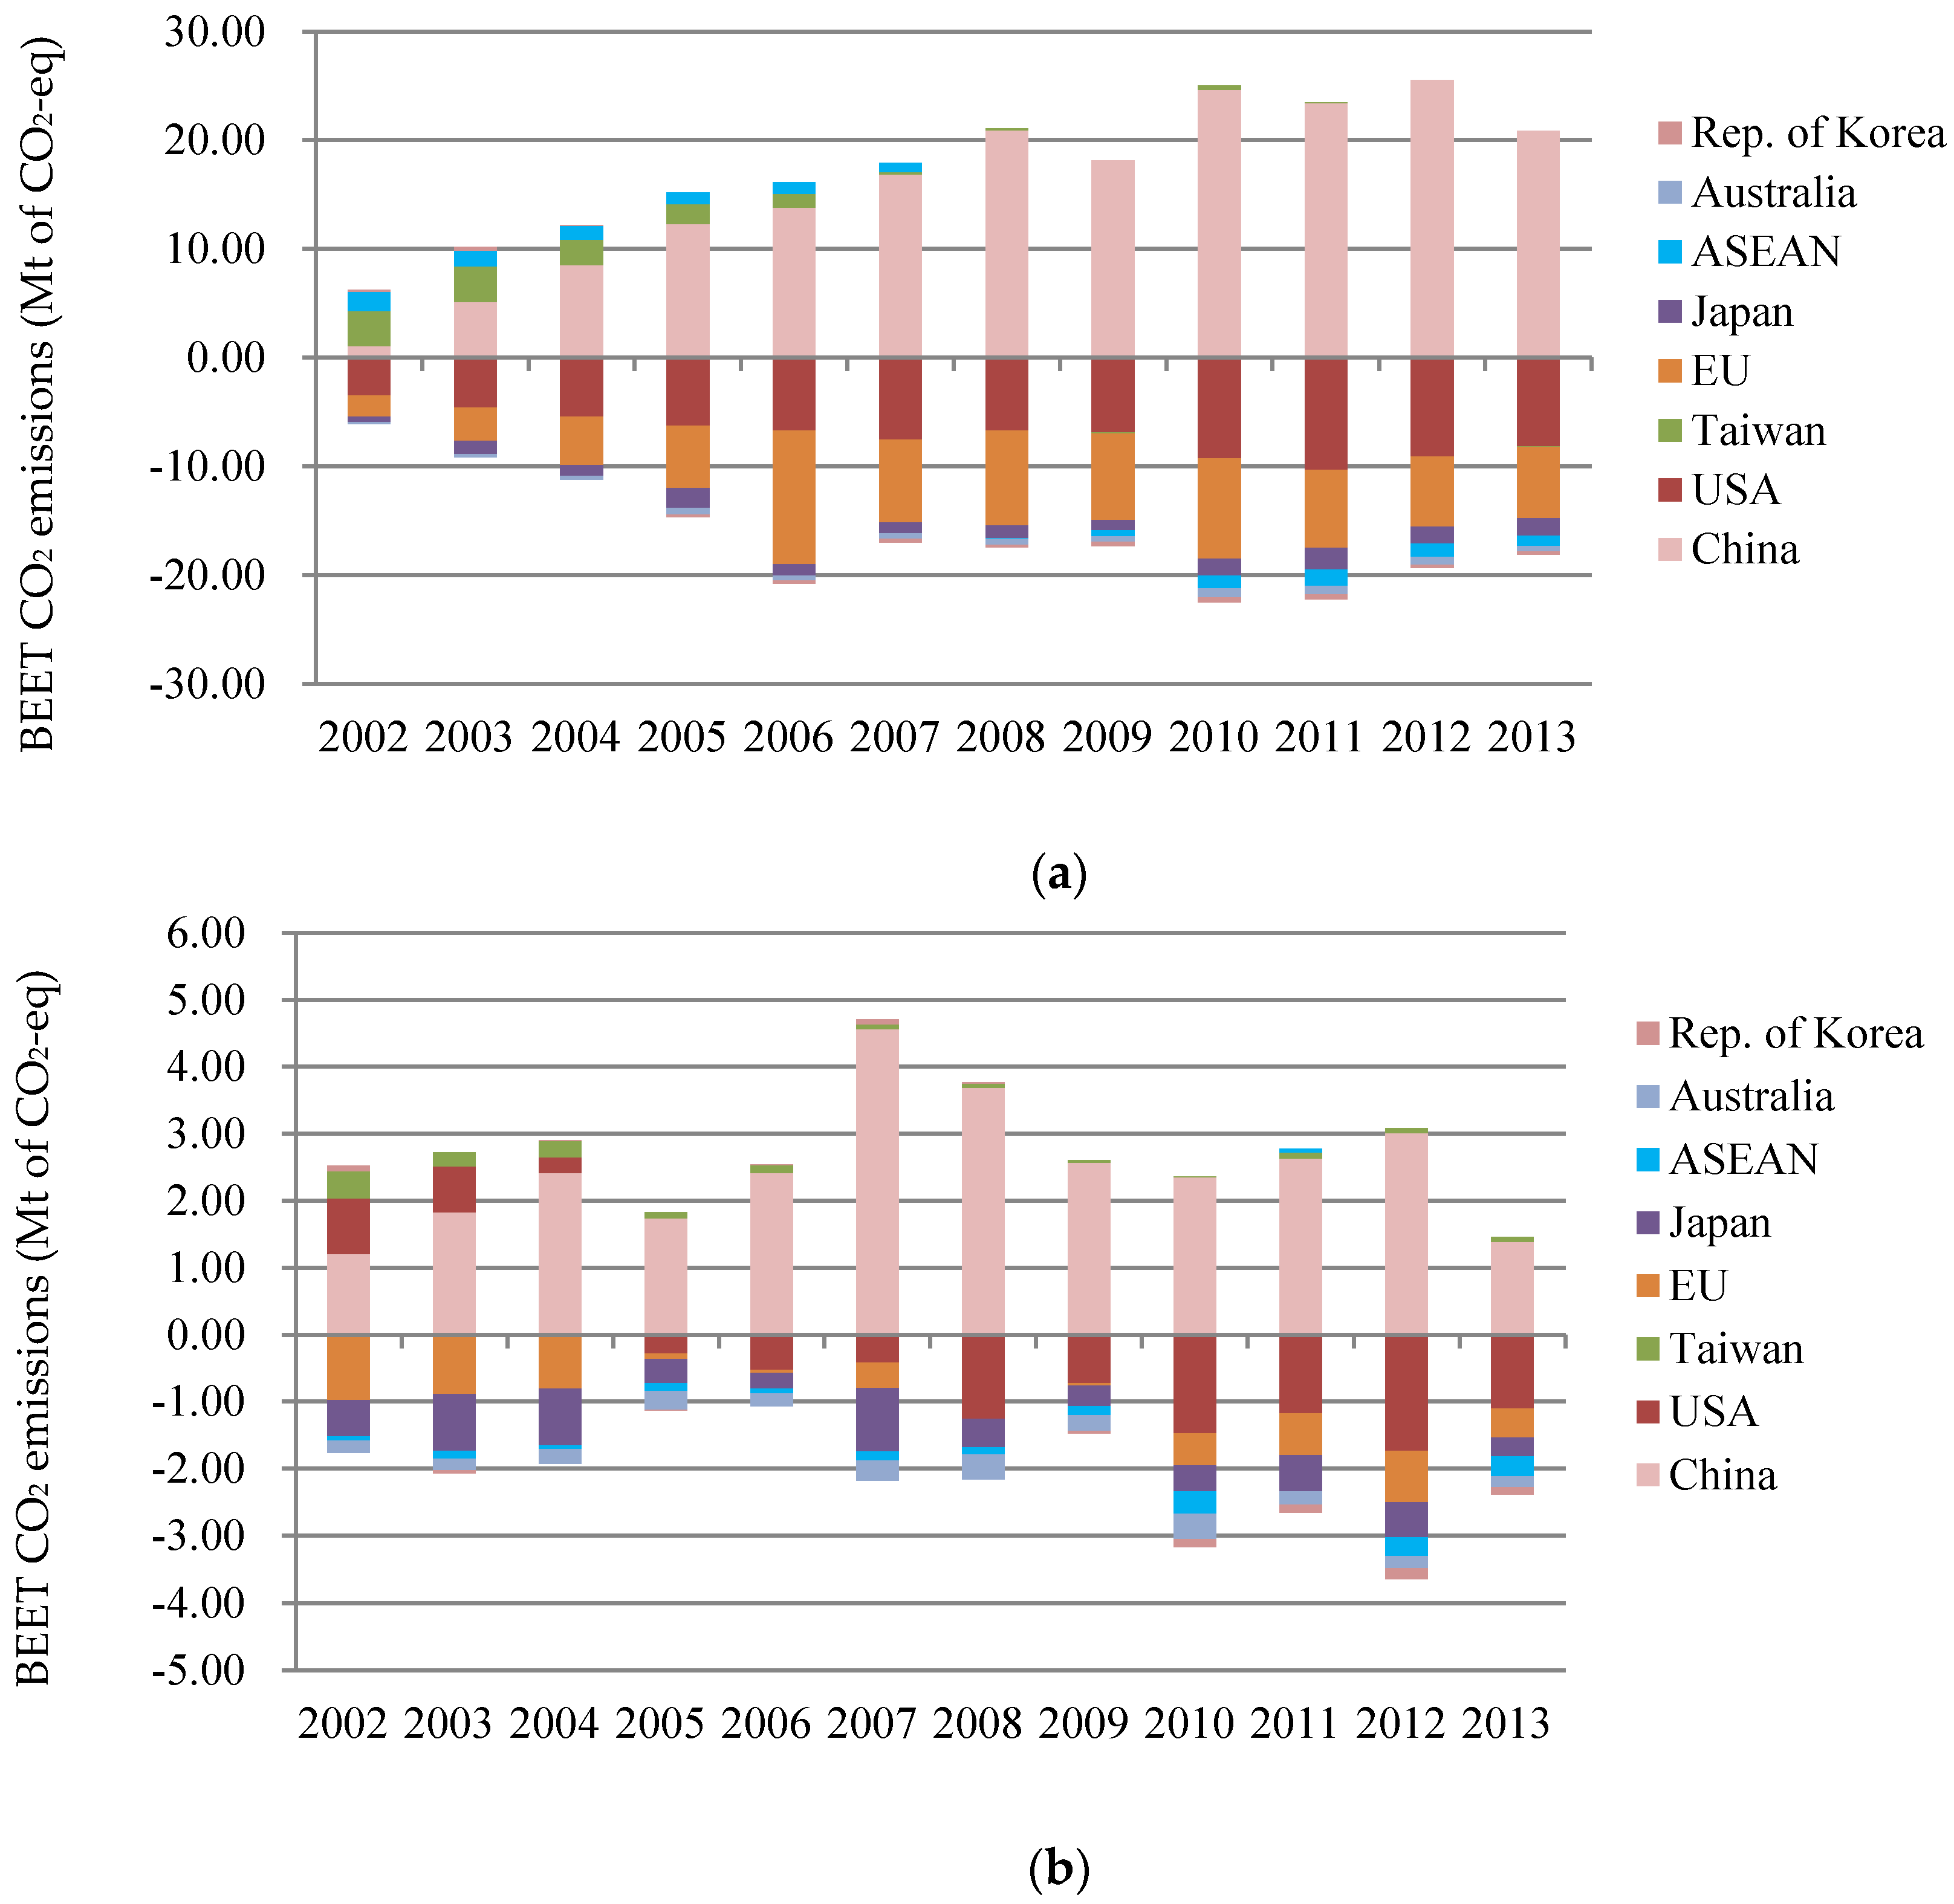
When the emissions related export activities exceed the emissions related import activities, the country is a net exporter (positive value in Figure 2). Otherwise the country is a net importer (negative value in Figure 2).
Figure 2 shows trends of computer-related CO2 emissions embodied in the international trade of China and its major trade partners (i.e., USA, EU, Japan, Australia, Rep. of Korea, Taiwan, and ASEAN). USA, EU, Japan, ASEAN, and Australia are the top five regions importing computers from China. ASEAN, Taiwan, Rep. of Korea, USA, and Japan are the top five regions exporting computers to China.
As shown in Figure 2a,b, the emissions embodied in traded portable computer products (the largest value is close to 25 Mt CO2-eq) were significantly greater than those embodied in traded other computers (the largest value is not more than 5 Mt CO2-eq).
Figure 2a shows that emissions embodied in Chinese portable computer products exports increased significantly between 2002 and 2010 (2116%). Taiwan was the largest net exporter before 2003. Since then, China became the largest net exporter of emissions embodied in portable computer products from 2003 to 2013. Although Taiwan remained a net exporter, its emissions embodied in portable computer products exports substantially declined from 2002 to 2008 while the exports almost equaled imports after 2008. USA and EU were two of the largest net importers of portable computer products related emissions. The GHG emissions embodied in imports increased 121% and 217% in the USA and EU, respectively. ASEAN was a net exporter of emissions over the period 2002–2008, whereas it became the net importer for the remaining period (2009–2013).
For emissions embodied in traded other computers (Figure 2b), USA was a net exporter of emissions over the period 2002–2004, whereas the net export GHG emissions continued to decrease in the USA. By contrast, the net export of GHG emissions increased in China. China replaced USA as the largest net exporter of emissions embodied in other computer products after 2002. However, GHG emissions fluctuated in China since 2004. By contrast, USA became the largest net importer for the remaining period (2005–2013). EU was always the net importer between 2002 and 2013, followed by Japan, ASEAN and Australia. Rep. of Korea was a small net exporter between 2002 and 2008, however it became a net importer for the remaining period (2009–2013).
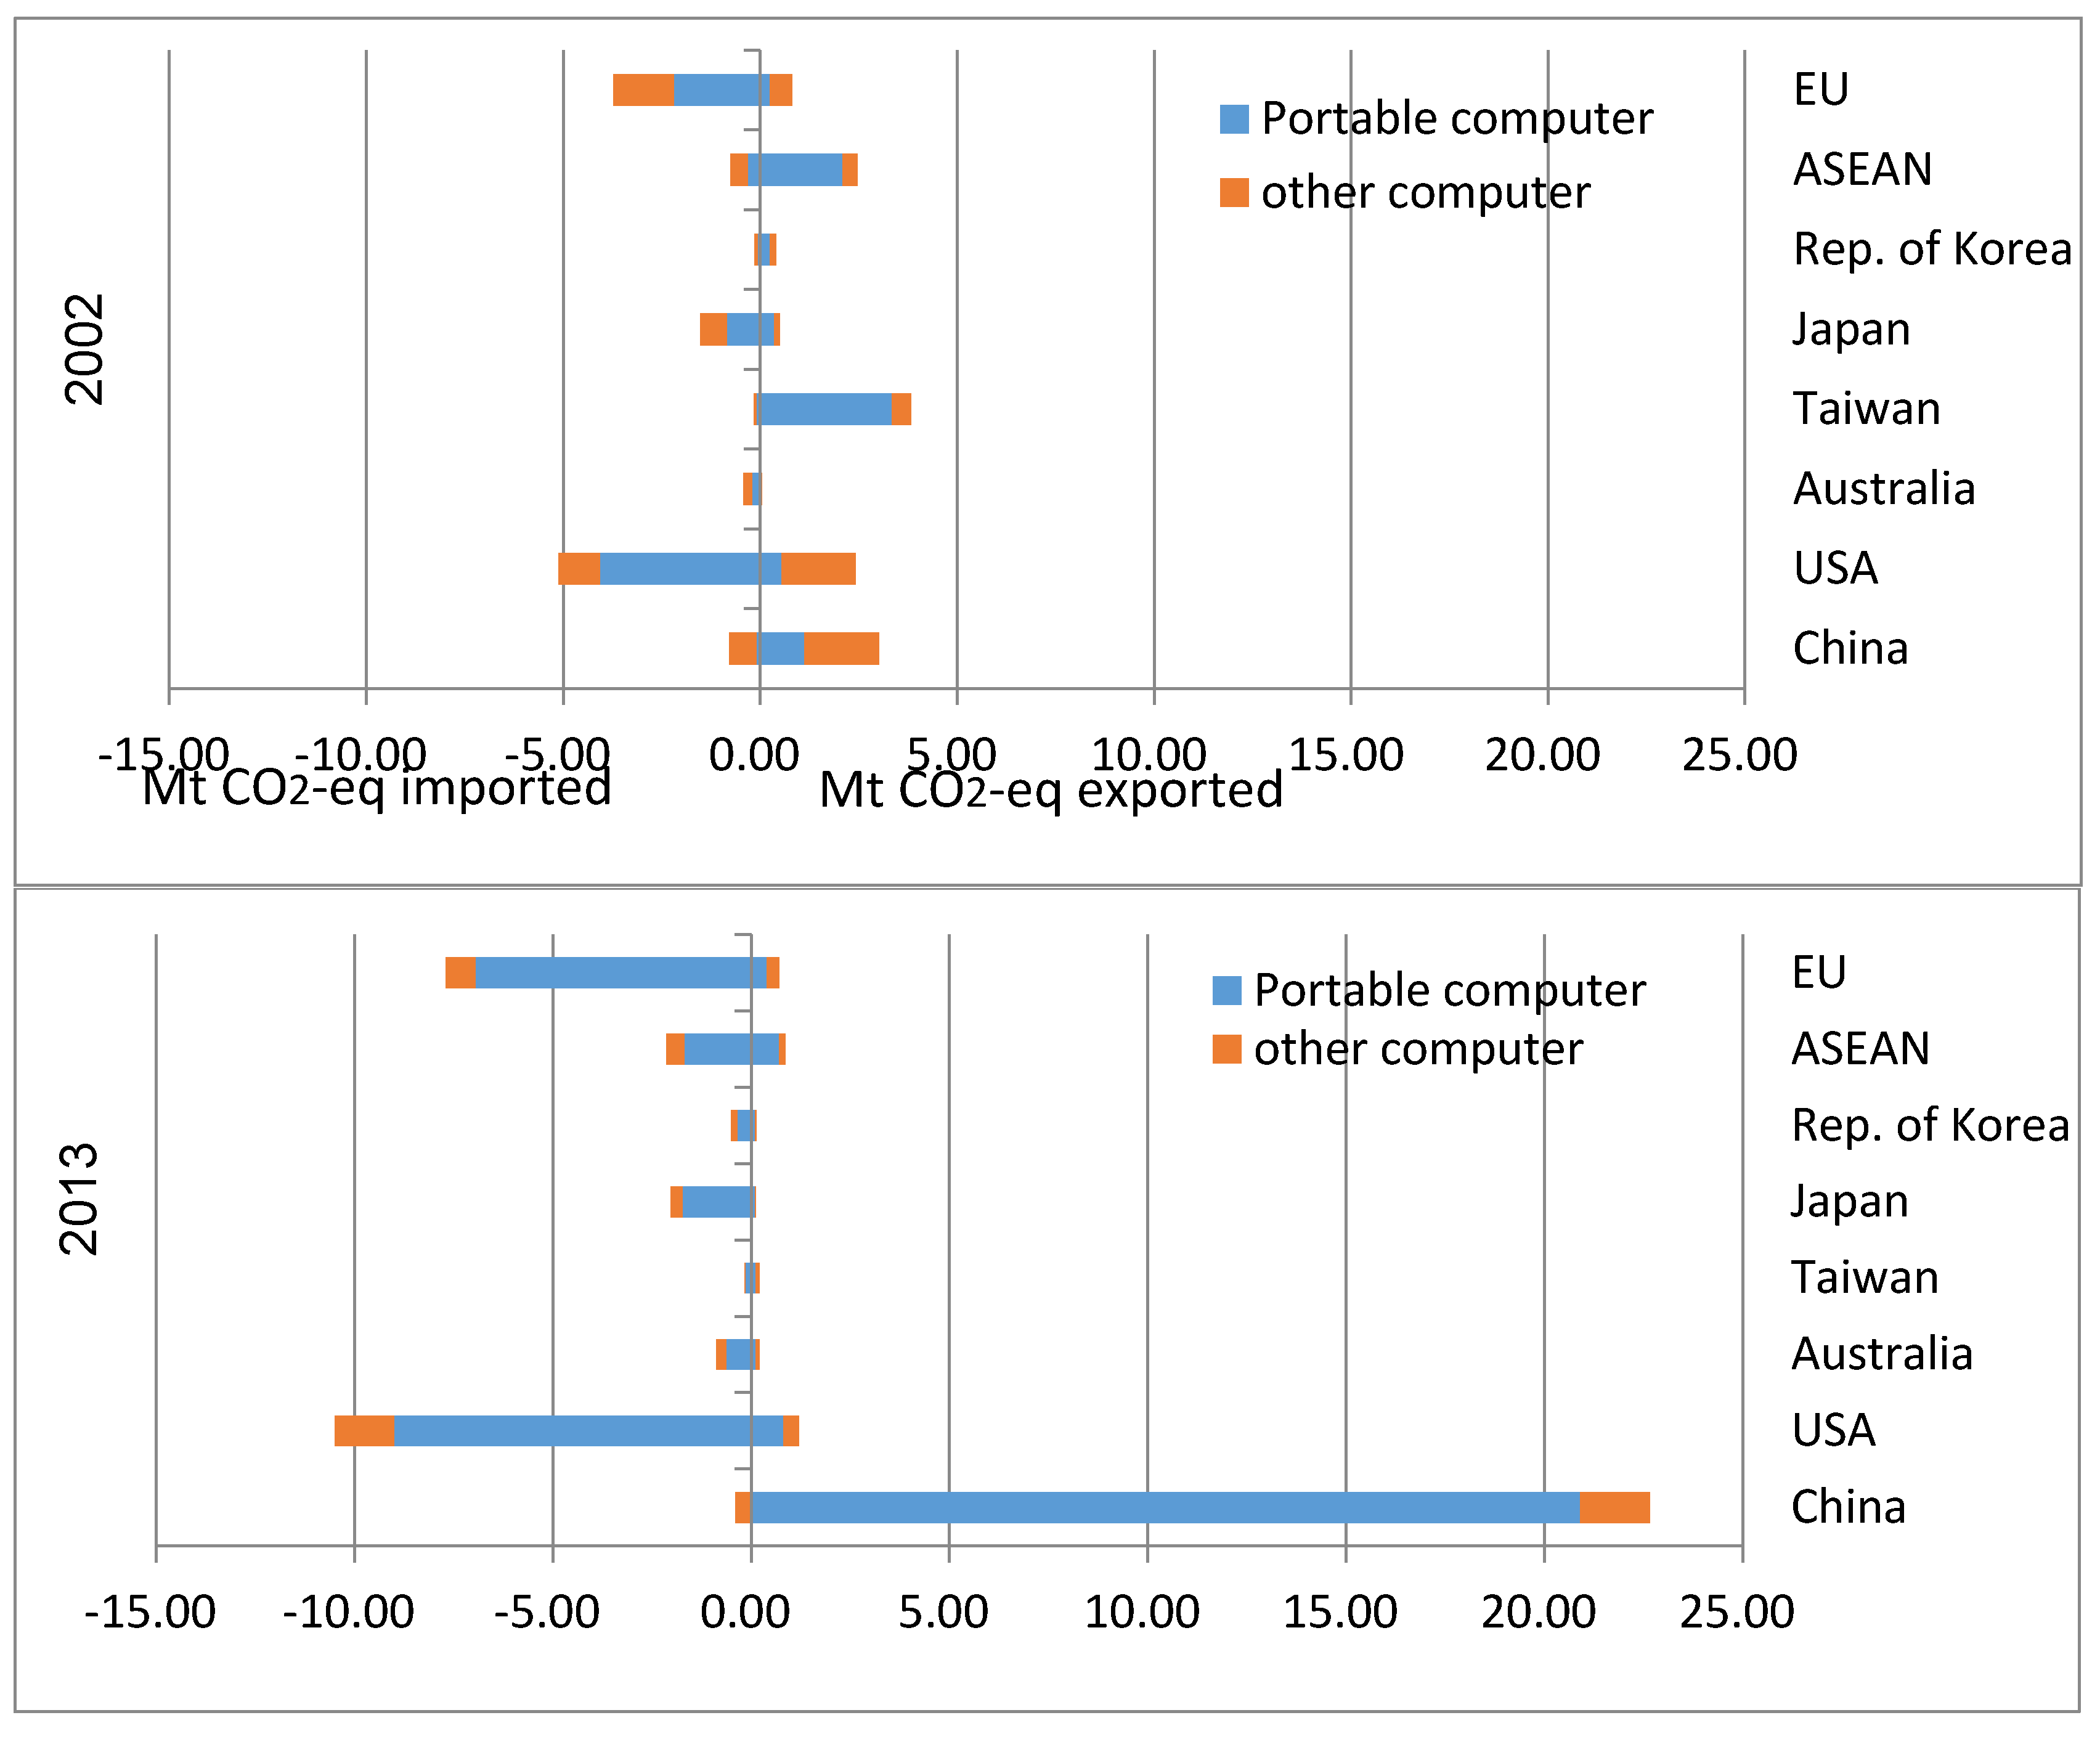
Figure 3 shows the balance of emissions embodied in traded computers in 2002 and 2013 of China and its major trade partners. In 2002, portable computer products had already made up the largest share of computer related GHG emissions embodied in trade. The large imbalance of emissions embodied in USA trade is due to large imports of portable computer products (3.53 Mt of CO2-eq), followed by EU. Taiwan was the largest net exporter of computer-related emissions in 2002, including 3.26 Mt CO2-eq of emission embodied in portable computer products and 0.41 Mt CO2-eq of emission embodied in other computers. Although China was the second largest exporter of emissions embodied in computer trade in 2002, its emissions embodied in exports of portable computer products were small (1.13 Mt CO2-eq) in comparison to Taiwan and ASEAN. ASEAN was the third largest exporter of emissions embodied in computers. Of ASEAN’s exported emissions 85% was embodied in portable computer products (2.09 Mt CO2-eq).
In 2013, China became the largest exporter of computer related emissions embodied in trade, where 20.89 Mt of CO2-eq emissions were embodied in portable computer products exports. However, only 1.77 Mt of CO2-eq of emission was embodied in other computer exports, almost equal to emissions embodied in other computer products in 2002. In Taiwan and ASEAN, emissions embodied in exported portable computer products declined to 0.12 Mt CO2-eq and 0.70 Mt CO2-eq, respectively. USA was the largest importer of portable computer products (9.01 Mt of CO2-eq), followed by the EU (6.95 Mt of CO2-eq).
3.2. Interregional Flows of Emissions Embodied in Trade of Computers
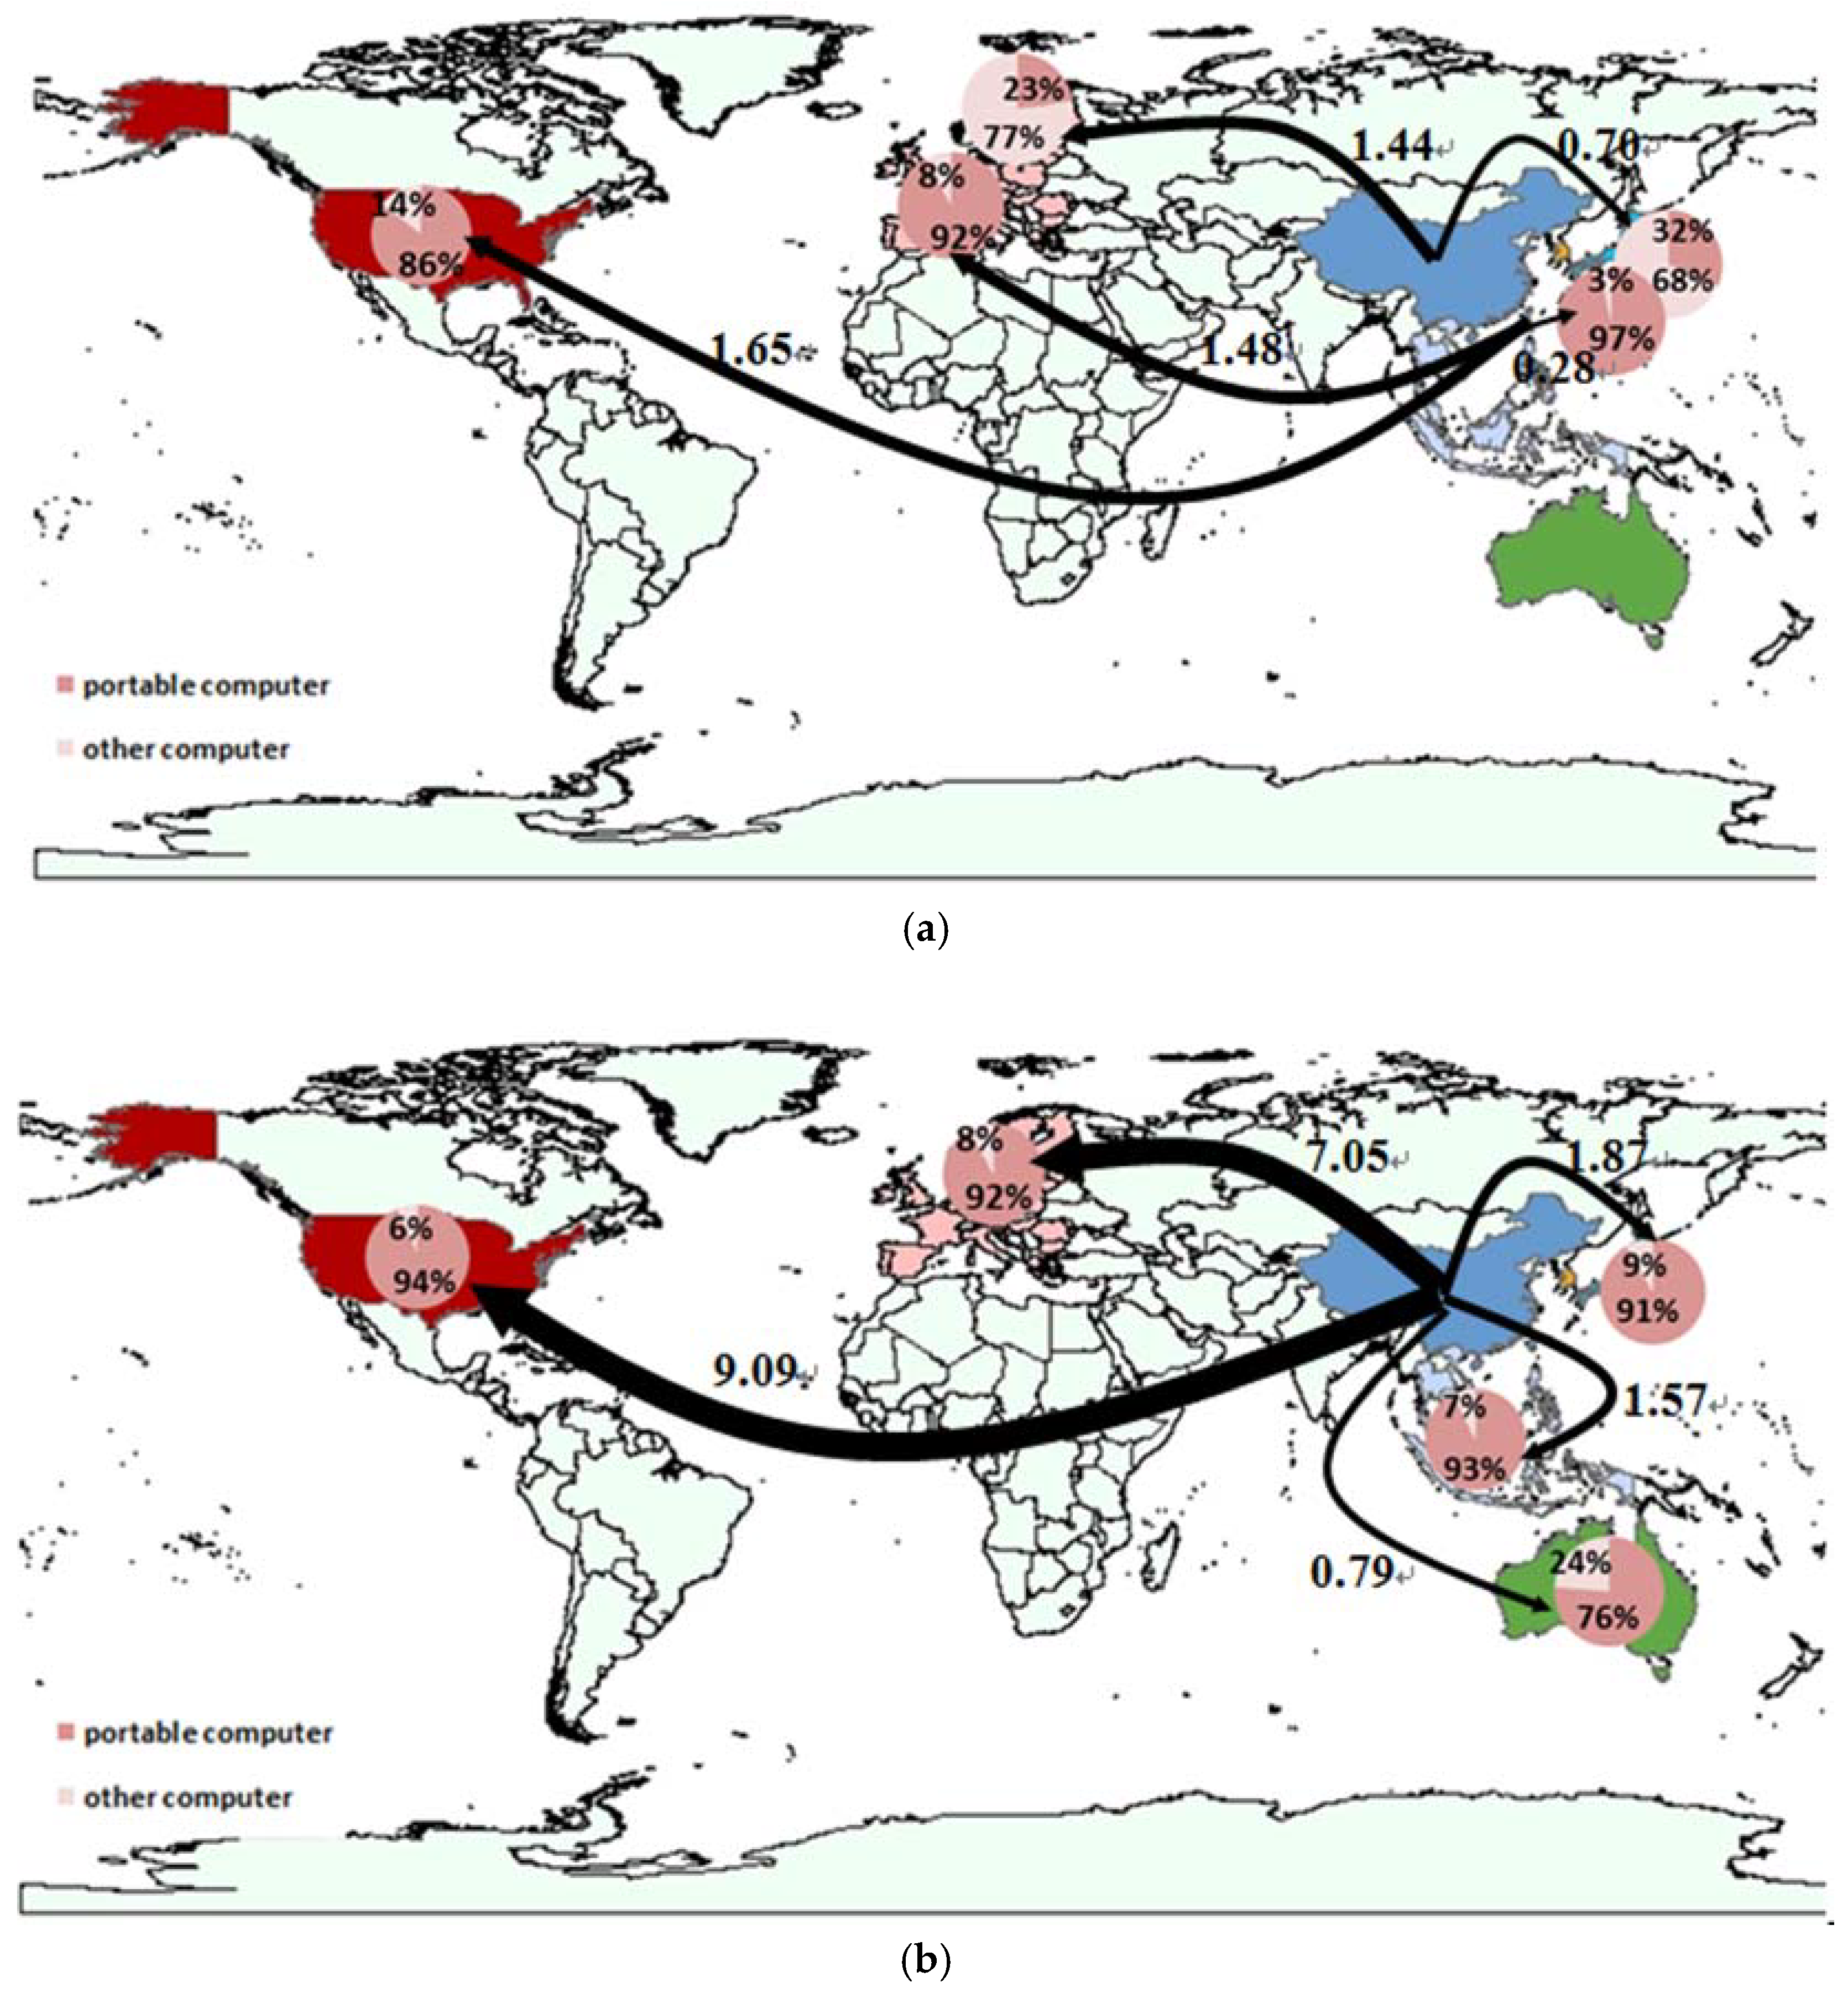
Figure 4 highlights the largest international flows of computer-related emissions embodied in trade in 2002 and 2013. In 2002, the largest international flow of computer-related emissions was from Taiwan to the USA (1.65 Mt of CO2-eq), followed by the flux from Taiwan to the EU (1.48 Mt of CO2-eq). GHG emissions derived from portable computers accounted for 86% and 92% respectively in the flows of Taiwan–USA and Taiwan–EU. It is worth noting that the third main flow was from China to EU (1.44 Mt of CO2-eq), which was mainly composed of other computers (77%). Similarly, the GHG emission flow from China to Japan was mainly composed of other computers (68%). This indicates Taiwan was the largest net exporter of portable computers in 2002, while China mainly exported non-portable computers over that period of time.
However, ten years later, the dominant global flows were the export of emissions embodied in computers from China to the USA (9.09 Mt of CO2-eq; followed by from China to EU (7.05 Mt of CO2-eq) and Japan (1.87 Mt of CO2-eq). The vast majority of flows were related to portable computers (more than 90%). Taiwan, South Korea, and ASEAN were also net exporters to the USA and EU in terms of GHG emissions embodied in computer trades. However, in these Asian regions, the emissions embodied in the imports of computers from China (2.20 Mt of CO2-eq) were higher than those in exports to USA (0.15 Mt of CO2-eq) and the EU (0.32 Mt of CO2-eq). They were net importers overall. Moreover, GHG emissions embodied in computer trade between these Asian regions were not substantial, no more than 0.02 Mt of CO2-eq.
3.3. Driving Mechanism
From the 1980s to the 1990s, the production of computers and components shifted steadily away from the U.S. to the Asia–Pacific region [29].
Portable computers (e.g., laptop and tablets) have increasingly replaced desktop PCs from the beginning of 21st century. Global demand for portable computers has increased. According to Yang [30], Taiwanese firms dominated the global laptop computer market, taking more than 70% of market share. However, the ‘average sales prices’ of laptop computers made in Taiwan continue to decline [30]. To survive and sustain growth, many Taiwanese companies adopted a strategy to relocate factories to countries with lower manufacturing costs such as China and Southeast Asian countries. Following the regulation of the Taiwanese government on the location of strategic activities, a large proportion of Taiwan’s production capacity was relocated to mainland China [30]. As a result, China became one of largest suppliers of IT hardware.
In recent years, a large number of tablet PC factories was built in China. The label of “designed in USA, assembled in China” can be found on every popular Apple product. According to Teehan and Kandlikar [20], GHG emissions embodied in one Apple IPad product were as low as 25.5 kg CO2-eq (0.78 kg weight), lower than that of a desktop product. GHG emissions from a desktop were more than 100 kg CO2-eq at least, while the weight of a desktop is more than 10 kg (including monitors) generally. GHG emission intensities embodied in an IPad is even higher than that embodied in a desktop. Consequently, as the mass data increased for the computer exports (more portable computers) from China, the GHG emissions embodied in computer exports increased sharply.
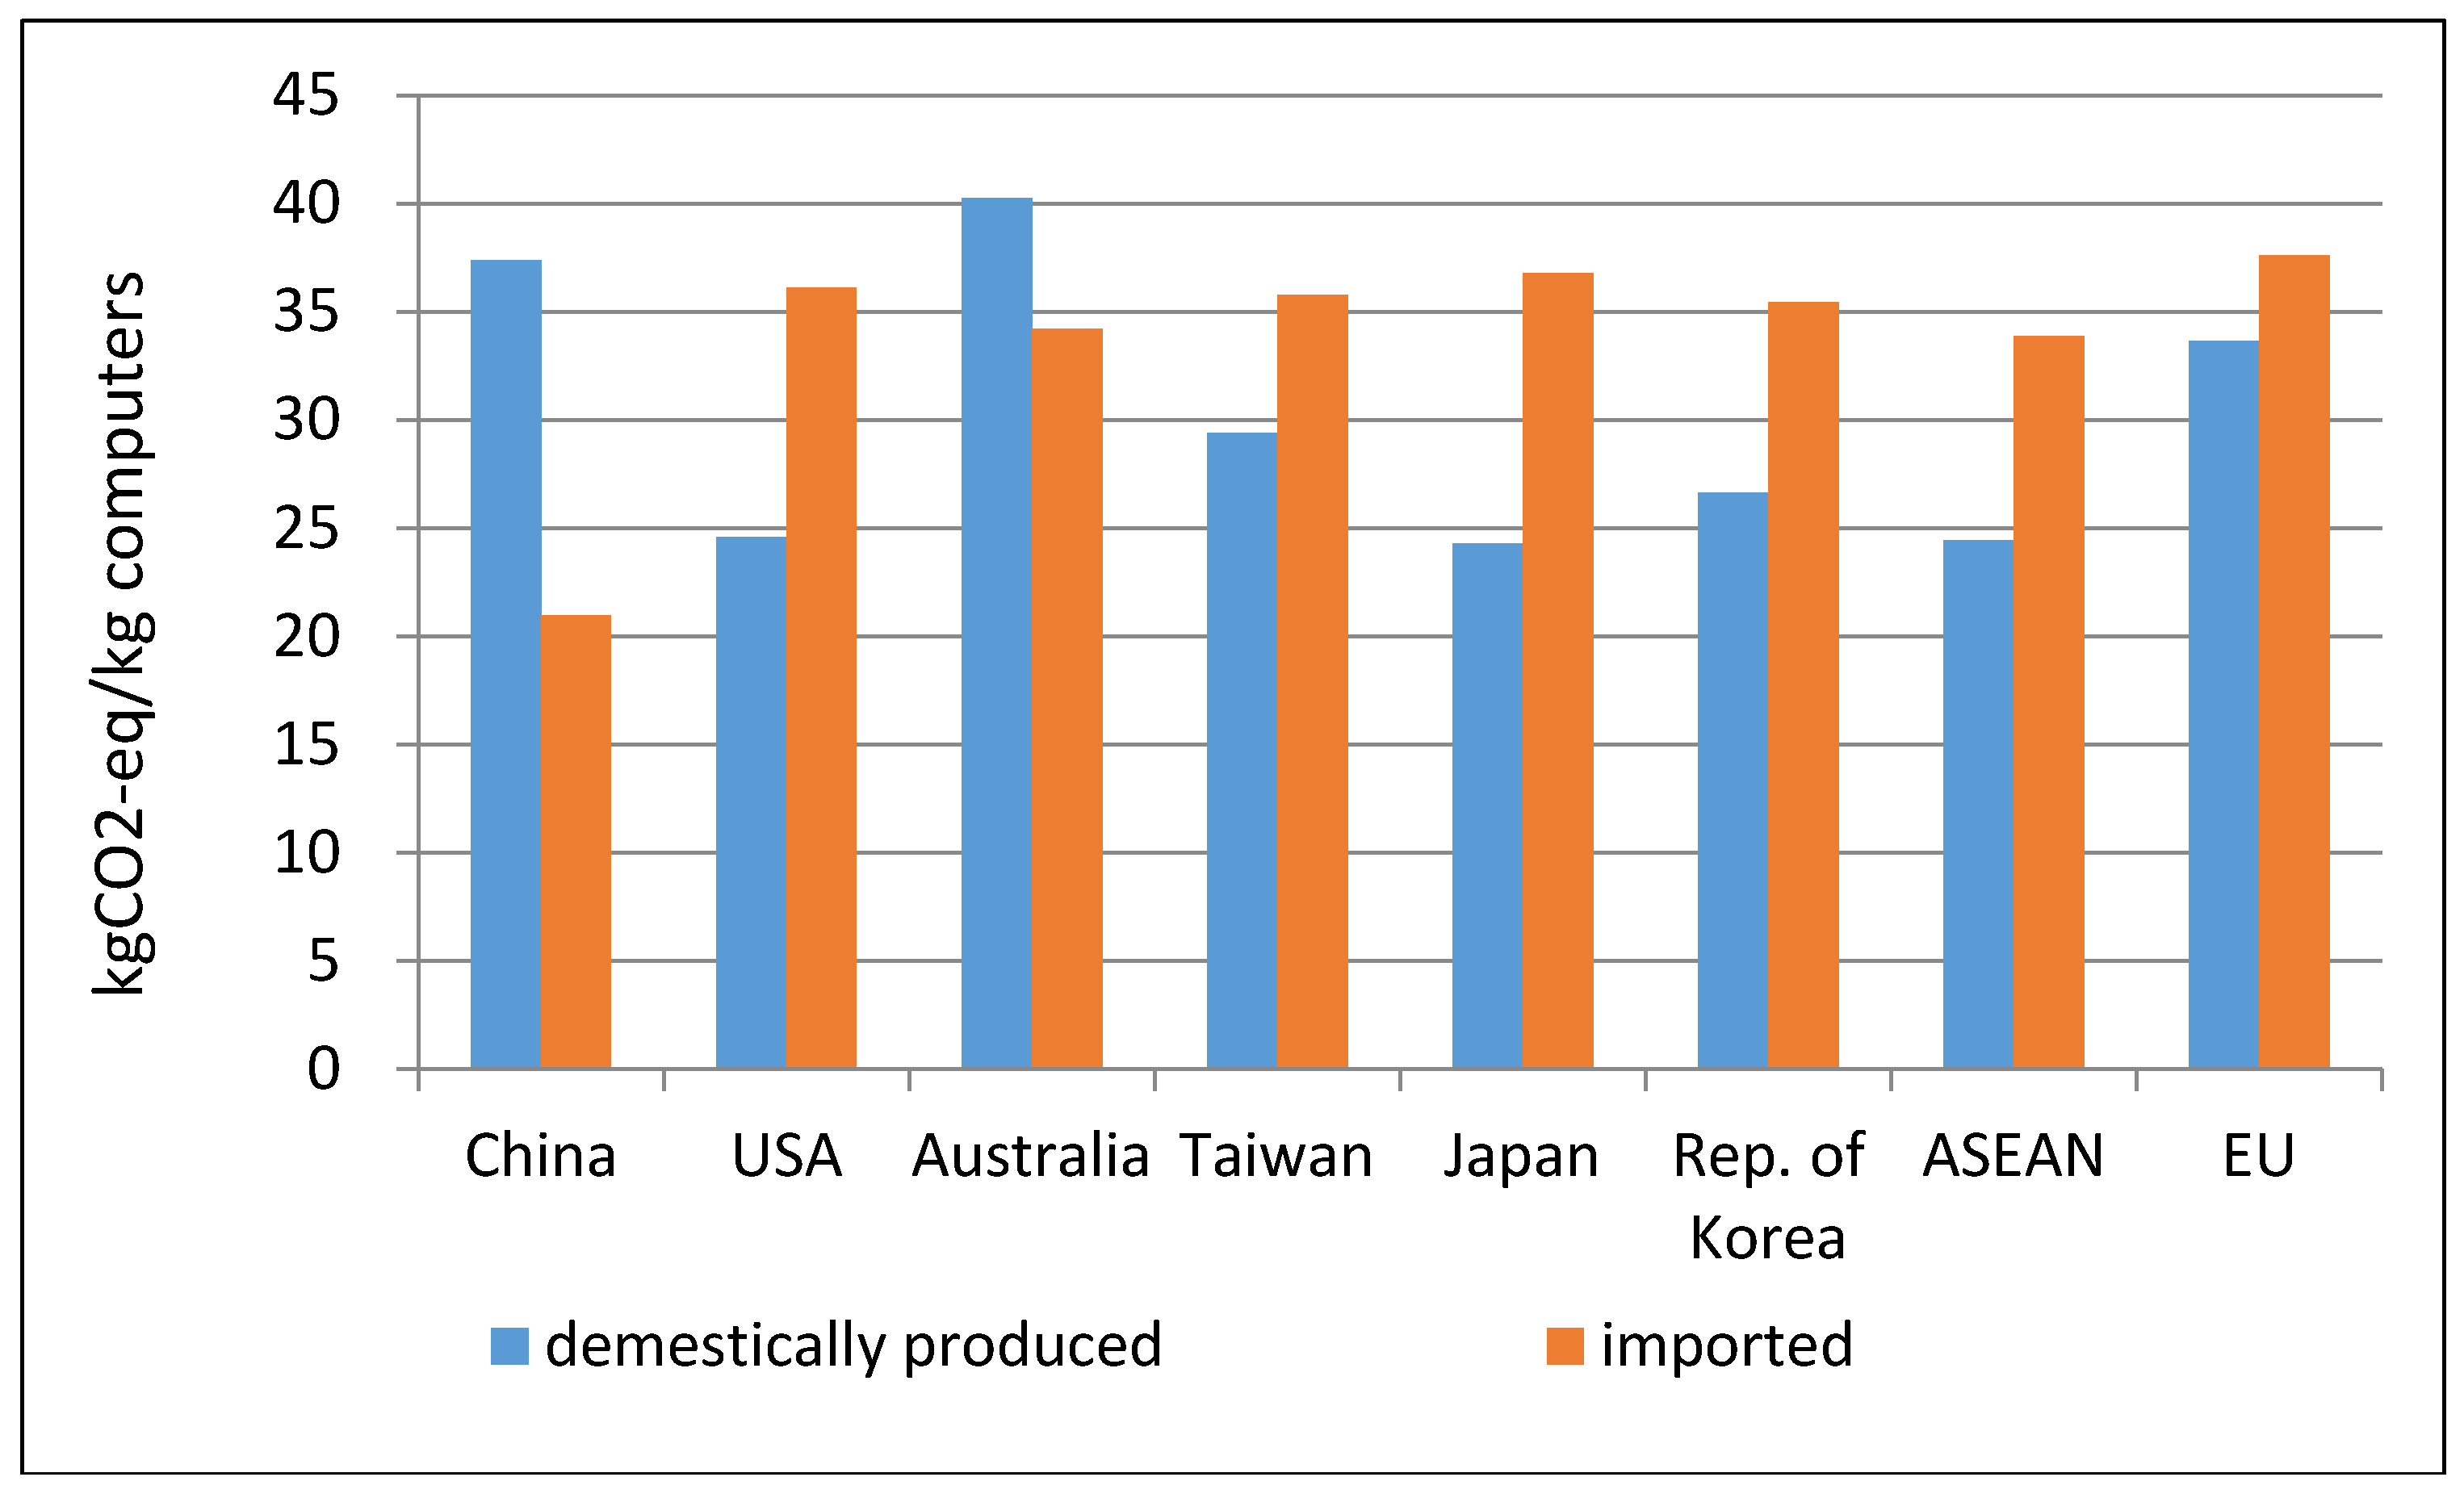
3.4. Emission Intensity
Figure 5 shows the emissions intensity of computer production (kg of CO2-eq emissions per kg of computer being produced domestically and imported for China and its major seven trade partners in 2013. Computers are aggregated to include portable computers and other computers. As shown in Figure 5, the emissions intensity of computers produced domestically and imported are similar in the EU (i.e., 34 kg CO2-eq per kg of computer and 37 kg CO2-eq per kg of computer, respectively). By contrast, the emissions intensity of computers imported to the USA, Taiwan, Japan, Rep. of Korea, and ASEAN (about 24–26 kg CO2-eq per kg of computer) is higher than that of exports (about 34–37 kg CO2-eq per kg of computer). It is opposite in China and Australia. In China, the emissions intensity of domestically produced computers in 2013 was about 37 kg CO2-eq per kg of computer. However, the emissions intensity of imported computers was 21 kg CO2-eq per kg of computer. This shows that in most countries, it is less efficient using computers imported than using computers domestically produced from the GHG emissions’ perspective. The technology and the materials may have similar emissions for each country. The possible reasons for the difference of GHG emissions intensity for each country are the energy mix varies from one country to the other; and the global transportation related emissions.
3.5. Uncertainty Analysis
No matter whether the bottom-up process-based LCA method or the top-down economic input–output model is used, there is great uncertainty associated with the calculation. According to William [22], there was ±15% uncertainty for the process based method and −32% to +300% for the IO model when they applied the hybrid LCA method to estimate the energy intensity of computer manufacturing.
Even one category of a commodity contains a variety of types of goods. For example, portable computers include laptop and other mobile devices. However, there is a lack of detailed information about every single computer product for a global analysis.
In this paper, the emission intensity was retrieved from Teehan and Kandlikar’s study of 11 computer products [20]. Their uncertainty analysis showed that standard deviations ranged from 10% (several products) to 18% (LCD monitor). Weber estimated that the uncertainty associated with the carbon footprint during the production phase of an electronic server was ± 15% [25]. According to these uncertainty analysis, it is assumed that the uncertainty of the emission intensity is ± 10% to ± 18%. This uncertainty range was applied to estimate the uncertainty of GHG emissions embodied in the international trade of a country at the global level.
There is the highest uncertainty associated with export computer-related emissions estimated for China, representing about ± 8.7% to ±15.6% (as percentage of total). By contrast, the uncertainty of other regions is no more than ± 1%. The uncertainty associated with import computer-related emissions estimated for USA is the highest (± 4.3% to ± 7.8%), followed by EU (± 3.2% to ± 5.7%). More specific computer information and detailed commodity category of the international trade will help to reduce the level of uncertainty.
4. Discussion
According to Weber, it is highly likely that geographical uncertainty is associated with electronics due to “complex global supply chains that are dependent on geographically explicit electricity mixes” [25]. The CO2 emissions per kWh of electricity generation in different countries were used to adjust the GHG emissions intensity for each country to mitigate the geographical uncertainty.
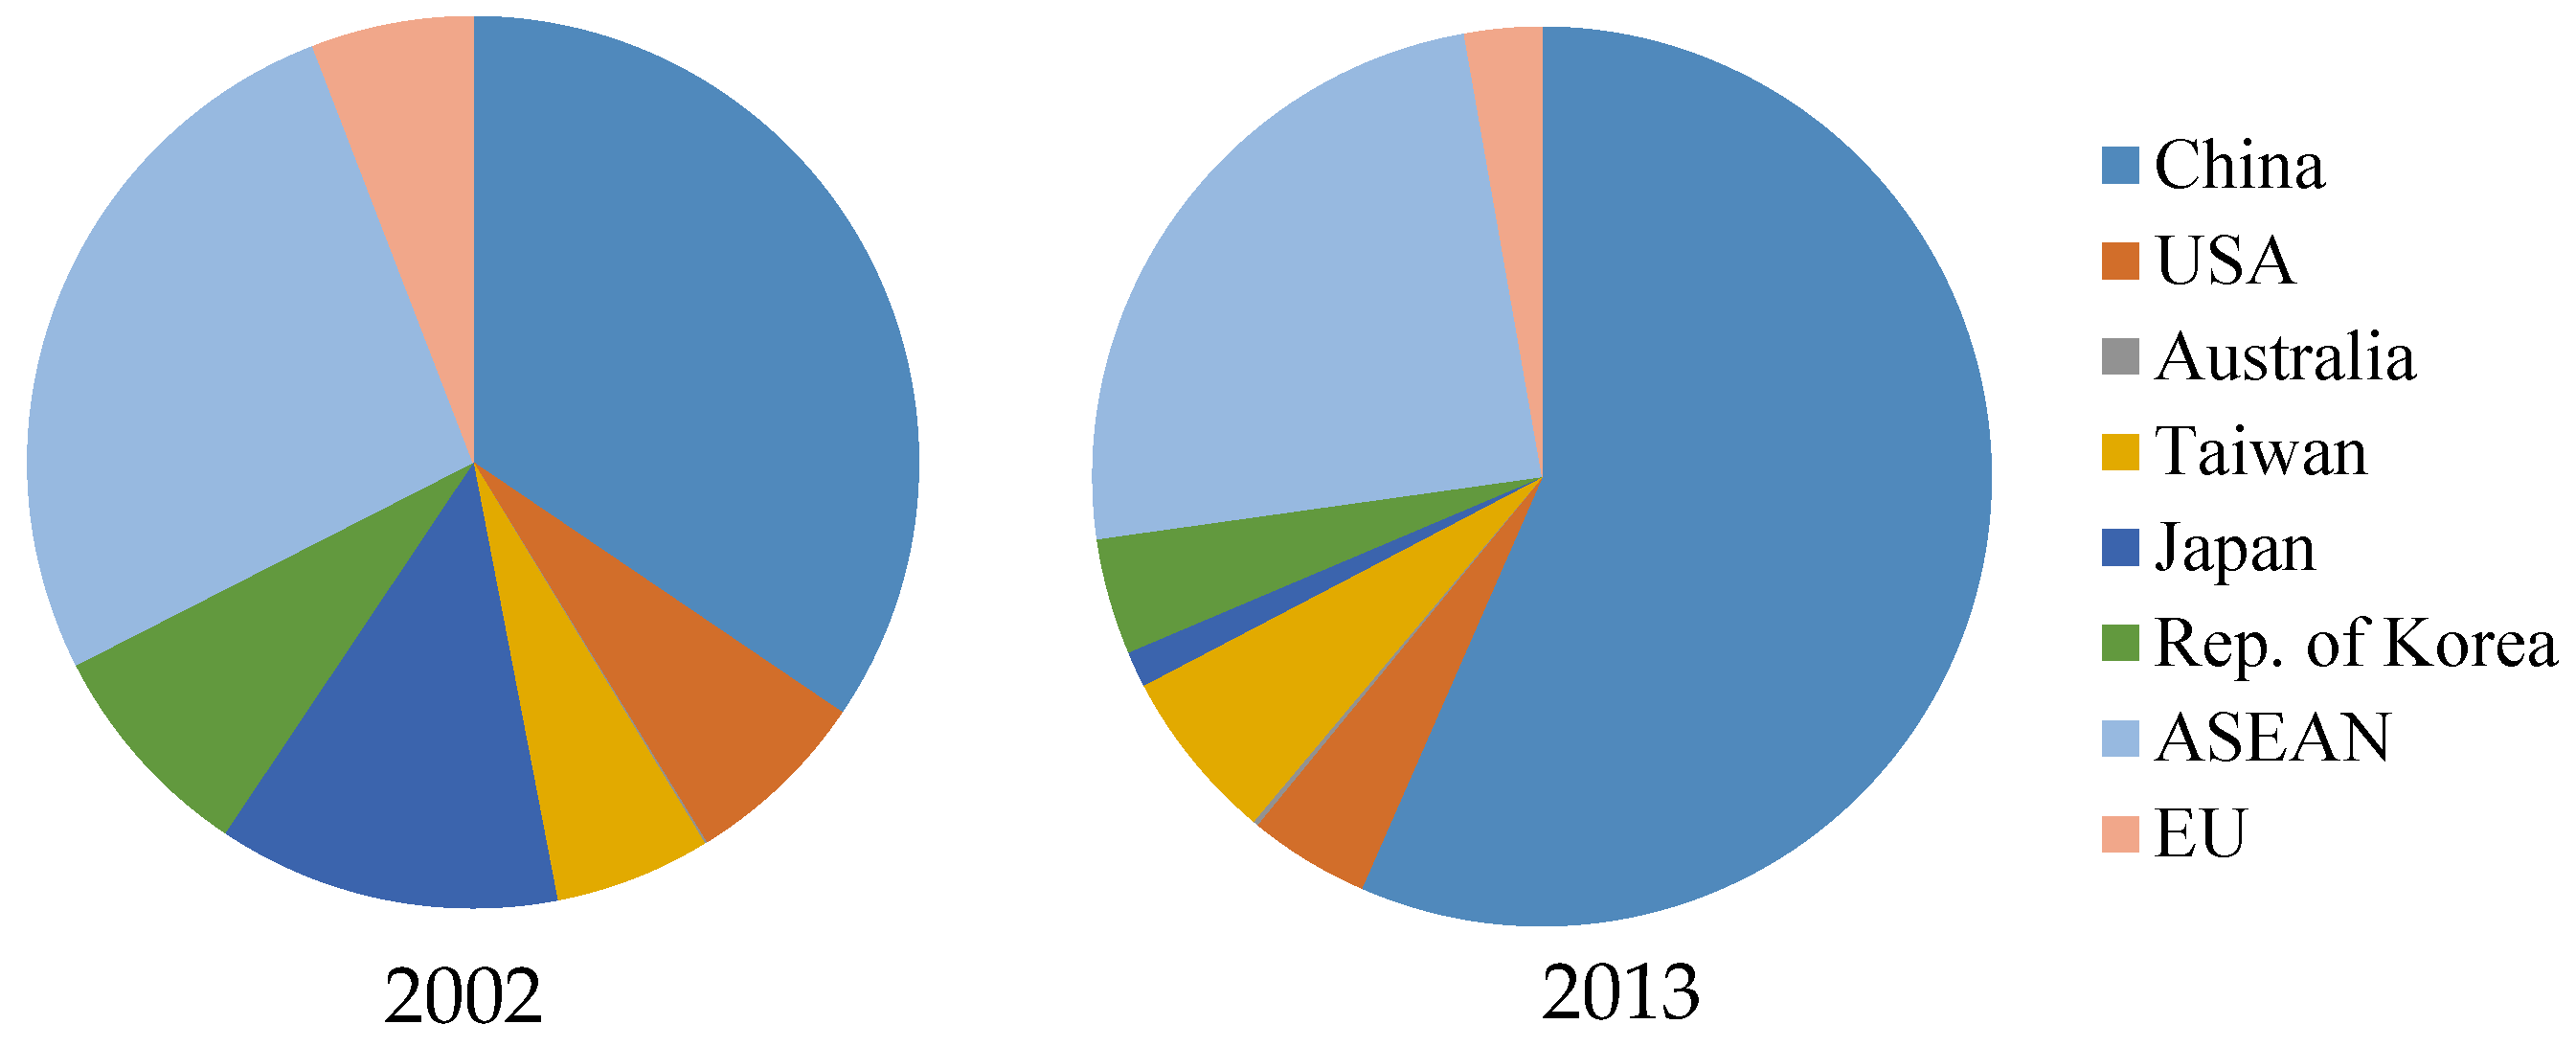
Moreover, we analyzed the exports mass data according to different units of computers, i.e., digital processing units (HS 847150), Input or output units (HS 847160), Storage units (HS 847170), and other units (HS 847180). As shown in Figure 6, exports of units of computer shared the same pattern of the whole machines. From 2002 to 2013, the market share of China in global exports of computer units increased sharply as well. China has taken more than half of the global market share in terms of the computer units, reaching 57% in 2013. This indicates that China is the biggest export country in terms of not only entire machines but also units of computers. For a complex product such as a computer, the entire production could be divided into four distinct phases, i.e., design, parts production, assembly, and marketing. Some assembly phases may be labor intensive. Under the context of global production networks, China used to be considered to be mainly operating in the assembly phase. However, according to Figure 5, China has also dominated in the parts production phase recently. Due to the longer supply chain of computers during the production phase in one country, uncertainty from geographical variability is reduced.
It is worth noting that the electronic integrated circuits and micro-assemblies products (HS 8542) always ranked first in all the imported goods of China from 2002 to 2013 [24]. Integrated circuits and micro-assemblies are the core components of computer products, and circuit boards including ICs which are responsible for the majority of embodied GHG emissions in most computer products. According to Teehan and Kandlikar’s calculated results, the GHG emission intensity of a circuit (including IC) is about 100–300 kg CO2-eq/kg. Integrated circuits have the highest emission intensity among all parts of computers [20]. China imported integrated circuits mainly from Taiwan, Rep. of Korea, USA, and Japan [24], which may affect the GHG emissions embodied in the computer trade. However, integrated circuits and micro-assemblies can be used for many kinds of electronic products, not only for computers. At the moment, it is virtually impossible to retrieve integrated circuits and micro-assemblies trade data for computers from the present database on international trade statistics.
Moreover, it is highly likely that a cutoff error exists associated with the process-based LCA method due to the complexity of the computer products. The most critical cutoff error is during the design and marketing phase. Over half of carbon emissions from each laptop are attributed to sectors of wholesale trade, management of companies and so on [23]. Future research opportunities exist to address this truncation error. Similarly, other life cycle phases such as the design, marketing, and disposal can be further studied so that GHG emissions throughout the entire supply chain can be examined.
5. Conclusions
Computer products are energy and carbon intensive even only in the production phase of the entire life cycle (i.e., excluding the use phase). During the last decade, GHG emissions embodied in exports increased sharply due to the exporting activities of electronic products, especially for computers. The examination of emissions embodied in the international trade of computer products highlights the technological innovation and geographical variability as emission factors.
Industry succession leads to industry transfer, and consequently affects the GHG emissions embodied in the trade significantly. The main driver of computer-related emissions embodied in international trade is industry transfer. Since the 1990s, despite most design phases remaining in the USA, the actual production of computer products has shifted steadily away from the USA, mostly to countries in the Asia–Pacific region [29], first in Southeast Asia (Taiwan and ASEAN) but now almost entirely in China. This has been responsible for a large amount of GHG emissions transfer. In particular, the biggest global embodied GHG emission flows related to computers are the export from China to the USA (9.09 Mt of CO2-eq), followed by from China to the EU (7.05 Mt of CO2-eq), and Japan (1.87 Mt of CO2-eq).
Therefore, it is imperative to design corresponding policies to deal with these embodied GHG emissions. There are several ways to allocate responsibility for anthropogenic emissions to countries. Of particular interest for climate policy is the allocation of production-based and consumption-based emissions [31,32]. Carbon leakage and trade attracted the attention of a number of scholars and governments during the post-Kyoto negotiations. However, production globalization has made it more difficult to separate GHG emission related responsibility between various countries. Reduction of GHG emission is destined to be a global responsibility.
Our research of emissions embodied in the international trade of computers highlights the regional variation in emissions intensities and helps to make effective regional and national trade policies for mitigating electronic product emissions. It is conceivable that consumption-based accounting of this sort could eventually be used to impose cooperative trade agreements, technology sharing, or carbon-based tariffs. If carbon-based tariffs were introduced, the price of computers from carbon-intensive countries would increase. As a result, the number of computers imported from high emission intensity countries may decrease. Consequently, the cost of carbon-based tariffs growth would give an incentive for export companies to produce their products with lower CO2 emissions [33,34]. However, border taxes on virtual (embodied) carbon will cause trade distortion, which could bring associated losses in efficiency and welfare [35]. Moreover, the growing burden might shift from exporter to importer.
Author Contributions
L.-C.L. analyzed the data, Y.W. conceived and designed the theoretical framework and mathematical model, Y.Y. contributed analysis tools, J.Z. provided guidance and improving suggestions. All authors read and approved the final manuscript.
Acknowledgments
This research was supported by the Natural Science Foundation of China (Grant No. 41571522, 41201591 and 71673198).
Conflicts of Interest
The authors declare no conflict of interest.
Appendix A

Table A1.
GHG Emissions intensity ((kg CO2-eq/kg) from 2002 to 2013 by linear interpolation.
| 2002 | 2003 | 2004 | 2005 | 2006 | 2007 | 2008 | 2009 | 2010 | 2011 | 2012 | 2013 | |
|---|---|---|---|---|---|---|---|---|---|---|---|---|
| Portable computer products | 76 | 70 | 64 | 59 | 55 | 50 | 47 | 43 | 40 | 36 | 34 | 31 |
| Other computer products | 39 | 37 | 35 | 33 | 31 | 30 | 28 | 26 | 25 | 24 | 22 | 21 |
Table A2.
CO2 emissions per kWh of electricity generation (kg CO2-eq/kWh) [27].
Table A2.
CO2 emissions per kWh of electricity generation (kg CO2-eq/kWh) [27].
| 2002 | 2003 | 2004 | 2005 | 2006 | 2007 | 2008 | 2009 | 2010 | 2011 | 2012 | 2013 | |
|---|---|---|---|---|---|---|---|---|---|---|---|---|
| China | 0.82 | 0.85 | 0.88 | 0.87 | 0.86 | 0.82 | 0.80 | 0.79 | 0.76 | 0.76 | 0.76 | 0.76 |
| USA | 0.57 | 0.58 | 0.58 | 0.57 | 0.55 | 0.56 | 0.55 | 0.52 | 0.52 | 0.50 | 0.50 | 0.50 |
| Australia | 0.90 | 0.88 | 0.88 | 0.90 | 0.90 | 0.89 | 0.89 | 0.91 | 0.84 | 0.82 | 0.82 | 0.82 |
| Taiwan | 0.63 | 0.65 | 0.64 | 0.65 | 0.66 | 0.65 | 0.65 | 0.64 | 0.62 | 0.60 | 0.60 | 0.60 |
| Japan | 0.42 | 0.45 | 0.43 | 0.43 | 0.42 | 0.45 | 0.44 | 0.42 | 0.42 | 0.50 | 0.50 | 0.50 |
| Rep. of Korea | 0.48 | 0.48 | 0.50 | 0.49 | 0.49 | 0.48 | 0.49 | 0.53 | 0.53 | 0.55 | 0.55 | 0.55 |
| ASEAN 1 | 0.56 | 0.54 | 0.54 | 0.56 | 0.54 | 0.55 | 0.55 | 0.53 | 0.56 | 0.56 | 0.56 | 0.56 |
| EU-28 | 0.41 | 0.40 | 0.39 | 0.39 | 0.39 | 0.40 | 0.38 | 0.36 | 0.35 | 0.35 | 0.35 | 0.35 |
| Average | 0.58 | 0.58 | 0.58 | 0.59 | 0.58 | 0.58 | 0.58 | 0.57 | 0.57 | 0.57 | 0.57 | 0.57 |
1 Average of main six countries of ASEAN: Singapore, Malaysia, Thailand, Indonesia, Vietnam, Philippines.
Table A3.
Adjustment results of GHG Emissions intensity ((kg CO2-eq/kg) in different counties. Portable computer products.
Table A3.
Adjustment results of GHG Emissions intensity ((kg CO2-eq/kg) in different counties. Portable computer products.
| Portable Computer Products | |||||||||||||
| Year | 2002 | 2003 | 2004 | 2005 | 2006 | 2007 | 2008 | 2009 | 2010 | 2011 | 2012 | 2013 | |
| Country | |||||||||||||
| China | 106 | 102 | 97 | 88 | 81 | 71 | 64 | 58 | 51 | 48 | 44 | 41 | |
| USA | 74 | 69 | 64 | 58 | 52 | 48 | 43 | 38 | 35 | 31 | 29 | 27 | |
| Australia | 118 | 106 | 97 | 92 | 84 | 77 | 71 | 67 | 57 | 51 | 47 | 44 | |
| Taiwan | 82 | 78 | 71 | 66 | 62 | 57 | 52 | 47 | 42 | 38 | 35 | 32 | |
| Japan | 55 | 53 | 47 | 44 | 39 | 39 | 35 | 31 | 28 | 31 | 29 | 26 | |
| Rep. of Korea | 63 | 57 | 56 | 50 | 46 | 42 | 39 | 39 | 36 | 34 | 31 | 29 | |
| ASEAN | 72 | 65 | 60 | 57 | 51 | 48 | 44 | 39 | 38 | 35 | 33 | 30 | |
| EU-28 | 53 | 48 | 43 | 39 | 37 | 34 | 30 | 26 | 24 | 22 | 20 | 19 | |
| Other Computer Products | |||||||||||||
| Year | 2002 | 2003 | 2004 | 2005 | 2006 | 2007 | 2008 | 2009 | 2010 | 2011 | 2012 | 2013 | |
| Country | |||||||||||||
| China | 55 | 54 | 53 | 49 | 46 | 42 | 38 | 36 | 33 | 31 | 29 | 28 | |
| USA | 38 | 36 | 35 | 33 | 30 | 28 | 26 | 23 | 22 | 20 | 19 | 18 | |
| Australia | 60 | 56 | 53 | 51 | 48 | 45 | 43 | 41 | 36 | 33 | 32 | 30 | |
| Taiwan | 42 | 41 | 39 | 37 | 35 | 33 | 31 | 29 | 27 | 24 | 23 | 22 | |
| Japan | 28 | 28 | 26 | 24 | 23 | 23 | 21 | 19 | 18 | 20 | 19 | 18 | |
| Rep. of Korea | 32 | 30 | 30 | 28 | 26 | 24 | 23 | 24 | 23 | 22 | 21 | 20 | |
| ASEAN | 37 | 34 | 33 | 32 | 29 | 28 | 27 | 24 | 24 | 23 | 22 | 21 | |
| EU-28 | 27 | 25 | 23 | 22 | 21 | 20 | 18 | 16 | 15 | 14 | 14 | 13 | |
Appendix B
◆ The example of the calculation process of the value in Figure 2 is shown as follows.
Example: as for China, according to the Formula (1), the exports emissions (Mt CO2-eq) embodied in portable computer products trade on 2002 in Figure 2 was calculated below:
where: 10,601,586 is mass data (Kg) for computer exports i.e., the A in Formula (1), which is based on United Nations Commodity Trade Statistics Database; 106 (see Table A3) is GHG emissions (Kg CO2-eq) per kg of computer products i.e., the EF in Formula (1).
10,601,586 × 106/109 = 1.13
The example of the calculation process of the value in Figure 5 is shown as follows.
Example: the domestically produced emissions intensity in China in 2013 was calculated as follows:
where: 41 is GHG Emissions intensity (kg CO2-eq per kg of computer) for portable computer products; the 28 is GHG Emissions intensity (kg CO2-eq per kg of computer) for non-portable computer products; 0.75 means portable computer account for 75% in all kind of computer; 0.25 means non-portable computer account for 25% in all kind of computer.
41 × 0.75 + 28 × 0.25 = 37.75
The imported emissions intensity was calculated as follows:
where: 0.02 is the GHG emissions (Mt CO2-eq) embodied in imports Portable computer, which is calculated according to Formula (1); 0.37 is the GHG emissions (Mt CO2-eq) embodied in imports non-portable computer, which is calculated according to Formula (1); 680,133 is the imports Portable computer mass data (kg); 17,990,364 is the imports non-portable computer mass data (kg). These mass data were extracted from United Nations Commodity Trade Statistics Database.
(0.02 + 0.37) × 109/(680,133 + 17,990,364) = 20.88
References
- IPCC. Climate Change 2014: Synthesis Report. Contribution of Working Groups I, II and III to the Fifth Assessment Report of the Intergovernmental Panel on Climate Change; Core Writing Team, Pachauri, R.K., Meyer, L.A., Eds.; IPCC: Geneva, Switzerland, 2014; 151p. [Google Scholar]
- Davis, S.J.; Caldeira, K. Consumption-based accounting of CO2 emissions. Proc. Natl. Acad. Sci. USA 2010, 107, 5687–5692. [Google Scholar] [CrossRef] [PubMed]
- Minx, J.C.; Wiedmann, T.; Wood, R.; Peters, G.P.; Lenzen, M.; Owen, A.; Scott, K.; Barrett, J.; Hubacek, K.; Baiocchi, G.; et al. Input–output analysis and carbon footprinting: An overview of applications. Econ. Syst. Res. 2009, 21, 187–216. [Google Scholar] [CrossRef]
- Peters, G.P.; Hertwich, E.G. CO2 Embodied in International Trade with Implications for Global Climate Policy. Environ. Sci. Technol. 2008, 9, 1401–1407. [Google Scholar] [CrossRef]
- Weber, C.L.; Peters, G.P.; Guan, D.; Hubacek, K.H. The contribution of Chinese exports to climate change. Energy Policy 2008, 36, 3572–3577. [Google Scholar] [CrossRef]
- Wang, Y.; Wang, W.Q.; Mao, G.Z.; Cai, H.; Zuo, J.; Zhao, P. Industrial CO2 emissions in China based on the hypothetical extraction method: Linkage analysis. Energy Policy 2013, 62, 1238–1244. [Google Scholar] [CrossRef]
- Weitzel, M.; Ma, T. Emissions embodied in Chinese exports taking into account the special export structure of China. Energy Econ. 2014, 45, 45–52. [Google Scholar] [CrossRef]
- Xu, M.; Allenby, B.; Chen, W.Q. Energy and Air Emissions Embodied in China-U.S. Trade: Eastbound Assessment Using Adjusted Bilateral Trade Data. Environ. Sci. Technol. 2009, 43, 3378–3384. [Google Scholar] [CrossRef] [PubMed]
- Wei, B.Y.; Fang, X.Q.; Wang, Y. The effects of international trade on Chinese carbon emissions: An empirical analysis. J. Geogr. Sci. 2011, 21, 301–316. [Google Scholar] [CrossRef]
- Weber, C.L.; Matthews, H.S. Embodied environmental emissions in U.S. international trade, 1997–2004. Environ. Sci. Technol. 2007, 41, 4875–4881. [Google Scholar] [CrossRef] [PubMed]
- National Bureau of Statistics National Accounts Division. Input and Output table of China; China Statistics Press: Beijing, China, 2007; ISBN 978-7-5037-5695-5.
- The Yearbook of World Electronics Data. 2013. Available online: http://www.rer.co.uk/index.php?route=product/category&path=20_59 (accessed on 3 February 2015).
- The National Bureau of Statistics of Industrial Statistics Division. China Industry Statistical Yearbook; China Statistics Press: Beijing, China, 2013; ISBN 978-7-5037-7411-9.
- China Information Industry Yearbook Editorial Committee. Yearbook of China Information Industry; Electronic Industry Press: Beijing, China, 2012; ISBN 978-7-1211-9236-4.
- Hertwich, E.G.; Roux, C. Greenhouse gas emissions from the consumption of electric and electronic equipment by Norwegian households. Environ. Sci. Technol. 2011, 45, 8190–8196. [Google Scholar] [CrossRef] [PubMed]
- Kumar, I.; Tyner, W.E.; Sinha, K.C. Input–output life cycle environmental assessment of greenhouse gas emissions from utility scale wind energy in the United States. Energy Policy 2016, 89, 294–301. [Google Scholar] [CrossRef]
- Huang, Y.; Liu, L.; Pan, X. CO2, emissions structure of local economy: A case of Shenzhen, China. Energy Procedia 2016, 104, 86–91. [Google Scholar] [CrossRef]
- Levasseur, A.; Cavalett, O.; Fuglestvedt, J.S.; Gasser, T.; Johansson, D.J.A.; Jørgensen, S.V.; Raugei, M.; Reisinger, A.; Schivley, G.; Strømman, A.H.; et al. Enhancing life cycle impact assessment from climate science: Review of recent findings and recommendations for application to LCA. Ecol. Indic. 2016, 71, 163–174. [Google Scholar] [CrossRef]
- Petrillo, A.; Felice, F.D.; Jannelli, E.; Autorino, C.; Minutillo, M.; Lavadera, A.L. Life cycle assessment (lca) and life cycle cost (lcc) analysis model for a stand-alone hybrid renewable energy system. Renew. Energy 2016, 95, 337–355. [Google Scholar] [CrossRef]
- Teehan, P.; Kandlikar, M. Comparing Embodied Greenhouse Gas Emissions of Modern Computing and Electronics Products. Environ. Sci. Technol. 2013, 47, 3997–4003. [Google Scholar] [CrossRef] [PubMed]
- Deng, L.; Babbitt, C.W.; Williams, E.D. Economic-balance hybrid LCA extended with uncertainty analysis: Case study of a laptop computer. J. Clean. Prod. 2011, 19, 1198–1206. [Google Scholar] [CrossRef]
- Williams, E. Energy Intensity of Computer Manufacturing: Hybrid Assessment Combining Process and Economic Input–output Methods. Environ. Sci. Technol. 2004, 38, 6166–6174. [Google Scholar] [CrossRef] [PubMed]
- Deng, L.Q.; Babbitt, C.W.; Williams, E.D. Energy Intensity of Computer Manufacturing: Hybrid Assessment Combining Process and Economic Input–output Methods. J. Clean. Prod. 2011, 19, 1198–1206. [Google Scholar] [CrossRef]
- United Nations Commodity Trade Statistics Database. 2015. Available online: http://comtrade.un.org/db/default.aspx (accessed on 3 February 2015).
- Weber, C.L. Uncertainty and Variability in Product Carbon Footprinting: Case Study of a Server. J. Ind. Ecol. 2012, 16, 203–211. [Google Scholar] [CrossRef]
- Duan, H.B.; Eugster, M.; Hischier, R.; Streicher-Porte, M.; Li, J.H. Life cycle assessment study of a Chinese desktop personal computer. J. Sci. Total Environ. 2009, 407, 1755–1764. [Google Scholar] [CrossRef] [PubMed]
- International Energy Agency (IEA) Clean Coal Centre, CO2 Abatement in the Iron and Steel Industry, 2012. Available online: https://www.iea-coal.org/ (accessed on 10 February 2015).
- Hischier, R.; Classen, M.; Lehmann, M.; Scharnhorst, W. Life Cycle Inventories of Electric and Electronic Equipment: Production, Use and Disposal; Ecoinvent Report No. 18; EMPA/Technology and Society Lab., Swiss Centre for Life Cycle Inventories: Dübendorf, Switzerland, 2007. [Google Scholar]
- Kraemer, K.L.; Dedrick, J. Globalization in the Computer Industry: Implications of the Asian Production Network for the U.S. Center for Research on Information Technology and Organizations UC Irvine. 1998. Available online: https://escholarship.org/uc/item/0hv4n3qx#page-1 (accessed on 15 February 2015).
- Yang, Y.K. The Taiwanese Notebook Computer Production Network in China: Implication for Upgrading of the Chinese Electronics Industry. Personal Computing Industry Center. 2006. Available online: www.pcic.merage.uci.edu (accessed on 17 February 2015).
- Munksgaard, J.; Pedersen, K.A. CO2 accounts for open economies: Producer or consumer responsibility. Energy Policy 2001, 29, 327–334. [Google Scholar] [CrossRef]
- Peters, G.P.; Hertwich, E.G. Post-Kyoto greenhouse gas inventories: Production versus consumption. Clim. Chang. 2008, 86, 51–66. [Google Scholar] [CrossRef]
- He, S.; Wang, Z. Optimisation of an Enterprise’s Production Technology Upgrade Strategy under a Carbon Tax: Pay the Tax or an Upgrade Fee? Energy Procedia 2017, 105, 3984–3989. [Google Scholar] [CrossRef]
- Yamazaki, A. Jobs and climate policy: Evidence from British Columbia’s revenue-neutral, carbon tax. J. Environ. Econ. Manag. 2017, 83, 197–216. [Google Scholar] [CrossRef]
- Böhringer, C.; Schneider, J.; Asaneotoo, E. Trade in Carbon and the Effectiveness of Carbon Tariffs; Social Science Electronic Publishing: Rochester, NY, USA, 2016. [Google Scholar]
Figure 1.
Computer production growth between 1995 and 2013 [13].
Figure 1.
Computer production growth between 1995 and 2013 [13].

Figure 2.
Trends of balance of embodied GHG emissions in global traded computers over the period 2002–2013 for China and its major trade partners. (a) Portable computer products; (b) other computer products (see the Appendix B).
Figure 2.
Trends of balance of embodied GHG emissions in global traded computers over the period 2002–2013 for China and its major trade partners. (a) Portable computer products; (b) other computer products (see the Appendix B).

Figure 3.
Emissions embodied in imports and exports of computers between China and its major trade partners in 2002 and 2013.
Figure 3.
Emissions embodied in imports and exports of computers between China and its major trade partners in 2002 and 2013.

Figure 4.
Top 5 largest interregional flows of emissions (Mt of CO2-eq) embodied in trade of computers (aggregated to portable computers and other computers) in 2002 (a) and 2013 (b).
Figure 4.
Top 5 largest interregional flows of emissions (Mt of CO2-eq) embodied in trade of computers (aggregated to portable computers and other computers) in 2002 (a) and 2013 (b).

Figure 5.
GHG emissions intensity of computers domestically produced and imported for China and its major seven trade partners in 2013.
Figure 5.
GHG emissions intensity of computers domestically produced and imported for China and its major seven trade partners in 2013.

Figure 6.
Exports mass data for units of computers from China and its major trade partners.

Table 1.
Top 5 export manufacturing sectors in China [11].
Table 1.
Top 5 export manufacturing sectors in China [11].
| Manufacture Sectors | Export (Unit: 10,000 US$) | Rank |
|---|---|---|
| Computer manufacturing | 12,303,792 | 1 |
| Communications equipment manufacturing | 6,361,657 | 2 |
| Knitwear, woven goods and products manufacturing | 6,197,010 | 3 |
| Electronic component manufacturing | 5,358,005 | 4 |
| Textiles and garments, shoes, hats manufacturing | 4,960,963 | 5 |
This Input and Output (IO) table provides data for 135 sectors and more detailed information than other China IO tables with only 42 sectors.
Table 2.
Harmonized Commodity Description and Coding Systems (HS) code and classification of computer products.
Table 2.
Harmonized Commodity Description and Coding Systems (HS) code and classification of computer products.
| Classification | HS Code | Remark |
|---|---|---|
| Computers | 8471 | Automatic data processing (ADP) machines |
| Portable computer products | 847130 | Portable digital ADP, weight ≤10 kg, with at least a Central Processing Unit (CPU), a keyboard and a display |
| Other computer products | 847141 | Digital ADP machines with at least a CPU and an input and output unit in the same housing |
| 847149 | Digital ADP machines, presented in the form of systems |
HS code: The Harmonized System is an international nomenclature for the classification of products. It was introduced in 1988 and has been adopted by most of the countries worldwide. It allows participating countries to classify traded goods on a common basis for customs purposes. At the international level, the Harmonized System (HS) for classifying goods is a six-digit code system [24].
Table 3.
Greenhouse gas (GHG) emissions intensity (kg CO2-eq/kg) from 2002–2005 to 2009–2010.
| Period | 2002–2005 | 2009–2010 | ||
|---|---|---|---|---|
| Classification | products | GHG Emissions intensity (kg CO2-eq/kg) | products | GHG Emissions intensity (kg CO2-eq/kg) |
| Portable computer products | Average | 76 | Average | 40 |
| Laptop with dock 12” (ei) (2003) | 76 | Laptop 16” (2009) | 39 | |
| Netbook 10” (2009) | 47 | |||
| iPad (2009) | 33 | |||
| iPod touch (2009) | 38 | |||
| Kindle (2010) | 43 | |||
| Other computer products (desktop, server, Displays—LCD) | Average | 39 | Average | 25 |
| LCD monitor 17” (ei) (2004) | 58 | Desktop—tower (2010) | 15 | |
| Rack server (2005) | 25 | Desktop—small (2010) | 25 | |
| Switch (2003) | 43 | client (2009) | 26 | |
| Desktop (ei) (2002) | 29 | LCD monitor 21.5” (2009) | 33 | |
© 2018 by the authors. Licensee MDPI, Basel, Switzerland. This article is an open access article distributed under the terms and conditions of the Creative Commons Attribution (CC BY) license (http://creativecommons.org/licenses/by/4.0/).
Share and Cite
MDPI and ACS Style
Lee, L.-C.; Wang, Y.; Yan, Y.; Zuo, J. Greenhouse Gas Emissions Embodied in the Chinese International Trade of Computer Products. Sustainability 2018, 10, 1623. https://0-doi-org.brum.beds.ac.uk/10.3390/su10051623
AMA Style
Lee L-C, Wang Y, Yan Y, Zuo J. Greenhouse Gas Emissions Embodied in the Chinese International Trade of Computer Products. Sustainability. 2018; 10(5):1623. https://0-doi-org.brum.beds.ac.uk/10.3390/su10051623
Chicago/Turabian StyleLee, Lien-Chieh, Yuan Wang, Yuanyuan Yan, and Jian Zuo. 2018. "Greenhouse Gas Emissions Embodied in the Chinese International Trade of Computer Products" Sustainability 10, no. 5: 1623. https://0-doi-org.brum.beds.ac.uk/10.3390/su10051623
Note that from the first issue of 2016, this journal uses article numbers instead of page numbers. See further details here.