The Impact of Automation on Employment: Just the Usual Structural Change?


1
Institute of Economics, University of Hohenheim, 70599 Stuttgart, Germany
2
Faculty of Geosciences, University of Utrecht, 3500 Utrecht, The Netherlands
*
Author to whom correspondence should be addressed.
Sustainability 2018, 10(5), 1661; https://0-doi-org.brum.beds.ac.uk/10.3390/su10051661
Submission received: 2 March 2018
/
Revised: 30 April 2018
/
Accepted: 14 May 2018
/
Published: 21 May 2018
(This article belongs to the Special Issue The Impact of Technological Change on Employment, Skills and Earnings)
Abstract
:We study the projected impact of automation on employment in the forthcoming decade, both at the macro-level and in actual (types of) sectors. Hereto, we unite an evolutionary economic model of multisectoral structural change with labor economic theory. We thus get a comprehensive framework of how displacement of labor in sectors of application is compensated by intra- and intersectoral countervailing effects and notably mopped up by newly created, labor-intensive sectors. We use several reputable datasets with expert projections on employment in occupations affected by automation (and notably by the introduction of robotics and AI) to pinpoint which and how sectors and occupations face employment shifts. This reveals how potential job loss due to automation in “applying” sectors is counterbalanced by job creation in “making” sectors as well in complementary and quaternary, spillover sectors. Finally, we study several macro-level scenarios on employment and find that mankind is facing “the usual structural change” rather than the “end of work”. We provide recommendations on policy instruments that enhance the dynamic efficiency of structural change.
Keywords:
structural change; employment; labor; automation; automatability; occupation; robot; robotization; AI; computerization1. Introduction
Mankind is on the brink of the Fourth Industrial Revolution in which breakthrough technologies such as artificial intelligence, robotics, data science, quantum computing, internet-of-things, etc. will enable advanced applications such as social robots, autonomous vehicles, virtual assistants, 3D printing and desktop manufacturing, etc. (e.g., [1]). There is a debate among labor economists on the effects of the introduction of technology to increase productivity (or, economize on labor) in general, and of automation by means of robots and AI on employment in particular. On the one hand, there is literature arguing that the pace at which employment is destroyed by the introduction of productivity-enhancing technology may exceed the pace at which mankind is able to find new uses for those becoming unemployed [2]. Mankind may thus face mass unemployment and increasing income inequality, which calls for unemployment relief through income redistribution and unemployment benefits [3]. With regard to the effect of automation using robots and AI, there are articles in popular media, consulting reports [4,5], and scientific publications (e.g., [6,7,8]) of how introduction of AI, robots, and automation affects a large share of workers and may even create a future with structurally high levels of unemployment (or even the “end of work” [7]), stagnating median wages, and growing income inequality. With such consequences, further automation may well be economically and socially unsustainable in the long run.
On the other hand, there is a sizable body of scientific literature that argues that, although automation indeed will displace some workers, the technological change also creates demand for labor. While automation increases productivity and thereby causes unemployment, there are countervailing effects such as increasing product demand, local demand spillovers, increasing demand for new skills or even new jobs required for new products and services (e.g., [4,9,10,11,12,13,14,15,16,17,18]). Aptly phrased, Autor [12] states: “Automation does indeed substitute for labor—as it is typically intended to do. However, automation also complements labor, raises output in ways that lead to higher demand for labor, and interacts with adjustments in labor supply. […] [J]ournalists and even expert commentators tend to overstate the extent of machine substitution for human labor and ignore the strong complementarities between automation and labor that increase productivity, raise earnings, and augment demand for labor”. Historical analysis corroborates this perspective. In the past, industrial revolutions triggered structural transformations, which, after recovering from initial technological unemployment, have brought mankind merely frictional unemployment, and prosperity rather than poverty, and it remains to be seen whether it is different this time [19]. Thus, possibly, we are facing an economically and socially sustainable future with a high level of employment for a skilled workforce, in which the recent wave of automation is merely a period of transition with temporary technological unemployment.
In this paper, we start from the evolutionary economic notion on structural change that productivity-enhancing technology displaces labor in existing sectors yet the unemployed may be mopped up by newly created sectors [20,21,22]. We formulate a conceptual framework of different types of sectors and occupations with regard to the temporal effects of technological change. The research aim is threefold. Firstly, to present a multisectoral perspective on the impact of automation on employment and discuss the various countervailing forces for technological unemployment within and between sectors. We thus allow for a higher degree of specificity of narratives on the structural change driven by automation and place extant labor economic theories in a sectoral perspective. Secondly, we use the assessments of occupational experts of the Bureau of Labor Statistics (BLS) to specify which actual sectors (in the North-American Industry Classification, NAICS) and actual occupation groups (in the Standard Occupational Classification, SOC) face the technology-driven employment shifts. Moreover, we use different datasets to conduct a patchwork of analyses on changes in employment based on the countervailing effects specific to the types of sectors. Thirdly, to aggregate over changes in the sectoral composition of the economy and projected employment in the various sectors, we propose several macro-level scenarios on employment in a decade from now. We isolate the actual occupations and sectors that arguably feature in the “end of work” and “structural change, as usual” scenarios and look for indications that we are in either one of the two scenarios. As we also observe that the span of occupations that are partly or entirely automatable as well as the set of sectors thus affected are limited, the “end of work” scenario manifests itself in a limited part of the economy at best. Moreover, we also argue that the loss of jobs due to automation is compensated in various ways, so ultimately we expect to merely see structural change with (possibly) a temporary dip in employment. From the labor economic effects at work, we formulate several policy measures to increase the dynamic efficiency of structural change.
In a nutshell, the empirical analysis using the multisectoral framework finds developments at odds with the “end of work” claim. For one, our expert-based estimation of the automatability of jobs in the applying sectors is counterbalanced by an increase in employment in the sectors developing, producing and supplying technology (notably engineering, software, and scientific services). Moreover, there is substantial employment growth in quaternary sectors, personal/health care, luxury goods sectors, etc., arguably due to growth in disposable income in the “making” and complementary sectors, but even for “upskilled” occupations in the applying sectors. Aggregating over changes in the sectoral composition of the economy and projected employment in the various sectors, we find support for the claim that job loss in the applying sectors is limited and outweighed by the potential for job creation in directly related (new) sectors as well as in the spillover sectors.
The structure of this paper is as follows. In Section 2, we present our conceptual framework, including our multisectoral perspective on structural change. In Section 3, we discuss the data and the data-analytic methods used. In Section 4, we present the results of our analysis of empirical data on how (the developing capabilities of) robots and AI affect the work activities performed by humans. Moreover, we provide a brief analysis of automatability of occupations in the sector of application and present results on (structural shifts in) employment in certain technology-affected occupations in other discerned sectors. In Section 5, we evaluate our projections on how automation affects structural change in employment in the various sectors and associated groups of occupations. Finally, we propose and discuss three categories of policy instruments to prevent and overcome adverse effects of automation.
2. Conceptual Model
2.1. Technological Unemployment and Compensation
Automation has consequences for the organization of work, the type of jobs performed, skills required, and the tasks and working activities conducted. In general, automation (computerization, introduction of robots and AI) predominantly affects routinized work in stationary, predictable environments, typically found in the middle-skilled jobs [5,7,23], particularly whenever tasks merely concern executing rules rather than require cognitive processing of information [24]. However, automation and computerization by means of the introduction of robots, advanced software, and AI thus substitute for the routine and “rule-based” tasks, yet complement the non-routine and cognitive tasks (see, e.g., [25] on computerization). The non-routine and cognitive tasks typically are executed by high-skilled employees with high wages, while the routine tasks generally are conducted by medium-skilled employees with medium wages. Consequently, jobs that are low-skilled, but are composed of non-routinized tasks in a dynamic and unpredictable environment cannot yet be robotized or computerized. Jobs which require refined perception and physical dexterity, creative intelligence/improvisation, or social intelligence, regardless of whether they are low-skilled, are less at risk of replacement (cf. [6,8,26]). Although tasks using tacit knowledge or knowledge which is hard to codify cannot be automated (cf. [27]), if there is a sufficiently large amount of data, cognitive, knowledge-based tasks can also be taken over by AI [7] and are, as such, subject to progressive automation and substitution as well (cf. [4,28]). Thus, technological substitution of jobs does not necessarily displace low-skilled work, but rather routinized work [23]. As routinized work is often executed by medium-skilled workers, this substitution effectively “polarizes” [25,29,30] or “hollows out’ [31] the labor force, with fiercer competition and thereby wage stagnation, particular for middle and lower skilled work.
While the introduction of productivity-enhancing technology displaces activities conducted by humans and thereby causes technological unemployment, there are various countervailing forces actually creating new activities, functions, and jobs and thus compensating for that unemployment [9,10,11,16,17,18]. Firstly, the introduction of productivity-enhancing technology causes a decline in costs of the automated tasks. This may have firms lower their prices and thereby increase demand. This brings about an increase in demand for labor (also) in non-automated tasks. Secondly, the exploitation of the introduced technology may require complementary tasks (e.g., controlling, programming, and maintenance), which may form new occupations or new activities for existing occupations (cf. [32,33]). These complementary tasks may increase the demand for higher skilled employees with higher wages. Thirdly, cost savings and additional profit may well be reinvested, deepen automation, and give rise to new products and services, and thereby new jobs. Fourthly, there are local demand spillovers, such as demand for doctors, hair stylists, and waiters [13,15,34]. There is a fifth countervailing force, namely the creation of new tasks, functions and activities in which “labor has a comparative advantage relative to machines”. This causes the creation of new jobs that “reinstate” the displaced labor. Acemoglu & Restrepo [11] argued that particularly this last effect is required for a “balanced growth path”.
2.2. Multisectoral Perspective
Arguably, the labor economic process described above is driven by entrepreneurial behavior in a process of creative destruction (cf. [35]) and brings about structural change; central in the literature on structural change is the shift of demand for labor in one to other sectors (e.g., [36,37,38]). Innovation and entrepreneurial activities give rise to new products and services, which in turn may give rise to new sectors in which jobs are created. As such, over time, the sectoral composition of an economy becomes more varied and output differentiation increases (cf. [20,21,22]). Here, we propose a multisectoral perspective akin to the structural change literature as a template to study the effects of automation. We discern two dimensions: (i) the type of sector affected directly or indirectly by automation (notably: (1) sectors in which the technology is applied; (2) producing, developing, supplying and supporting (“making” sectors); (3) complementary sectors (e.g., facilitating or inhibiting exploitation of the focal technology); and (4) quaternary sectors receiving spillover); and (ii) characteristics of occupations subject to technological change (notably whether these occupations face substitution, transform to reap complementarities, or come into existence creating and reaping new technological opportunities). With the introduction of these additional dimensions, we enable providing an overview of which specific sectors and occupations are actually affected and allow further disentanglement of displacement and countervailing effects of automation.
We now revisit the labor economic framework provided in Section 2.1 with the multisectoral perspective as focal lens. Firstly, the introduction of productivity-enhancing technology is found to lower the net employment in the focal sector of application (cf. [39]). However, even in the existing sectors of application, there are “intrasectoral transformations” in the forms of new, complementary tasks or even jobs created to support the use of new technology. Moreover, the negative effects of substitution might be (and actually are) compensated by increasing demand whenever products and services become more advanced (and more diverse, possibly customized) or whenever the unit costs drop. Indeed, robots and AI may well substitute and complement employment within the same sector of application at the same time [23,25,32]. Secondly, with increasing automation in the sectors of application, there is an increase in demand for technological products (robots and AI) not only in the developing and producing sectors, but also in the upstream supplying and supporting sectors, which create new jobs as well [15,16,18,40,41]. Thirdly, there are jobs created in complementary sectors facilitating and inhibiting the (efficient) implementation of the focal technology (e.g., training and education), the exploitation of business opportunities (e.g., consultancy), etc. Fourthly, there is local demand spillover as disposable income is spent on discretionary goods (e.g., leisure and traveling, entertainment and culture, sports and lifestyle, etc., but also health care) and thus may increase employment in quaternary sectors [15]. The loss of jobs within a particular sector due to automation is offset by the increase in product demand and positive spillovers to other sectors [13,15,34]. The change in total disposable income and/or hours worked is expected to correlate with the change in demand of discretionary goods. Finally, there is a sixth type of sector, which we exclude from further analysis, namely unrelated sectors, which attract employees that got displaced in the sector of application and decide to do something completely different.
Competition drives down profit margins and forces firms in existing sectors to: (i) introduce productivity-enhancing technology which displaces labor with capital; and, ultimately, (ii) look for new products and services, business models, etc., to reap “monopolistic rent” [35]. As such, there is endogenous creation of new products and services which may give rise to (labor-intensive) new sectors that mop up the technologically unemployed (cf. [20,21,22]). This is in line with the labor economic notion that the creation of new products, services, functions, and activities thus reinstates displaced labor and is argued to be essential for sustained growth (cf. [11]). These new sectors generally develop or put to new use the focal technologies, or support, supply or complement (the use of) these technologies. In the long run, we expect a cascading creation of sectors developing and producing new technologies and creation of new sectors applying the developed technology, with labor mobility within and across these sectors. In addition to this, there are education and training sectors which facilitate this structural change and mobility within and across sectors.
In addition to the “type of sector” dimension, we introduce a classification of changes in occupations due to automation. We discern three classes of occupations. The first class are existing occupations that are directly affected by technological substitution of (part of) the tasks. This class also contains occupations that are indirectly affected by changing demand or disposable income of customers. This holds for occupations in the sectors developing and producing the focal technology or supplying products or services to robot or software builders. However, this also holds for occupations in sectors that are facilitating or inhibiting these changes, e.g., people need to be trained and educated in the new rather than old technology. Note that the net effect of technological change is not immediately obvious: while jobs in the new technology are created (e.g., trainers, consultants), jobs related to old technology may be lost. Moreover, technological change also affects the disposable income, which has ramifications for spillover into the quaternary sectors.
The second class contains: (i) occupations in which, primarily, task content is adjusted to exploit new technology; and (ii) occupations that transform substantially by introducing complementary tasks to exploit the focal technology (e.g., maintaining or programming a robot). The latter may well require a skill upgrade. Arguably, it may be that the job title stays the same but new technology is used to change the input manageable, the processes available, or the output possible, and thereby the activities required.
The third class contains emerging occupations that reap opportunities to provide innovative products or services using the focal technology, or extending and recombining technology. A substantial amount of employment growth takes place in jobs with new job titles [9].
Figure 1 sums up the changes in employment expected by type of sector (columns) and the type of change in occupations (rows) due to the introduction of focal technology. Although the sector of application and existing occupations face substitution and hence job destruction, the employment in all the other sectors is either growing directly due to or affected (in)directly by the emergence of the new technology.
2.3. Macro-Economic Scenarios on Employment
With regard to the development of employment due to automation, e.g., the introduction of robotics and AI, we have to aggregate the development of the employment in the economy as a whole, across all sectors. In general, routine-replacing technical change does reduce employment (for the middle-skilled in particular), yet this is more than compensated for by increases in product demand and spillovers [15]. However, the creation of new products, functions, and activities (cf. [13]) and (thereby) creation of new sectors [20,21,22] may be required for a sustained and balanced growth path. It is too early for empirical studies on the recent generations of robots and software solutions, but there are a few empirical studies on the effects of robotics on aggregate employment in the past. Graetz & Michaels [14] found that the introduction of (industrial) robots in several OECD countries over the years 1993–2007 did not significantly reduce number of hours worked, and, similarly, Dauth et al. [42] found no significant effect on net employment in Germany. Acemoglu & Restrepo [10] found industrial robots to reduce employment and wages in the United States of America over the years 1990–2007 but this is rather marginal.
From the multisectoral perspective, we know that there are two mechanism required for sustained high levels of employment: (i) labor mobility within and across sectors and possibly upskilling of labor; and (ii) creation of new products, services, etc., ultimately culminating in new sectors requiring new skills. As such, there effectively is a race between technological development with demand for particular skills and education providing people with those necessary skills (cf. [43]). With regard to the outcome of this race, we discern three scenarios (see Figure 2).
Firstly, there is the “end of work” scenario (e.g., [7]). In this case, robotics and AI will become so advanced that any job, including those created in new sectors, are soon taken over by technology again. We will end up in this scenario if the rate at which humans can be reeducated and retrained for employment is lower than the rate of technological advancement (cf. [6]). Moreover, it requires that the job destroying potential of technology through substitution outpaces the job creating potential of technology through complementarities (cf. [44]).
Secondly, in the “structurally lower” scenario, some jobs are destroyed by technology definitively, but (a proportional part of the) displaced employees can be reeducated to find jobs in other and possibly newly created sectors. One argument in favor of this scenario is that technological advances in new sectors stifle if education cannot foresee the necessary skilled workers. As such, education in fact moderates the pace of technological progress. Note that the “structurally lower” levels of employment may also be because the number of hours worked per week may further decline.
Thirdly, in the “rebound” scenario, after a shock due to the introduction of labor-substituting technology, the level of unemployment returns to a “regular” rate of frictional unemployment (cf. [45,46]). The rebound is driven by the countervailing effects described in Section 2.1 within the sector of application or within the value chain of producing and supplying sectors as well as through the creation of new sectors. Note that a structural transformation with the rise of (employment in) quaternary sectors also contributes to a rebound. Similar to the “structurally lower” scenario, education moderates the pace of technological progress, but employees can catch up faster than technology can progress.
3. Methods and Data
3.1. Overview
From an evolutionary economic perspective, making projections on technological developments in the future and the structural shifts in employment across the various sectors of an economy is fraught with uncertainty. Making projections is further complicated because robots, AI, and other technologies used in automation are general purpose technologies, which have a pervasive effect on a wide range of sectors and with multifaceted and (possibly) different effects within each. The impact thereof is difficult to assess because it: (i) may have opportunities revealed only ex post and advance in directions that were unforeseen ex ante, possibly spawning new sectors; (ii) require complementary investments and activities of which the economic impacts can be reaped and observed substantially later; and (iii) gradually diffuse over a range of sectors (see e.g., [47,48]).
In Section 2, we presented a conceptual model with a classification of sectors, whereby each type of sector (and its associated occupations) is affected differently by the technologies introduced in the ongoing wave of automation. Our analysis is to reveal which (groups of) occupations are associated with particular sectors and how these evolve. Generally, each type of sector requires a different approach and different data. After all, the displacement and several countervailing effects only occur in the sectors of application. Moreover, the various types of sectors compensate for the displacement of labor in the sectors of application differently. In our analysis, we focus on the types of sectors with undetermined effects (see Figure 1) and use projections on employment for groups of occupations affected by (pending) technological change. Moreover, we are interested in detecting structural change in how demand for labor is lost in the sectors of application yet compensated for within the same or other sectors, and particularly which sectors concretely. Lacking detailed data on changes in employment in quaternary sectors due to automation, we use a long term trend in disposable income as indicator of labor demand. Moreover, occupational classifications such the SOC are conservative in adopting new occupations (job titles), such that we have to revert to using the Atlas database to get insight in groups of occupations (about) to emerge. Our analysis thus consists of a patchwork of several smaller studies.
3.2. Selection and Classification of Occupations by Type of Sector and Type of Technology-Driven Occupational Change
To be able to assess the (change in) employment in various sectors particularly with regard to technology-driven changes in occupations, we used the Bureau of Labor Statistics’ (BLS) Occupational Outlook data. The BLS is an independent national agency within the Department of Labor and provides statistical data to the public, governmental bodies, business, etc. that is relevant to current social and economic issues, and accurate, impartial, and of high statistical quality. The BLS has made labor force projections since the late 1950s and, since 1968, these projections and underlying methods are retrospectively evaluated and adjusted.
We used the BLS Occupational Outlook Handbook (OOH) to selected occupations affected significantly by automation for which also employment projections (over the year 2016–2026) are available. The Occupational Utilization dataset (“Table 501”) in the Employment Projections of the BLS reports the factors driving changes in employment. These factors are grouped in “productivity change”, “demand change”, “sourcing change”, “occupational substitution”, and “capital/labor substitution”, but each occupation also contains a short description of occupation specific developments. From this Occupational Utilization set, we filtered occupations on keywords associated with automation, robotization, and computerization technologies (notably automa*, data, programm*, internet, robot*, comput*, technolog*, artificial intelligence, and machine learning) occur in the factor descriptions. This yielded a list of 85 occupations. On top of that, we inspected the OOH group descriptions to select occupations also affected by the focal technologies (but omitted, supposedly because of relatively strong impact of other factors), which yielded another 29 occupations.
Next, for each of the occupations on this composite list, we extracted the Industry–occupation matrix data for each of Employment Projections entries. This allows the construction of employment projections for each of the occupations by North-American Industry Classification System (NAICS) sectors (on Level 2 and Level 3). This is used to directly relate shifts in employment by occupation to changes in employment in various sectors. Moreover, using the job activity and job outlook descriptions (and notably the expected changes in these occupations), the occupations on our composite list are classified into type of sector and type of technology-driven change in occupation to fill Figure 1. In the classification of occupations in the type of sector, we used the absolute numbers of jobs reported in the industry–occupation matrices. Whenever an occupation occurred in several types of sectors, we classified it into the type of sector with the highest number of jobs (whenever strongly asymmetric) or—in our subjective view—strongest effect of technological change. Moreover, we have used the automatability scores (see the next subsection) of occupations to classify occupations to the type of technology-driven change to the occupation. The automatability scores are suitable for that because highly automatable occupations are: (i) found in sectors in which the technology is applied; and (ii) feature a substantial number of activities which can be substituted so are “old” occupations.
Note that the OOH contains existing occupations. For occupations which are supposedly emerging, we turn to the Atlas of Emerging Jobs database in which occupational experts have provided descriptions of jobs they expect to see created before 2030. For examples of emerging occupations (in Atlas terms: professions), we filter the 186 occupations mentioned in the Professions Catalog on the “automatization” trend, merged with occupations which require the “programming/robotics/artificial intelligence” skill. We then select those occupations existing already before 2020. This yields 69 occupation titles. We manually assign these to a particular sector based on the occupation description.
The description and analysis of the data thus obtained are contained in Section 4.3.
3.3. Scoring Occupation Automatability
The automatability assessments found in the literature generally use expert evaluation of the probability that tasks or underlying capabilities can and will be automated. Frey & Osborne [8] looked at a selection of the O-Net occupations and assess the extent to which the main task (singular) in a given occupation has a higher than 70% chance of being automated in the forthcoming 10–20 years, which is nearly fifty percent of the jobs. After using a crosswalk table to recode the Standard Classification Code (SOC) used in [8] into the International Standard Classification of Occupations (ISCO), Brzeski & Burk [49] assessed the labor market in Germany and found that about 60% of jobs are at risk of being automated. Following the same approach, Bonin, Gregory & Zierahn [50] found that, when following the approach of Frey & Osborne [8], the number of jobs in Germany with high automatability is about 40%. Arntz et al. [51] pointed out that focusing on occupations rather than the actual task content of jobs (which may vary from workplace to workplace) overestimates the automatability.
Manyika et al. [52] specified for about 800 occupations, firstly, the activities (out of more than 2000) involved and, secondly, the capabilities (out of 18, divided into “input accepted”, “information processing”, “output delivered” and “physical movement”) required for each activity based on the way humans perform them. A score the automatability of the capabilities thus translates into the automatability of the occupations. They found that only few jobs can be automated completely, but also that, for about 60% of occupations, at least one third of the activities can be automated.
Here, we assess the automatability of occupations by looking at the automatability of the underlying work activities as specified in the O-Net 22.2 database. In this database, there are four classes of work activities distinguished: (i) information input (where and how are data obtained required to perform this job?); (ii) interacting with others (what interactions with other persons or supervisory activities occur while performing this job?); (iii) mental processes (what processing, planning, problem-solving, decision-making, and innovating activities are performed with job-relevant information?); and (iv) work output (what physical activities are performed, what equipment and vehicles are operated/controlled, and what complex/technical activities are accomplished as job outputs?).
Firstly, we selected all 966 occupations in the O*Net database for which work activities have been assessed by occupational experts. Secondly, we used the O*Net-SOC crosswalk table to match the (somewhat more refined) O*Net occupational classification with the standard occupational classification (SOC) used in the BLS Occupational Outlook Handbook (OOH) dataset. We thus ended up with 702 occupations with standard occupation coding for which we have the Employment Projections over the period 2016–2026 as contained in the BLS OOH. Thirdly, we construct an expert assessment (with input from roboticists in our research consortium) of the automatability of each of these work activities by asking whether it is highly likely, possibly, or highly unlikely that a particular activity can be automated in the forthcoming 10 years. We hereby divide the work activity in three levels in which a work activity can physically or mentally challenging. Typically, very challenging activities cannot (yet) be performed by robots or AI. Based on the likelihood that a particular task for a work activity is expected to be automatable in the next decade, we assign an “automatability score”: already or highly likely to be automated (score of 1), not likely/not unlikely (orange, score of 0.5), and highly unlikely (red, score of 0). The results are found in Figure A5 in Appendix D. We thus get, for each work activity , an “activity automatability” score . This activity automatability is a function of the “level” at which an activity as classified for the occupation review is complex/involved and/or an intellectual or physical challenge. Fourthly, we used the O*Net expert assessment for each occupation of both the “level” (e.g., how intellectually/physically challenging is the activity?) and “importance” (e.g., how often does the activity occur relative to other activities, or to what extent is this activity central to the occupation?) to compute the “occupation automatability” for occupation n out of the weighed sum of “activity automatability” scores:
Occasionally, set J is not complete because O-Net experts suggest: (i) suppressing the activity for a particular occupation because of lack of assessments (of sufficient quality); or (ii) excluding the term from computation because the activity has extremely low importance or level value.
To be able to compare our findings with results in other studies, we corrected for the fact that the activity automatability score by level is of our choosing by normalizing the automatability:
Fifthly, we constructed a weighed score for each major group N of occupations, and the weighed automatability is computed as:
where is the BLS Employment Projection 2016 estimate of actual, current number of jobs in occupation n.
4. Results
4.1. Technology-Driven Structural Change in Employment in NAICS Sectors
The BLS data enable us to study the projected structural change of employment across actual sectors and to infer on the different countervailing effects at work in the various types of sectors. Following the method described in Section 3.2, we obtained Employment Projections for all occupations affected by the focal technologies and broken down by NAICS sector. In Figure A3 in Appendix B, we report the employment increase for these filtered occupations by major SOC group, for each of the affected sectors. A first observation is that the number of sectors as well as the number of jobs directly affected is limited. In the last two columns on the right, the projections in total number and percentage of increase in number of jobs are reported for all occupations per major group, not just the filtered occupations. A closer look at the projected shifts in employment within the same sector (vertically) and across sectors (horizontally) are in line with displacement and various countervailing effects and fully captured within our multisectoral framework of structural change.
Overall, there is a relatively small job loss (−75.3 k, about 0.0%) in occupations affected by the focal technologies, but a loss is in itself already in stark contrast with the high number of jobs expected to be created in the economy as a whole (11,519 k, about 7.4%). When looking at the projected growth in the number of jobs by major group of occupations, we see that there is almost exclusively a decline in the number jobs in Production (SOC 51) and Office and Administrative Support (SOC 43) occupations. In Production, this is almost all due to a decrease in the Manufacturing sector (NAICS 31–33). Note that the job loss overall (−406.9 k, −4.3%) is much lower than the job loss in occupations affected by technology (−681.9 k people, −13.4%), underlining the effect of technological unemployment. In Office and Administrative Support occupations, the story is quite different: the number of administrative jobs in a wide range of sectors such as Manufacturing (NAICS 31–33), Government (NAICS 90), Education (NAICS 61), Wholesale trade (NAICS 42), Information (NAICS 51), and several others is declining, while the number of administrative jobs in Health Care (NAICS 62), Management support and services (NAICS 56), and Retail trade (NAICS 44–45) is increasing. Detailed analysis reveals that any (partially technology-driven) decrease affects mostly secretaries and office clerks across the aforementioned sectors, while the increase is due to job creation in service representatives, information and stock clerks. That said, the rate of increase in administrative jobs in the economy as a whole (0.6%) is relatively low compared to the total rate of job creation (7.4%), which may well be (partially) caused by a technology-driven productivity increase.
There also are several occupations in which there is a strong increase in the number of jobs, notably Computer and Mathematical (SOC 15), Management (SOC 11), and Architecture and Engineering (SOC 17) occupations. While the biggest increase occurs in the Professional, scientific, and technical services (NAICS 54) overall, there may be a shift of employment across occupations within this sector as well as in the Information (NAICS 51), and Finance and Insurance (NAICS 52) sectors. In these sectors, a technology-driven loss of jobs in Administrative jobs (SOC 43) seem to be offset by a gain of jobs in Computer and Mathematics related jobs (SOC 15), possibly created to reap complementarities (or where people may be hired to automate processes and thus cause technological unemployment). For example, in the Information sector (in which data is created, processed, and transferred), there is a loss of 43.5 k administrative jobs but an increase of Computer and Mathematical jobs.
When looking at the projected growth in the number of jobs by sector, the change is much in line with “classical” effects of automation, demographic developments and progressive outsourcing. There is a particularly strong employment growth in the Professional, scientific and technical services (NAICS 54 with about 331.8 k people), of which the Occupational Utilization reveals that there is an increasing demand for engineers, e.g., due to robotization and automation (SOC 17), but also the use of advanced digital and internet-connected devices, and outsourcing of security (SOC 15). Moreover, we observe a decrease in Office and Administrative Support (SOC 43) due to automation and an increase in Business Operations and Management (SOC 13, 11) due to outsourcing and purchasing training and consulting services. Health care (NAICS 62, 251.5 k) sees a rise on several occupations due to the aging population and several organizational changes such as the introduction of reception services and team-based structures to cope with that. The Administrative and management services (NAICS 56, 105 k people) sector sees an increase in employment, e.g., for customer representatives, as there is more outsourcing in other sectors. Moreover, there is substantial job loss in the Manufacturing sectors (NAICS 31–33, −751.1 k people), notably due to substitution, but also offshoring. Obviously, the job loss due to substitution is not (entirely) offset by intra-sectoral complementary jobs. It may, however, be (partially) compensated by the development of software, robot and AI as well as the production and servicing thereof, which reflects in the statistics for other sectors described before.
Illustratively, of the thirty fastest growing occupations reported in the BLS Employment Projections (see Figure A4 in Appendix C), a total of seventeen occupations are directly or indirectly related to healthcare, either as healthcare practitioner (SOC 29) or support (SOC 31), personal care (SOC 39) or by providing training for healthcare (SOC 25). This, again is to be attributed to demographics and aging, but arguably also local demand spillover, which is related to disposable income. Five occupations pertain to computers and mathematics (SOC 15). Of the thirty fastest declining occupations reported, sixteen are Production-related occupations (SOC 51) such as operators, assemblers, setters, etc., and six Office and administrative occupations (SOC 43) such as computer and telephone operators, typists, data keyers, etc. In addition, in our subset of occupations (that are affected by the focal technologies), we see a confirmation of the trend that there is a decline in low- and medium-skilled jobs (such as assemblers) and growth in high-skill, high-productivity jobs (such as software engineers) (see e.g., [6]). Surprisingly, there is an increase in medium- to low-skilled jobs for occupations such as stock clerks and order fillers, receptionists and information clerks, which appear to be automatable. Supposedly, this is, on the one hand, due to a demand-side increase and, on the other hand: (i) a low acceptance for digital services in occupations in which human contact is appreciated; (ii) yet relatively poor performance of automated services (so limited substitutability); and (iii) lowering of unit costs actually compensating automation with higher demand.
Conclusively, the occupational outlook data features structural change in line with displacement and countervailing effects discussed above, but also reveals that several countervailing effects and other factors (demographics and offshoring) may be counteracting.
4.2. Automatability of Occupations
For a socially and economically sustainable growth path, the labor displacement in the sectors of application must be counterbalanced by job creation within the same and other sectors. Following our approach described in Section 3.3, we construct a comprehensive data set and compute automatability scores for major occupation groups as in formula in Equation (3). As the actual values of the automatability rely on the activity automatability score values, the absolute values have no particular meaning and are not reported. However, the relative values of course indicate relative automatability. Arguably, not only the automatability, but also the absolute number of jobs determine the actual probability that particular occupations face automation. As such, we plot the automatability against the number of jobs in Figure 3.
Figure 4 plots the number of jobs for occupations for which the normalized automatability exceeds the threshold x on the X-axis. Only 25.5% of jobs have a normalized automatability score of (interpreted as that half of the activities of an occupation can be fully automated within 10 years). Moreover, only a relatively low percentage of 4.65% of jobs has a normalized automatability score of or higher. Thus, in contrast to the figures reported in [8,49,50], we find that very few jobs are highly automatable. This is largely in line with findings in [40]. Moreover, Manyika et al. [52] (see p. 5), found that, for about 60% of occupations at least one third of the activities can be automated. We find something related: just below 60% of jobs (so not occupations) has a normalized automatability of one-third or more. Thus, for roughly 60% of the jobs, roughly one third or more of all activities can be automated.
Using a straightforward translation of the automatability of work activities into automatability of the occupation, we find that the high level of automatability reported in [8,49,50] may well be overestimated, and actually have a much lower level such as those reported in [40,50,52]. In addition, neglecting the variability of tasks between workplaces also causes overestimation of automatability [51]. Thus, we have added another estimation method to the toolkit of researchers using the O*Net database (see e.g., [8,40]), although further refinement may well be needed.
4.3. Classification of Occupations on Type of Sector and Type of Technology-Driven Change
In Section 2, Figure 1 contains the changes in occupations subject to automation (and notably conceptions of the use of robotics and advanced software such as AI) on the one dimension and various types of sectors affected on the other dimension. As described in Section 3, we have filtered the occupations in the BLS Occupational Outlook Handbook on keywords related to our focal technology. Using the job activity and job outlook descriptions (and notably the expected changes in these occupations), the occupations are manually classified in Figure 1. In the classification of occupations, we have used the automatability scores of occupations as a crosscheck, because highly automatable occupations are: (i) found in sectors in which the technology is applied; and (ii) feature a substantial number of activities which can be substituted so are “old” occupations with routinized, readily standardized tasks. Note that the OOH contains existing occupations. For occupations which are supposedly emerging, we filtered occupations from the Atlas database (following the method described in Section 3). These occupations are subsequently also manually classified, see Figure A6 (Appendix E). Figure 5 contains descriptive names for aggregated groups of occupations (which are our own labels, not the SOC major or minor groups) found in Figure A6. The color shading indicates whether employment in the occupations in particular sectors is assessed to be decreasing (applying sectors with existing occupations, these are subject to substitution), balancing different counteracting developments (e.g., complementary and spillover sectors), or increasing (e.g., producing and developing sectors). We now discuss the employment for each type of sector and type of technology-driven change in occupations in detail.
As expected, we see that occupations that have been classified as “substituted for” in the “applying sectors” typically are in Office and Administrative Support (SOC 43), Transportation and Material Moving (SOC 53), and Production (SOC 51) major groups which are classified as highly automatable (for a quick reference, see Figure 3, for a detailed analysis, see Appendix D). That said, particular occupations that are economically attractive to be automated (because of both a high automatability and high number of jobs involved) according to Figure 3 do not yet show up in the OOH assessments and hence are less affected by our focal technology (i.e., automated) than expected so far. This definitely holds for Construction and extraction (SOC 47); Building and ground cleaning and maintenance (SOC 37); Installation, Maintenance and Repair (SOC 49); and Farming, fishery, and forestry (SOC 45), as well as for Food preparation and serving (SOC 35) and Sales (SOC 41). However, note that, with regard to the occupations that are at risk of being automated, our findings are largely in line with those in [8,52]. These authors also expected Production, Construction and Extraction, Transportation and Material Moving, Office and Administrative Support, but also Sales and Maintenance and Service to be subject to computerization and robotization (see, e.g., [8], p. 37). Manyika et al. [52] found high automatability for the industrial sectors such as Transporting and Warehousing, Manufacturing, but also for those sectors with yet limited automation, such as Accommodation and Food Services, Agriculture, and Retail and Wholesale Trade. Note that our automatability scores and those in the aforementioned studies are based on expert evaluation of whether robots and AI can or cannot perform particular activities within ten years. If the automation does not materialize in the forthcoming decade, we may have to attribute this discrepancy to a technologically optimistic expert classification of what robots and software can actually do (cf. [40]).
For occupations in the “making” sectors (producing and developing as well as supplying and supporting), it is not possible to determine how much growth in employment is to be attributed to automation, because of compounding of factors that affect employment (e.g., demographics, outsourcing and offshoring, technological change, and demand dynamics). As such, any figures from the BLS Employment Projections are to be interpreted prudently. As described in the Methodology Section, we made a selection of BLS SOC occupations by filtering on technology-related keywords in the factor descriptions reported in the Occupational Utilization dataset in the Employment Projections. In the descriptions of factors determining utilization, there is an increase reported for occupations headed under Computer and Mathematical Occupations (SOC 15) due to the introduction of software into devices and the use of and need to analyze more data, but also a loss due to cloud computing and offshoring as well as under Architecture and Engineering Occupations (SOC 17) due to the automation of production to cut labor costs. Looking at the OOH figures for the change in employment 2016–2026 for these filtered occupations, employment in the “making” sectors (SOC 15, 17) increases with 371.1 k jobs, while employment in the applying sectors (SOC 43, 45, 51, and 53) decreases with 464.9 k jobs. If we include the manually selected occupations related to computers (SOC 15–11xx), engineering (SOC 17–302x), and management thereof (SOC 11–30xx) in the figure for the “making” sectors, the earlier figure changes to an increase with 659.2 k jobs. Given that the effect of the introduction of robotics and AI (taking only these “applying” and “making” types of sectors) changes from a net loss to a net gain, a detailed analysis is required for further conclusions.
Thus, already in the descriptions of factors causing an increase in projected employment for existing occupations, there is mention of data collection and analysis as well as development and implementation of advanced information as well as production and logistics systems. However, for emerging occupations, projections for employment are fraught with uncertainty. The jobs that are typically reported to be created in the nearby future are in the IT sector (e.g., in Big Data, AI, IoT, sensor technology, and general software engineering) and industrial sectors (e.g., in the automotive and robotics sector, advanced transportation and warehousing, and 3D printing) (cf. [53]). The Atlas database refers to more specific occupations, typically concerned with developing, producing, or applying robots, information systems, software, etc. to specific sectors (e.g., agriculture, health care, construction). In addition, consulting companies gradually start to distinguish robots (e.g., industrial versus service robots) and AI software (e.g., vision or language processing, planning, expert systems and knowledge management) on the basis of (field of) application. This underlines the progressive diversification and institutionalization central to the structural change literature.
4.4. Spillover and Disposable Income
In our multisectoral perspective, an important countervailing effect is local demand spillover [13,15,34], which is closely related to disposable income. Arguably, people spend their disposable income (to a certain extent) in what we consider the quaternary sectors, i.e., leisure and traveling; arts, theater and culture; sports and lifestyle; books and magazines; entertainment sectors making music, series, film and computer games; gambling; etc. As such, the employment in these “spillover” sectors evolves with the total disposable income made in the sectors in which our focal technologies are applied, developed and produced, supplied and supported as well as in the complementary sectors (e.g., education, legal support, and business consulting). Taking the BLS occupation group SOC 27 as an indicator of the employment in the quaternary spillover sectors, we see that the BLS OOH reports an estimated growth of 2158.5 k to 2276.2 k jobs over the years 2016–2026, which, with a growth rate of 5.5% over 10 years, actually has a lower than the estimated average growth rate of the employment in the economy as a whole, which is 7.3%. Arguably, we are considerably underestimating the spillover effect, because people also spend their disposable income on personal and health care service, both more luxurious consumable and durable goods, etc., all accounted for in figures of other sectors. If we consider health and personal care also a spillover category and account for change in the occupation groups SOC 29, 31, and 39, the rate of growth over the years 2016–2026 is a much higher 17.3%, outweighing the average employment growth rate.
Table 1 reports the development of the (projected) disposable income over the years 1996–2026. Note that the disposable income increased even during the financial crisis. Moreover, we observe that the increase in employment in the spillover sectors is lower than the increase in disposable income. As argued, part of the income may be spent on more luxurious consumables and durable goods (or saved, possibly effectively deferring consumption to the future). That said, with a continued growth in disposable income, we also expected an increase in employment in the quaternary sector. The development of disposable income for occupations differs for the various types of sectors. In a nutshell, we expect that, in the sector of application, there is pressure on the wages (and thereby disposable income) in occupations facing substitution, but not if tasks are added that require upskilling. Similarly, disposable income in facilitating and inhibiting sectors is expected to decrease (increase) for occupations related to old (new) technology. Finally, the wages and thereby disposable incomes in the “making” sectors are expected to increase.
4.5. Macro-Level Development of Employment: A Structural Rebound?
In Section 2.3, we report three basic scenarios on the macro-economic development of employment. Empirical evidence in [45,46] indicates that a short-run dip in employment is followed by a bounce back to “regular” levels of (frictional) unemployment. This is corroborated by the long run employment levels, see for instance the levels reported for the UK by the Bank of England in Appendix A. Empirical evidence shows that the unemployment rate, although fluctuating, remains fairly stationary for a century and a half, effectively absorbing major sectoral shifts, a rapid increase of women’s and migrant workers” participation on the labor market (see Figure A1). That said, at the same time, the hours worked annually decreased substantially in OECD countries (see Figure A2), effectively countering an increasing in unemployment otherwise observed (see Appendix A). A critical remark is, hence, that the atomistic view on single jobs as employment measure is somewhat misleading; there may be covert technological unemployment. Note that the drop in the number of working hours reduces disposable income, yet frees up time to spend that disposable income, e.g., on products and services provided by quaternary sectors.
Our preceding analysis reveals that the span of occupations that are partly or entirely automatable as well as the set of sectors thus affected by automation are limited. Consequently, the “end of work” scenario manifests itself in a limited part of the economy at best. We also argued that the loss of jobs due to automation is compensated in various ways. We found that an increase in employment in the “making” as well as “applying” sectors is projected, which includes new occupations related to data, advanced information and production systems, advanced applications of software, etc. The rapid rates of growth of jobs in these occupations may well be able to compensate for the destroyed jobs in “old” occupations (particularly those facing substitution). On top of that, we have observed a strong increase in disposable income which is expected to sustain the high growth rates in employment in quaternary sectors and personal care and healthcare sectors.
Thus, on top of the fact that the number of sectors affected by automation is limited, we have (mostly qualitative) observations that job loss in the applying sectors is limited. This may be well counterbalanced by job creation both in directly related (new) sectors as well as in the spillover sectors. As such, we expect that, if we see a dip in employment in the forthcoming years, this will merely be temporary and in a limited set of sectors, and that, ultimately, there is a rebound to frictional unemployment levels. In the next section, we provide recommendations on policy measures that enhance inter-occupational and geographical mobility and thus assist in such a rebound.
5. Conclusions, Policy Implications, and Evaluation
5.1. Conclusions
In this paper, we build upon evolutionary economic notions of structural change to provide a conceptual framework on the effects of automation on types of sectors and developments of occupations, over time. We positioned the displacement and countervailing effects found in recent labor economic literature within this framework. We thus allow for a higher degree of specificity of narratives on the structural change driven by automation and place extant labor economic theories in a sectoral perspective. We subsequently used expert assessments on projections of employment in various (groups of) occupations in the forthcoming decade to study the foreseen changes in employment within and across the various types of sectors we discerned. The multisectoral perspective also highlighted how a detailed empirical analysis requires a patchwork of analyses specific to the type of sector. For the sectors of application, a study of automatability of jobs and the various intra- and intersector compensations is required. For the quaternary spillover sectors, a study of disposable income in both the making, applying, and complementary sectors is required. The supplying and complementary sectors are to be studied in conjunction with the producing and developing sectors. Such specific analyses are required not only for the projected employment as we did here, but arguably also for the development of wages, the occupational profile, etc.
We subsequently also used this conceptual model to conduct empirical analysis to provide projections which are found to be at odds with the “end of work” claim. For one, our expert-based estimation of the automatability of jobs in the applying sectors showed to be limited and the shifts of employment to the “making” sectors (notably engineering, software, and scientific services) salient. We revealed that there is substantial job creation in “making” sectors as well as in complementary facilitating and inhibiting sectors both in existing and emerging occupations. In addition, we provided an array of occupations mentioned as job creators of the future (e.g., big data and information systems, service robots, and an array of applications thereof). Moreover, we saw that growth in quaternary sectors, and possibly personal/health care, luxury goods sectors, etc. are growing faster than the average growth in disposable income, which we expect to remain high in the “making” and complementary sectors, but even for upskilled occupations in the applying sectors.
Aggregating over changes in the sectoral composition of the economy and projected employment in the various sectors, we found support for the “rebound” scenario: the job loss in the applying sectors is limited, while the potential for job creation is substantial, both in directly related (new) sectors as well as in the spillover sectors. Arguably, the “end of work” literature and notably the articles in popular media may be focused too much on loss of jobs in sectors of application and thus overlook the generation of jobs in the developing and producing (e.g., robotics technology) and supplying and supporting sectors (e.g., component producers), but also disregard the complementary facilitating and inhibiting sectors (e.g., education) and quaternary sectors receiving spillovers (sectors such as leisure and traveling, sport and lifestyle, entertainment, arts and culture). Thus, rather than the “end of work” within the set of “technology affected” sectors, we find support for “the usual structural change”.
5.2. Policy Implications
As a final contribution, we discuss three types of policy interventions that have been proposed both in popular media by captains of industry and by scholars in political economic literature. Firstly, policies may regulate the introduction of robotics and AI by blocking, regulating, or taxing the implementation, to thus curb the adoption. Bill Gates, for one, advocated introducing a “robot tax”, also to help out those that got unemployed due to automation, computerization, and robotization. However, Gasteiger & Prettner [54] shows that robot tax may merely increase the equilibrium wage rate but does not structurally change the outcome. Moreover, as “robot tax” may drive capital abroad, such regulations are best implemented internationally.
Secondly, policies may seek to “counter the adverse effects” of substitution such as income disparity. Some advocate the implementation of a system to redistribute income. Elon Musk and Richard Branson, to name a few, argue that robotization and the introduction of AI are likely to put millions of people out of a (sufficiently paid) job and call for a system of wealth distribution such as the “universal basic income”. While such an unconditional income may buffer against poverty and guarantee access to resources required for sustaining particular living conditions [55,56], there are open issues on the sourcing, costs, and effects (e.g., growth, inflation rates, and participation).
Thirdly, and this is one we propose from our evolutionary economic perspective on multisectoral structural change, to “enhance dynamic efficiency of the structural transition”. This is done by an array of measures such as ironing out friction–technological unemployment, stimulating the creation of new ventures, and ensuring inclusion of the (low-skilled) unemployed by facilitating/stimulating upgrading skills. Rather than inhibiting substitution in the sectors being automated and rather than merely alleviating those being replaced, the structural transition of the economy could be assisted and facilitated by educating the employees being substituted in the existing sectors to find a job in the new sectors emerging. The European Commission (see [57]) argues that an integrated mix of policy measures is required to close existing skill gaps. Central in this is that those that are unemployed receive adequate training to facilitate sustainable, upward mobility. To this end, policy measures are to ensure that employees are upskilled (within the sector of application) and receive training for new skills (also within new sectors) at the rate at which they are laid off due to substitution (cf. [43]). In addition, contractual arrangements are to be put in place to entice and encourage employers to hire low-skilled employees. Moreover, countries may seek to enhance their education system to develop a labor force working in jobs in which computers, robots, and AI are complements rather than substitutes. To further enhance the dynamic efficiency of the structural transition, entrepreneurial initiatives should be encouraged as this will enhance the creation and exploitation of opportunities in existing sectors and (formation of) new sectors. A study commissioned by the European Commission revealed a similar insight and, in addition, shows that there are substantial opportunities for entrepreneurs [58]. Ultimately, there may be synergistic mix of these policy measures. After all, dynamic efficiency of a structural transition may be enhanced by the universal basic income as this provides people with the opportunity to pursue entrepreneurship (which contributes directly and indirectly to employment), unleashes creativity of which the benefits accrue to the quaternary sectors but also the innovativeness of traditional sectors, etc. In addition, taxation of automation technology may dampen the (bursty) rate of substitution and provide educational institutes to keep pace in reskilling the unemployed. Further research into the effects of these policy measures is required.
5.3. Evaluation
Any forecast or projection of employment is based on particular (speculatively) assumptions in the model (cognitive, mathematical, etc.) of the future, and the quality of the input data extrapolated. Conclusions based on the BLS projections implicitly derive from the model assumptions and the limitations of instruments to acquire that input data. We discuss three issues with regard to our conclusions on the nature and magnitude of change in employment.
Firstly, many new products, services, occupations, and sectors related to technologies such as robots and AI have yet to emerge, which is likely to cause an underestimation of future employment. After all, the BLS Occupational Outlook uses the job counts, wage estimates, etc. in the Standard Employment Matrix for its projections. However, the occupational classification system therein is only extended ex post and thus omits counting jobs in emerging occupations not contained in the SOC yet. Recall that we resorted to using the Atlas database for illustrations of (types of) emerging occupations. Similarly, both the NAICS and the BLS’ own sector plan as well as the input–output matrix used in the estimation of demand for particular occupations are extended conservatively. The BLS currently does not provide projections on the labor demand, wages, etc. in emerging sectors, nor computes the consequences of/for these new sectors through input–output analysis. Consequently, the actual demand for labor and wages may well be higher.
Secondly, ideally, we would provide statistical support for the rates of employment change in the various types of sectors and the entire economy. However, the level of aggregation of sectors in the BLS employment projections, the polytypic nature of some of the sectors (e.g., may be “applying” as well as “making”), the lack of measures/proxies for the (possibly still moderate) magnitude of substitution and countervailing effects as well as other, general factors (e.g., demographics and offshoring), etc. all inhibit arriving at a refined multisectoral (regression) model of employment change. Moreover, arguably, we should study, in conjunction, the height and development of wages to provide projections on the rate of adoption of labor saving capital and thereby employment effects. In addition, to study the atypical countervailing effect of demand spillovers, we need measures/proxies for the disposable income in the “regular” sectors (making, applying, and facilitating/inhibiting) as well as consumption patterns. A further complication is that sectors (and occupations) that have yet to emerge can only be modeled abstractly.
Thirdly, the BLS derives its detailed projections at the occupation and sector level from the aggregate level of employment through the input–output structure and the employment matrix. The aggregate level of employment thus functions as a moderating variable. The BLS assumes that the total employment converges to the non-accelerating inflation rate of unemployment (NAIRU) over the horizon of the projections (here: during the period from 2016 to 2026). This level itself is a projection of the level of techno-frictional unemployment in the future, which in essence also reflects experts’ assessment of the consequences of automation. Consequently, whether or not the entire economy sees the “end of work” is an implicit assumption. However, note that the “end of work” in our case is defined as sustained unemployment in our focal set of making, applying, facilitating/inhibiting, and spillover sectors (including newly created sectors), which is only the case if there is no migration of these unemployed to sectors not contained in our set. To put matters in perspective: according to the sector information extracted from BLS’ industry–occupation matrix, the technology-affected occupations contained in the making and applying sectors is—roughly—at most 20% of the jobs.
To overcome several of these limitations, make different model assumptions, and cater to our specific research needs, we plan to develop a detailed, evolutionary model extending our prior work [21,22]. In this model, we seek to integrate the various labor economic effects, wages (and disposable income), endogenous rates of capital substitution, and control for exogenous factors such as demographics and international competition.
Author Contributions
B.V. wrote the final document. J.K. provided drafts for several paragraphs in the Methodological as well as the Data Analysis Sections. All co-authors proofread and commented on (earlier) versions of the text. B.V. and J.K. collected, processed, analyzed, and interpreted the data as well as developed the methodological approach. P.S., A.P., and J.K. provided B.V. with additional literature and advice on positioning. B.V. formulated the (conceptual) multisectoral perspective (building upon talks on structural change with P.S. and A.P.), the macro-level development scenarios, formulated the research questions, drew conclusions, and conceived the policy interventions.
Acknowledgments
Ben Vermeulen and Andreas Pyka gratefully acknowledge EU H2020 funding for the REELER project (grant 731726) aiming to provide a policy road map addressing societal concerns on the implementation and diffusion of robotics. We thank Mirheta Omeroviv for research assistance in an early stage.
Conflicts of Interest
The authors declare no conflict of interest.
Appendix A. Covert Unemployment?
Arguably, part of the technological unemployment may well be compensated by a decrease in the hours worked, annually. Empirical evidence shows that unemployment fluctuated but its average rate remained about the same for a century and a half, effectively absorbing major sectoral shifts, a rapid increase of women’s labor market participation and migrant workers (see Figure A1). However, at the same time, the hours worked, annually, decreased substantially in OECD countries (see Figure A2), effectively countering an increasing in unemployment otherwise observed. As such, there may be covert technological unemployment.
Figure A1.
Unemployment in UK over the last century and a half with labels for significant labor market changes. Data source: Bank of England, “Millennium of Data” dataset. Own visualization.
Figure A1.
Unemployment in UK over the last century and a half with labels for significant labor market changes. Data source: Bank of England, “Millennium of Data” dataset. Own visualization.

Figure A2.
Hours worked over the last couple of decades for several OECD countries. Data source: OECD. Own visualization.
Figure A2.
Hours worked over the last couple of decades for several OECD countries. Data source: OECD. Own visualization.

Appendix B. Employment Projections by SOC Major Groups of Technology-Affected Occupation by NAICS Sector
Figure A3.
BLS Employment Projections for all occupations affected by our focal technologies, here grouped by SOC major groups and broken down to NAICS sectors. The absolute number of jobs for all occupations, the share of employment of occupations affected, and the number and percentage of change in employment are also reported for the SOC major groups.

Appendix C. Fastest Growing and Declining Occupations, Projection 2016–2026
Figure A4.
Fastest growing and declining occupations in the BLS Employment Projections, 2016–2026.

Appendix D. Automatability Scores for Work Activities
Figure A5 contains color coded scores for automatability of work activities. This is based on an expert assessment of the probability that particular activities can be automated in the forthcoming decade, which coded is in three values: already or highly likely that it can be automated (regular font, score of 1), not likely/not unlikely (cursive font, score of 0.5), and highly unlikely (bold font, score of 0). The examples mentioned in the cells are provided by O*Net and are merely illustrative for three levels of complexity and intellectual/physical challenges in tasks for the work activities at hand.
Figure A5.
Work activities and scores for automatability for different levels of complexity of tasks.
Figure A5.
Work activities and scores for automatability for different levels of complexity of tasks.

Appendix E. Classification of Technology-Affected Occupations
After filtering the BLS OOH occupations based on keywords indicating that these occupations are affected by our focal technologies, the occupations have been classified to sector type and type of change of the occupation. These occupations are contained in the “existing” and “transforming” occupations rows in Figure A6. Atlas database occupations flagged as engaged in “automatization” or requiring “programming/robotics/artificial intelligence” skills are contained in the “emerging” occupations row. A plus (minus) sign indicates the occupation faces job creation (destruction), a plus-minus sign indicates opposite effects are at work and the net results is undetermined.
Figure A6.
Technology-affected occupations classified according to sector and type of change of the occupation.
Figure A6.
Technology-affected occupations classified according to sector and type of change of the occupation.

References
- Schwab, K. The Fourth Industrial Revolution; Penguin: London, UK, 2017. [Google Scholar]
- Keynes, J.M. A Treatise on Money: The Applied Theory of Money; AMS Press: New York, NY, USA, 1930. [Google Scholar]
- Leontief, W. Technological Advance, Economic Growth, and the Distribution of Income. Popul. Dev. Rev. 1983, 9, 403–410. [Google Scholar] [CrossRef]
- Manyika, J.; Chui, M.; Bughin, J.; Dobbs, R.; Bisson, P.; Marrs, A. Disruptive Technologies: Advances that will Transform Life, Business, and the Global Economy; McKinsey Global Institute: San Francisco, CA, USA, 2013. [Google Scholar]
- Wolfgang, M. The Robotics Market—Figures and Forecasts; RoboBusiness, Boston Consulting Group: Boston, MA, USA, 2016. [Google Scholar]
- Brynjolfsson, E.; McAfee, A. Race Against the Machine: How the Digital Revolution is Accelerating Innovation, Driving Productivity, and Irreversibly Transforming Employment and the Economy; Digital Frontier Press: Lexington, MA, USA, 2011. [Google Scholar]
- Ford, M. The Rise of the Robots: Technology and the Threat of Mass Unemployment; Oneworld Publications: Oxford, UK, 2015. [Google Scholar]
- Frey, C.B.; Osborne, M. The future of employment: how susceptible are jobs to computerisation? Technol. Forecast. Soc. Chang. 2017, 114, 254–280. [Google Scholar] [CrossRef]
- Acemoglu, D.; Restrepo, P. The Race Between Machine and Man: Implications of Technology for Growth, Factor Shares and Employment; NBER Working Paper; Social Science Electronic Publishing, Inc.: Rochester, NY, USA, 2016. [Google Scholar]
- Acemoglu, D.; Restrepo, P. Robots and Jobs: Evidence from US Labor Markets; NBER Working Paper; Social Science Electronic Publishing, Inc.: Rochester, NY, USA, 2017. [Google Scholar]
- Acemoglu, D.; Restrepo, P. Artificial Intelligence, Automation and Work; NBER Working Paper; Social Science Electronic Publishing, Inc.: Rochester, NY, USA, 2018. [Google Scholar]
- Autor, D.H. Why are there still so many jobs? The history and future of workplace automation. J. Econ. Perspect. 2015, 29, 3–30. [Google Scholar] [CrossRef]
- Autor, D.; Salomons, A.M. Is automation labor-displacing? Productivity growth, employment, and the labor share. In Proceedings of the BPEA Conference Drafts, Detroit, MI, USA, 8–9 March 2018. [Google Scholar]
- Graetz, G.; Michaels, G. Robots at Work; CEP Discussion Papers; Centre for Economic Performance, London School of Economics and Political Science: London, UK, 2015. [Google Scholar]
- Gregory, T.; Salomons, A.; Zierahn, U. Racing With or Against the Machine? Evidence from Europe; Discussion Paper No. 16-053; ZEW: Mannheim, Germany, 2016. [Google Scholar]
- Stewart, I.; De, D.; Cole, A. Technology and People: The Great Job-Creating Machine; Deloitte: London, UK, 2015. [Google Scholar]
- Vivarelli, M. Innovation and Employment Technological Unemployment Is Not Inevitable—Some Innovation Creates Jobs, and Some Job Destruction Can Be Avoided; IZA Technical Report; Forschungsinstitut zur Zukunft der Arbeit (IZA): Bonn, Germany, 2007. [Google Scholar]
- Vivarelli, M. Innovation, employment, and skills in advanced and developing countries: A survey of the economic literature. J. Econ. Issues 2014, 48, 123–154. [Google Scholar] [CrossRef]
- Mokyr, J.; Vickers, C.; Ziebarth, N.L. The History of Technological Anxiety and the Future of Economic Growth: Is this Time Different? J. Econ. Perspect. 2015, 29, 31–50. [Google Scholar] [CrossRef]
- Pasinetti, L. Structural Change and Economic Growth: A Theoretical Essay on the Dynamics of the Wealth of Nations; Cambridge University Press: Cambridge, UK, 1981. [Google Scholar]
- Saviotti, P.P.; Pyka, A. Economic development, qualitative change and employment creation. Struct. Chang. Econ. Dyn. 2004, 15, 265–287. [Google Scholar] [CrossRef]
- Saviotti, P.P.; Pyka, A. Product variety, competition and economic growth. J. Evol. Econ. 2008, 18, 323–347. [Google Scholar] [CrossRef]
- Autor, D.H.; Levy, F.; Murnane, R.J. The Skill Content of Recent Technological Change: An Empirical Exploration. Q. J. Econ. 2003, 118, 1279–1333. [Google Scholar] [CrossRef]
- Levy, F.; Murnane, R.J. How Computerized Work and Globalization Shape Human Skill Demands. In Learning in the Global Era: International Perspectives on Globalization and Education; Suarez-Orozco, M., Ed.; University of California Press: Berkeley, CA, USA, 2007; pp. 158–174. [Google Scholar]
- Autor, D.H.; Katz, L.F.; Kearney, M.S. The Polarization of the US Labor Market; NBER Working Paper; Social Science Electronic Publishing, Inc.: Rochester, NY, USA, 2006. [Google Scholar]
- Deming, D.J. The Growing Importance of Social Skills in the Labor Market; NBER Working Paper; Social Science Electronic Publishing, Inc.: Rochester, NY, USA, 2015. [Google Scholar]
- Autor, D. Polanyi’s Paradox and the Shape of Employment Growth; NBER Working Paper; Social Science Electronic Publishing, Inc.: Rochester, NY, USA, 2014. [Google Scholar]
- Dobbs, R.; Madgavkar, A.; Barton, D.; Labaye, E.; Manyika, J.; Roxburgh, C.; Lund, S.; Madhav, S. The World at Work: Jobs, Pay, and Skills for 3.5 Billion People; McKinsey Global Institute: Washington, DC, USA, 2012. [Google Scholar]
- Goos, M.; Manning, A. Lousy and lovely jobs: The rising polarization of work in Britain. Rev. Econ. Stat. 2007, 89, 118–133. [Google Scholar] [CrossRef]
- Goos, M.; Manning, A.; Salomons, A. Job polarization in Europe. Am. Econ. Rev. 2009, 99, 58–63. [Google Scholar] [CrossRef]
- Katz, L.F.; Margo, R.A. Technical Change and the Relative Demand for Skilled Labor: The United States in Historical Perspective; NBER Working Paper; Social Science Electronic Publishing, Inc.: Rochester, NY, USA, 2013. [Google Scholar]
- Goldin, C.; Katz, L.F. The Origins of Technology—Skill Complementarity. Q. J. Econ. 1998, 113, 693–732. [Google Scholar] [CrossRef]
- Griliches, Z. Capital—Skill Complementarity. Rev. Econ. Stat. 1969, 51, 465–468. [Google Scholar] [CrossRef]
- Moretti, E.; Thulin, P. Local multipliers and human capital in the United States and Sweden. Ind. Corp. Chang. 2013, 22, 339–362. [Google Scholar] [CrossRef]
- Schumpeter, J.A. Capitalism, Socialism and Democracy; Harper & Row: New York, NY, USA, 1942. [Google Scholar]
- Baumol, W.J. Macroeconomics of Unbalanced Growth: The Anatomy of Urban Crisis. Am. Econ. Rev. 1967, 57, 415–426. [Google Scholar]
- Echevarria, C. Changes in sectoral composition associated with economic growth. Int. Econ. Rev. 1997, 38, 431–452. [Google Scholar] [CrossRef]
- Ngai, L.R.; Pissarides, C.A. Structural Change in a Multisector Model of Growth. Am. Econ. Rev. 2007, 97, 429–443. [Google Scholar] [CrossRef]
- Rodrik, D. Premature Deindustrialization. J. Econ. Growth 2016, 21, 1–33. [Google Scholar] [CrossRef]
- Arntz, M.; Gregory, T.; Zierahn, U. The Risk of Automation for Jobs in OECD Countries: A Comparative Analysis; OECD Social, Employment and Migration Working Papers; OECD Publishing: Paris, France, 2016. [Google Scholar]
- Gorle, P.; Clive, A. Positive Impact of Industrial Robots on Employment; IFR: Frankfurt, Germany, 2013. [Google Scholar]
- Dauth, W.; Findeisen, S.; Südekum, J.; Wößner, N. German Robots—The Impact of Industrial Robots on Workers; IAB: New York, NY, USA, 2017. [Google Scholar]
- Goldin, C.; Katz, L.F. The Race between Education and Technology: The Evolution of U.S. Educational Wage Differentials, 1890 to 2005; NBER Working Paper; Social Science Electronic Publishing, Inc.: Rochester, NY, USA, 2007. [Google Scholar]
- MacCrory, F.; Westerman, G.; Alhammadi, Y.; Brynjolfsson, E. Racing with and against the machine: Changes in occupational skill composition in an era of rapid technological advance. In Proceedings of the Thirty Fifth International Conference on Information Systems, Auckland, New Zealand, 14–17 December 2014. [Google Scholar]
- Basu, S.; Fernald, J.G.; Kimball, M.S. Are technology improvements contractionary? Am. Econ. Rev. 2006, 96, 1418–1448. [Google Scholar] [CrossRef]
- Trehan, B. Productivity Shocks and the Unemployment Rate. FRBSF Econ. Rev. 2003, 13–27. [Google Scholar]
- Bresnahan, T.F.; Trajtenberg, M. General purpose technologies: “Engines of growth”. J. Econom. 1995, 65, 83–108. [Google Scholar] [CrossRef]
- Helpman, E.; Trajtenberg, M. Diffusion of General Purpose Technologies. In General Purpose Technologies and Economic Growth; Helpman, E., Ed.; MIT Press: Cambridge, MA, USA, 1997. [Google Scholar]
- Brzeski, C.; Burk, I. Die Roboter kommen. Folgen der Automatisierung für den deutschen Arbeitsmarkt. INGDiBa Econ. Res. 2015, 30, 1–7. [Google Scholar]
- Bonin, H.; Gregory, T.; Zierahn, U. Übertragung der Studie von Frey/Osborne (2013) auf Deutschland. ZEW Kurzexpertise 2015, 57. [Google Scholar]
- Arntz, M.; Gregory, T.; Zierahn, U. Revisiting the Risk of Automation. Econ. Lett. 2017, 159, 157–160. [Google Scholar] [CrossRef]
- Manyika, J.; Chui, M.; Miremadi, M.; Bughin, J.; George, K.; Willmott, P.; Dewhurst, M. A Future that Works: Automation, Employment, and Productivity; McKinsey Global Institute: San Francisco, CA, USA, 2017. [Google Scholar]
- Frey, C.B.; Osborne, M.; Holmes, C.; Rahbari, E.; Garlick, R.; Friedlander, G.; McDonald, G. Technology at Work v2. 0: The Future is not What it Used to Be; CityGroup and University of Oxford: Oxford, UK, 2016. [Google Scholar]
- Gasteiger, E.; Prettner, K. A Note on Automation, Stagnation, and the Implications of a Robot Tax; Discussion Paper; School of Business & Economics, Freie Universität Berlin: Berlin, Germany, 2017. [Google Scholar]
- Colombino, U. Is unconditional basic income a viable alternative to other social welfare measures? IZA World Labor 2015, 128. [Google Scholar] [CrossRef]
- Parijs, P.V. Real Freedom for All, What (If Anything) Can Justify Capitalism; Clarendon Press: Oxford, UK, 1995. [Google Scholar]
- European Commission. Towards Common Principles of Flexicurity. More and Better Jobs through Flexibility and Security; Luxembourg Office for Official Publications of the European Communities: Liebefeld, Switzerland, 2007. [Google Scholar]
- Forge, S.; Blackman, C. A Helping Hand for Europe: The Competitive Outlook for the EU Robotics Industry. In Institute for Prospective Technological Studies; JRC Scientific and Technical Report: EUR 24600 EN; Joint Research Centre, European Commission: Brussels, Belgium, 2010. [Google Scholar]
Figure 1.
Changes in employment by type of sector and change in occupation with respect to the introduction of focal technology. The signs indicate the expected change in employment due to automation and the accompanying text the cause for the type of change. Note that some table cells report both positive and negative effects such that the net result is undetermined.

Figure 2.
Three main scenarios on the development of employment upon the introduction of robot/AI technology, with the employment share in solid lines and capital share in dashed lines. (a) “End of work”: destroying jobs to the level of mass unemployment, (b) “Structurally lower”: Developing a high level of unemployment, (c) “Rebound”: After a dip, return to the previous level of employment.

Figure 3.
Automatability of major groups of occupations, with occupations’ individual automatability scores weighed by the number of jobs.
Figure 3.
Automatability of major groups of occupations, with occupations’ individual automatability scores weighed by the number of jobs.

Figure 4.
The number of jobs (Y-axis) for occupations with a normalized automatability higher than a particular threshold (X-axis).
Figure 4.
The number of jobs (Y-axis) for occupations with a normalized automatability higher than a particular threshold (X-axis).

Figure 5.
Groups of occupations by sector and type of change. The plus (minus) sign indicates there is job creation (loss) for the particular occupation, the plus/minus indicates that the development of the number of jobs is undetermined.
Figure 5.
Groups of occupations by sector and type of change. The plus (minus) sign indicates there is job creation (loss) for the particular occupation, the plus/minus indicates that the development of the number of jobs is undetermined.


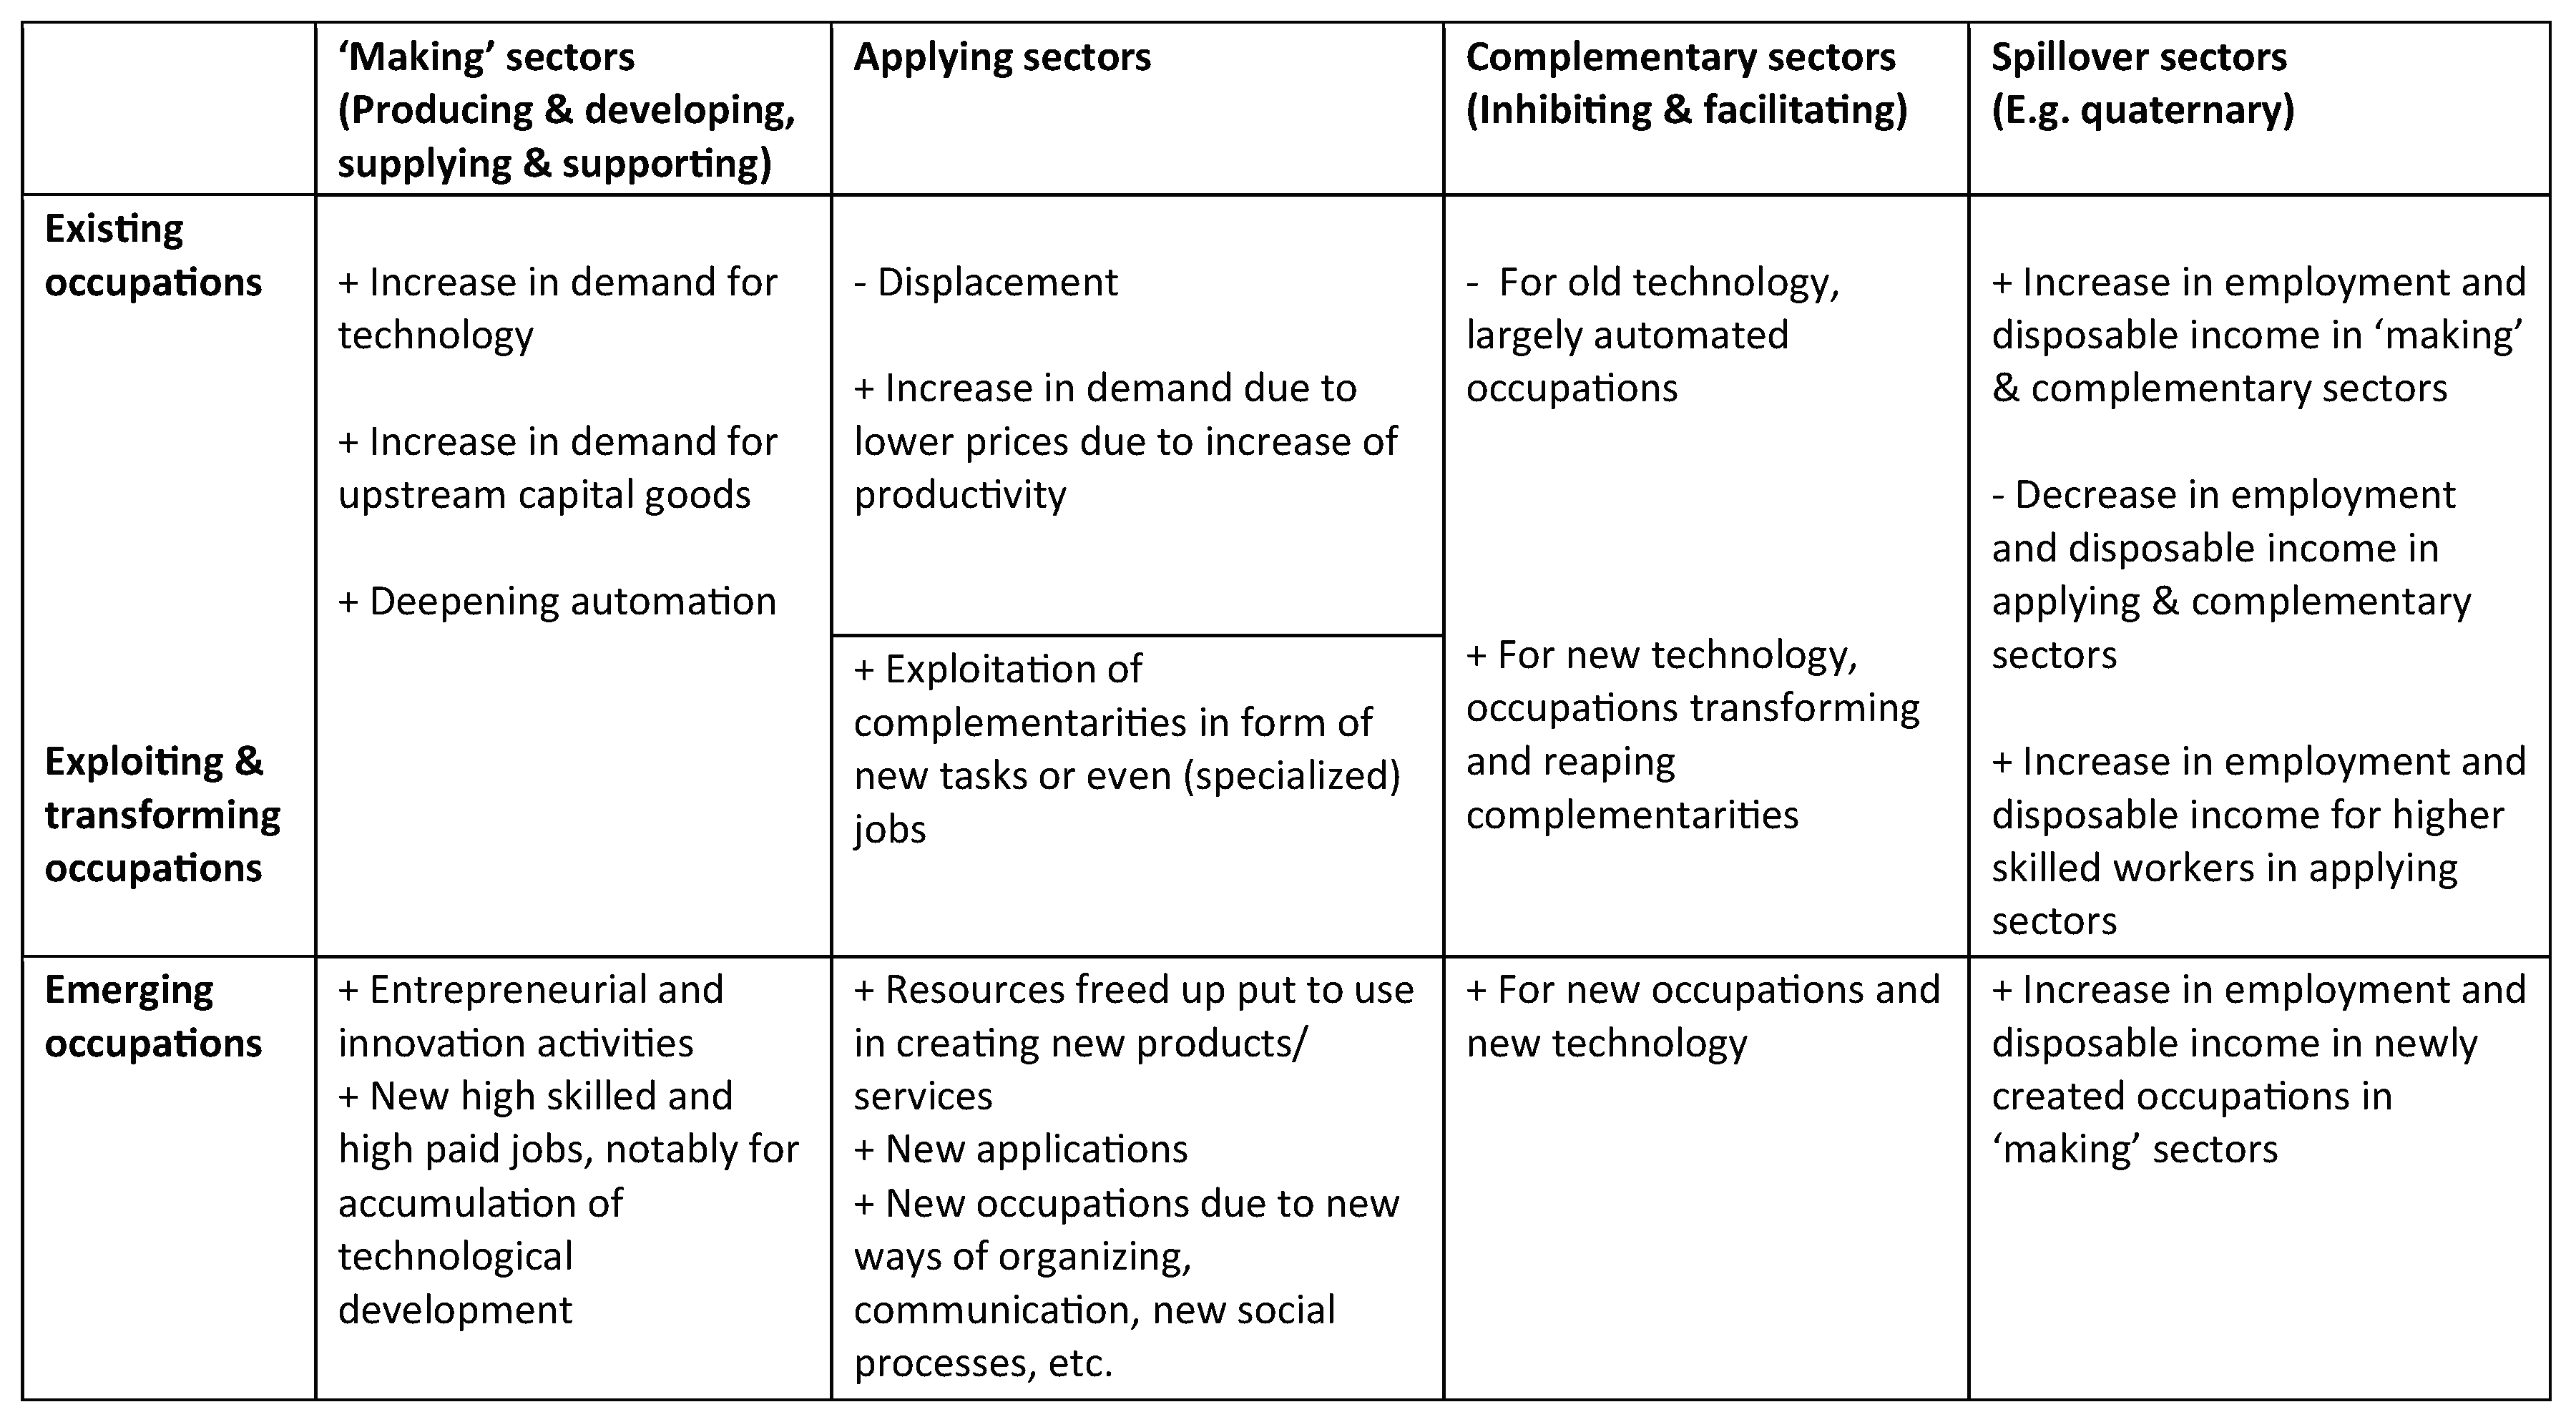
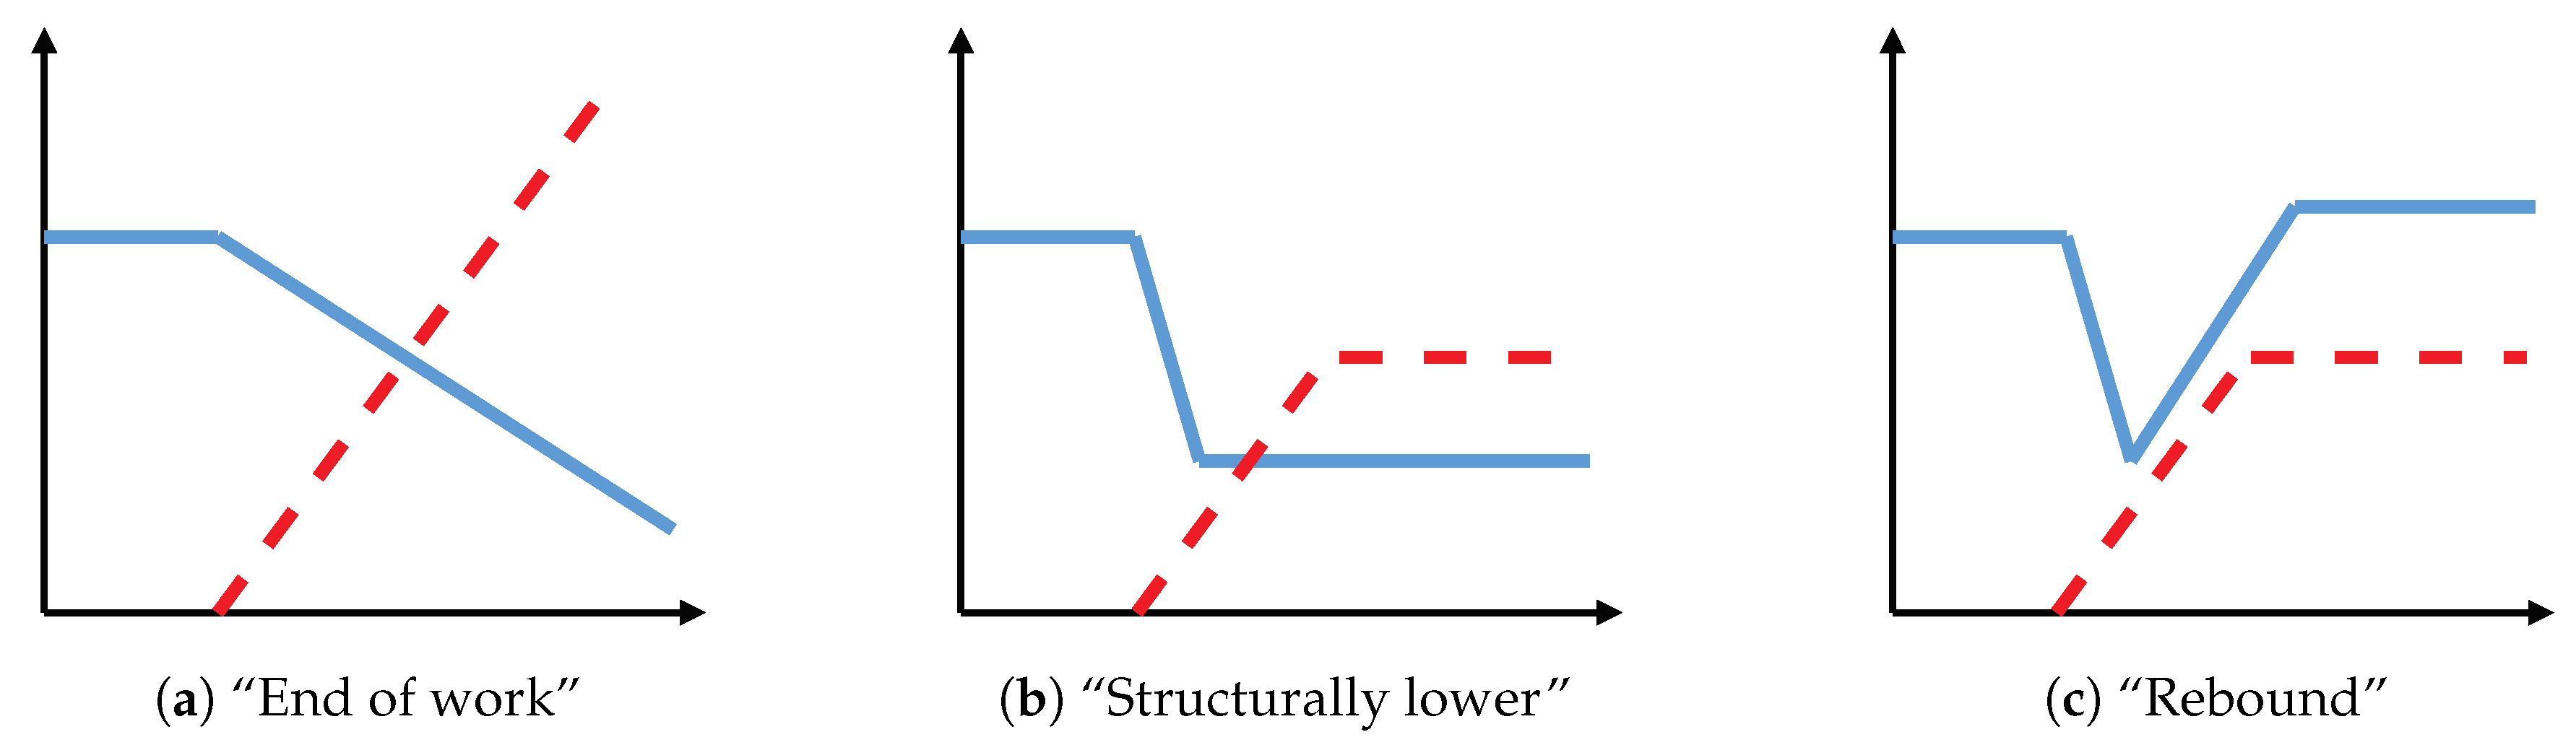
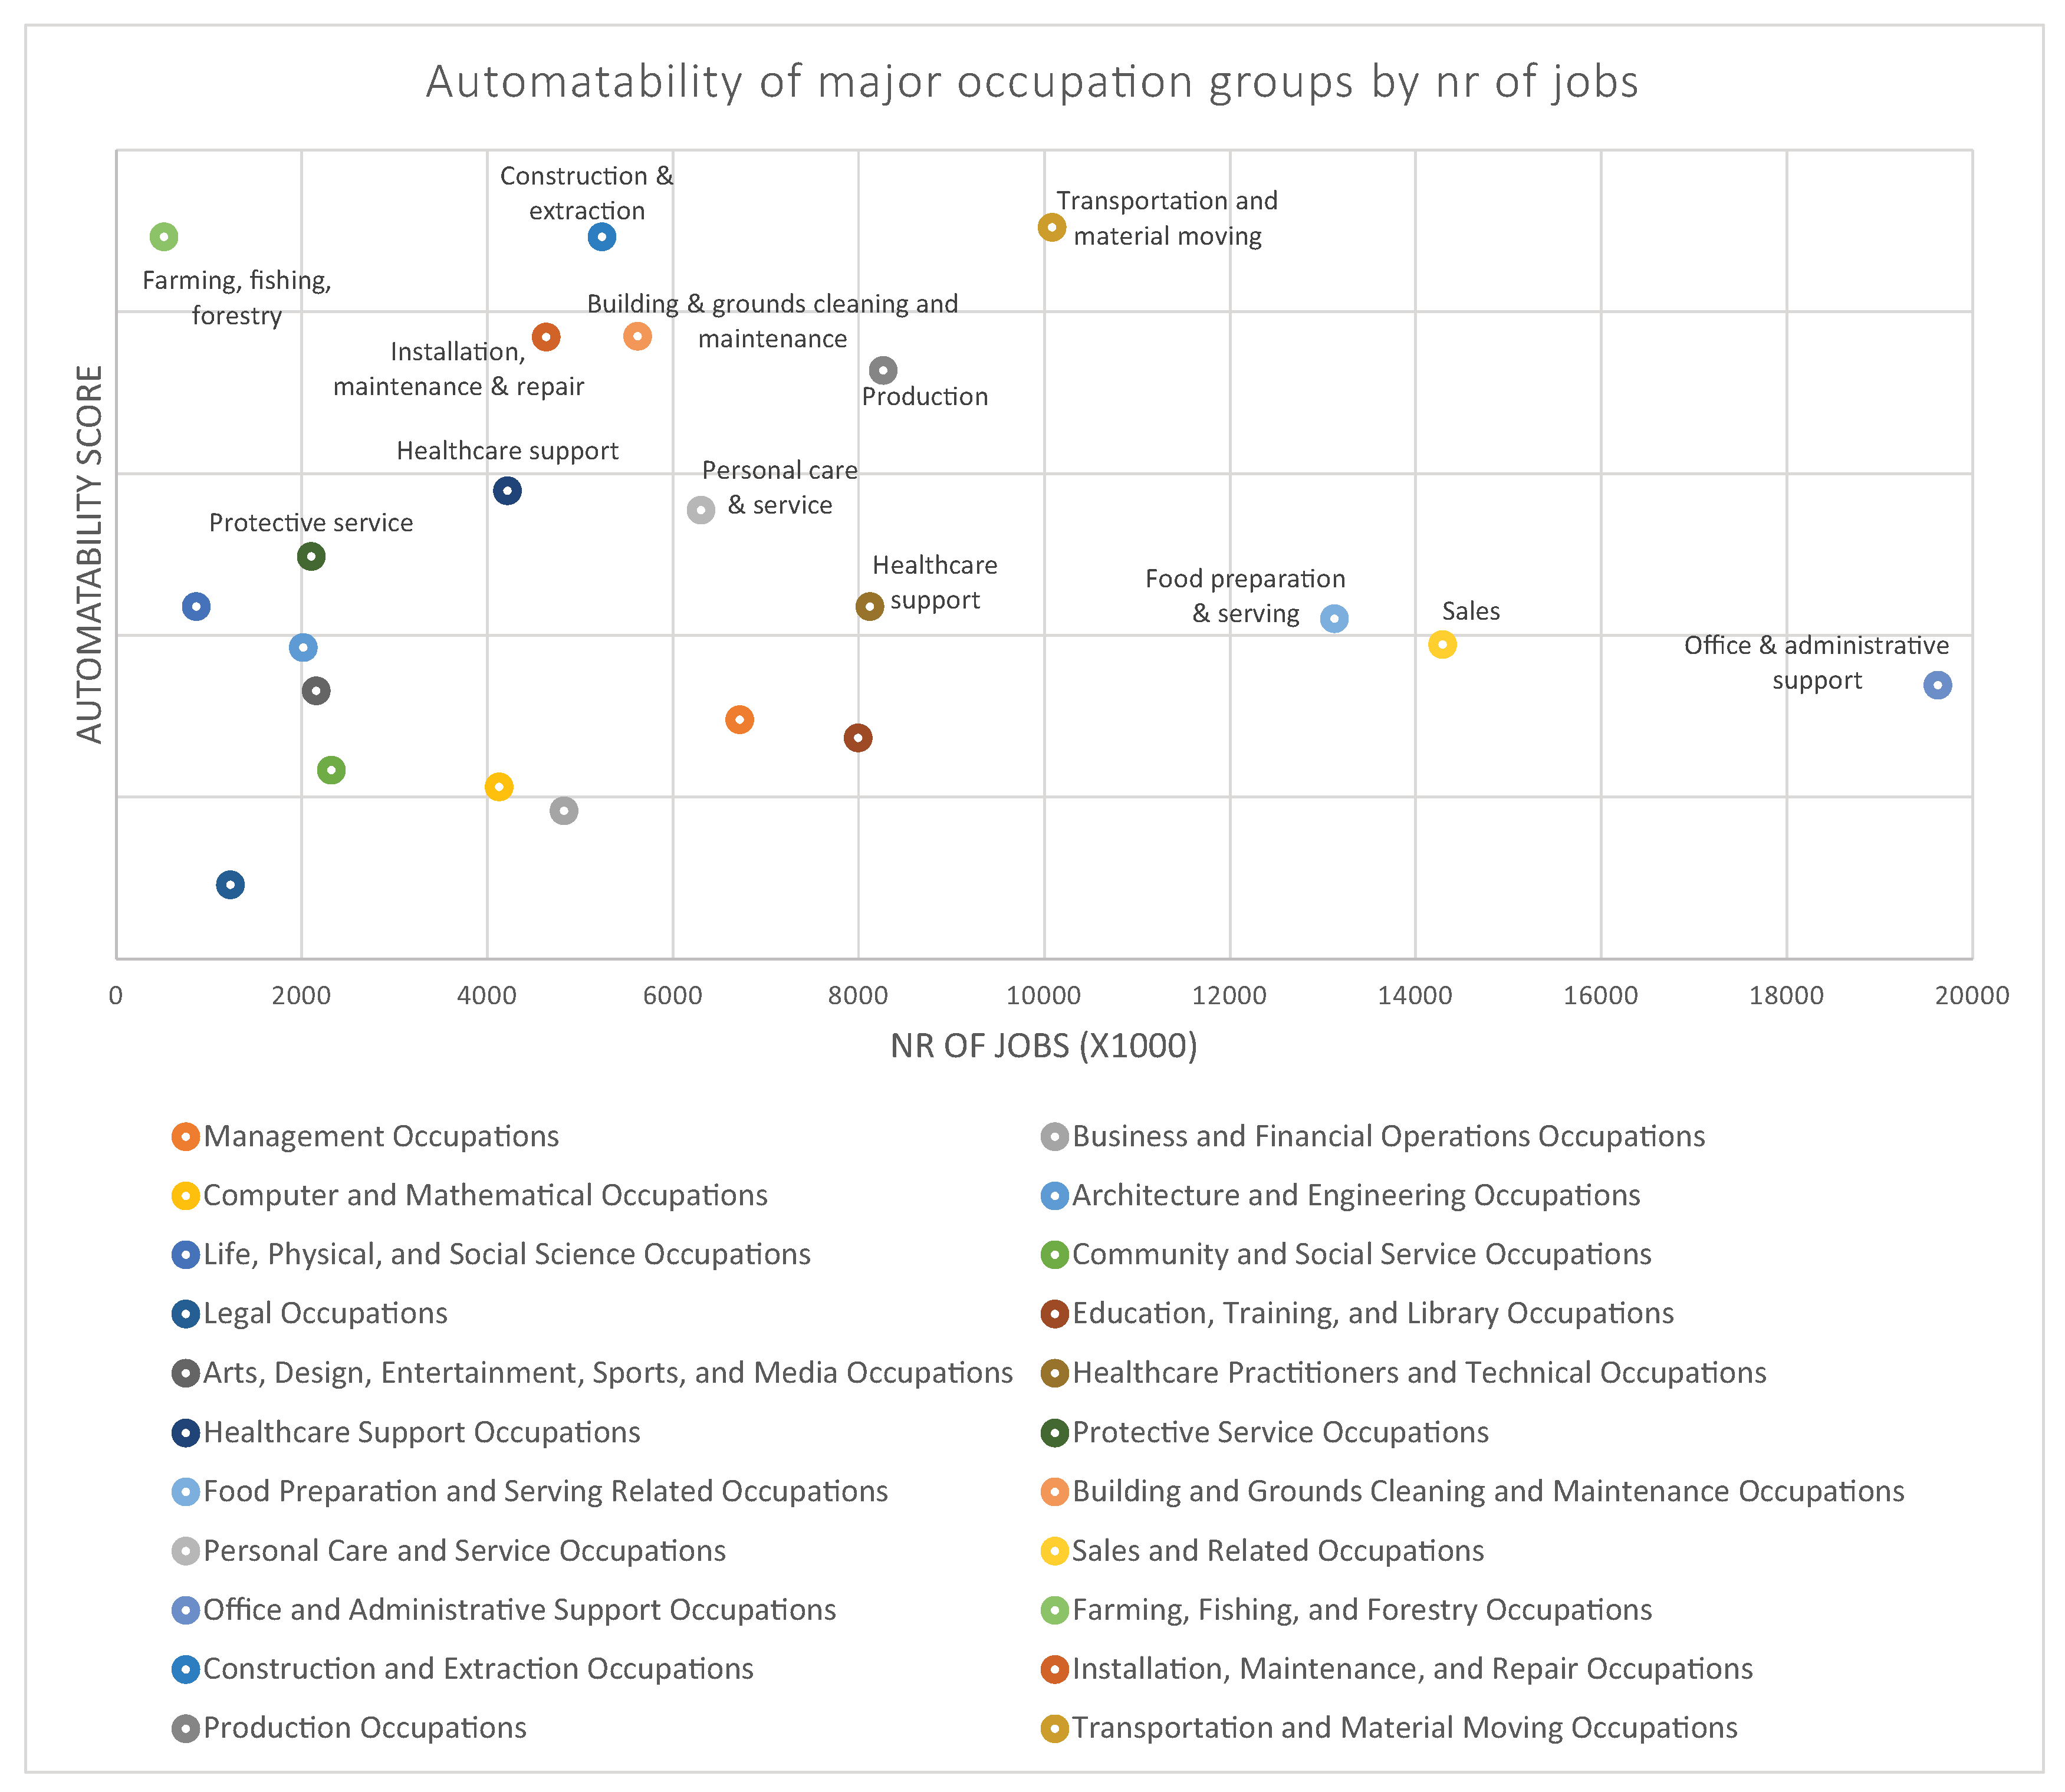
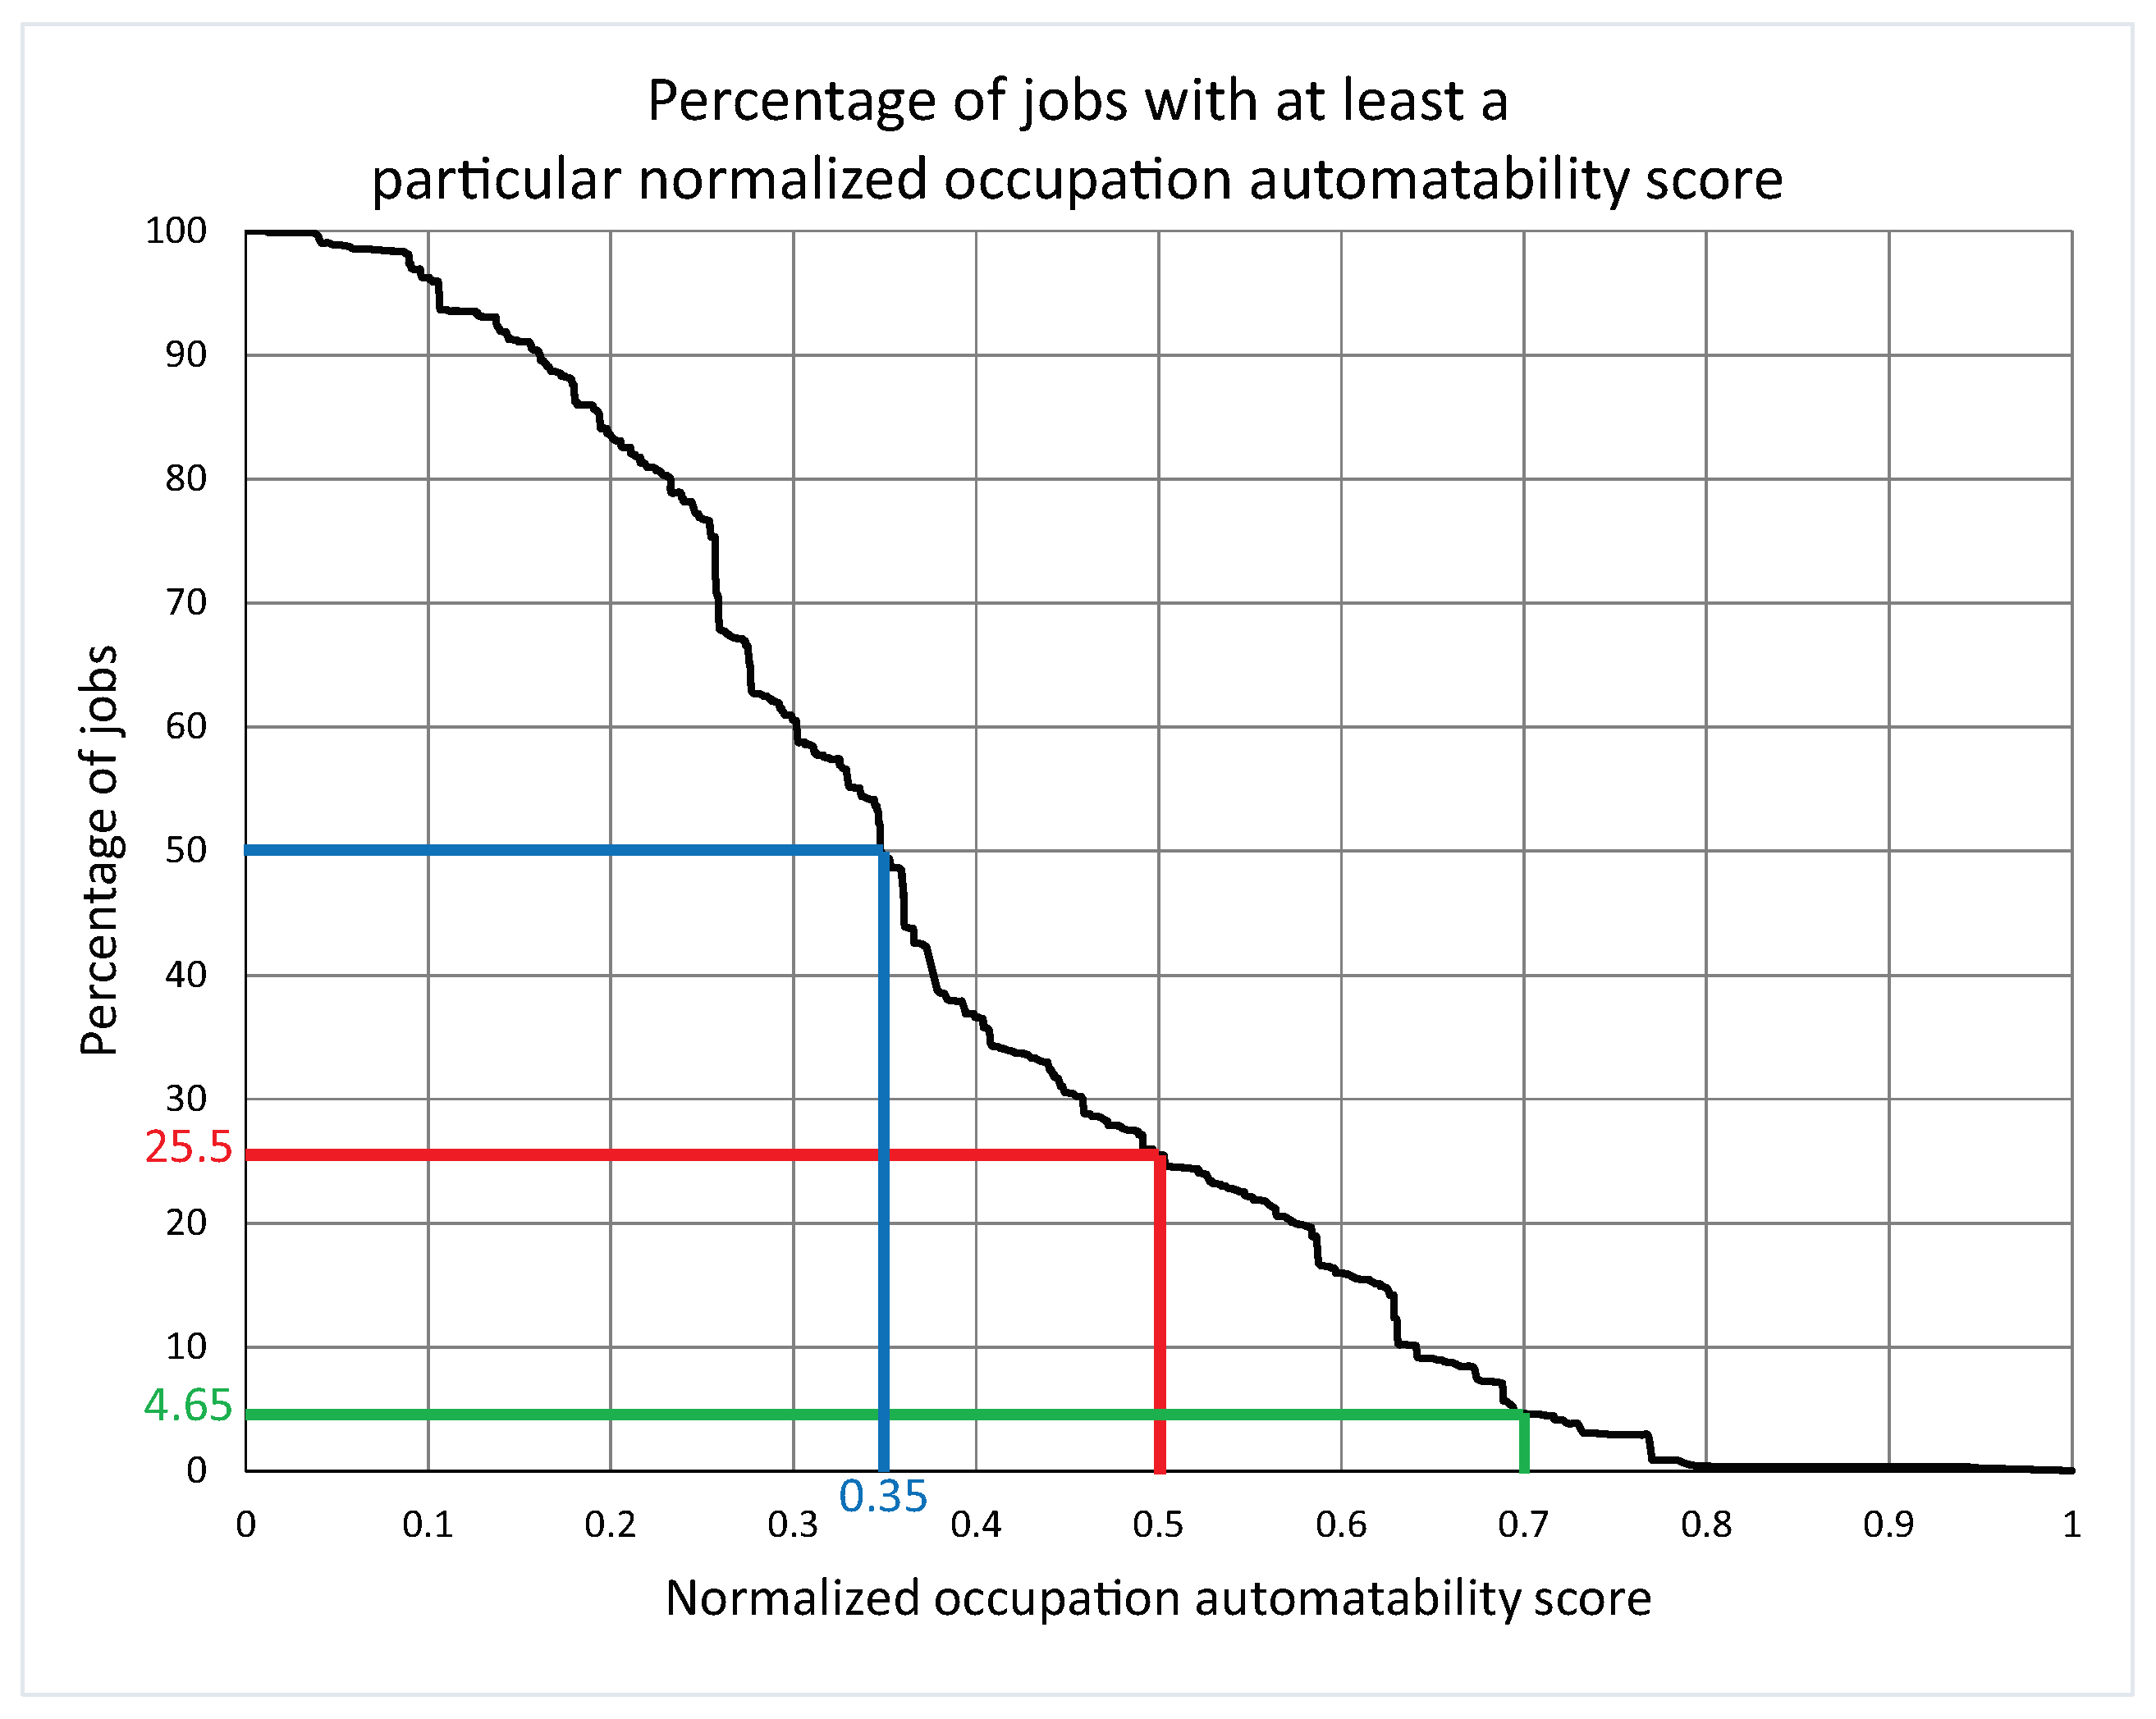
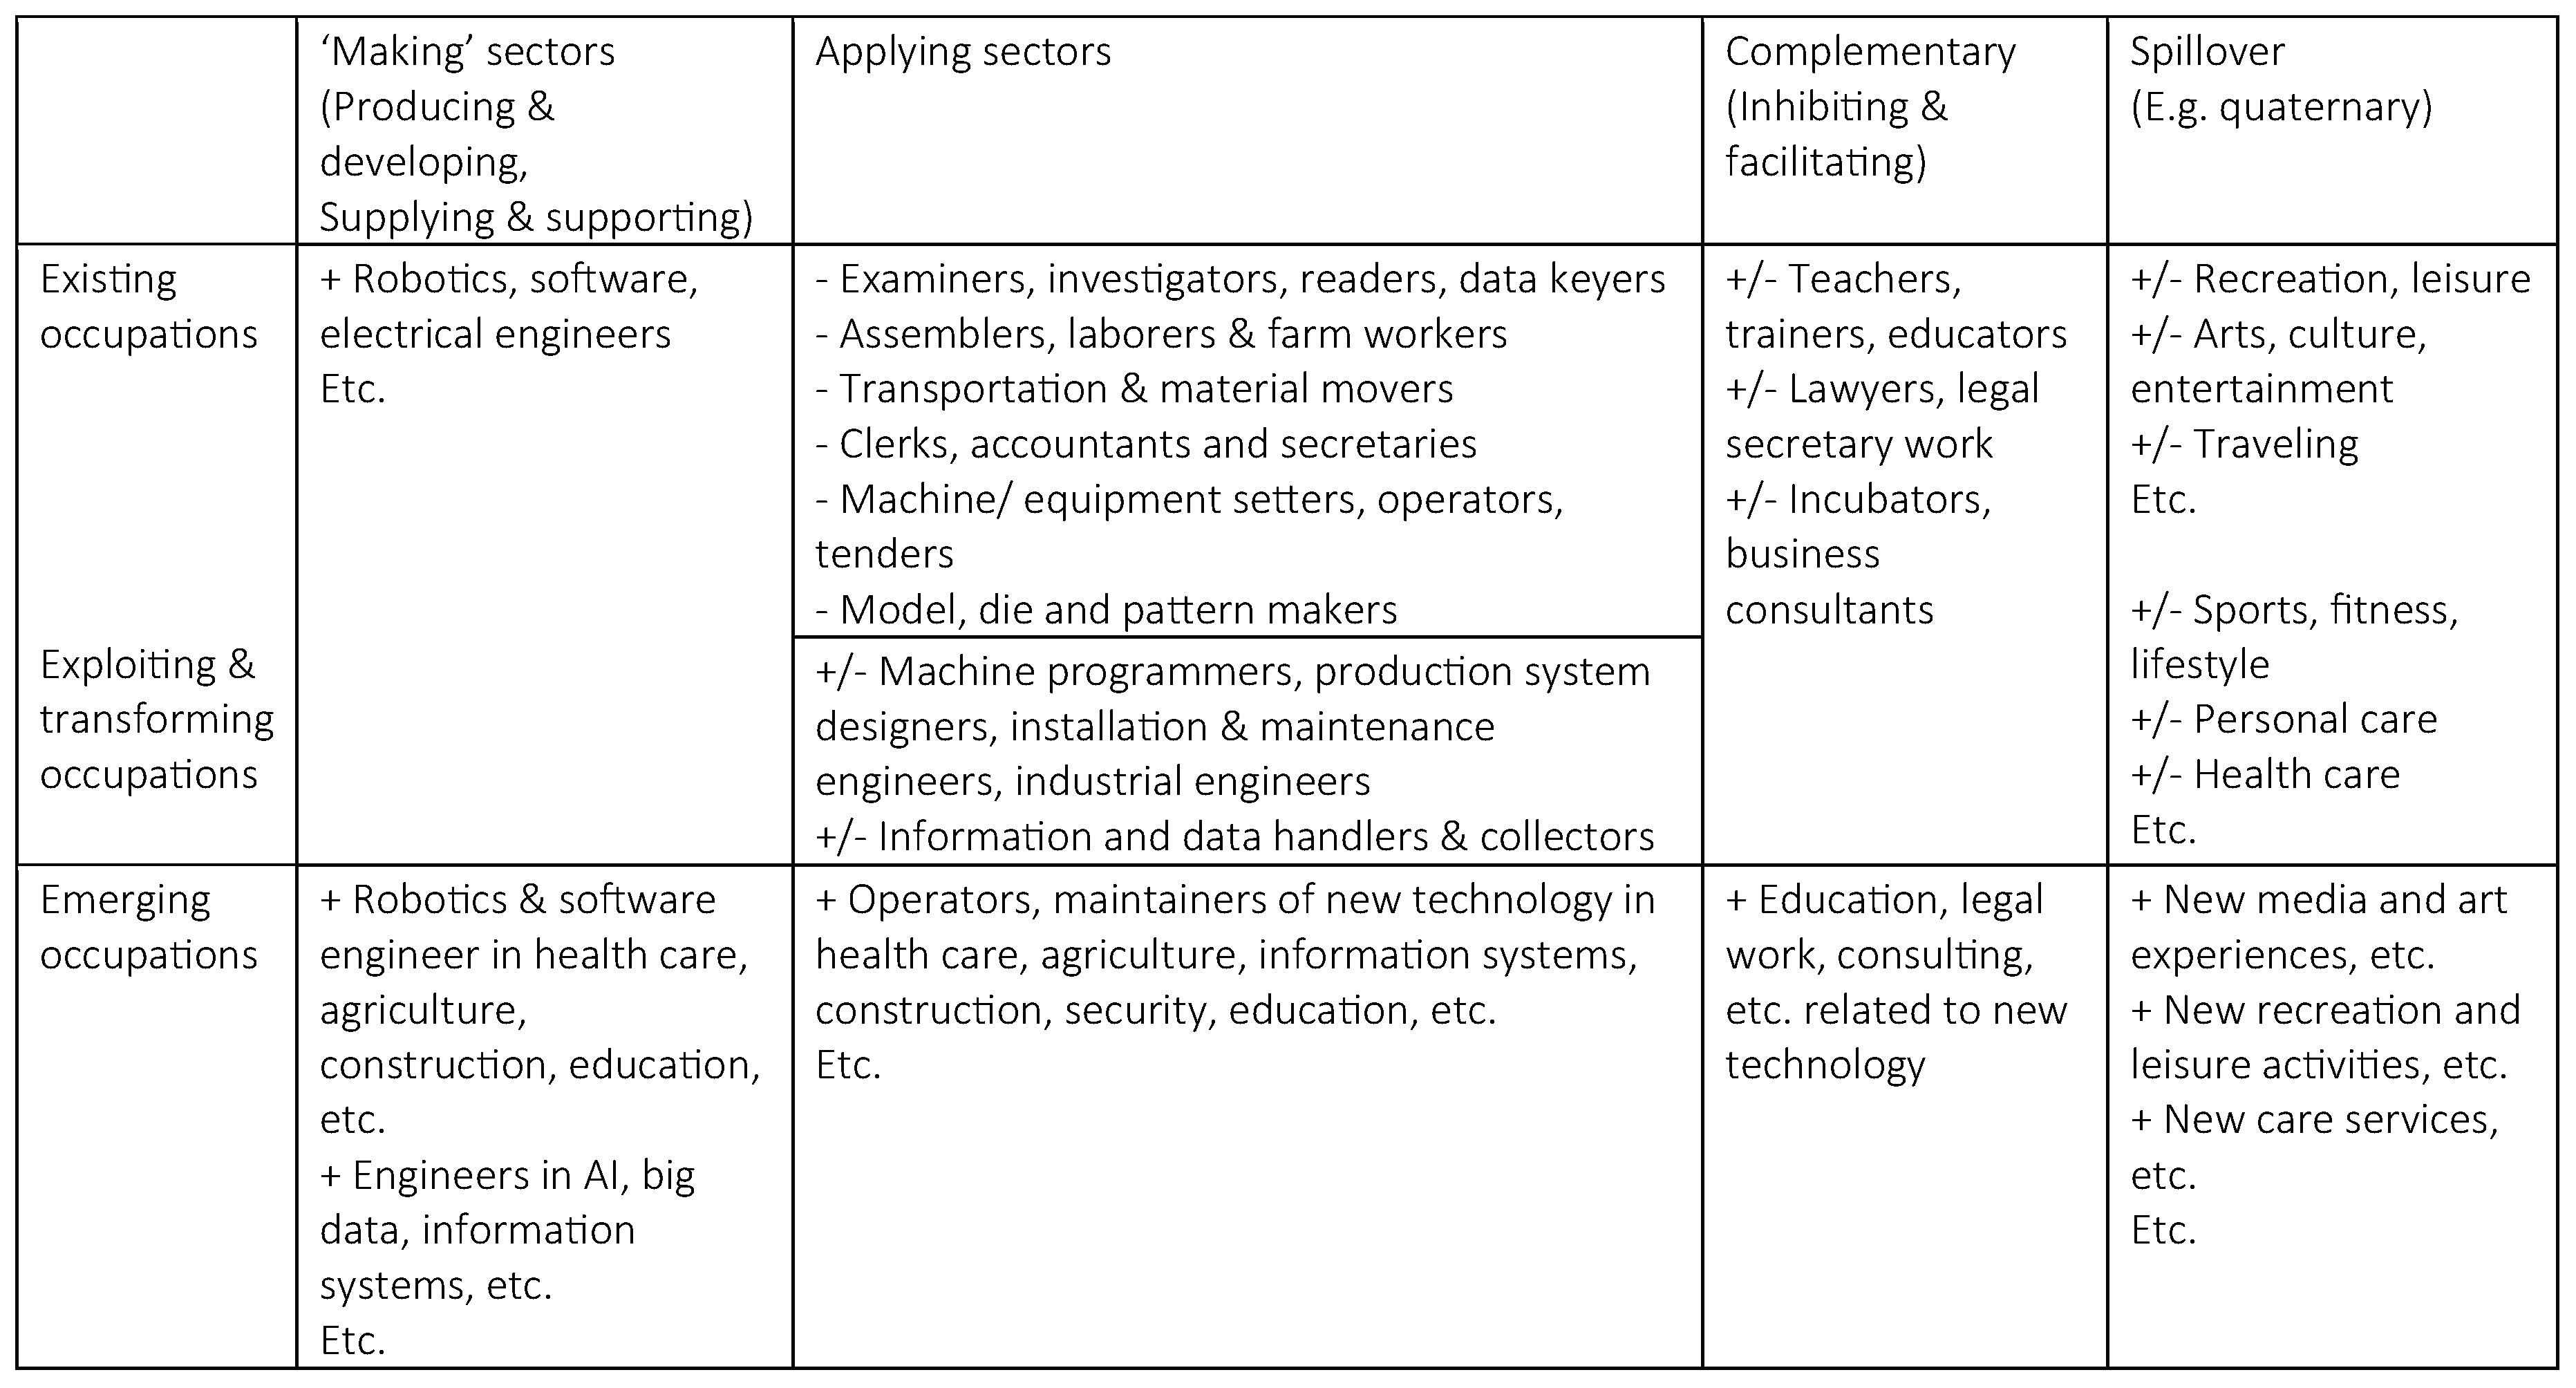
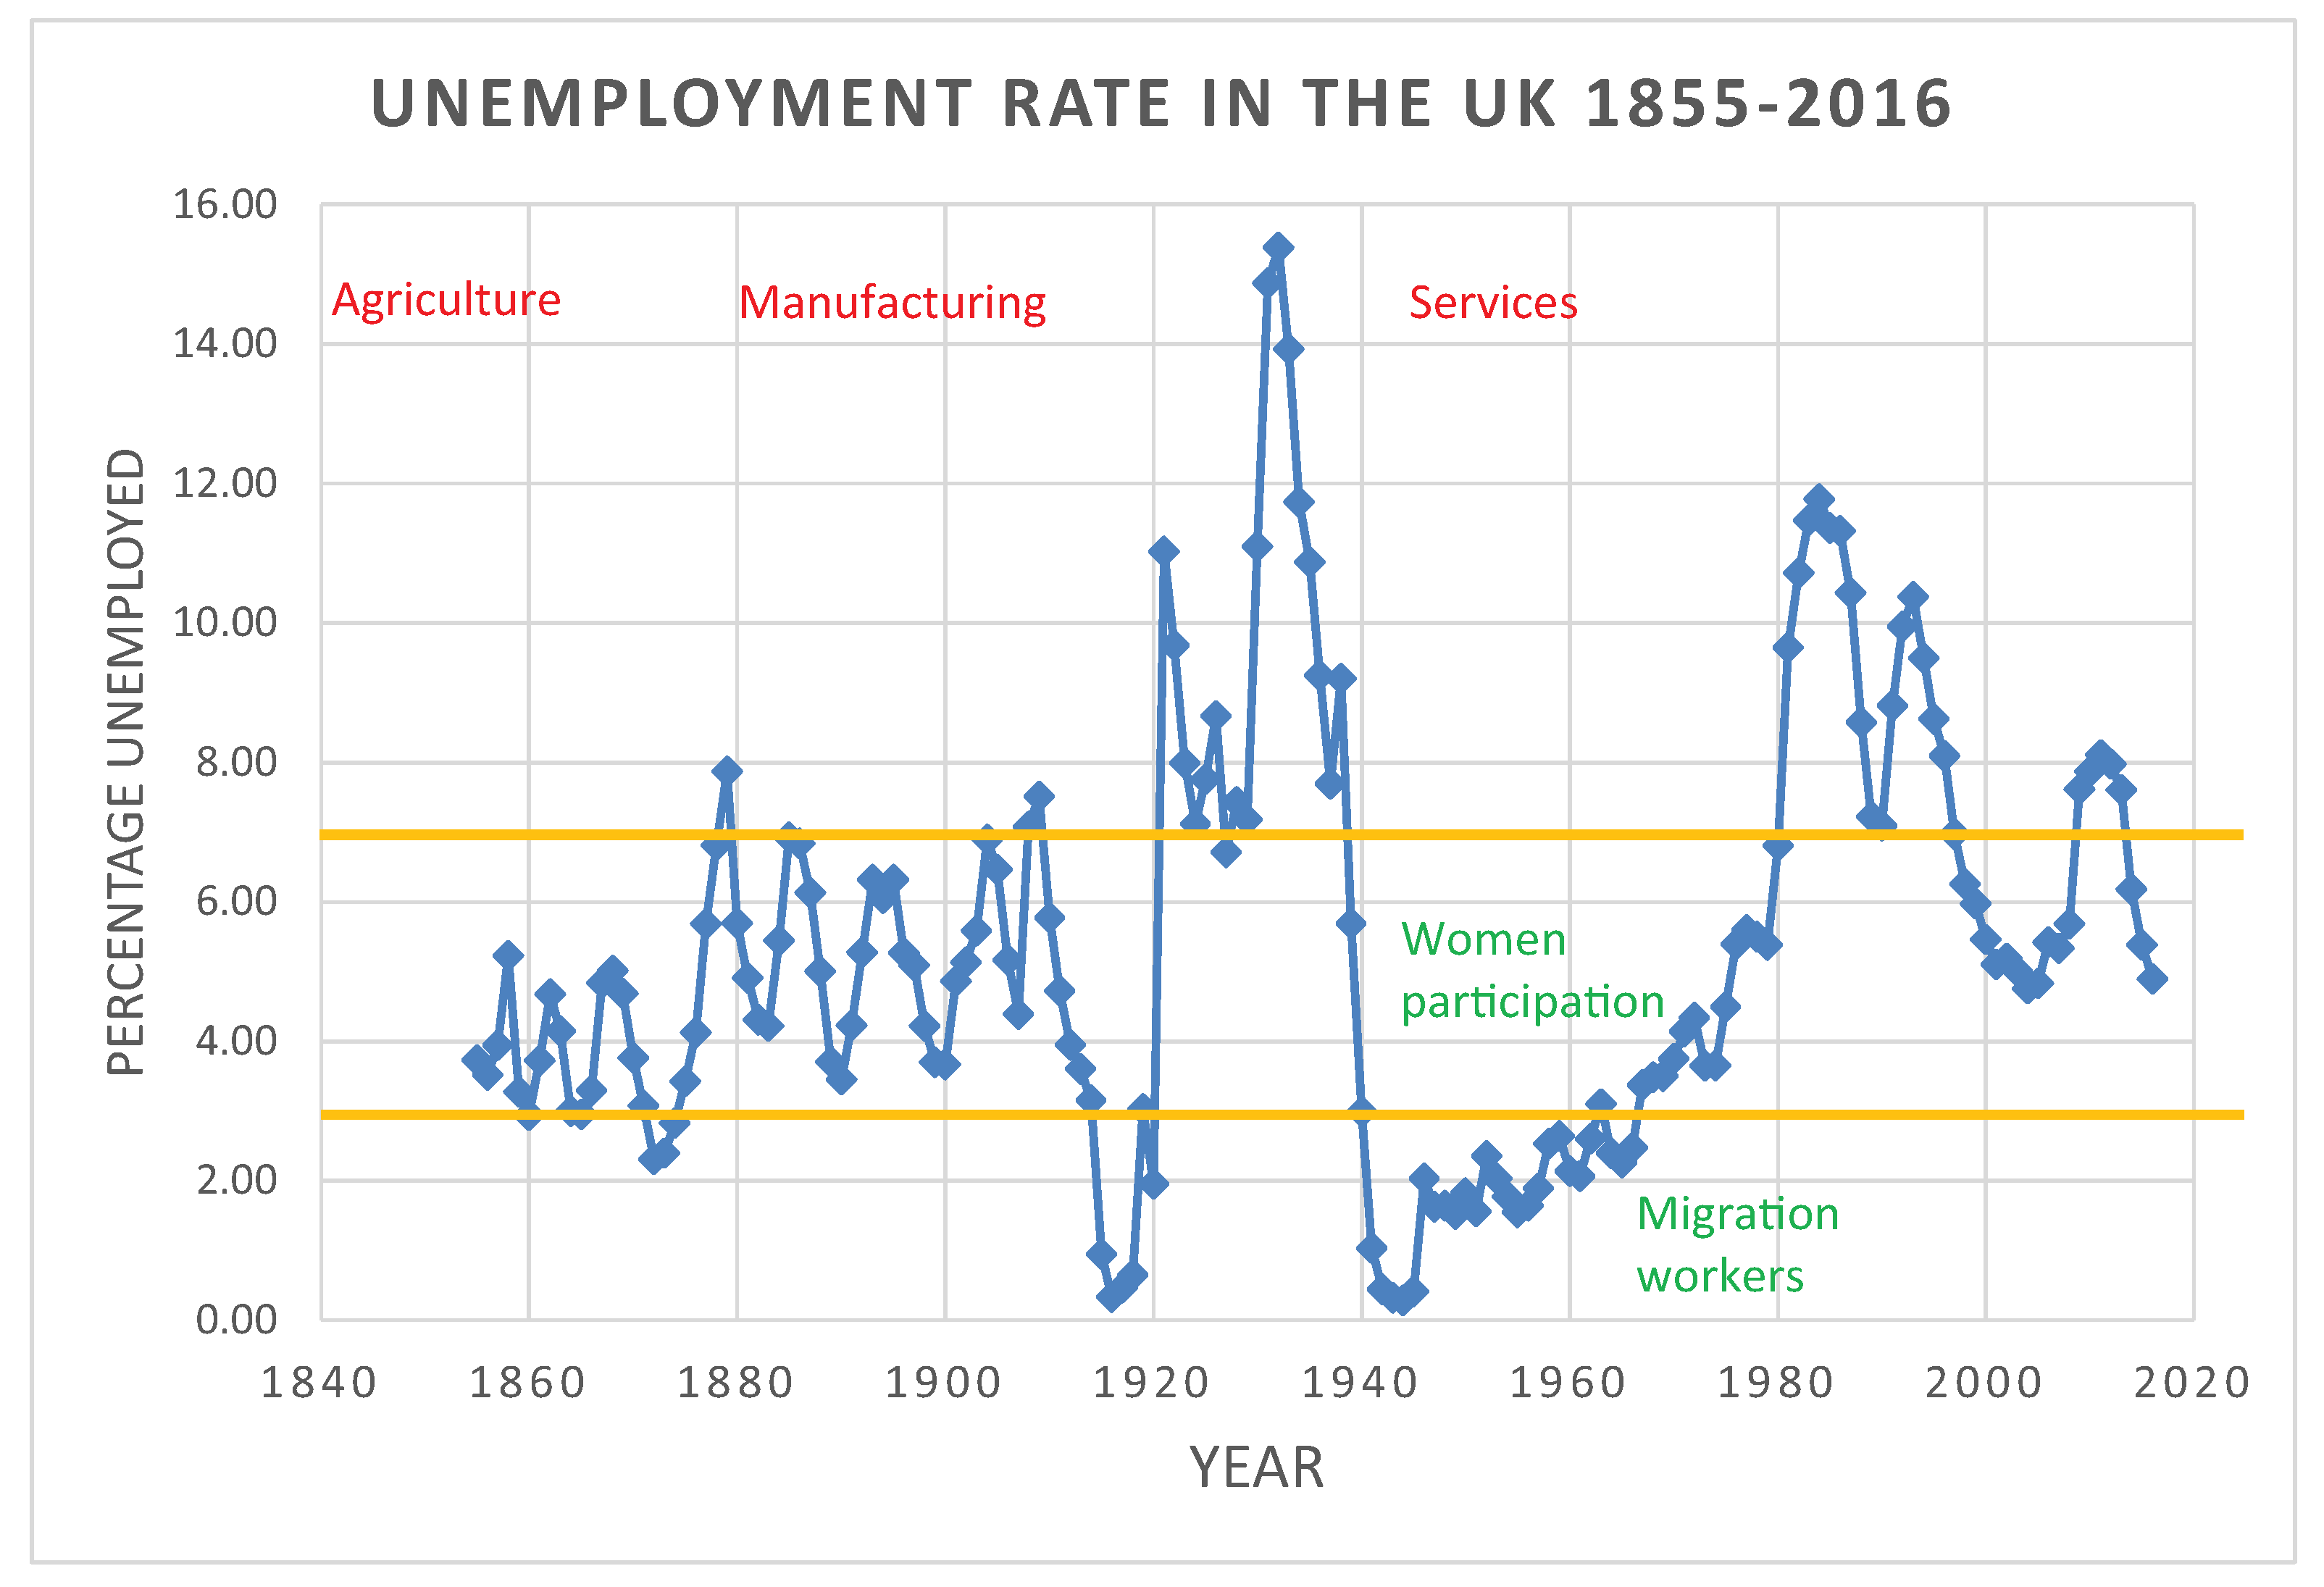
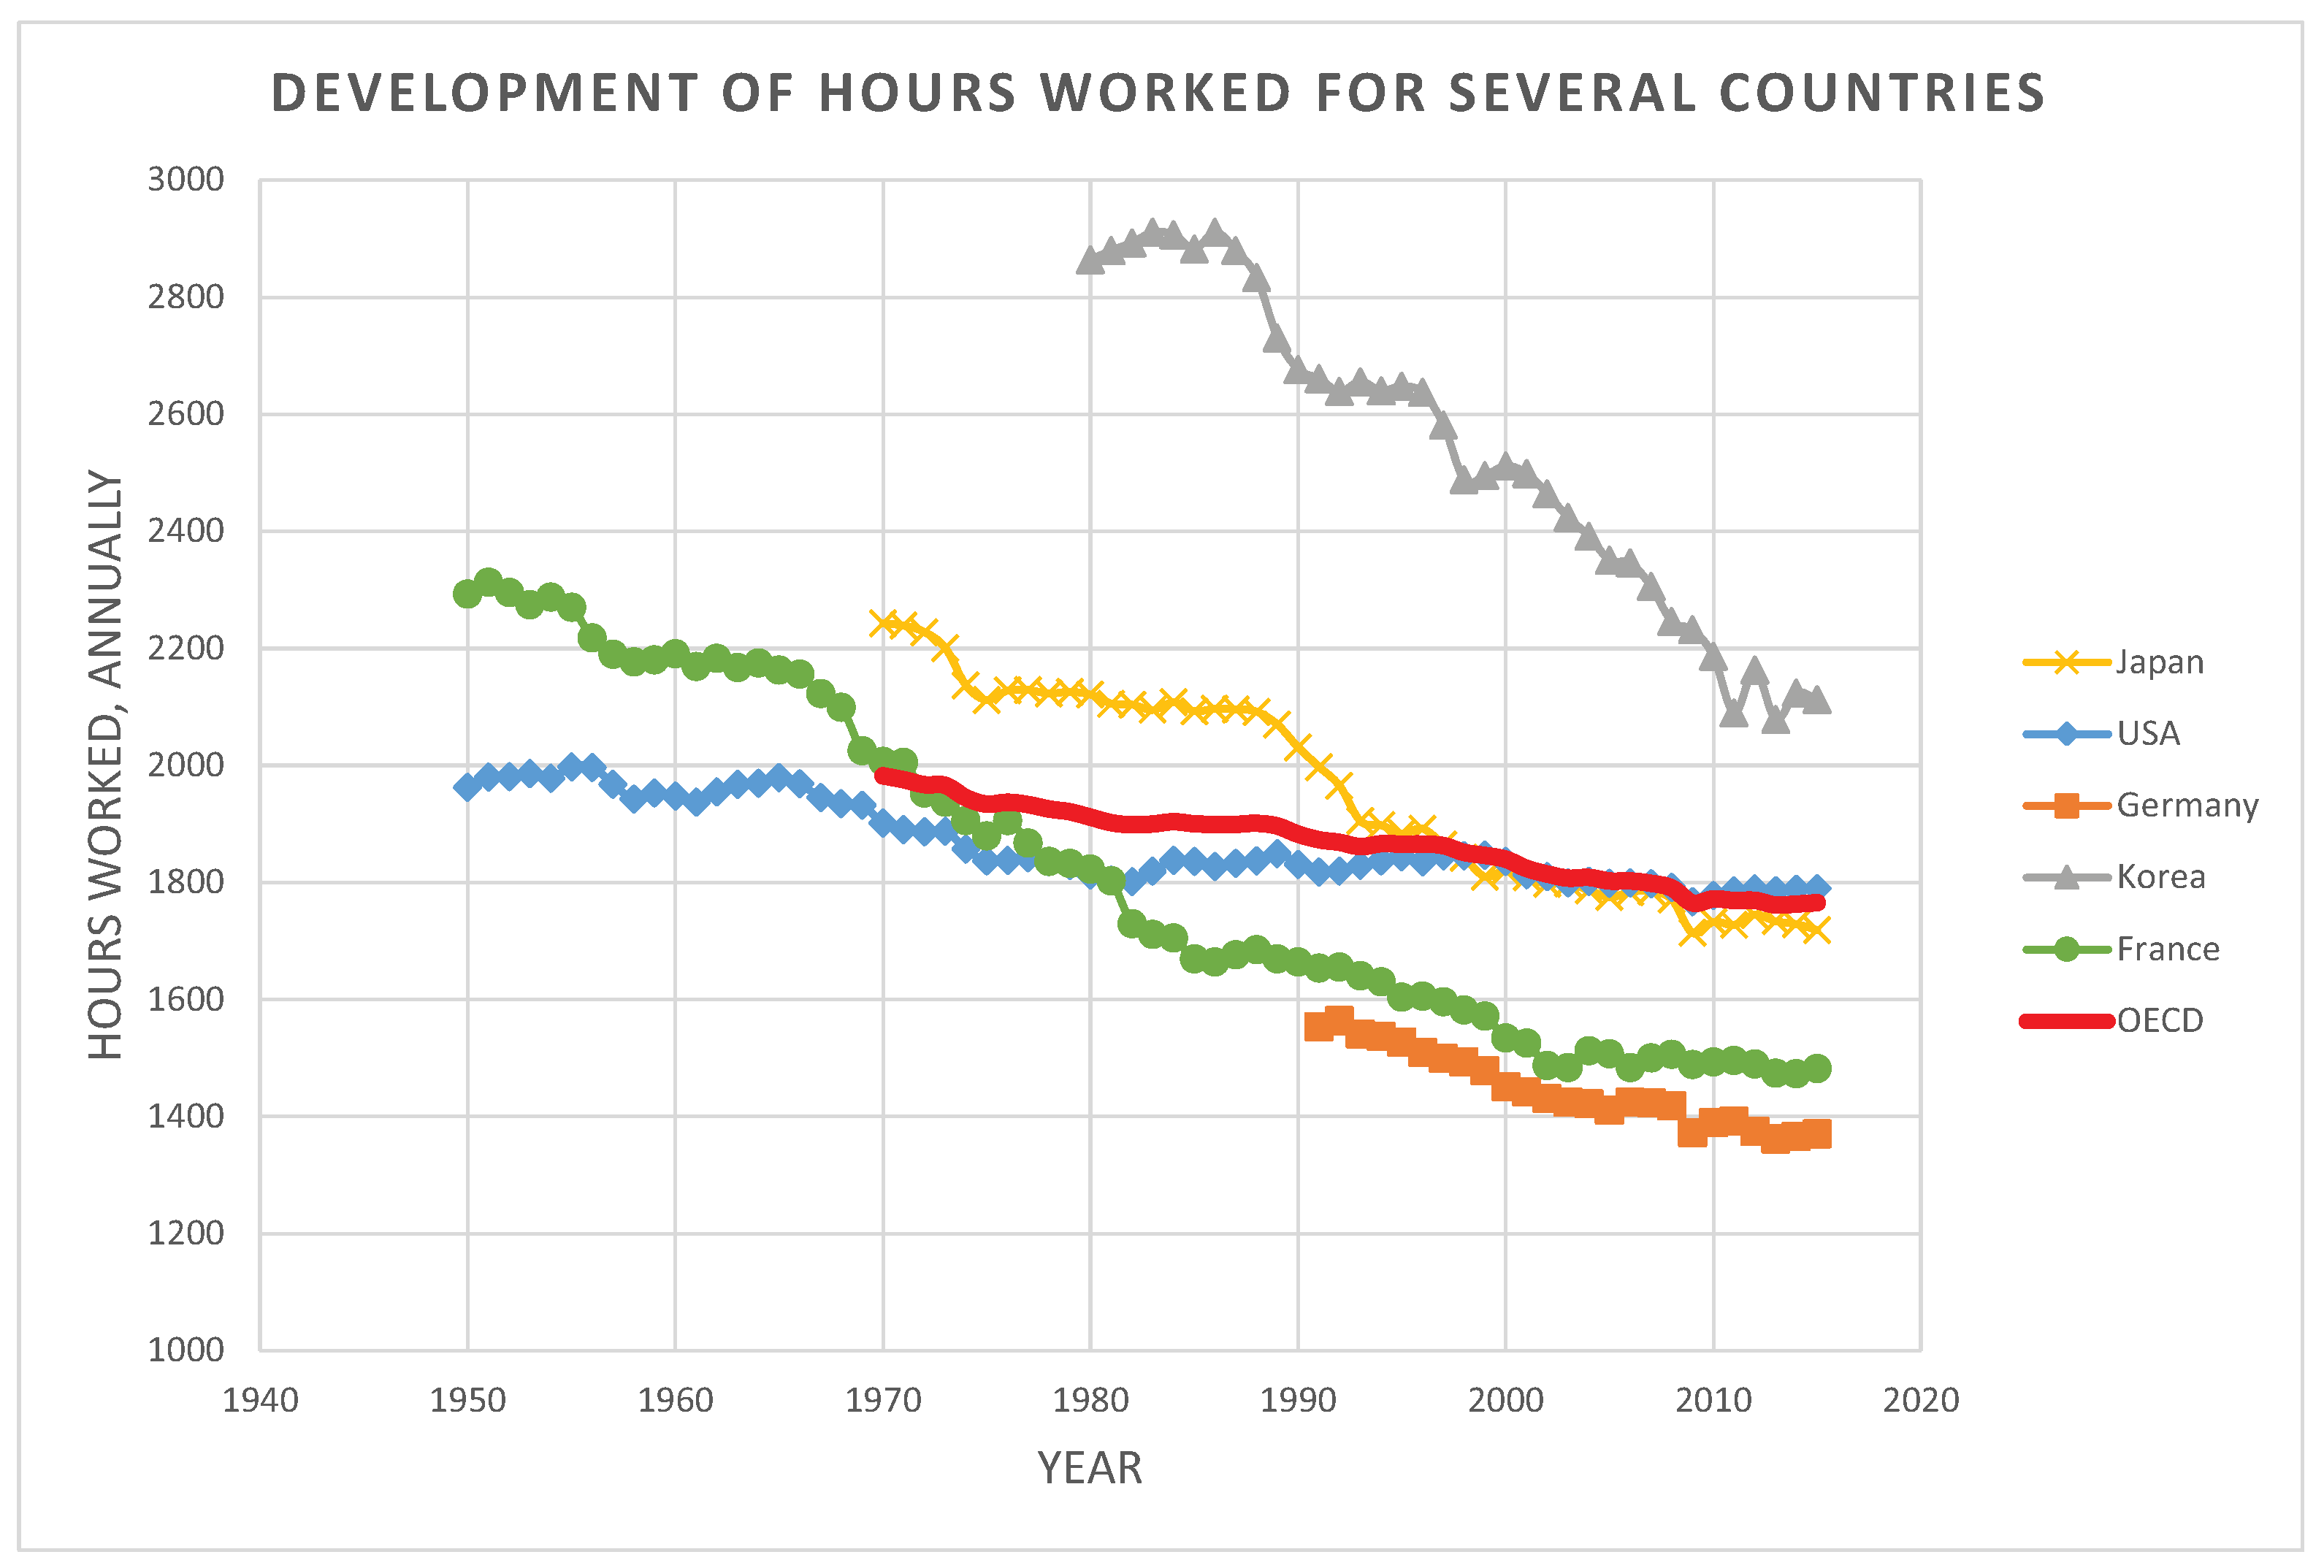
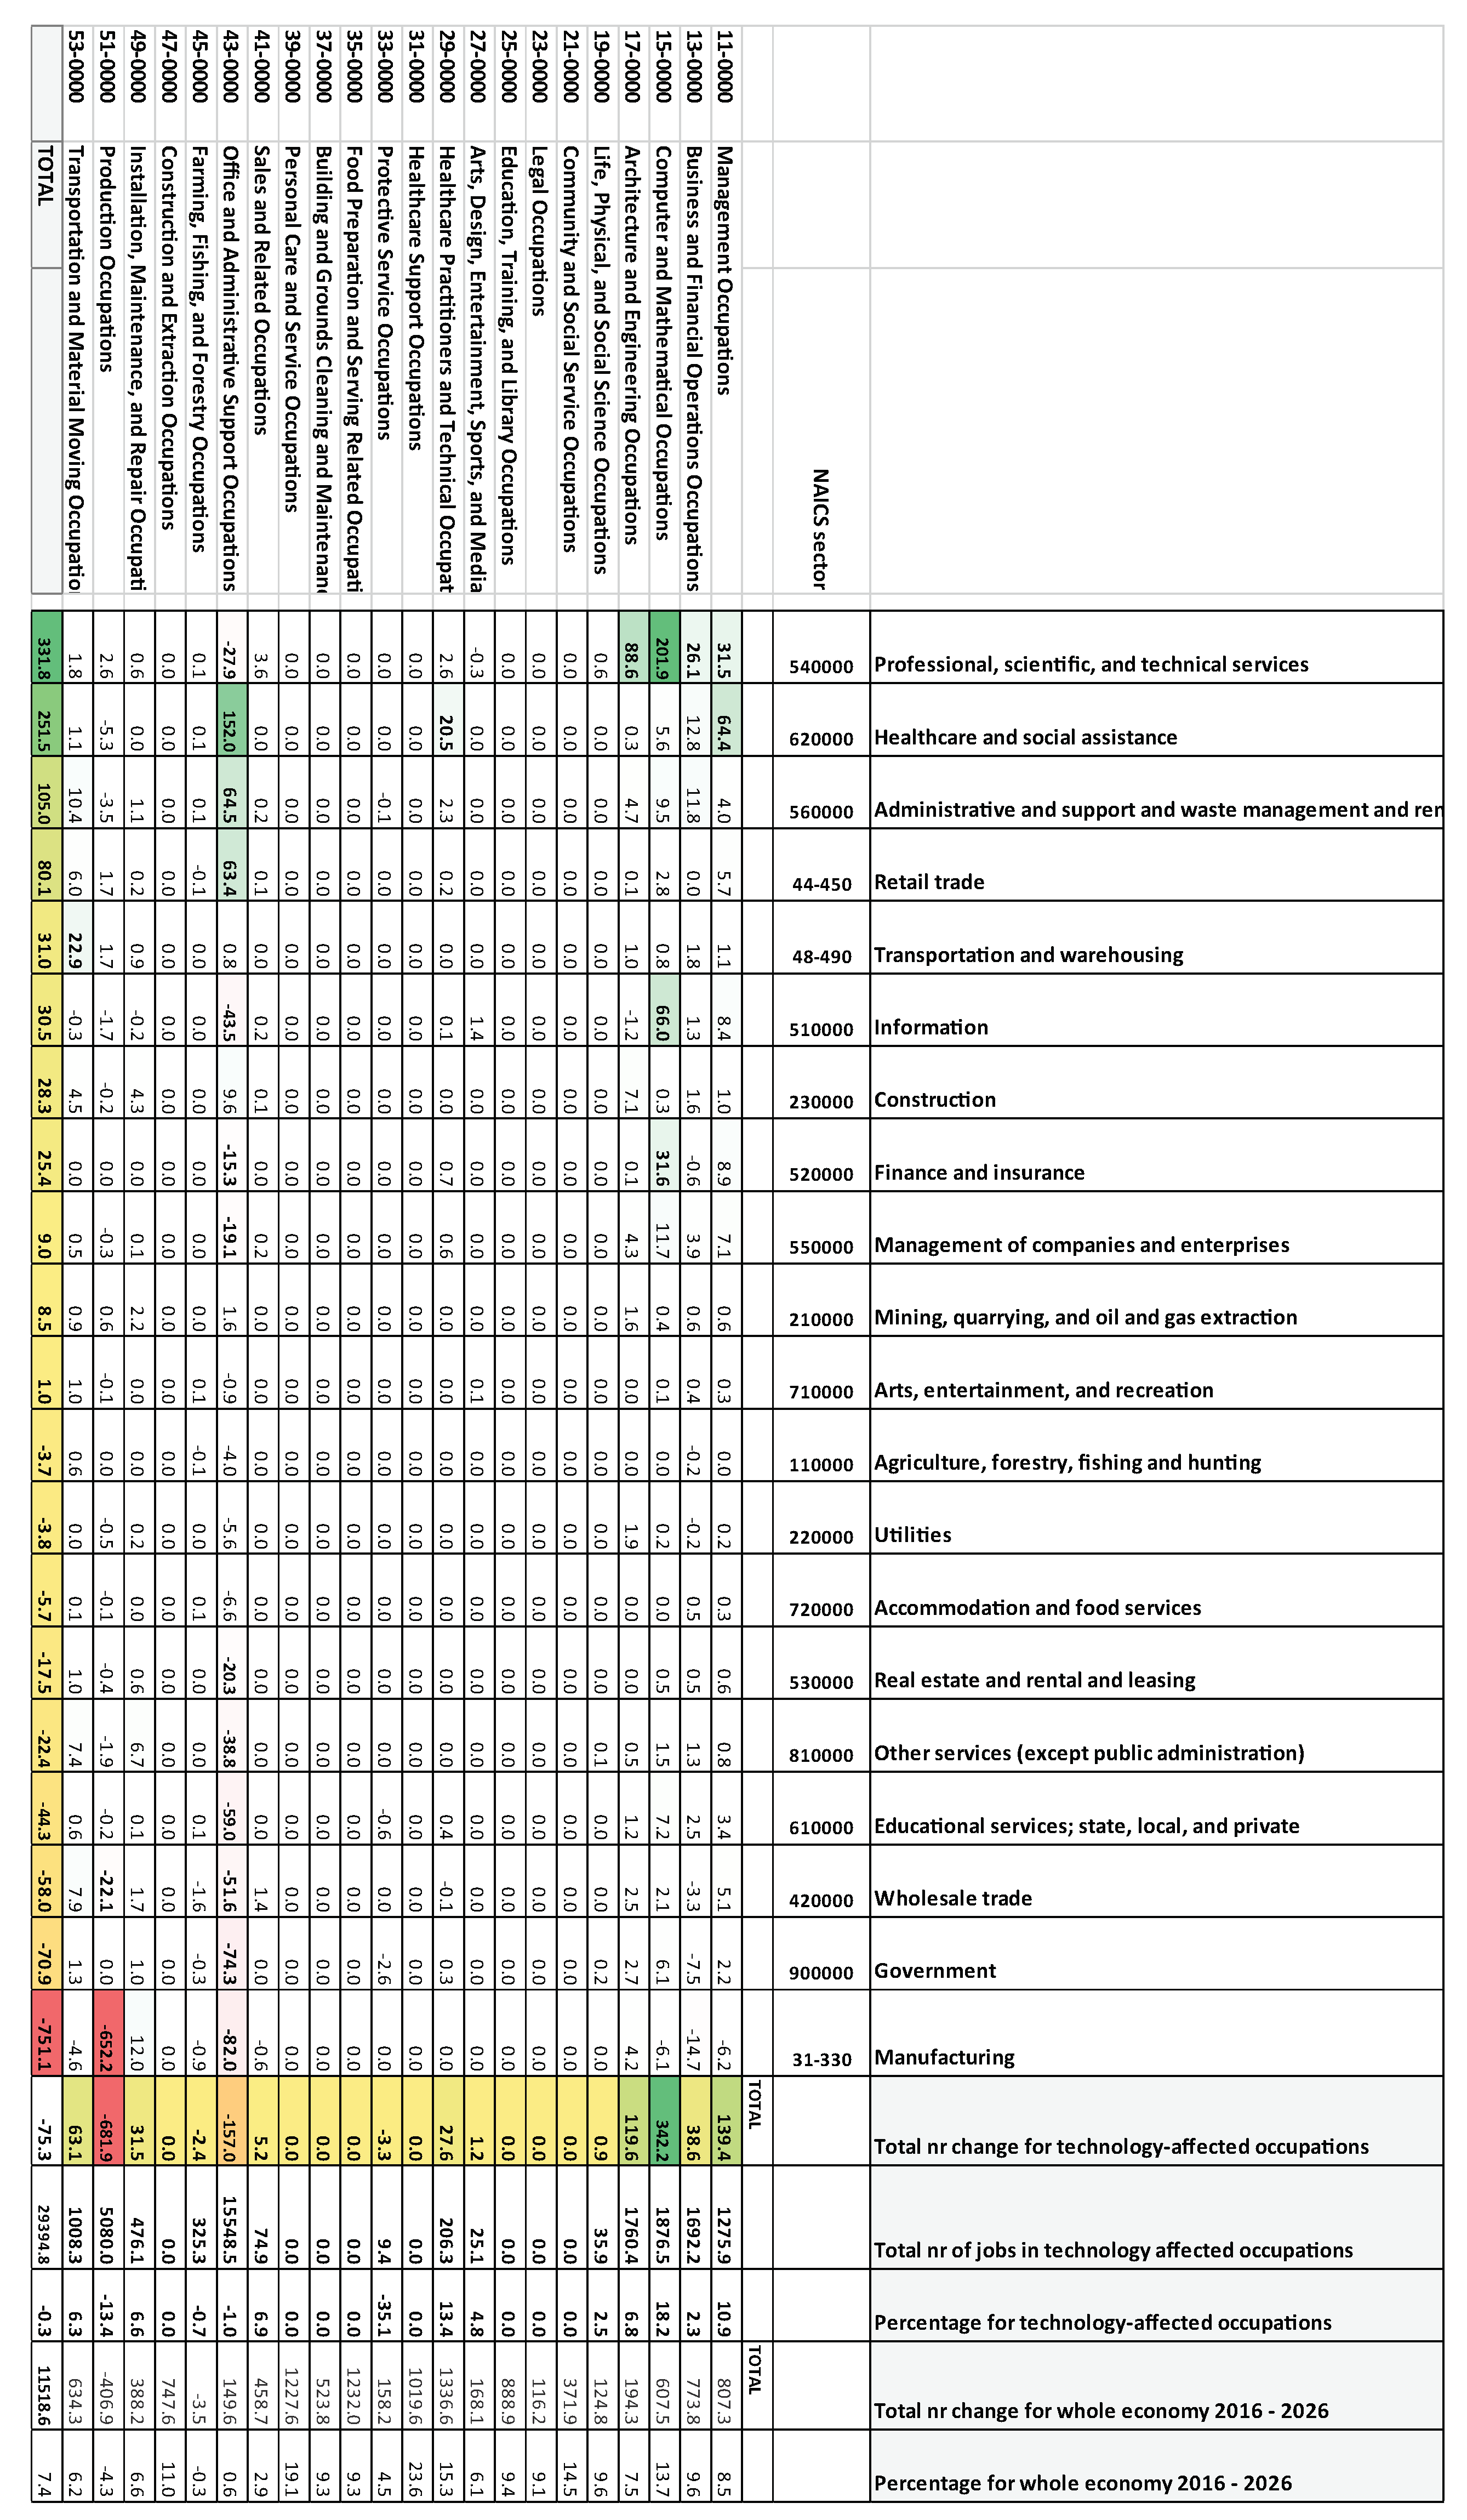
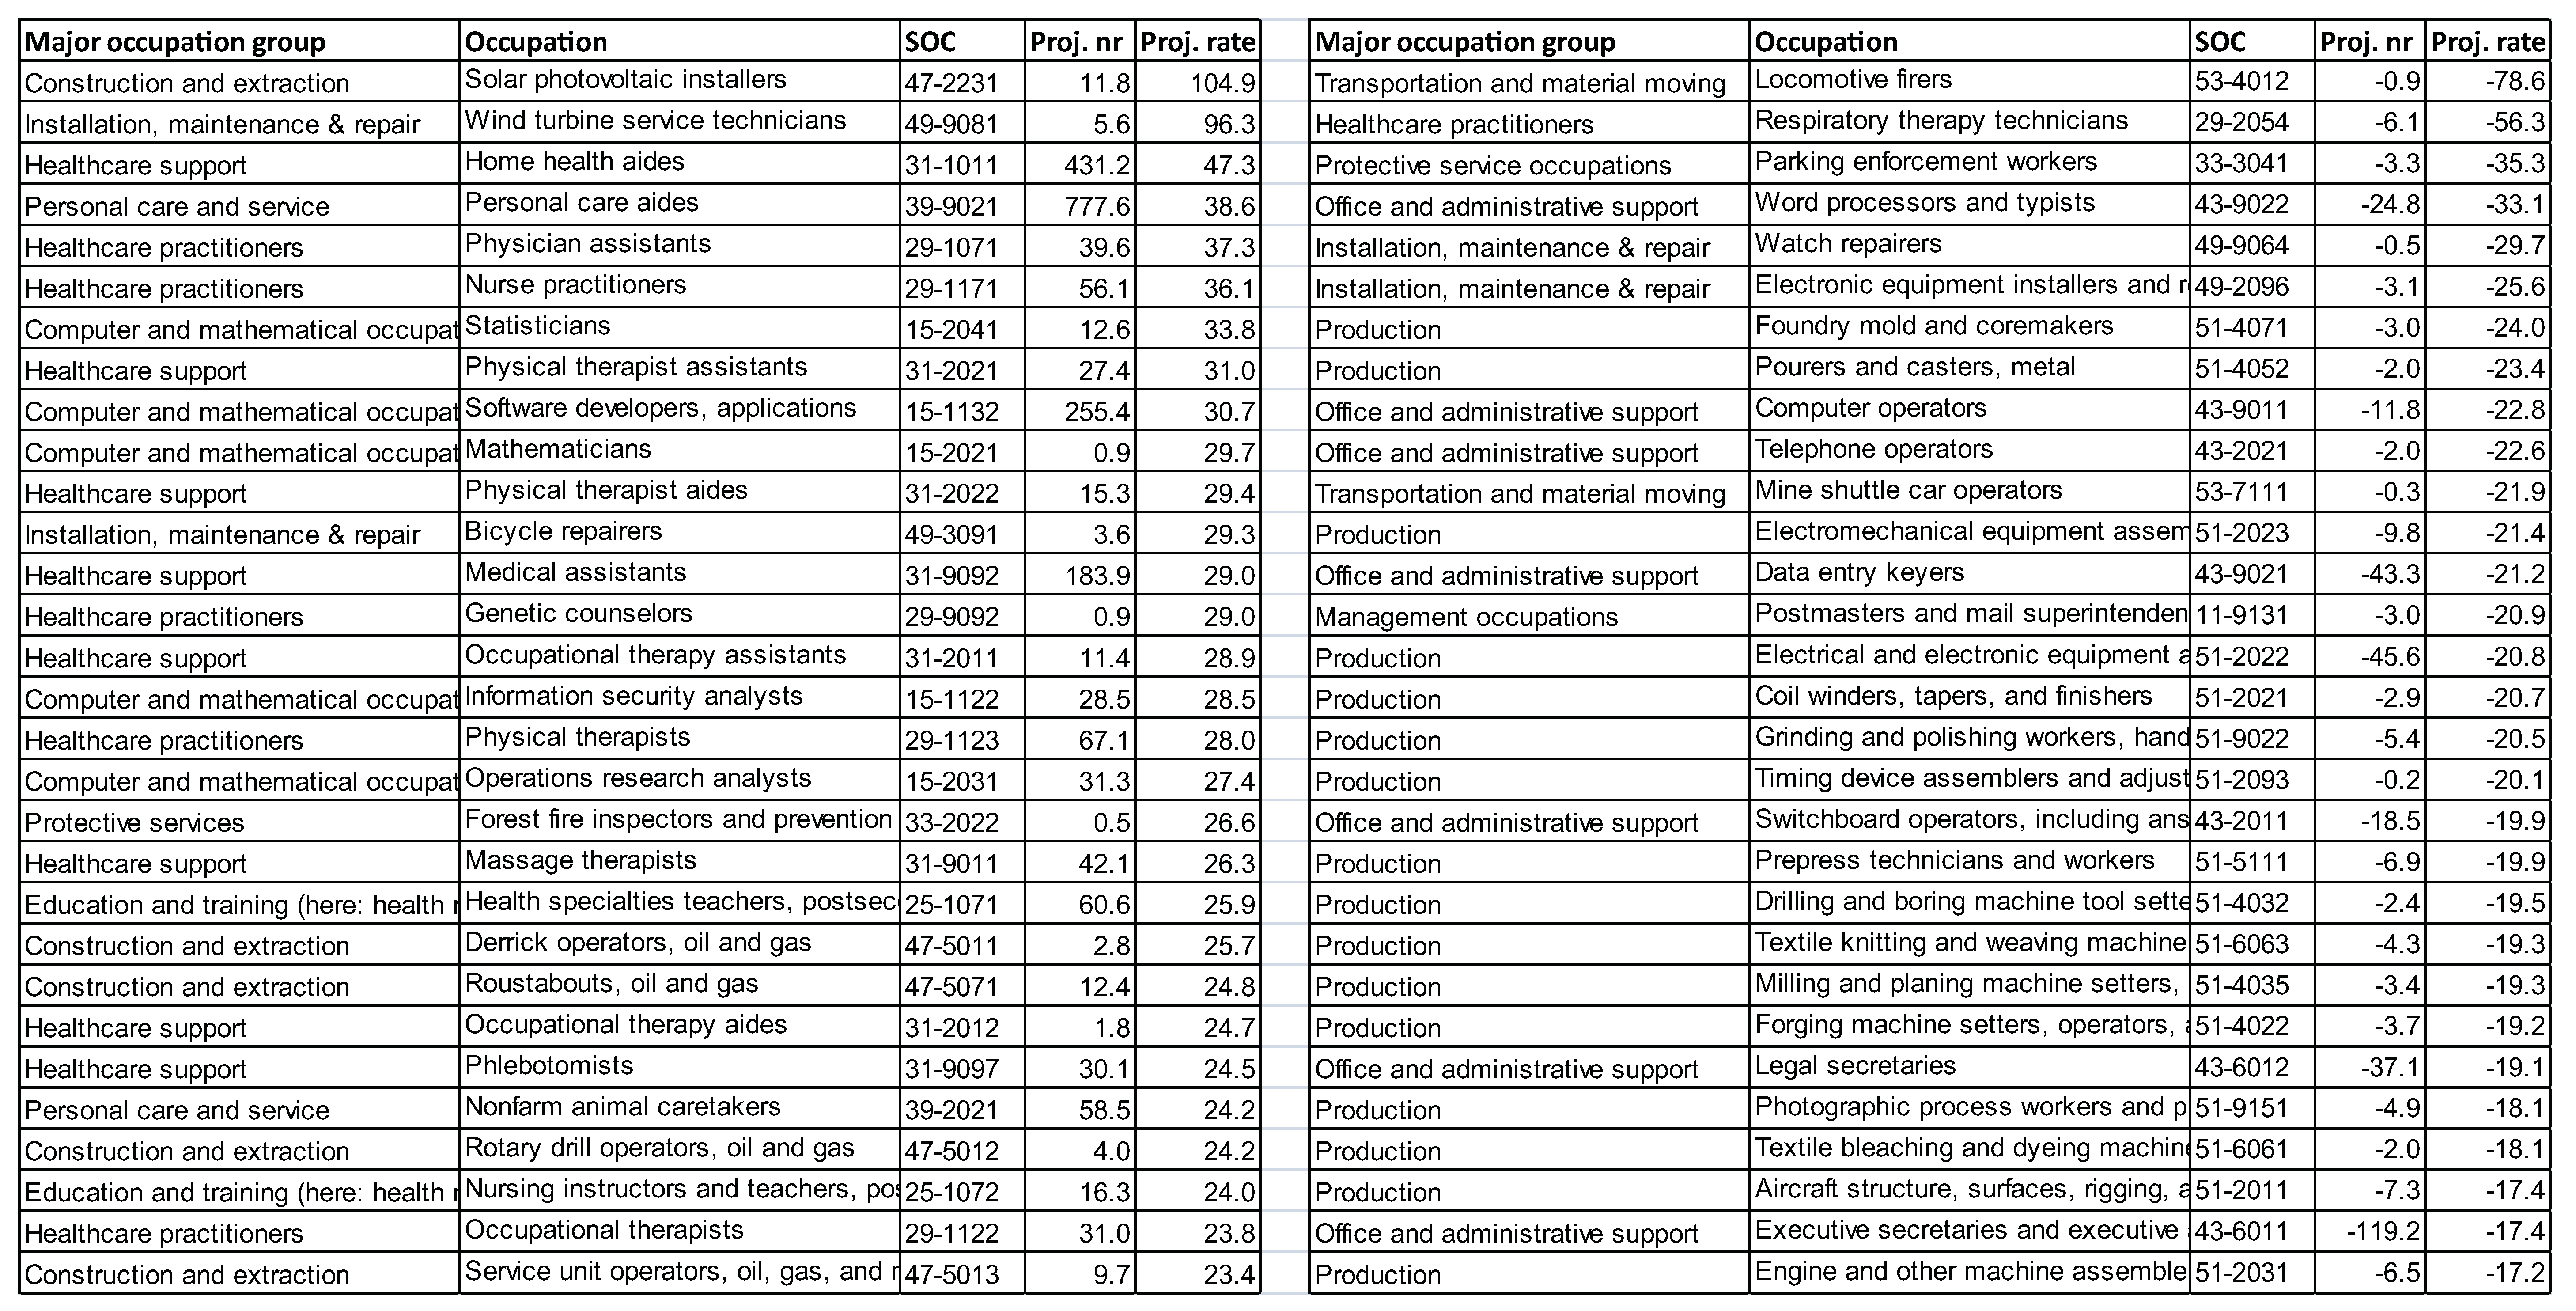
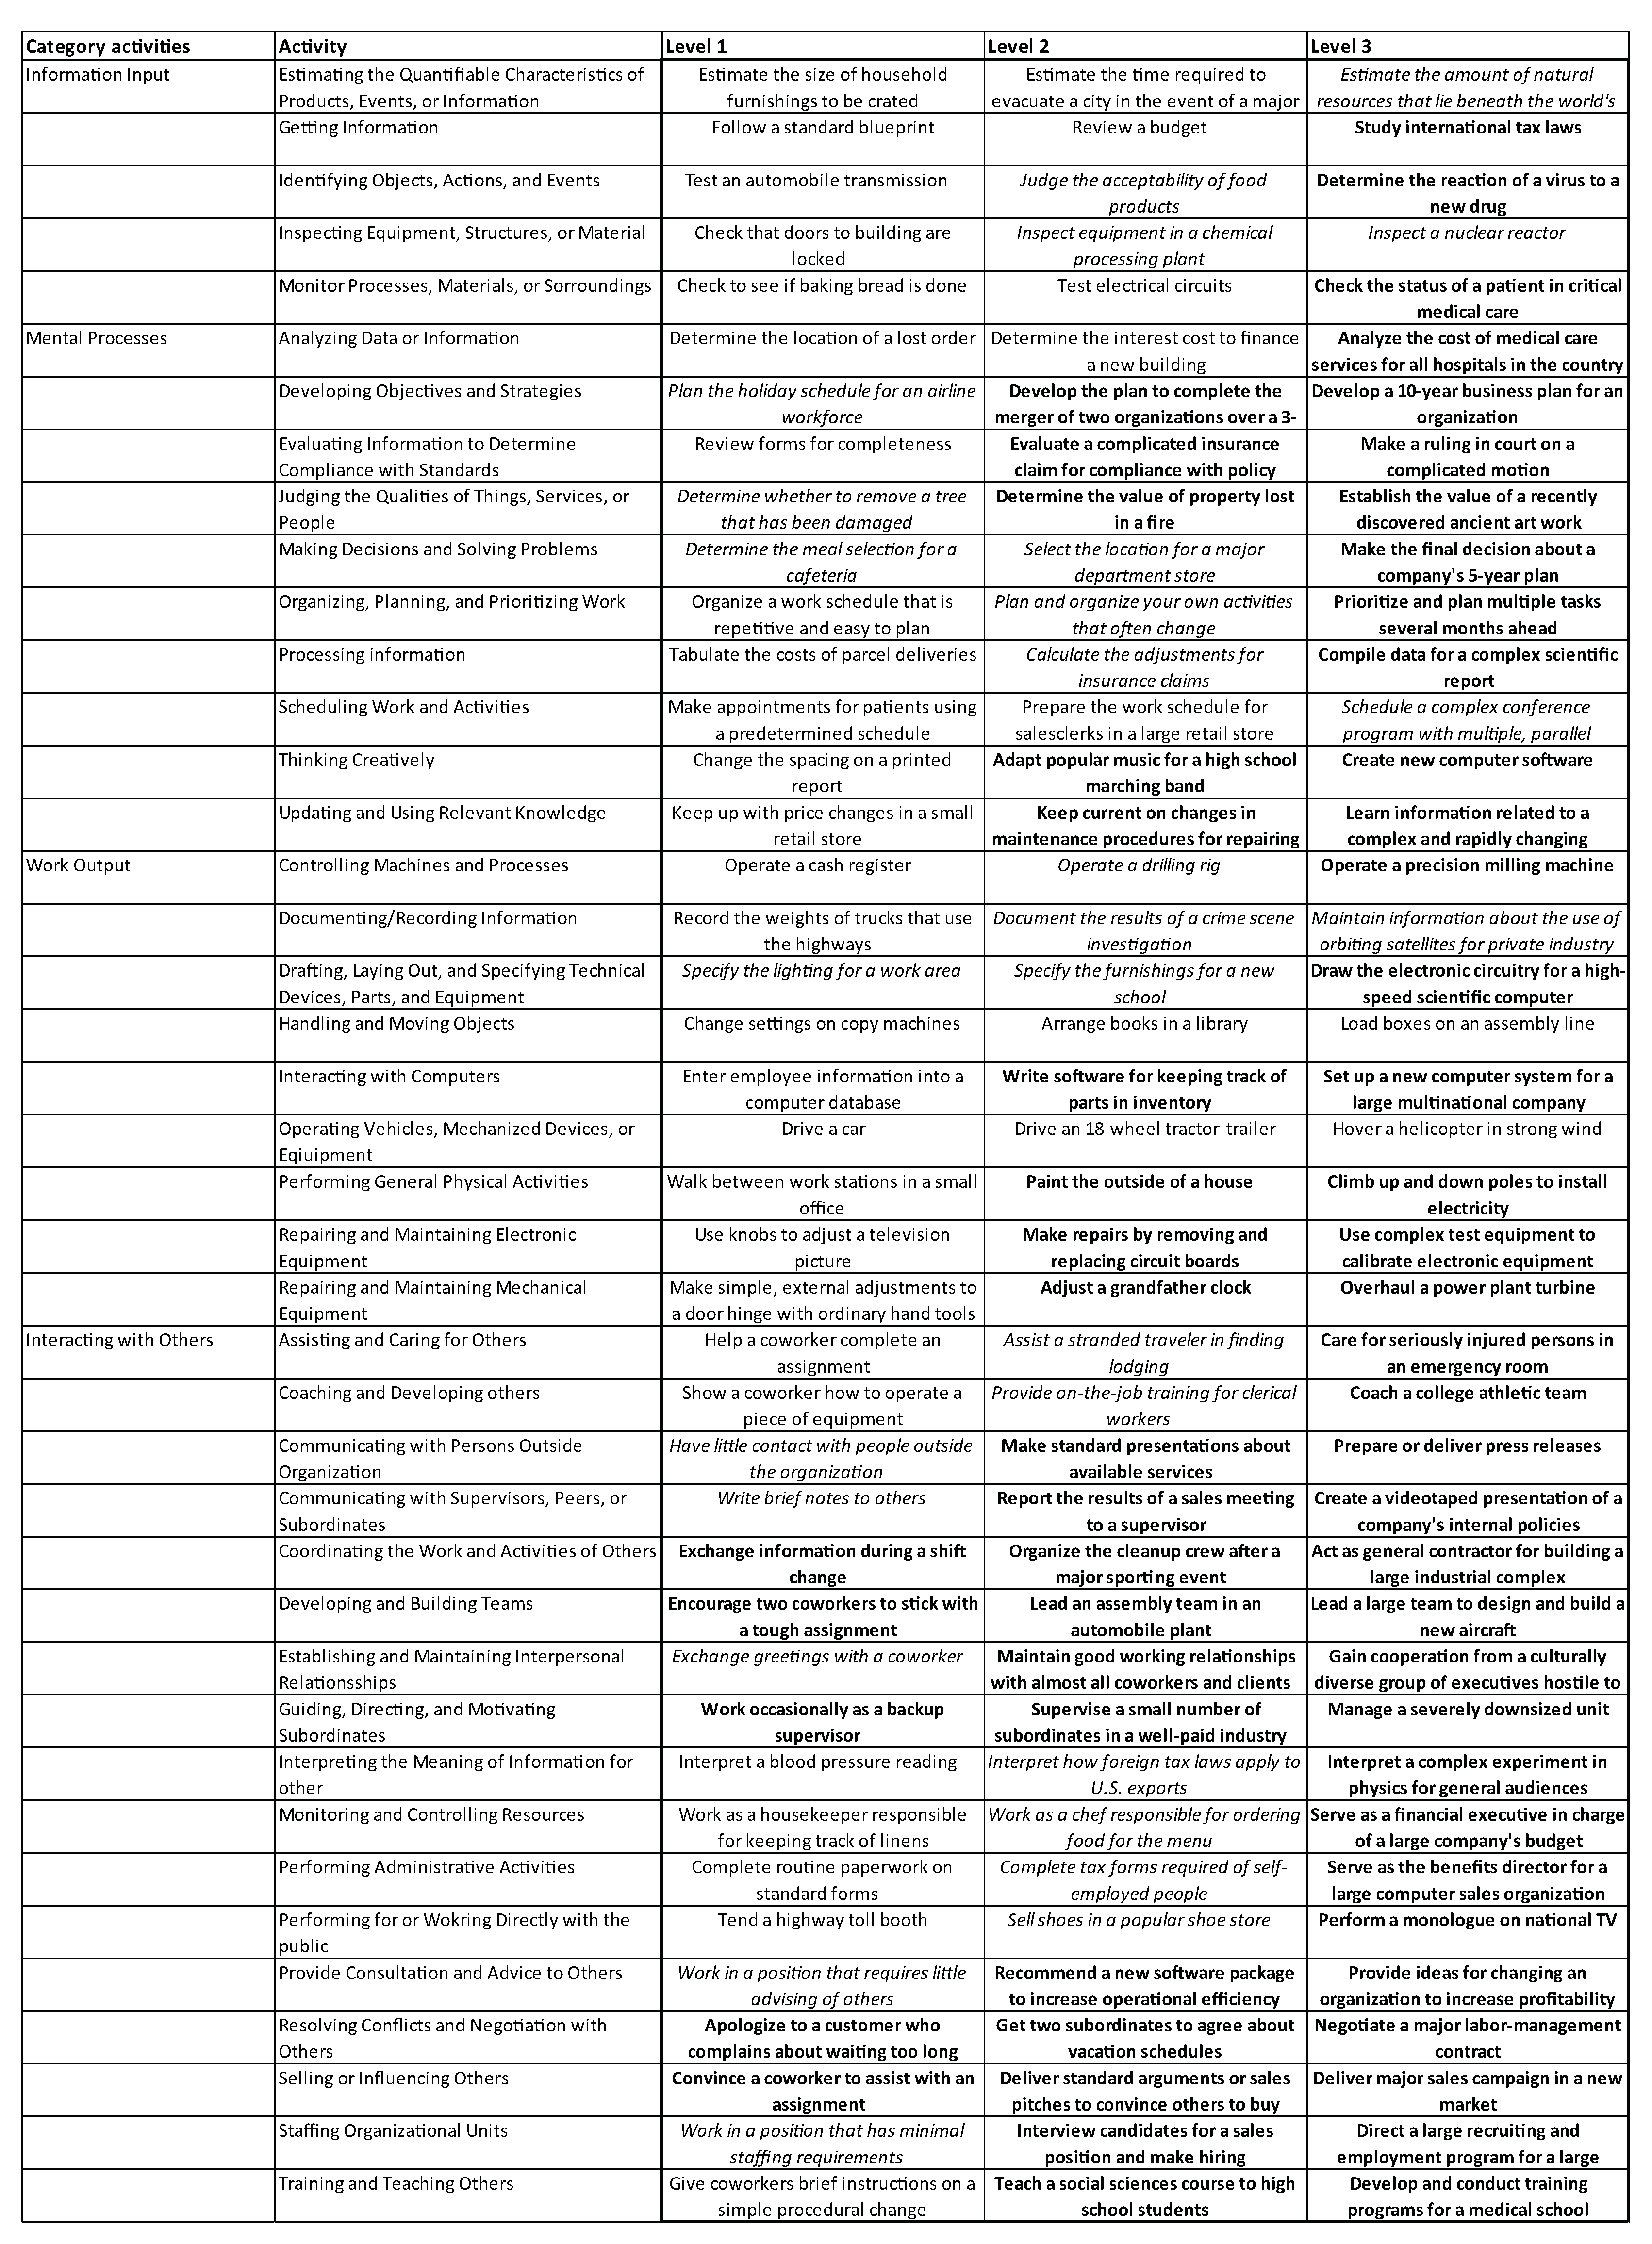
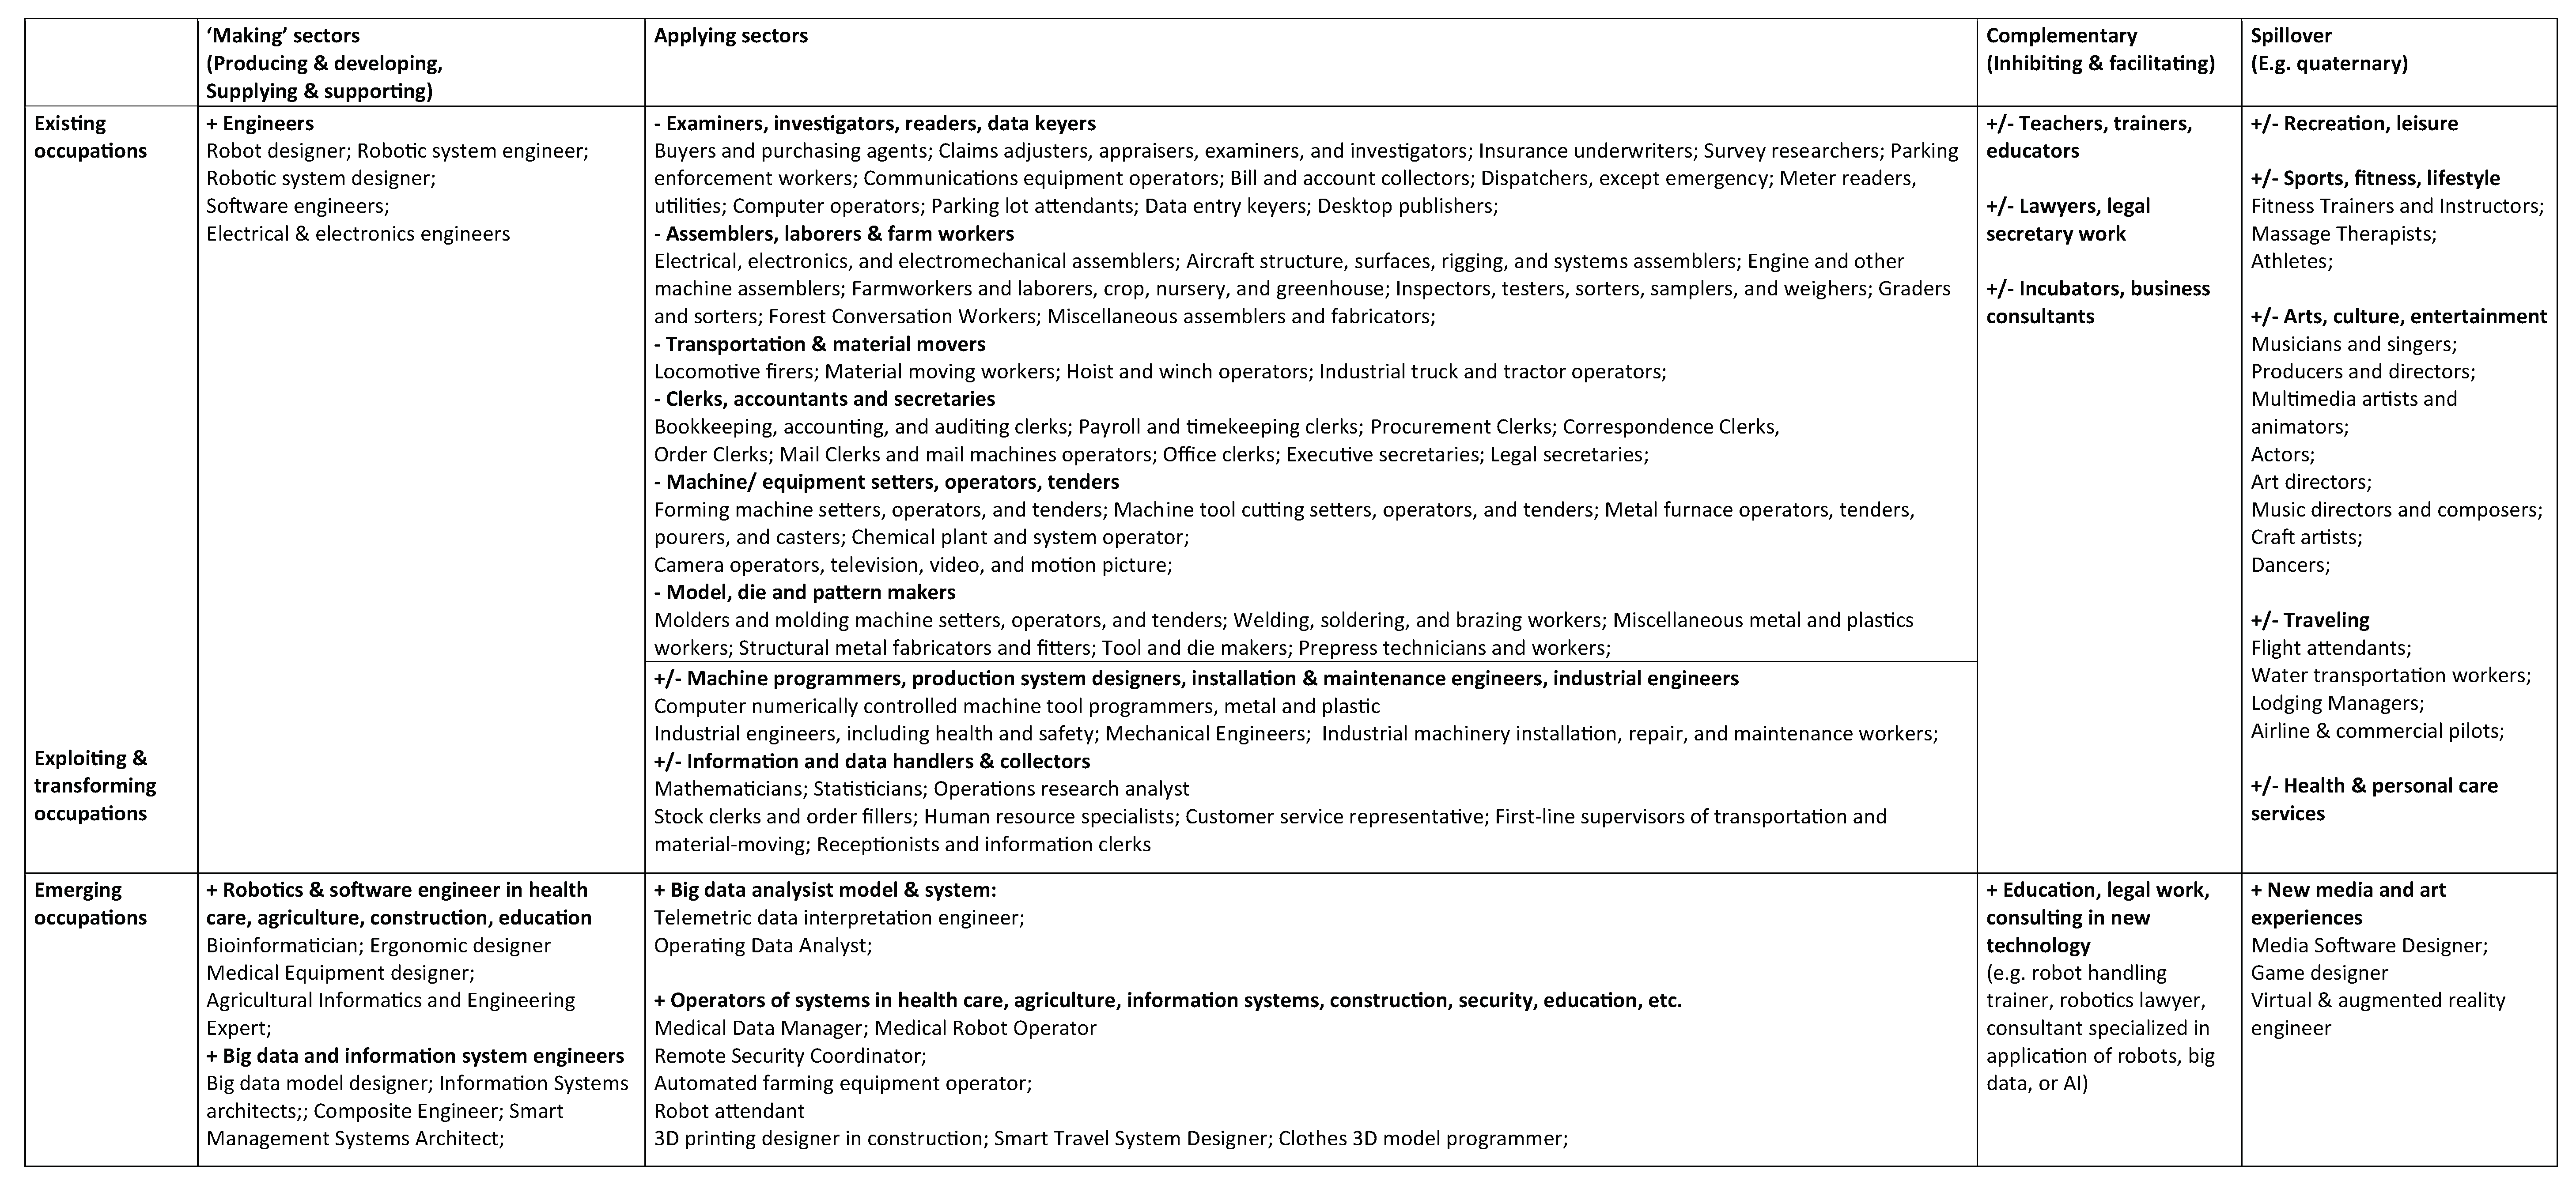
Table 1.
Disposable income and the rate of change (in percentages over 10 years and annually) over the years 1996–2026 in the U.S.A.
Table 1.
Disposable income and the rate of change (in percentages over 10 years and annually) over the years 1996–2026 in the U.S.A.
| 1996 | 2006 | 2016 | 2026 | RoC 96-06 | RoC 06-16 | RoC 16-26 | |
|---|---|---|---|---|---|---|---|
| Disposable personal income | 5829.9 | 10,036.9 | 13,968.6 | 21,178.2 | 72.2% (5.6%) | 39.2% (3.4%) | 51.6% (4.2%) |
| Disposable personal income, chained 2009 dollars | 7476.1 | 10,595.5 | 12,608.7 | 15,440.4 | 41.7% (3.5%) | 19.0% (1.8%) | 22.5% (2.0%) |
| Per capita disposable income | 21,607.6 | 33,598.2 | 43,182.6 | 60,506.5 | 55.5% (4.5%) | 28.5% (2.5%) | 40.1% (3.4%) |
| Per capita disposable income, chained 2009 dollars | 27,708.6 | 35,467.9 | 39,160.4 | 44,112.9 | 28.0% (2.5%) | 10.4% (1.0%) | 12.6% (1.2%) |
© 2018 by the authors. Licensee MDPI, Basel, Switzerland. This article is an open access article distributed under the terms and conditions of the Creative Commons Attribution (CC BY) license (http://creativecommons.org/licenses/by/4.0/).
Share and Cite
MDPI and ACS Style
Vermeulen, B.; Kesselhut, J.; Pyka, A.; Saviotti, P.P. The Impact of Automation on Employment: Just the Usual Structural Change? Sustainability 2018, 10, 1661. https://0-doi-org.brum.beds.ac.uk/10.3390/su10051661
AMA Style
Vermeulen B, Kesselhut J, Pyka A, Saviotti PP. The Impact of Automation on Employment: Just the Usual Structural Change? Sustainability. 2018; 10(5):1661. https://0-doi-org.brum.beds.ac.uk/10.3390/su10051661
Chicago/Turabian StyleVermeulen, Ben, Jan Kesselhut, Andreas Pyka, and Pier Paolo Saviotti. 2018. "The Impact of Automation on Employment: Just the Usual Structural Change?" Sustainability 10, no. 5: 1661. https://0-doi-org.brum.beds.ac.uk/10.3390/su10051661
Note that from the first issue of 2016, this journal uses article numbers instead of page numbers. See further details here.