Lighting Design for Energy Sustainability, Information, and Perception. A Museum Environment as a Case Study


Department of Industrial Engineering, University of Florence, Via Santa Marta 3, 50139 Firenze, Italy
*
Author to whom correspondence should be addressed.
Sustainability 2018, 10(5), 1671; https://0-doi-org.brum.beds.ac.uk/10.3390/su10051671
Submission received: 8 April 2018
/
Revised: 16 May 2018
/
Accepted: 17 May 2018
/
Published: 21 May 2018
(This article belongs to the Special Issue Sustainable Lighting and Energy Saving)
Abstract
:The aim of our research is to investigate the physical connection between light, perception, and information by means of an integrated methodological approach. The proposed method was used for sustainable lighting design aiming at light efficacy and quality, visual perception, communication, and energy saving. Three types of synergic measurement were carried out: photometric, colourimetric, and perception measurements. Starting from the results and the post-processing of photometric and colourimetric measurements on different light sources and fresco surfaces, by applying the eye-tracking technique for eye movement analysis of a people sample, entropy calculations were carried out. The results of observer perception and preferences, patterns of their visual scanning due to different LED (Light Emitting Diode) sources, were quantified by means of Shannon entropy calculation and, consequently, the information content of images that each light source can transmit. A new lighting proposal, based on the use of LED sources characterized by a spectral emission of light in strong compliance with surface colour and relevant transmission image content information was suggested and checked by transient simulations. Our proposal was based on sustainability because this concept is linked to developing perception and visual wellbeing, information, light communication, and lower energy consumption for maintenance, but especially for preventive conservation and the protection of works of art by means quality of light.
Keywords:
sustainable lighting; LED; entropy; information; perception; photometry; measurement; lighting simulation1. Introduction
At present, important, essential changes affect lighting, both in the research, management, and production sectors; for example, solid-state lighting system diffusion (Light Emitting Diode, LED) allowed significant energy savings and considerable advances for lighting design, but at the same time a number of issues are still the subject of debate: that is, the evaluation of disability and discomfort glare in indoor environments, as well as control of light flickering and the colour rendering index (CRI). The extensive use of LEDs led to the development and application of automatic lighting control and regulation systems. They allow light flux and spectral composition of the emitted radiation at a fixed colour temperature of the light source to be changed, providing important support for lighting designs aiming at quality, visual comfort, the health and safety of people, and energy and economic saving. However, recently, all lighting standards and guidelines (for example, CEN standards [1]; Italian National Standards [2], French International Commission on Illumination or CIE [3,4]), are undergoing continuous modifications and revisions mainly due to international research and technological, as well as industrial development, even if they are differently oriented. There is a significant body of research dealing with the selection of good lighting sources and directions [5,6,7,8]. To assess choices for lighting quality for computer graphics most approaches have relied on user judgment related to the light direction [7,8,9]. Some recent studies concern the assessment of the visual appreciation of light sources and LED in a museum environment: colour appearance and quality have been studied under different light sources and LED lighting settings [6,7,8].
Other studies have proposed artificial lighting systems designed with goals of sustainability, visual comfort, and flexibility that depends on user requirements: the objective is to provide light when and where it is needed [10]. In particular, the authors have suggested an innovative building automation system equipped with motion and daylight sensors and human interfaces with user scenarios. An outdoor design that only requires a standalone system, powered by photovoltaic or eolic devices has also been developed.
Other published research has suggested lighting design by means of energy consumption assessment connected with lighting requirements [11]. Iliadis has proposed lighting solutions specifically devoted to exhibition spaces, show-cases, and climate controlled cabinets [12]. Other authors have examined the effects of colour temperature by comparison of different observer preferences rated under different illuminants [13].
Any efficient and effective lighting design, especially within historic buildings and museums, requires knowledge of light and its connected physical, optical, colourimetric, photometric, and radiometric aspects in addition to the related energy and environmental sustainability implications.
The impact of using LEDs for lighting design based on light quality, conservation, and maintenance of works of art has also been investigated [13,14,15,16]. Some authors, by means of exposure tests, have studied the colour degradation and fading produced by LED: different white LEDs, with a different colour temperature, compared to a traditional halogen lamp, have been used to light up light-responsive samples [14]. Their experiments have demonstrated that the potential damage of LEDs is not always directly related to their correlated colour temperature (CCT); the swatches faded more slowly under LED with the highest CCT, they do so faster under a halogen lamp and thus, the use of CCT as an effective predictor of material degradation is not consistent with LEDs when considering fading induced only by the Blue Wool Standard [14]. Most recent literature regarding the optimal and energy sustainable lighting design for museums has also demonstrated that cognitive psychology and new technologies such as eye tracking for assessing, interpreting, and measuring eye movements, respectively, can be used in museums [17,18,19,20]. Physics, optics-photometry, and Information Theory can suggest important supports for lighting design addressing energy sustainability, information and communication by the quality of light, visual perception, visual comfort, in particular when it addresses Cultural Heritages. Some research has demonstrated how Information theory, more specifically entropy, can be used to derive meaningful values on a quantitative scale, to quantify the complexity of individual switching patterns and scanning behaviour of various observers [20,21,22]. Krejtz et al. [21] have posited the Shannon entropy calculation for assessing the distribution of eye fixations (that is, attention and interest) over different AOIs (Areas of Interest) of works of art. The power of the entropy concept used by these authors is that one can calculate a real quantity of “information” present: results obtained have shown that highly curious participants produce lower transition entropy levels (that is, entropy due to the gaze transition from one AOI to another) while viewing the artwork connected to a more locally oriented pattern of visual scanning and higher information content. At the same time, greater stationary entropy (that is, entropy related to the stationary distribution of fixations inside the same AOI [21]) which means that visual attention is distributed more equally among AOIs, is connected to their similar interest due to less information content.
Hooge et al. [23] have demonstrated that scan path entropy is a sensible measure for gaze guidance: they used eye tracking for testing fixations inside different AOIs and an entropy evaluation method to obtain a gaze plot and guidance related to different visual paths [23]. These authors have shown that a gaze guidance producing fewer paths than possible but favoured by the observers provides lower entropy.
There are also some recent studies that have highlighted differences between problem-solving approaches by experts and those by novices, using an eye-tracking technique and scan path entropy from an educational viewpoint [24,25]. In particular, starting from the eye-tracking measurements on eye movements in the areas of interest (AOI) during physics problem solving, the relationship between student success and the format they chose, when compared with the multitude of representations, was assessed by Shannon entropy [25,26].
In our research, we provide an integrated methodological approach for luminous climate assessment and a new lighting proposal in a museum environment. It was based on a sustainability approach, for developing perception and visual wellbeing, information, light communication, lower energy consumption for maintenance, but especially for preventive conservation and the protection of works of art, through the quality of light.
Starting from photometric and colourimetric measurements on different light sources and fresco surfaces, measurements with an eye-tracking technique for eye movement analysis (saccades and fixations of an observers’ sample) in order to evaluate the influence of different types of light on the bottom-up and top-down processes, vision and perception, were performed. Information based on the Shannon entropy calculation [26], was applied to find out the correct choice of LED sources that, characterized by a spectral emission light in compliance with surface colour, could enable a relevant transmission of information content of the images (that is, lower entropy production due to visual patterns and eye movements in different AOIs that mean higher information and higher attractiveness for the observers). Simulations applied to a 3D model of the museum environment studied, validated and calibrated by experimental data, were carried out to define a dynamic, reversible, and sustainable LED lighting solution that can also guarantee conservation and preventive protection of works of art.
2. Materials and Methods
2.1. Experimental Set-Up and Measurements
All the experimental measurements were carried out in the museum environment of Villa La Quiete in Florence (Italy) and they can be grouped into three types of synergic measurements because they are strictly connected with and oriented to a lighting design aimed at energy sustainability, information, and perception. In particular, they were performed on one of the two famous frescoed “Stanze della Signora” (Rooms of the Lady).
The first photometric, colourimetric, and perception measurements performed were provided and discussed in Reference [27]. In the present section, the synthetic description and explanation of the experimental set-up, wider experimental measurement campaign, and integrated methodological approach used is provided.
The illuminance levels were measured at each point of the experimental grid defined referring to CSN EN 12464-1 [28] on the floor, using a standard technique with a digital lux meter and an operative methodological scheme to reduce the execution time and improve sequencing. The illuminance levels were also measured on all the four walls at many significant points correspondent to those where colourimetric measurements were performed: this allowed for a better calibration of the lighting simulation model.
The measurement technique with a spectrophotometer, applied to the surface portion with the dominant colour of the frescoes, was the method for measuring the fraction of the visible radiation intensity that the same surface reflects by diffusion at different wavelengths. The spectral distribution change of the reflected radiation, with respect to that due to incident radiation, provides the surface colour: choosing a repeatable and internationally coded measurement method, an experimental set-up for which the light source was placed at 45° with respect to the object was defined.
Measurements were performed at the front (configuration 45/0), so that the specular light component (that is, reflective specular radiation component referred to a particularly shiny object) was not present in the visual field of the instrument equipped with a camera lens, that “looks” at a given area on the pictorial surface and analyses diffused light coming from that area.
The spectrophotometer was connected, by an RS-232 serial cable, to a notebook, for continuous data acquisition. The numerical values that describe the spectral curve, luminance, and chromatic coordinates (x, y) that are a measure of the light colour were deduced. It was used together with its own white reference tile (Spectralon® Labsphere) to measure the spectral distribution, luminance, chromaticity, and colour temperature of the tested light sources.
The standard deviations of all the experimental data provided an error that is much lower than 1% corresponding to the instrument accuracy.
The eye-tracking technique application was used to understand how and how much a specific light source affects vision and perception processes. The Tobii Pro Glasses2 equipped with a functional unit for data collection (the Tobii Pro Glasses Controller) and the software Tobii Pro Analyzer for output data processing were used. During this type of measurement, the light of the chandelier was always kept off in order to eliminate any interference with the light of the tested LEDs.
The eye-tracking measurements were made on a sample of 15 participants (8 women and 7 men), aged between 20 and 45, with normal vision, using the Villa Castello (North) fresco as a test.
The eye-tracker instrument records all the eye movements and some behaviour related to the perceptive and cognitive mental activity. The Tobii eye-tracker wearable glasses recording data at a frequency of 30 Hz were used. Using the Tobii Studio software, the visual scan path with the corresponding stimulus can be overlapped. Before proceeding with the measurements, the Tobii Pro Glasses 2 was calibrated on each observer for recognizing the gaze convergence coordinates.
The following instructions were read out loud at the beginning of each test (in Italian, of course): “during the experiment you should concentrate on the wall painting, trying to exclude, as far as possible, the boundary and expressing your own preference for the fresco, as the selected light scenography changes”. The LED sources were positioned at a distance of 3 m from the wall paintings; the distance between the fresco and the participants was 1.5 m. The experiment was divided into three tests corresponding to the three tested light sources. During each test, the fresco (on the North wall, Villa Castello fresco) was lit in sequence with each different LED for 15 s. In the end, each observer expressed her/his preference for the first, second and third light source.
The method was validated comparing experimental settings, measurement protocols, boundary conditions, and the results with fundamental published research on eye-tracking technology applications [23,24,25,29,30,31]. Technical data of the instruments used are as follows: Lux meter CL-200A Konica Minolta, with a silicon photocell of spectral resolution within 6%, 0.01–299,900 lx measuring range and ±2% ± 1 accuracy; Spectrophotometer/radiometer CS 1000 Minolta, with 380–780 nm wavelength range, 5 nm spectral bandwidth, 0.9 nm wavelength resolution, ± 0.3 nm spectral accuracy and 0.01–80,000 cd/m2 Luminance range; Eye Tracker-Tobii-Glasses 2, with dark pupil Corneal reflection, 30 Hz sampling rate and four sensors.
2.2. The Case Study
The first of the two frescoed rooms, called “Boscherecce” (wooded landscapes) and known as the “Rooms of the Lady” is the case study. The room is 6.80 m wide and 8.90 m long, with a height at the base of the vaulted ceiling of 4 m, 5.60 m at the highest point and 5.42 m at the intermediate point corresponding to the change in curvature of the vault. The room has a single window always closed, by both internal and external shutters (natural light access is therefore completely absent). During the experimental measuring campaign, the wooden entrance door was always kept closed to eliminate interference effects due to the light coming from the adjacent corridor. The artificial light coming from the antique chandelier in the centre of the ceiling is due to 9 Zafiro-LED sources, with the following nominal data: 4 W power, E14 connection, 470 lm of luminous flux emitted, and 2700 K colour temperature.
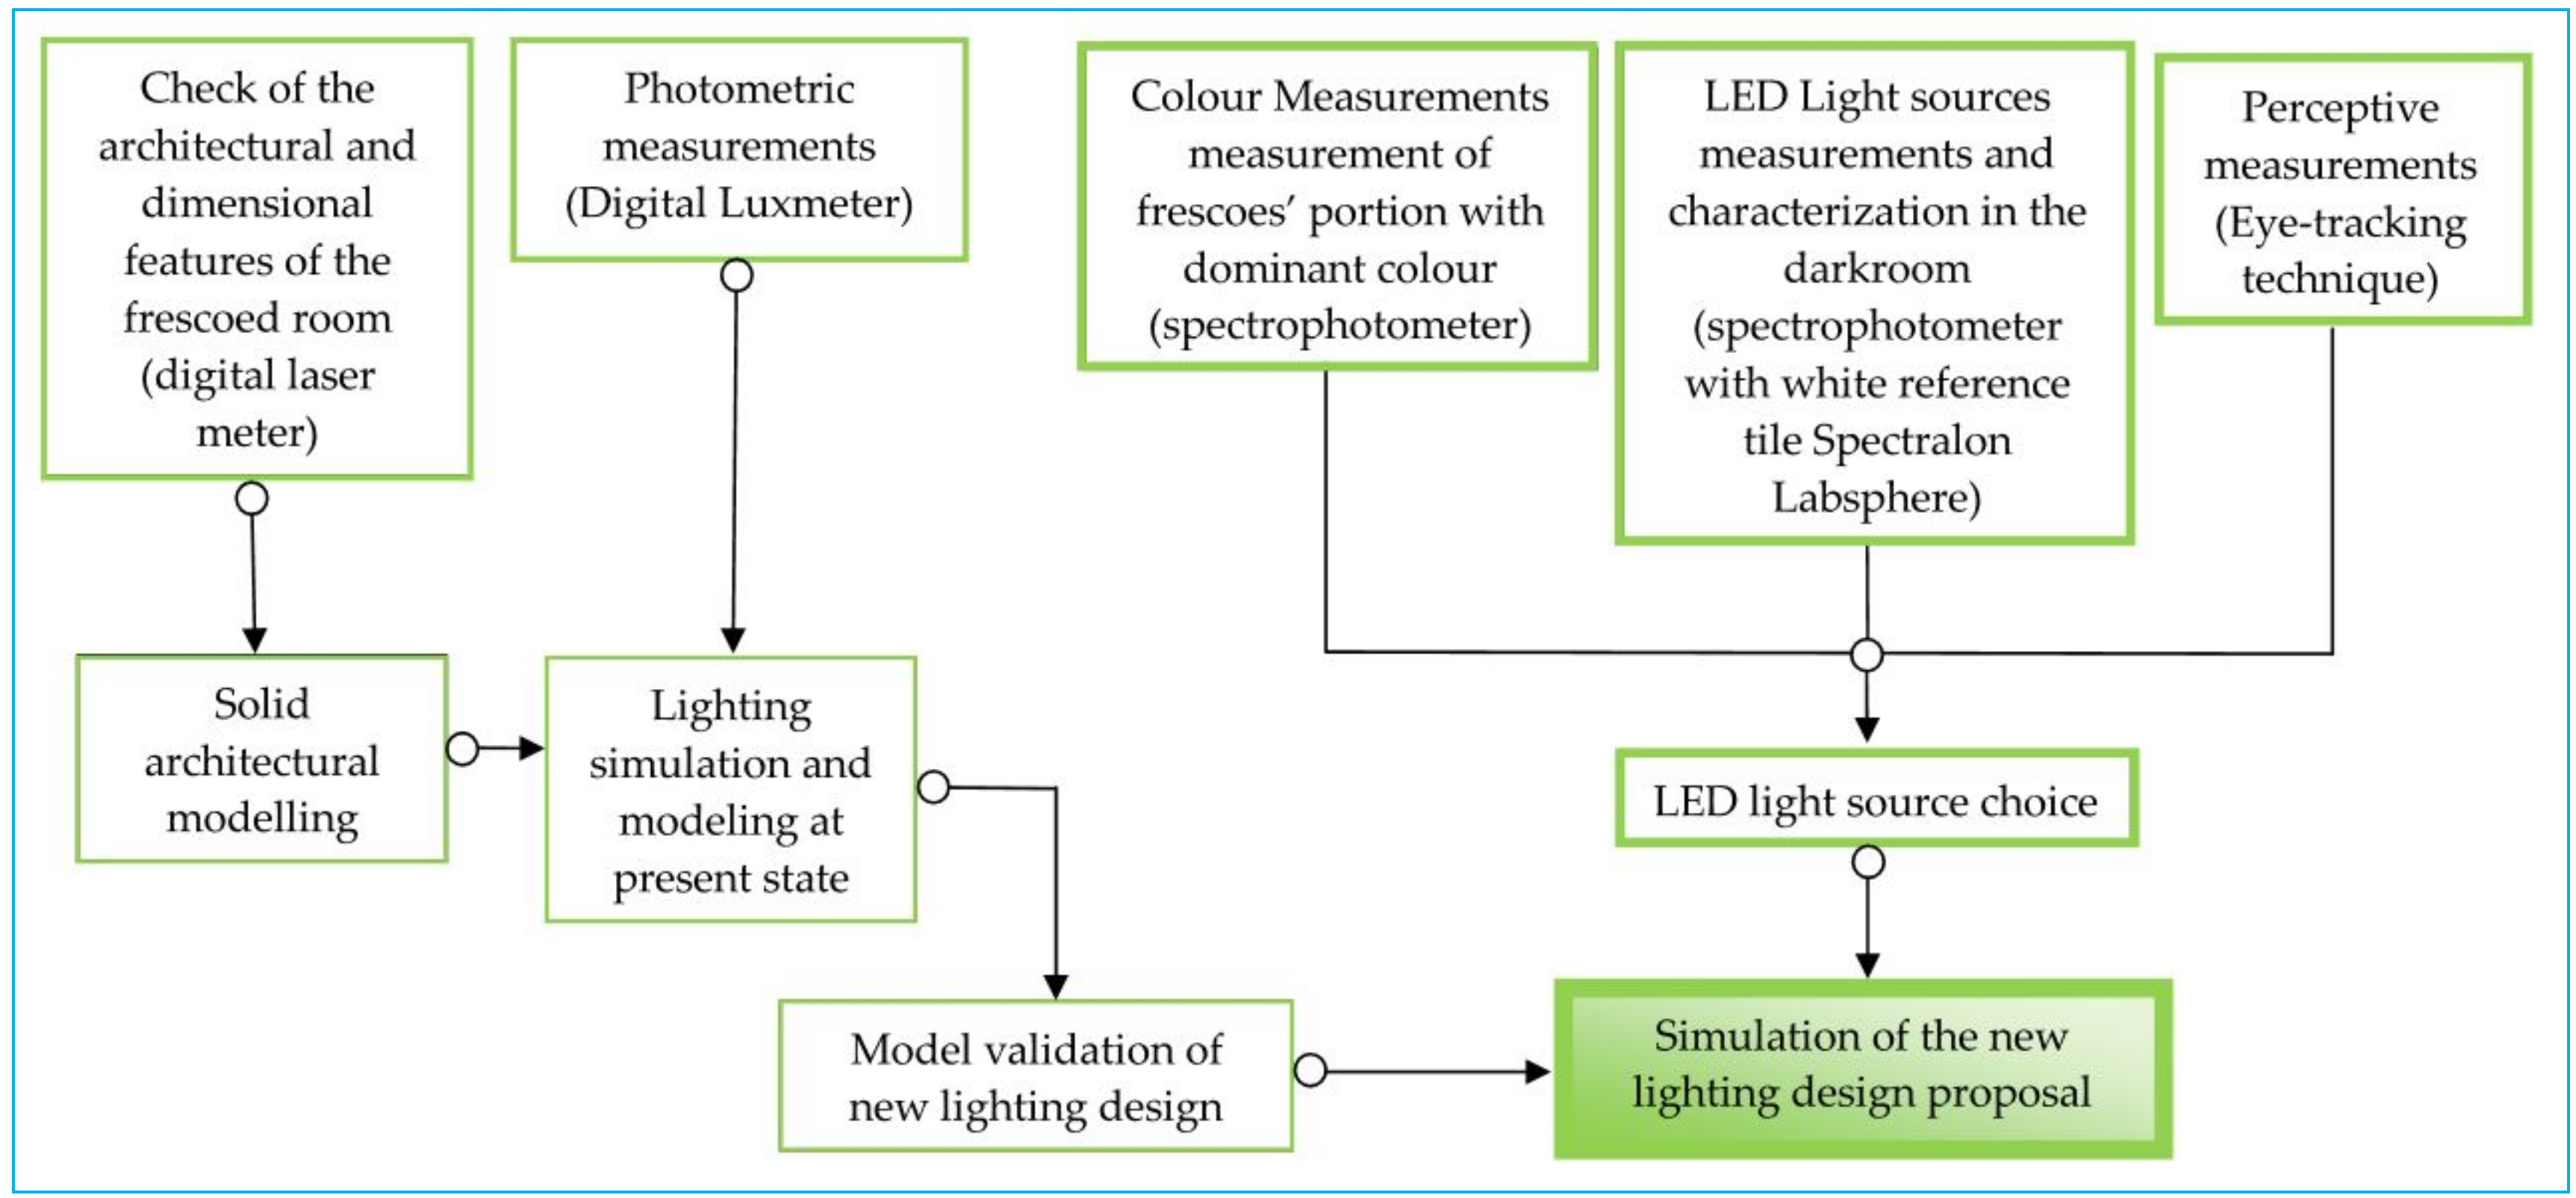
Figure 1 shows the diagram on the spatial properties, provided as a flow-chart scheme, of the experimental measurement approach.
Physical, optical and colourimetric information on the existing materials were collected. This was possible by means of thorough research based on direct observations and photographic documentation compared with literature evidence. This was necessary to distinguish organic materials according to photosensitivity classes in relation to their degree of ageing and photochemical degradation, for their protection and preventive conservation, as suggested by current standards [4,32].
3. Experimental Measurement Assessment
3.1. Photometric and Perceptive Results
Post-processing and analysis of the experimental data allowed for the identification of the optical and photometric characteristics of the light sources (for example, photometric curve, colour temperatures and spectral emission), the luminous climate in the room’s present condition, the most effective LED source for guaranteeing vision and perception quality, as well as for the transmission/communication through light of the information content of pictorial representation.
Photometric measurement results showed the darkness of the room: the chandelier was kept on, for all the time of measurements, in order to maintain real conditions: the illuminance values measured are provided in Table 1. The balance and uniformity of illuminance are completely absent because its limit ratios are less than those suggested by the standards (Table 1). The experimental error data analysis, using the Pearson standard deviation calculation, gave an average error of 4.5% over all the measurements of illuminance, showing their good reliability and validity.
Three lighting sources were used for optical-perceptive tests: a LED Vivid Warm Plus (VWP), a LED Vivid White (VWh), and a LED Standard (STD). Their main component is a COB (Chip On Board) light source with a combination of specific LEDs with a specific phosphor mix and with a nominal light beam opening up to 120°. Their secondary optics are provided by a combined diffusing/shielding, diffractive/shielding system that works with a front closure in extra-clear tempered glass, up to 60 ° nominal opening of the light beam.
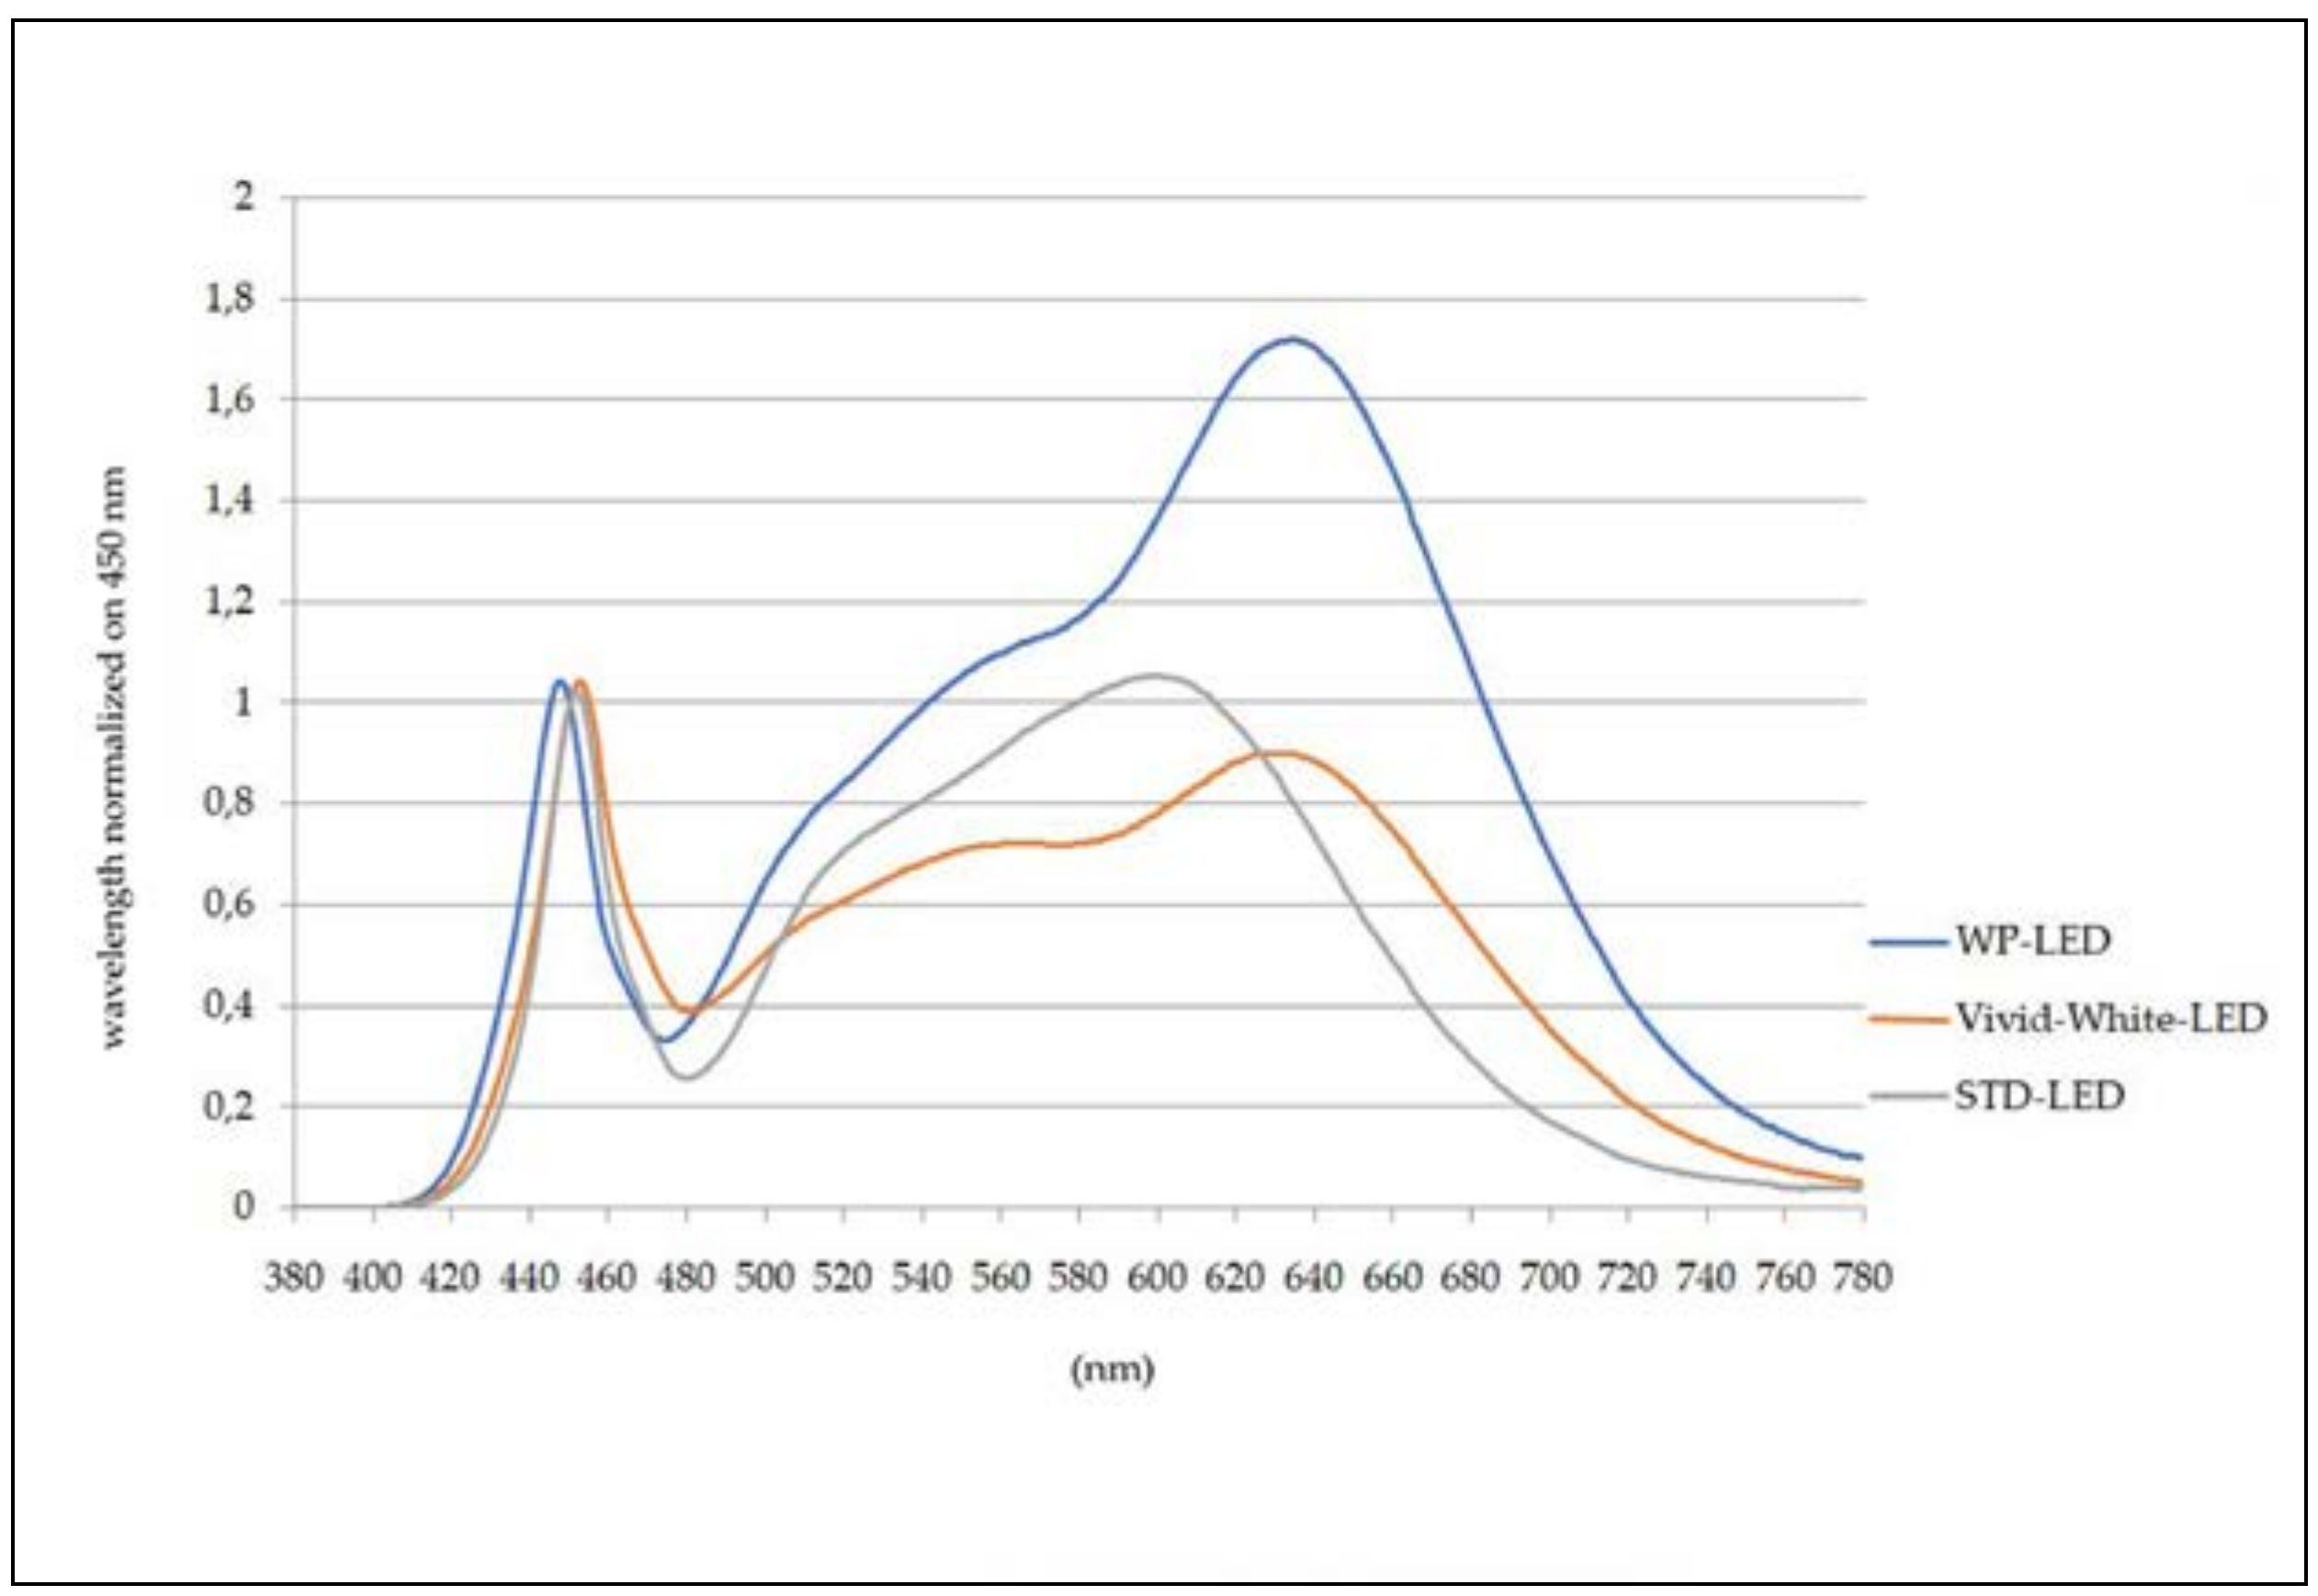
The nominal colour temperature of the three LED sources is 3200 K for VWP, 3000 K for STD, and 4100 K for VWh. Comparing the results obtained for the VWP and STD, differences between their spectra are due to the greater presence, especially in VWP, of the radiation in the wavelengths between 500 nm and 550 nm, and also in the displacement of the highest peak from 600 nm to 640 nm.
This fact, even if it does not produce appreciable colour temperature differences (that is, from 3062 K to 3091 K), however, moves the colour point on the chromaticity diagram CIE1931, with respect to the black body curve, for x coordinate from 0.43 to 0.42 and for y coordinate from 0.40 to 0.38. Since x and y lower values correspond to spectra with more green-blue light.
From comparison between the emission spectra normalized on a 450 nm wavelength for the three LEDs and their correspondent colour point of light, it can be deduced that the VWP has a maximum emission peak between 620–650 nm, corresponding to red colour; STD has a maximum emission peak between 580–610 nm in the correspondence of the yellow-orange colour; VWh has a maximum emission peak between 440–460 nm in the correspondence of the light blue/indigo colour. The spectral characteristics of the three LED light sources are provided in Figure 2.
If the colour point of the three light sources is reported on the CIE chromaticity diagram, it is possible to deduce their real colour temperature that is obviously different from the nominal one: for VWP is 3047 K, for VWh 4049 K, and for STD 3782 K. By the Tobii-Studio program, data post-processing was carried out and the results were mapped.
The following indexes were obtained: visit number, visit duration, gaze number (number of times that the eye stops on different areas and/or AOI), fixation number (number of micro-movements of fovea occurring during visual path), time from the first gaze, and time from the first fixation. The assessment of the above indexes allowed for the knowledge of the exact instant in which the eye focused a specific zone of the fresco connected with the visit numbers and then the activation of the neuro-cognitive processes (that is, visual stimulus interpretation and representation) under different lighting sources.
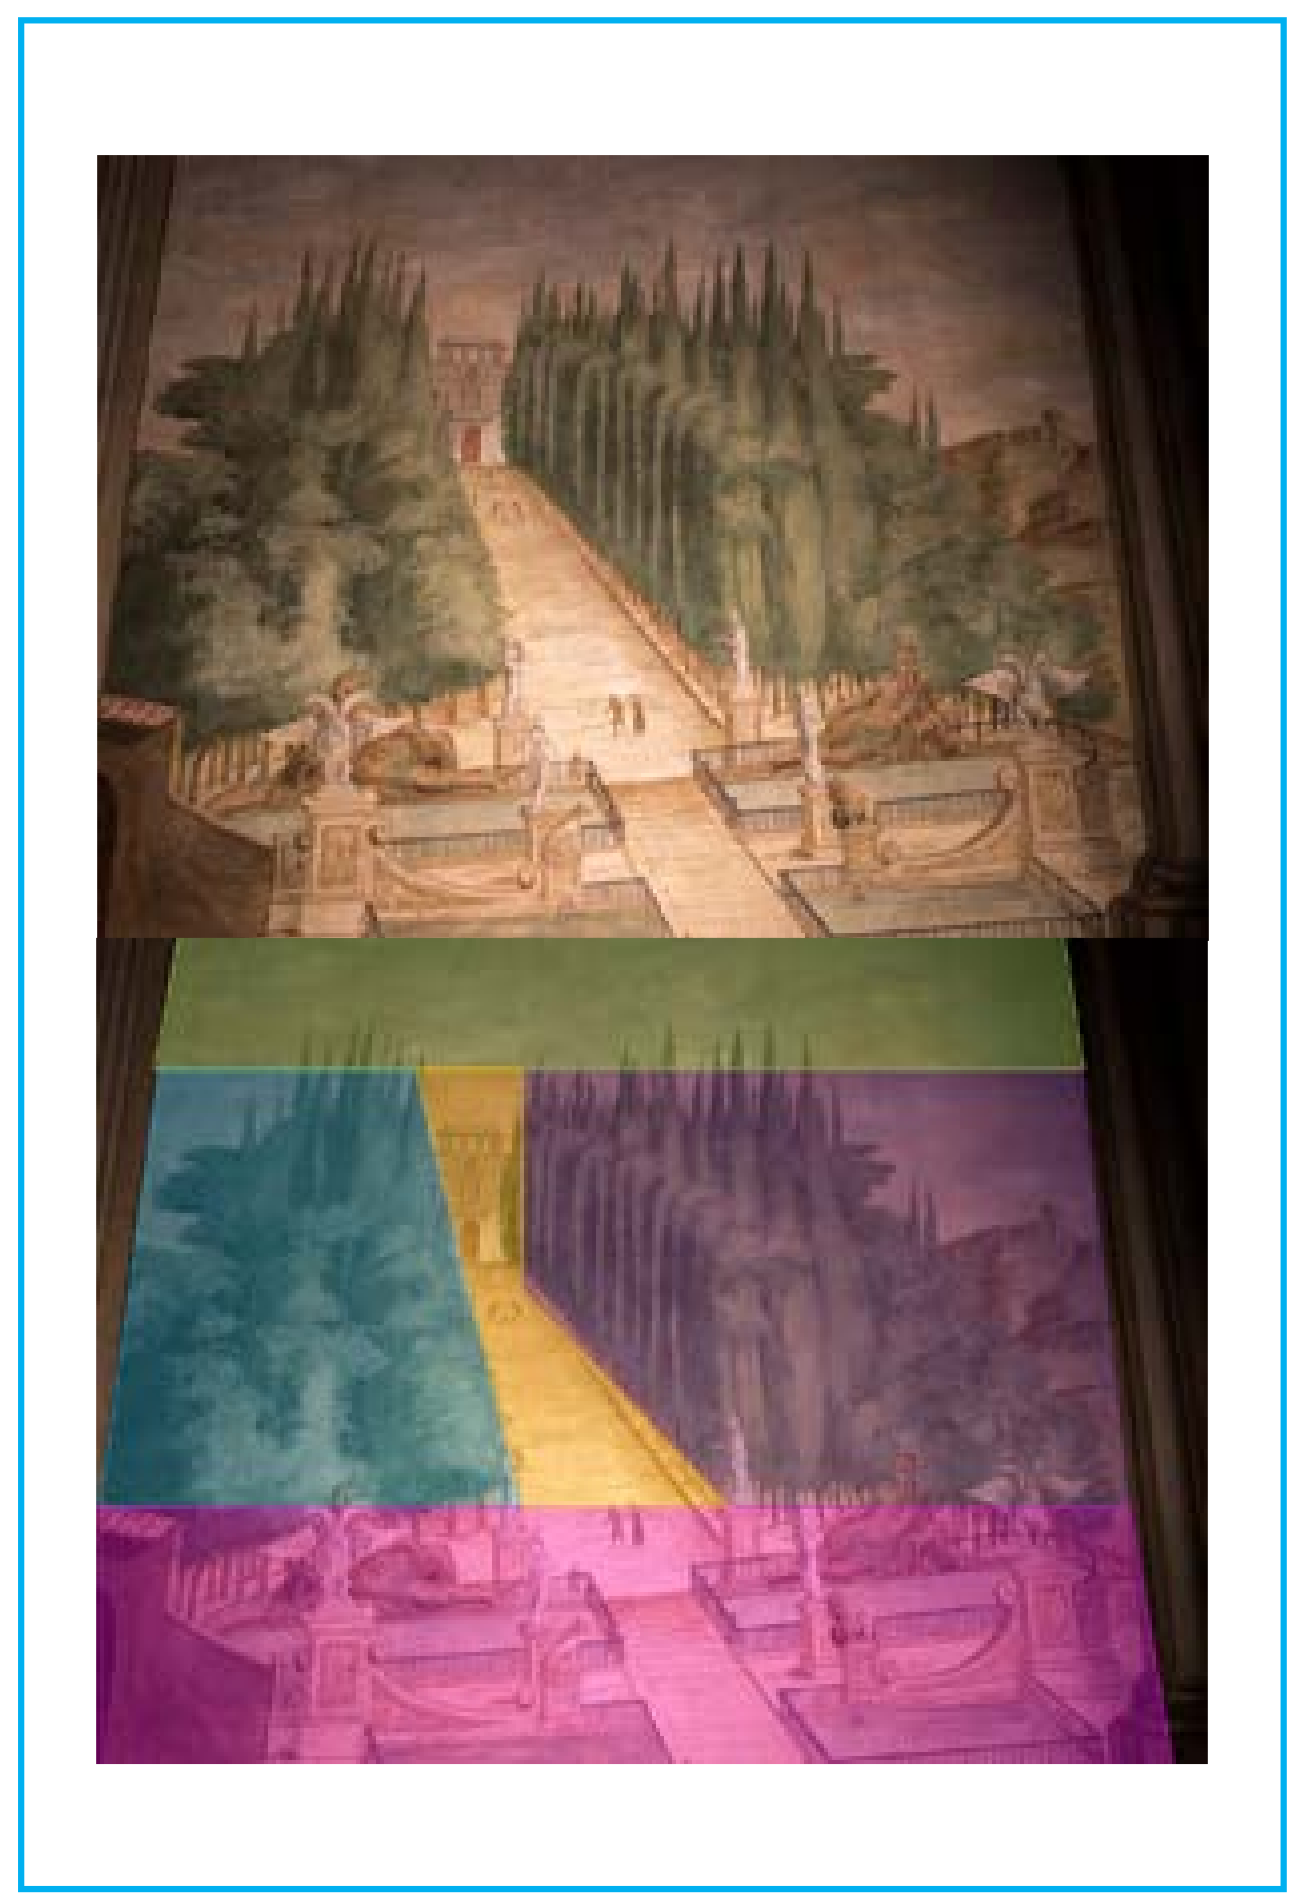
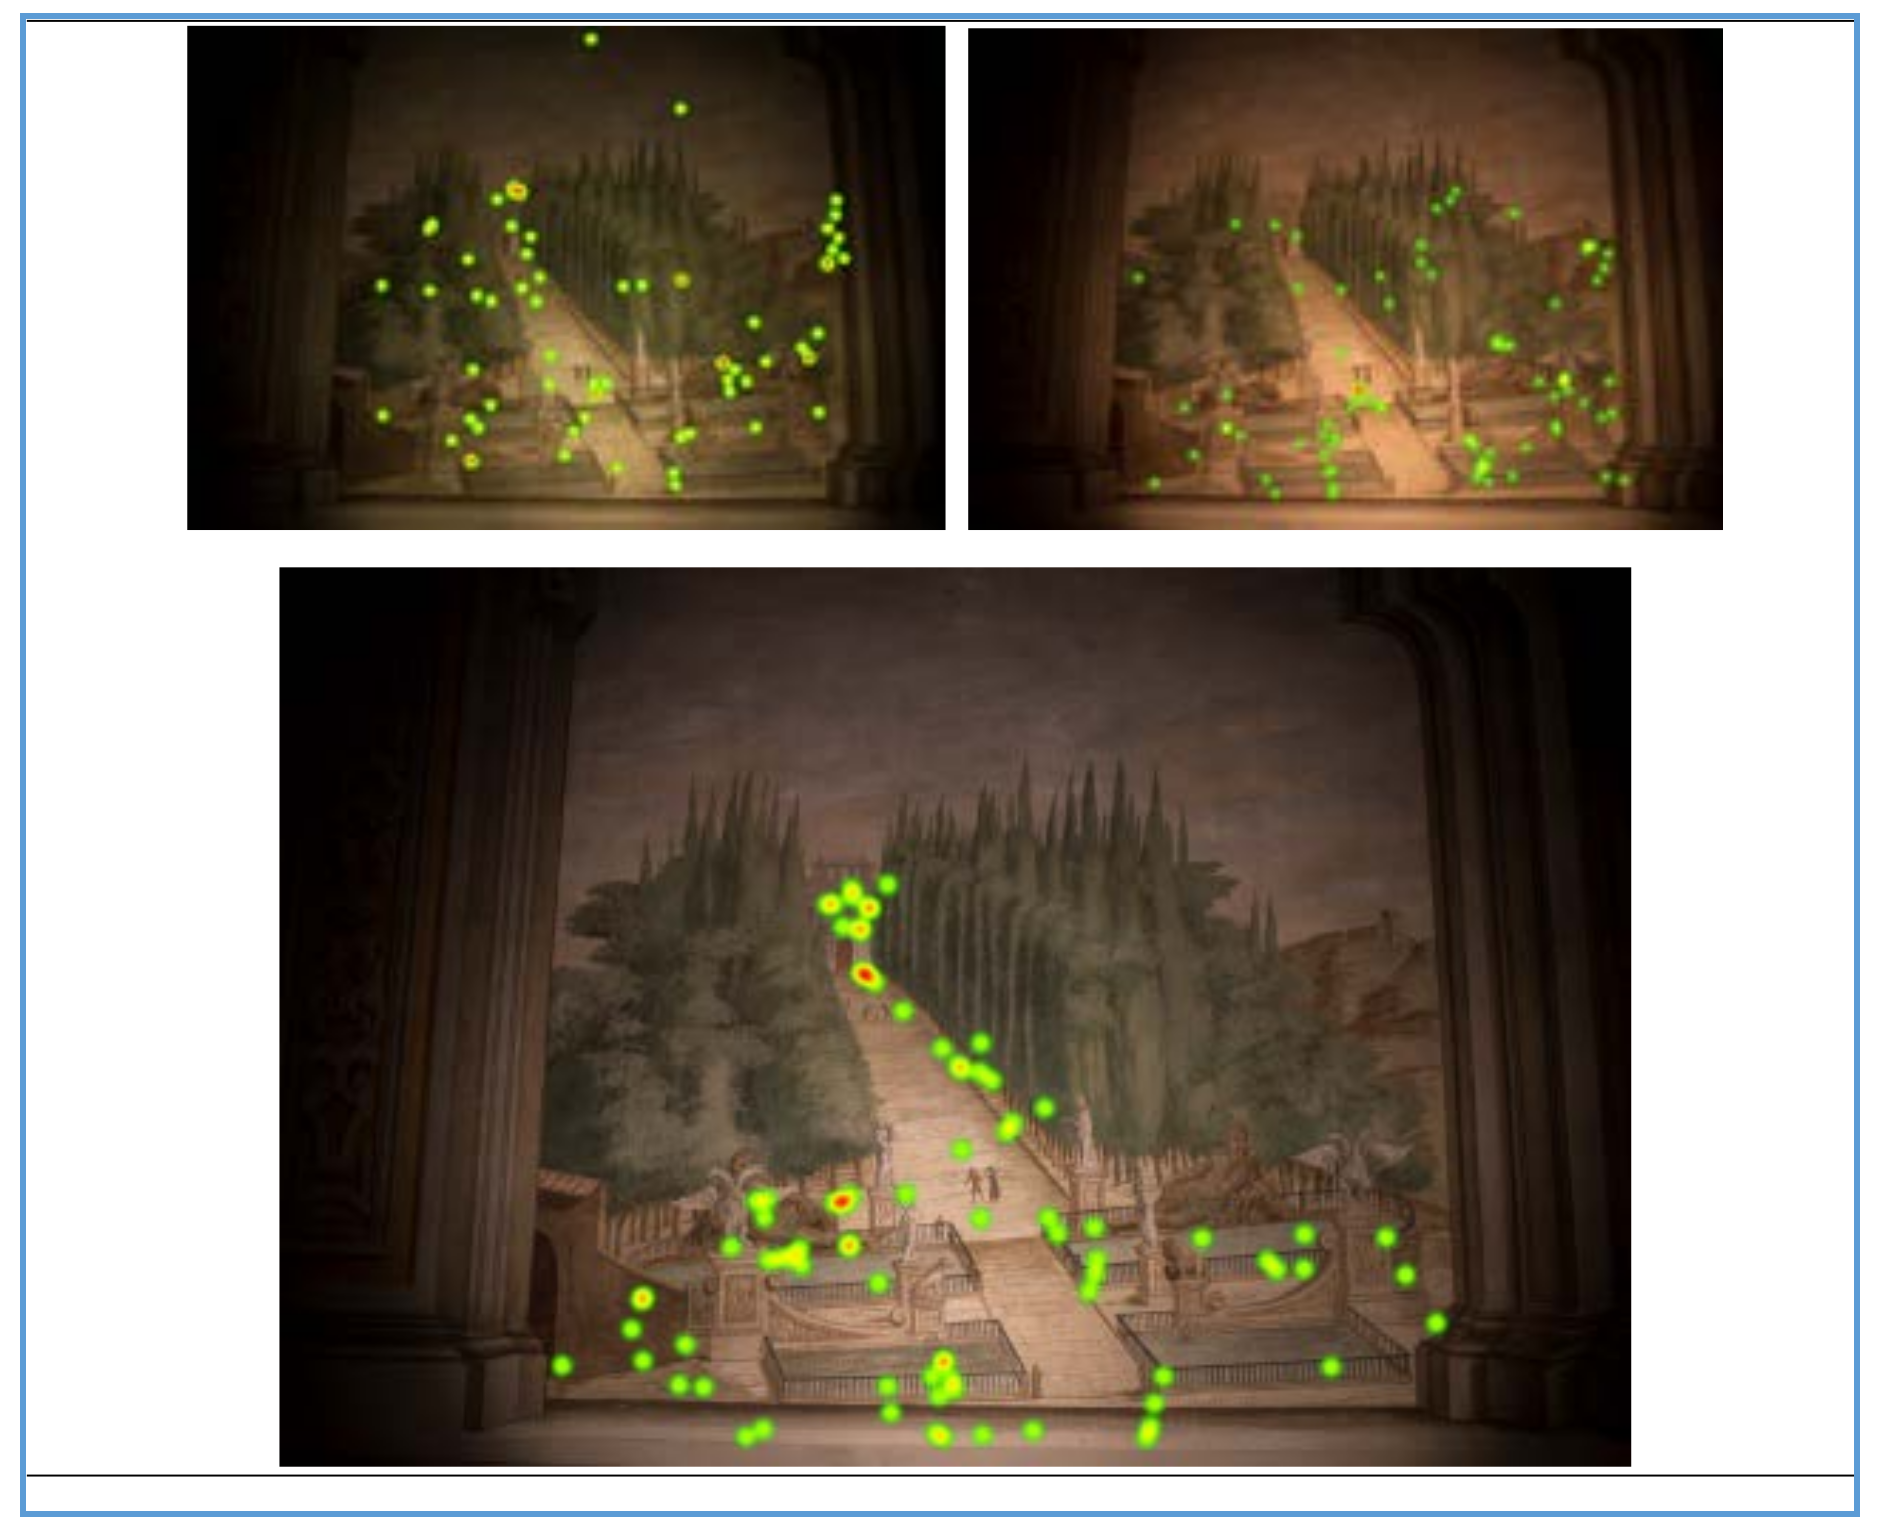
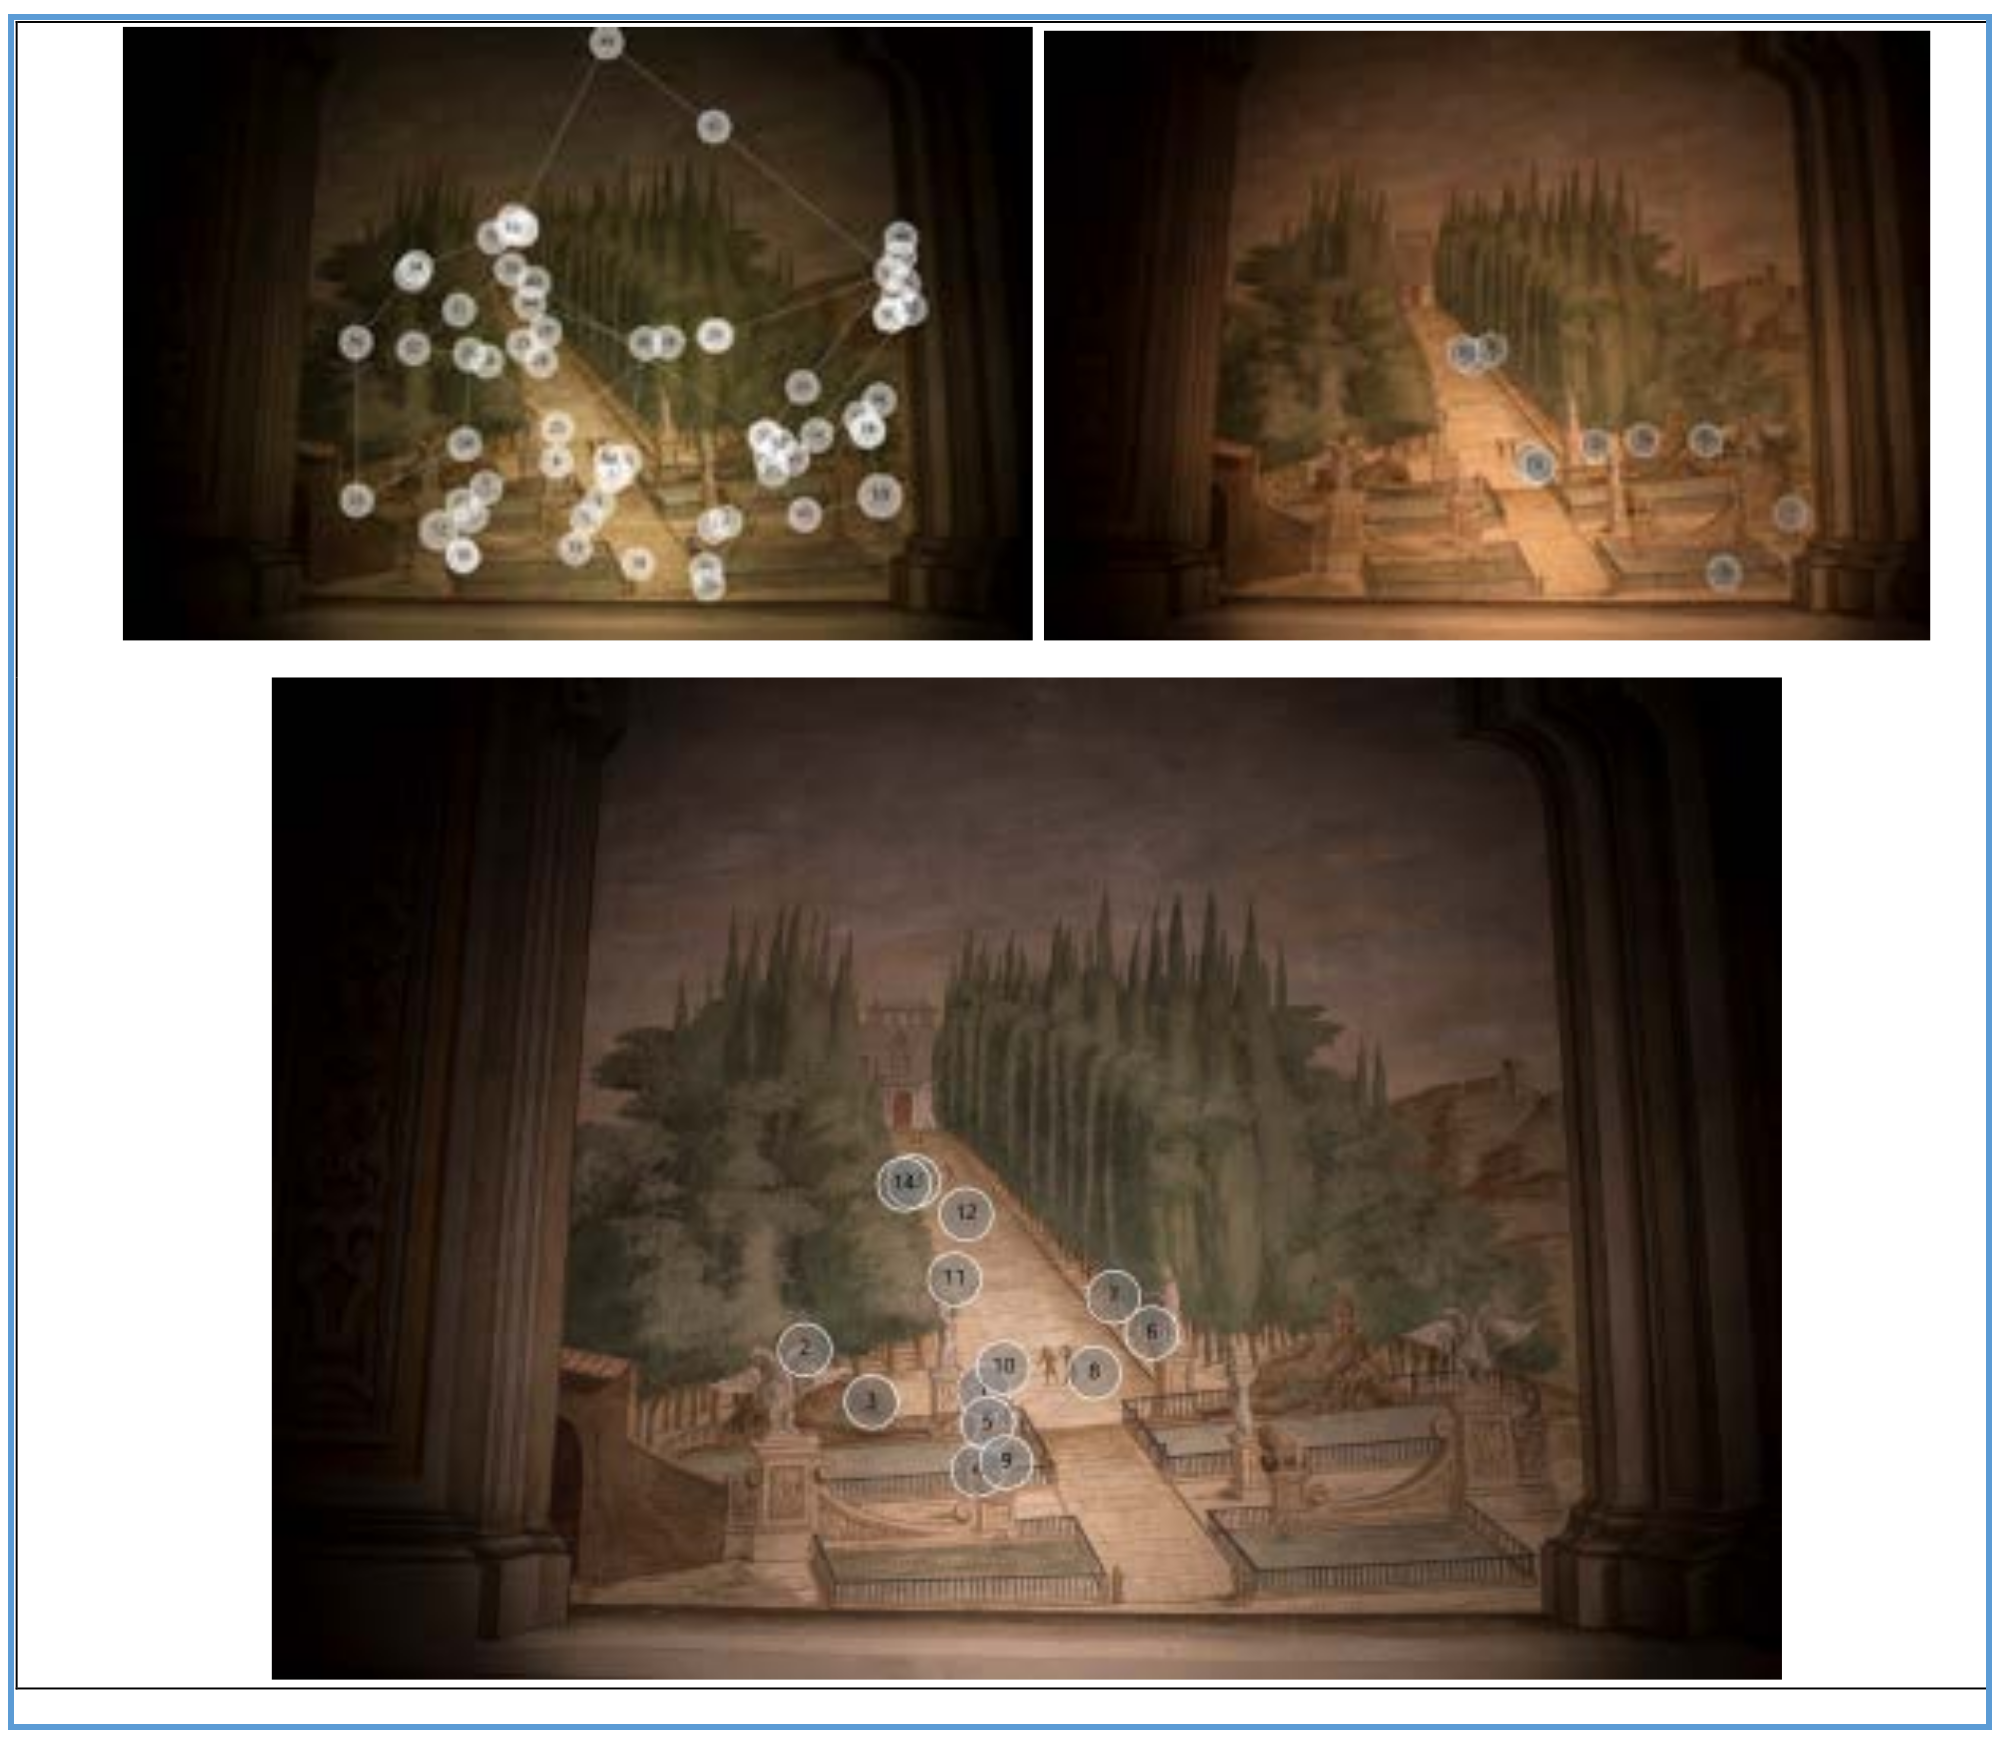
The AOIs were identified referring to the fresco portion with the dominant colour which was before measured and characterized. As a consequence, the AOIs are the same for all the LED light sources. This process used to identify the AOIs was developed before the post-processing of the eye-tracking measurements. Fundamental AOIs were identified (referring to which the Fixation Count and the visual path can be visualized by the Heat-Maps and Gaze Plot): the landscape-park (left and right portion); the courtyard with the statues; the avenue with the building at the back and the sky (Figure 3). Referring to the time of the first fixation, the visit path of the observers was evaluated: for all the subjects, the visual path moved from the centre of the fresco, towards the sides, to go down to the courtyard with the statues. Heat maps showed how looking was distributed over the stimulus, without information about the order of looking, or the attention duration on individual fixations. The heat-map results comparison allowed for the identification of the zones and/or portions of the AOI with the highest number of visits (Figure 4).
Gaze plots showed the location, order, and time spent looking at that location; they provided the time sequence of looking expressed as a fixation duration, quantified by the diameter of the fixation circles (that is, the longer the look, the larger the circle; Figure 5).
An initial general analysis suggested that the data collected from 15 visitors followed a consistent pattern when observing the fresco. The AOIs were shared by most visitors and then the order (visual pathway) was similar for each of them. In particular, 54% of the observers preferred VWh-LED. The ratio between the higher fixations number and fewer visits number provided an indication about the lower entropy (that is, the higher information content) because fixations tend to be concentrated on a certain AOI that appears to be more interesting. As a matter of fact, the value of this ratio for the three different LED lighting, is reported in Table 2.
3.2. Entropy Calculation
The greatest variations in time and the fixation numbers of each area depend on the type of the light source: higher concentration, processing of visual stimulus, visual scanning patterns with many fixations oriented to an AOI before moving to another, perception, and then lower entropy (that is, the higher information content transmitted [8,21,22]) were obtained with colder light, provided by the VWh-LED. Following the approach suggested in References [8,21,22], we could analyse the results on the perception and preferences of the observers, patterns of their visual scanning, and locally oriented viewing works of art under different LED sources, by Shannon entropy calculation and, consequently, the assessment of the information content of images that each light source can transmit.
Combining these results with photometric and colourimetric measurements, it was possible to choose the correct LED sources allowing for the transmission of the information content of the images (that is, the lower entropy production due to visual patterns and eye movements in different AOIs, that is, the higher information and observer’s higher attractiveness). The Shannon entropy was calculated by its basic formula [26]:
Equation (1) defines entropy in terms of a discrete random variable X, with possible states (or outcomes) x1..., xi,…xn H(X) is the entropy in bits and p(xi) is the probability of the ith outcome of X.
The context of the experiment and the reality of the phenomenon of perception and gaze behaviour path directed the identification of dependent and independent variables: the AOI and the type of LED source are two stochastically independent random variables (that is, their joint or conditional probability is equal to the product of marginal probabilities); the number of fixations within an AOI is the dependent variable. In our experiment, the observers had a time of 15 s to look at the fresco under each one of the three different LED sources (total time 45 s for the whole test with three LED lighting): their gaze path behaviour was very different because some subjects were fixed for a long time, where others had a much higher saccade rate. For this reason, we were not able to immediately decide which of the AOIs had the highest attention attraction power.
For example, the AOI-courtyard under VWh LED lighting attracted a higher number of fixations than AOI-avenue under the same lighting, but needs more time to achieve this. The AOI-avenue quickly receives a lot of attention, but is not very successful in attracting a lot of attention/interest. This problem was solved with the measurement suggested by References [23,33]: with their experiments, the reaction time was defined and allowed for subjects’ observation determination with high accuracy and long reaction times, and those with low accuracy and shorter reaction times.
Referring to the number of fixations with higher accuracy and long reaction times in each AOIs, the ratios between higher fixation number and fewer visit numbers were calculated and compared with the percentage of the time during which an AOI was fixed, under each of the three LED light sources. This procedure allowed for entropy evaluation as follows: each fixation in a specific AOI was changed into a character (for example, a string of characters) referring to it and all the repetitions were deleted. This allowed for the deduction from the total number of fixations and of the fixations due to musing that consists of one or more fixation (with high accuracy and low reaction times) within the same AOI.
After the analysis of the number of single gaze paths, the relative frequency of fixations was calculated and then their probability was as well (Table 4). Probability theory and experience show that, if a sufficiently high number of tests are carried out, the relative frequency of the single results (or any event) is next to their probability [34,35].
Referring to the experimental measurements obtained by the eye-tracking technique application explained above, the corresponding information content was gathered. The entropy (information) obtained by lighting the Villa Castello fresco with the three different LED-COB sources was as follows: the information value for the LED STD was 1750, for LED VWP it was 1727, and for LED VWh it was 1911. This result confirmed that the LED VWh source characterized by a spectral emission of light in strong compliance with surface colour (that is, the spectral emission of the surface), can also provide a relevant transmission of information content of the images, or in other words, a lower entropy production, that is, the effectiveness of the (luminous) signal for gathering information and the transduction of the signal in visual stimulus.
This lower entropy is due to fixations for musing that consist of one or more equal fixations within the same AOI, and this means indicates the higher information transmitted and the higher attractiveness for the observers.
4. A New Lighting Proposal
A 3D solid-architectural model of the room was made for lighting simulations.
A widely known and applied software [36] was used, which lighting calculation engine derives directly from Lightscape and is based on the ray-tracing and radiosity techniques. Its application for lighting simulations allowed for the dynamic and specific/oriented control of different light sources, their photometric and optical parameters (that is, spectral emission, light colour temperature, power, luminous flux, and the produced illuminance and luminance distribution) but also a control of the optical, colourimetric-photometric, and texture characteristics of different surfaces (that is, the lighting effects and texture maps) experimentally measured.
The first simulations concerned the present condition in order to validate the illuminance distribution results obtained by simulation compared with those deduced from measurements at all the points on the experimental grid. Starting from the simulation model calibrated by the measured experimental data, a new lighting solution was proposed to be assessed. Calibration of the simulation model with experimental data was carried out together with the study on positioning, inclination, and rake angle as well as beam opening of each source in order to respect the maximum limit value of 150 lux on the fresco surface, as suggested by References [4,32].
The new lighting proposal is based on the optimal combination of “base lighting” and “accent lighting” following in sequence the flow and the path of visitors, by dimming the light flux.
The project solution is minimally invasive, reversible, easily modifiable, and removable respecting the conservation and preventive protection of the cultural heritage (the historical building and its studied Rooms) and its works of art (Medici frescoes).
LEDs-COB (chip on board with luminous efficiency 80–98%) sources were chosen referring to the results obtained from comparison and correlation between photometric, colourimetric, and perception measurements. Their characteristics are given in Table 5. In particular, the LED VWh choice was based on the preferences of the sample of observers (perception results) as reported in Table 3 and Table 4 and then used for the new lighting proposal simulation.
The LEDs-COB guarantee an important energy saving, require fewer components for operation, and with the ceramic/aluminium substrate also provide a more efficient heat transfer medium when coupled to an external heat sink, which reduces the overall operating temperature of the group. Specifically, the spot LED lights were used, positioned at 4.10 m from the floor and located along the perimeter frame of the room in a mirror-like manner, in function of the planimetry and the walls and ceiling, and therefore, of frescoed pictorial cycles.
In particular, for the Accent Lighting 2 LEDs-COB for each fresco were used, but with a different reduced operative luminous flux due to dimmer regulation. The LED sources with a 3300 lm luminous flux were made to work at 100% both for accent and base lighting (see Table 5).
5. Results and Discussion
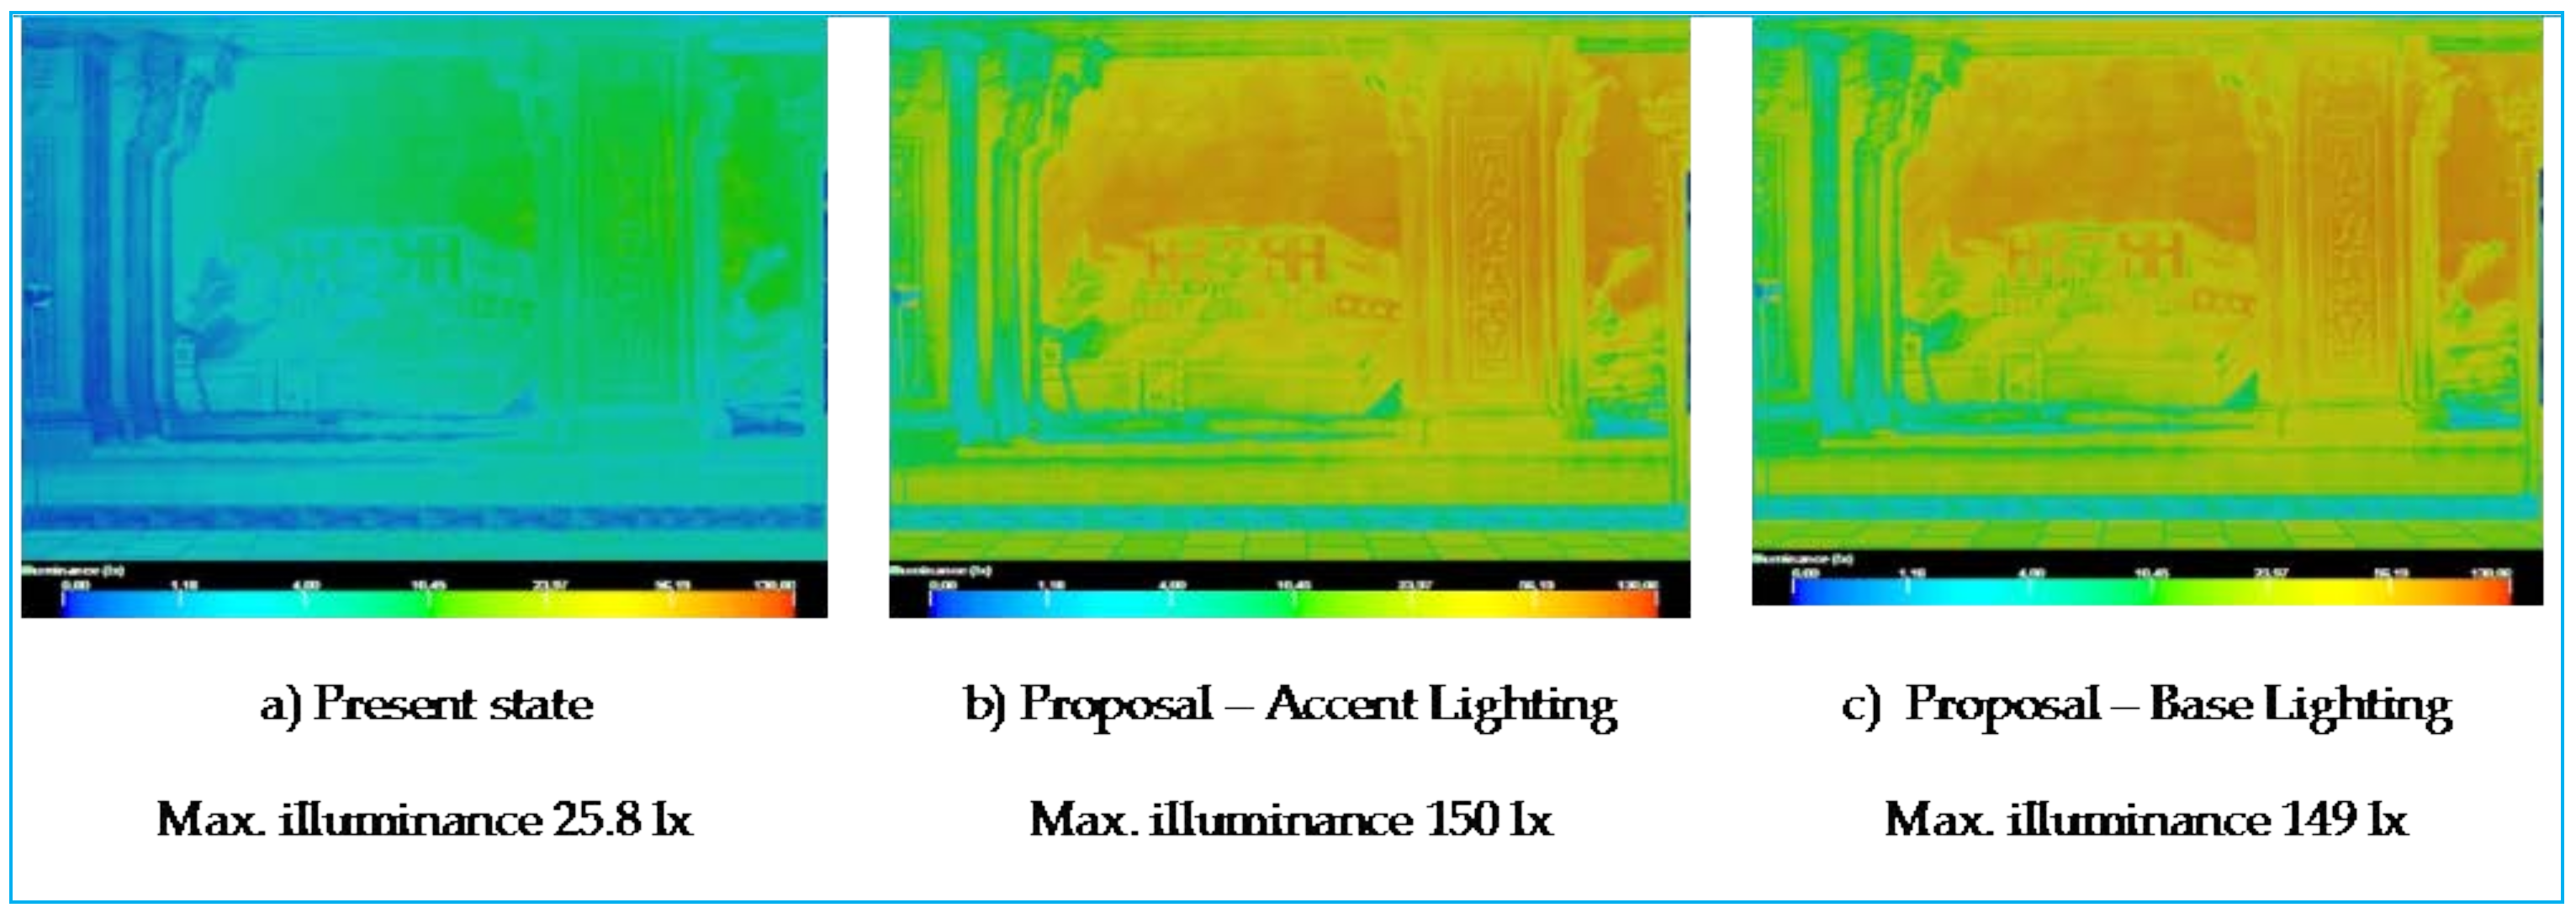
Simulation results of the new lighting proposal show uniformity and quality of light both for accent and base lighting. With reference to the Italian Standard on the technical-scientific criteria and rules of museum operation and development [32], lighting uniformity was evaluated: the suggested illumination and luminance ratios satisfy both the conservation requirements and fruition. The maximum illuminance limit value of 150 lx imposed by standards for frescos and works of art, made of organic material medium-sensitive to light, was respected.
Through the post-processing of simulation results, the maximum, medium, and minimum illuminance values and the mean luminance value were calculated. The mean luminance value evaluated on the walls and lowered vault at 0.5 m height from the floor, is uniform. These results are provided in Table 6 with the comparison with the present state.
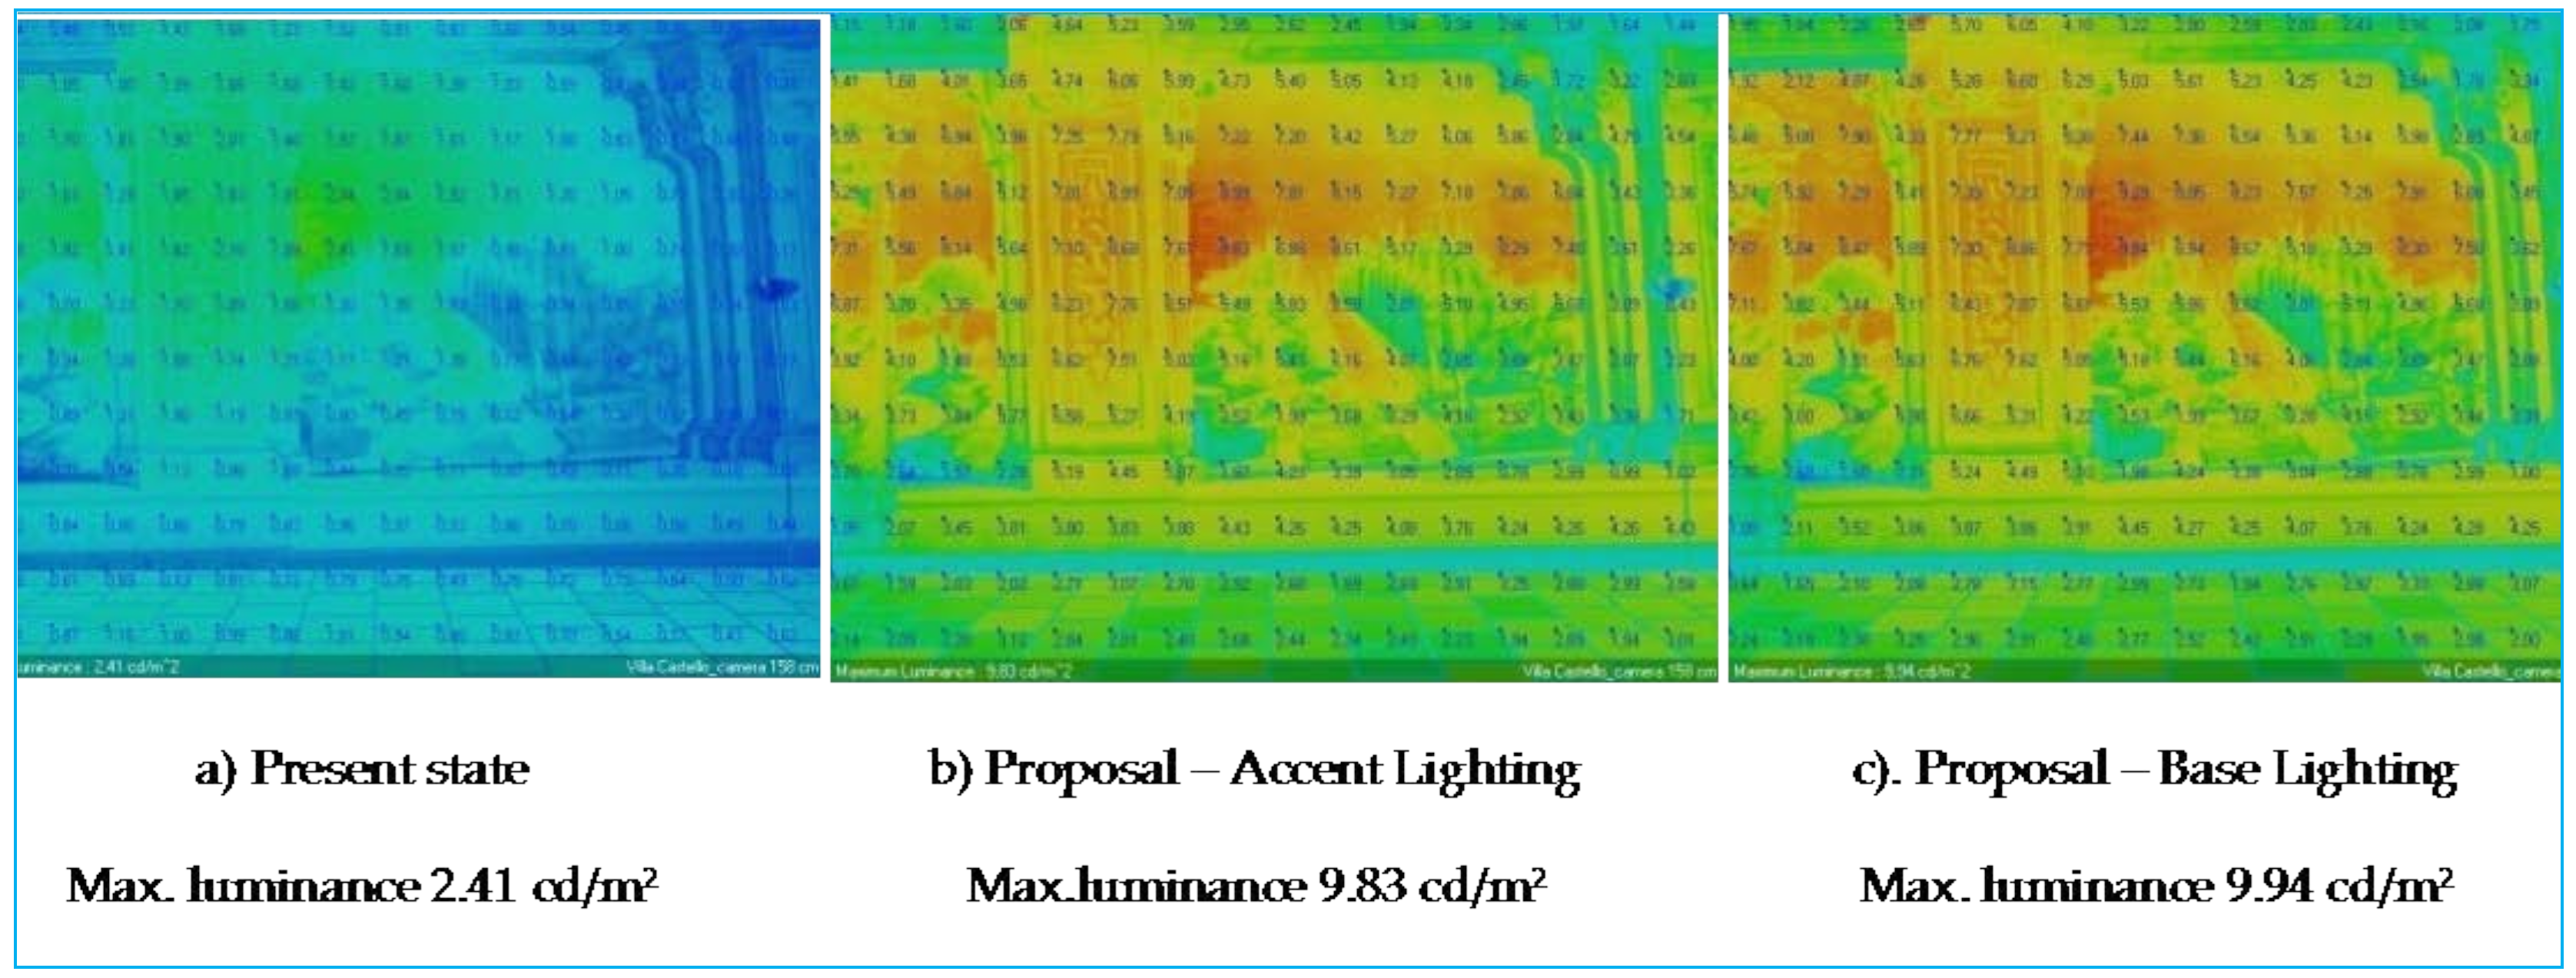
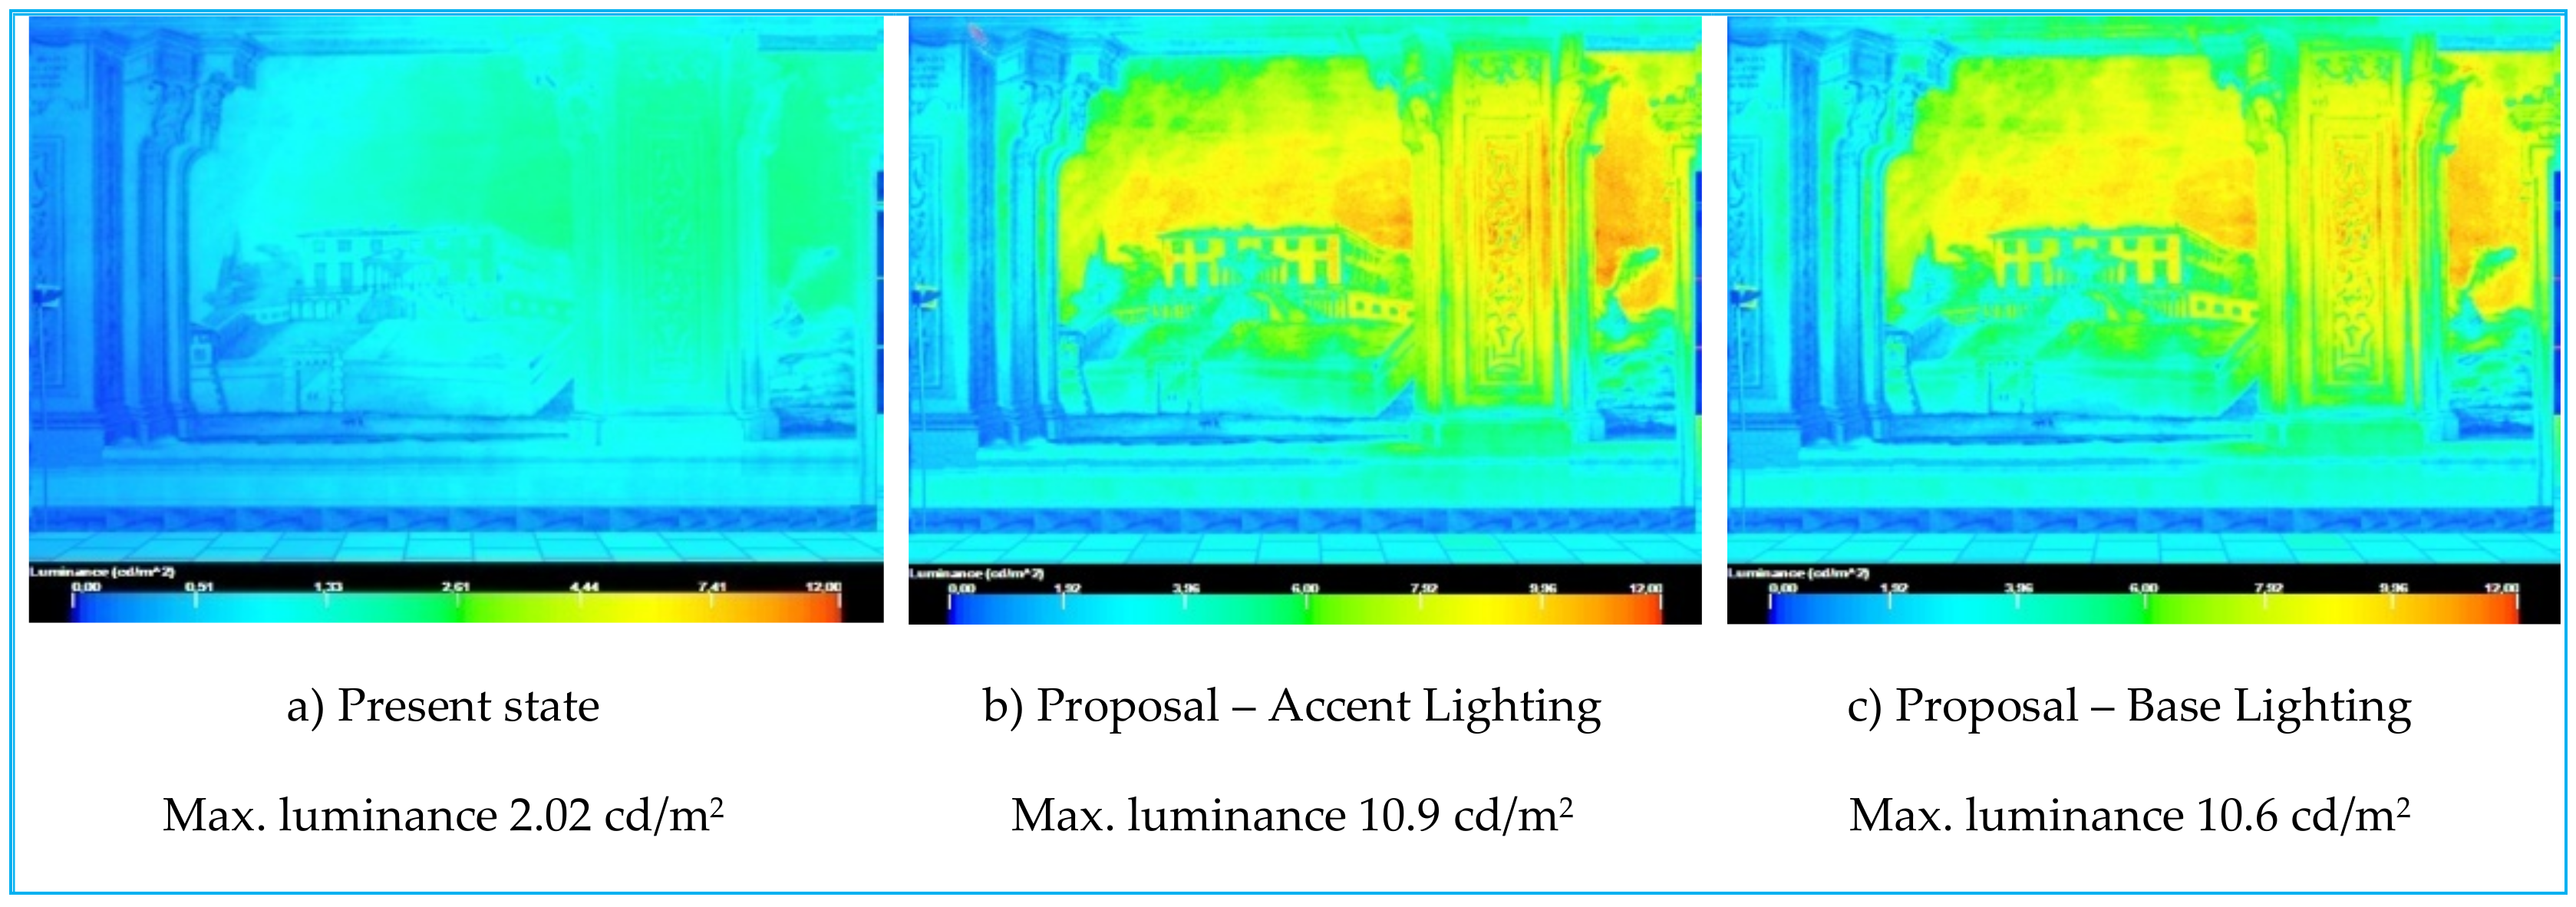
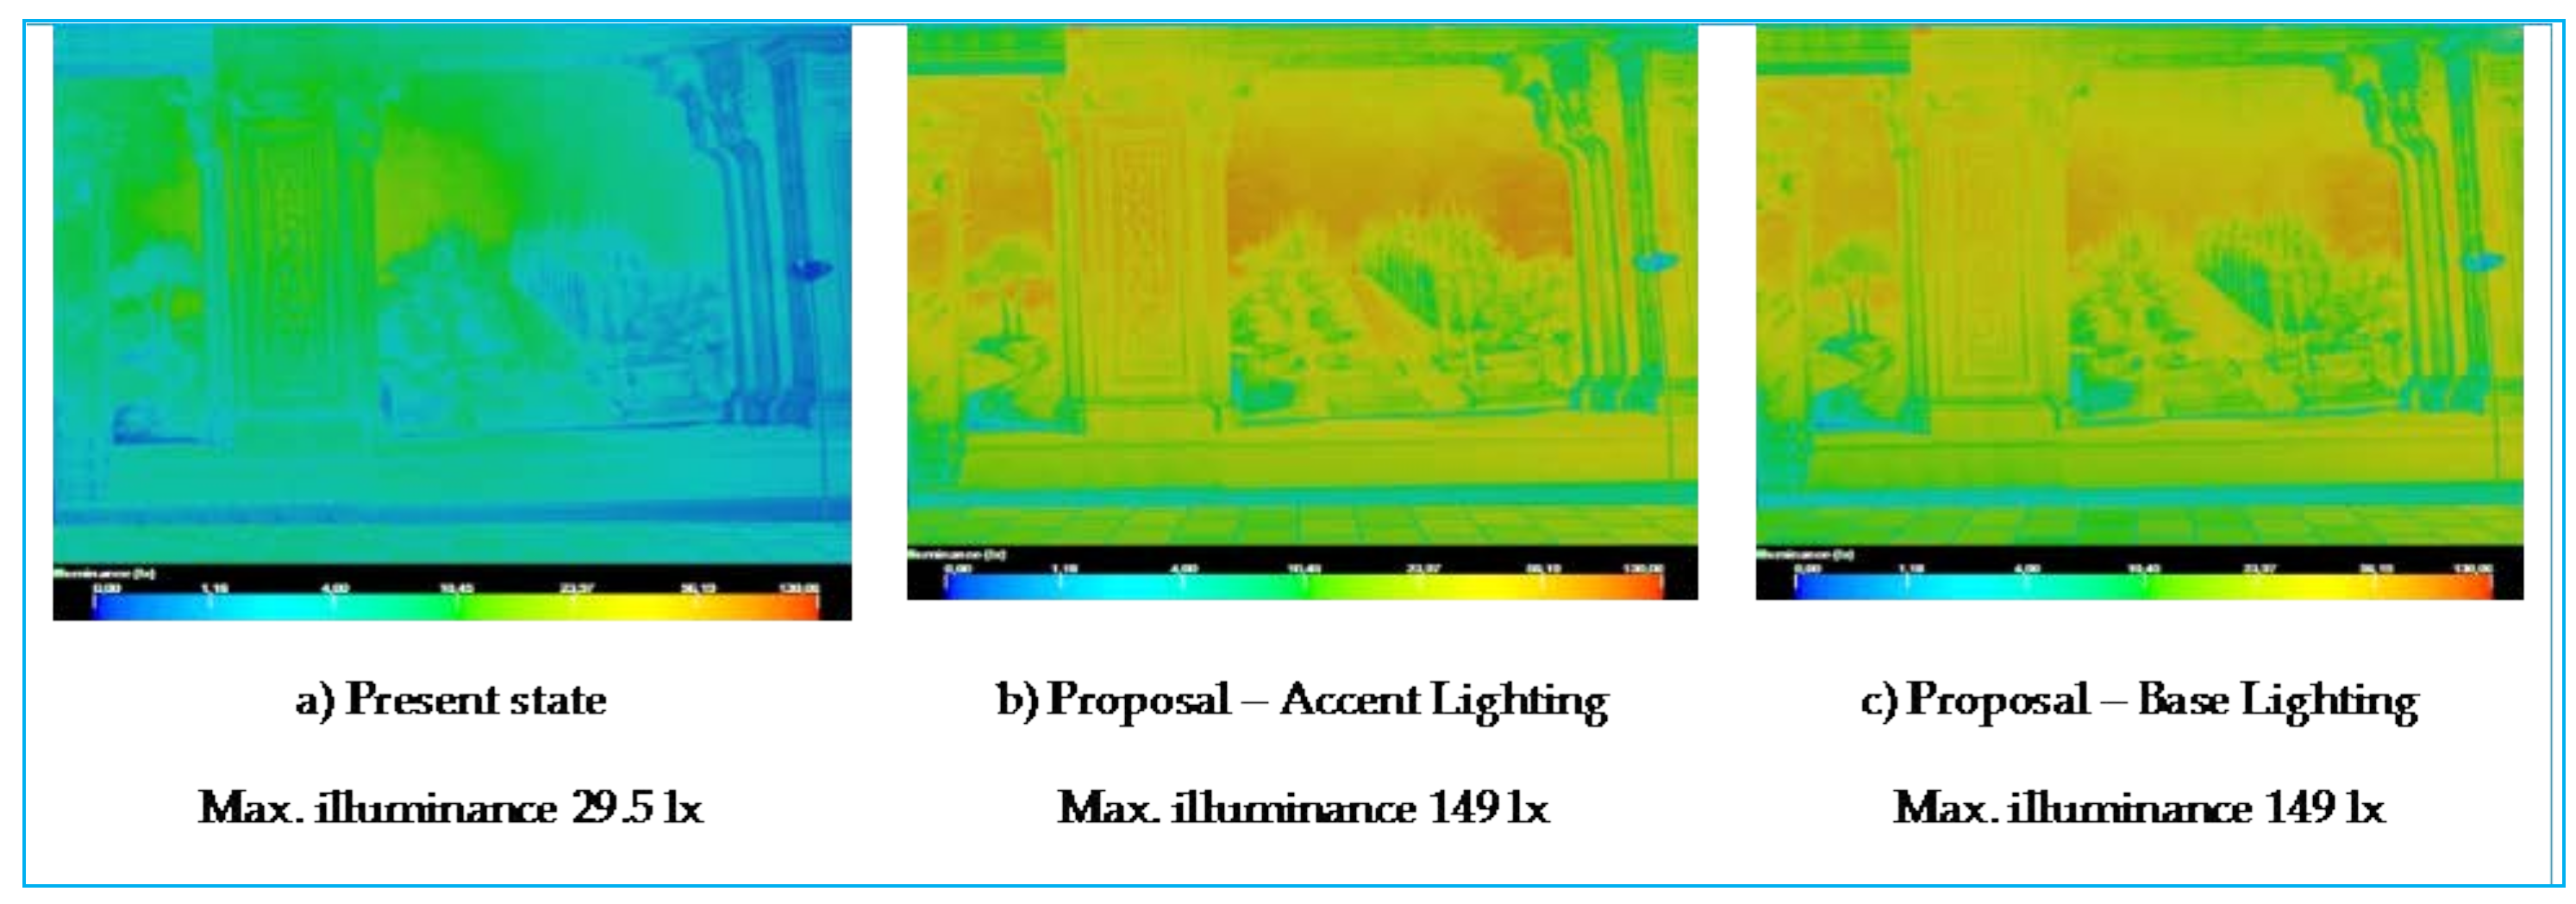
The luminance and the illuminance distribution at the present state and for the new lighting proposal based on the optimal mix between the accent and base lighting are given in Figure 6, Figure 7, Figure 8 and Figure 9 for the two main frescoes “Villa Castello” and “Villa Caiano”. The comparison with the present state highlights the illuminance distribution uniformity and luminance balance and homogeneity.
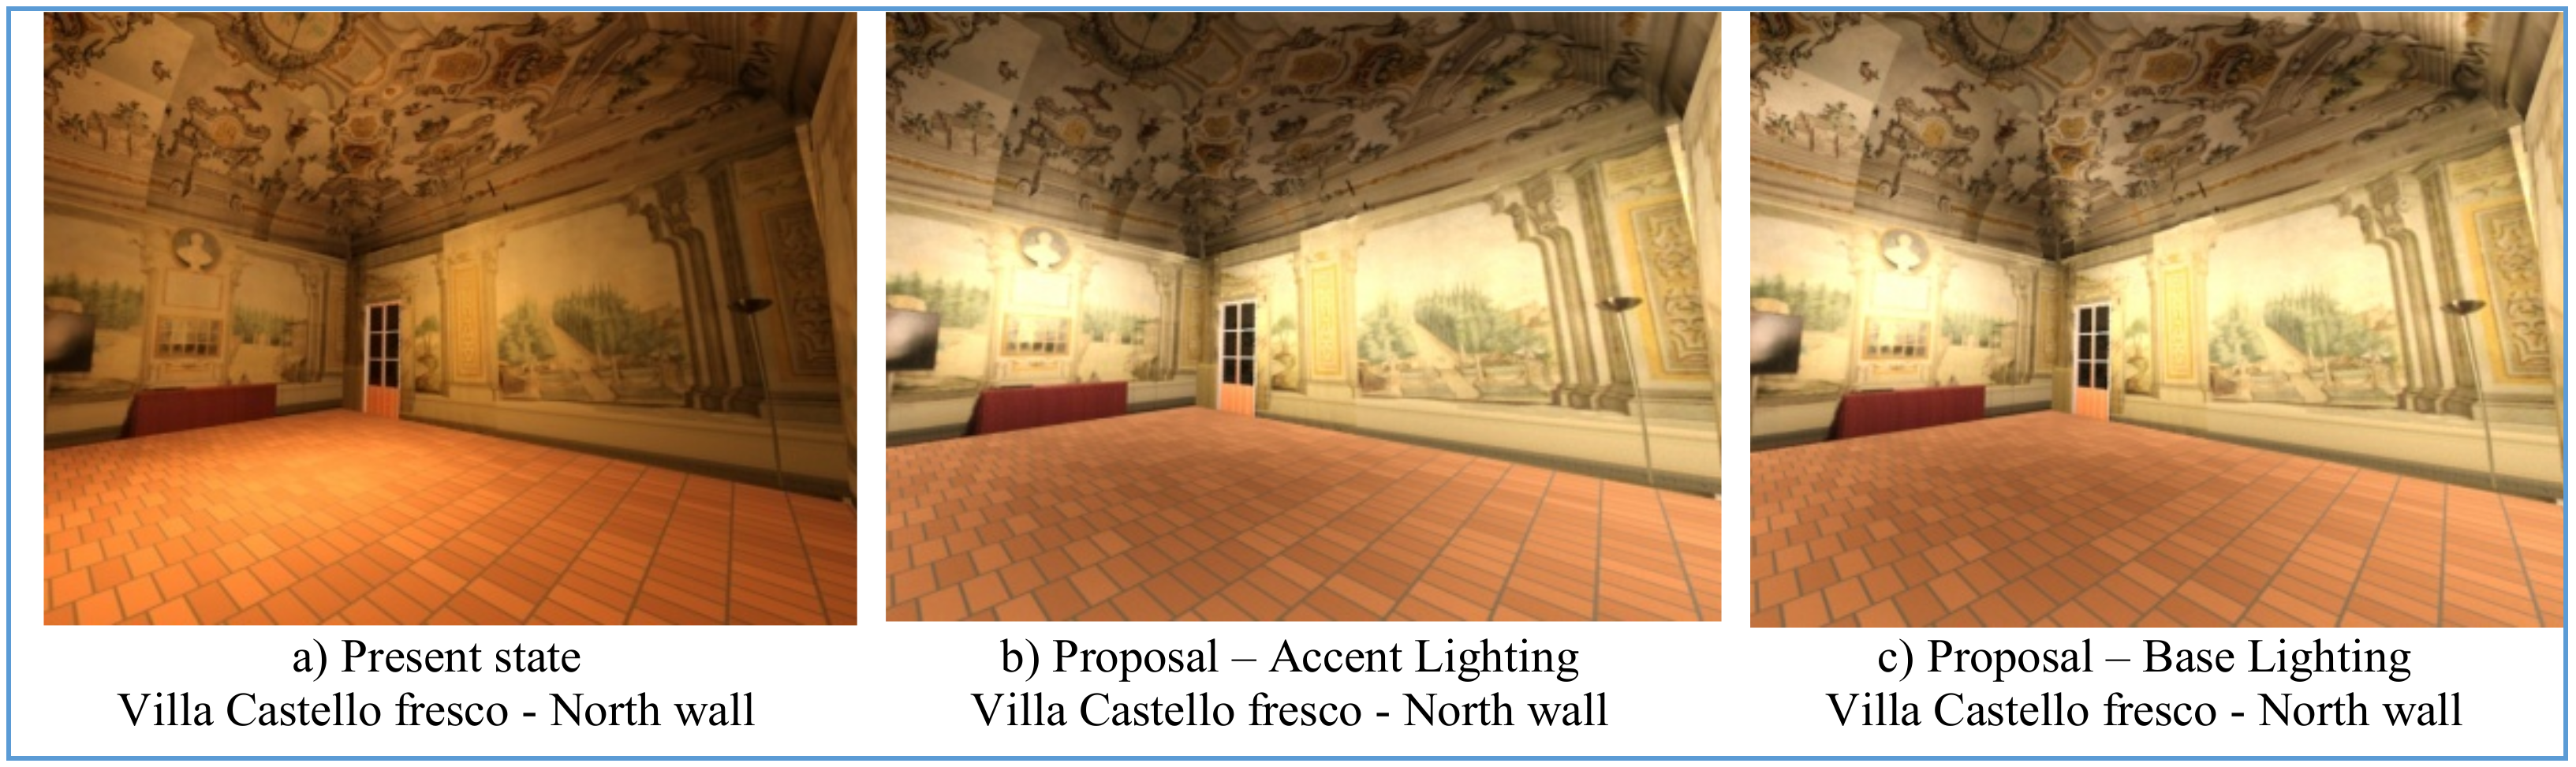
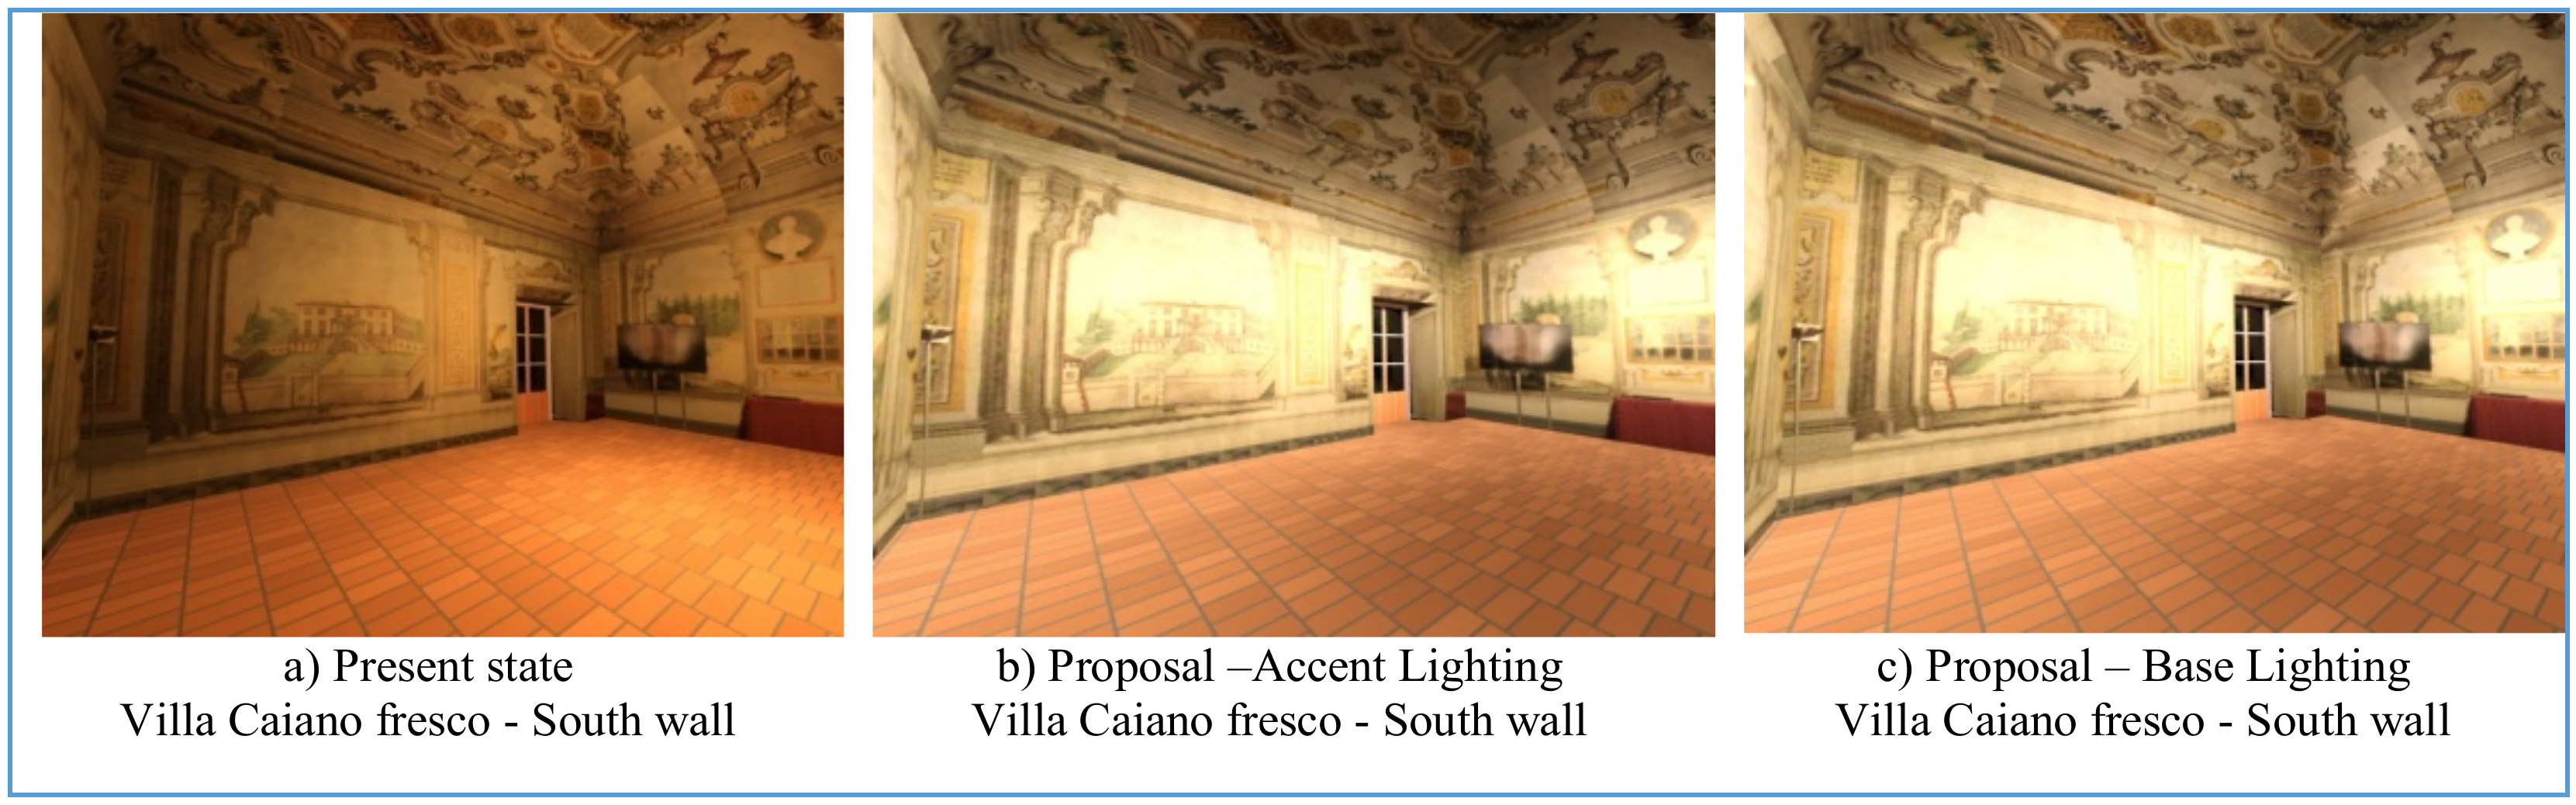
Figure 10 and Figure 11 provided the renders obtained respectively for Villa Castello and Villa Caiano frescoes at the present state in comparison with the new lighting design integrated solutions of accent and base lighting.
In order to evaluate the energy performance of the lighting system, the lighting energy numeric indicator (LENI) was evaluated according to Reference [37]. LENI is an indicator that takes into account the performance of an entire lighting installation, including the controls; it is expressed by the energy per square meter per year (kWh/m2/y) and its use was also recognized as significant for historical buildings and museums [38,39].
It was evaluated on a precautionary basis considering all the LEDs at their maximum luminous flux without the control and dimming for all the museum opening hours (that is, from Monday to Saturday 8–1 a.m. and 2–7 p.m., that is 54 h a week). The illumination energy consumptions obtained for the present states are 2 kWh and 15 kWh for the new lighting proposal, and the correspondent LENI are 0.1 kWh/m2/y and 0.25 kWh/m2/y.
This relative increase in energy consumption corresponds to the higher light quality and not only quantity (moving from a dark environment to a bright one), pleasant luminous climate, and the quality of vision and perception.
These results stressed the importance of considering both the light colour temperature and the real spectral distribution of the LED light sources with respect to the effective wavelengths of fresco surface colours. White LEDs turned out to be more suitable, in terms of quality of vision, perception and illumination, as proved by their lower entropy value obtained and then the higher information transmitted to the observers.
In order to evaluate the sustainability of the proposed lighting solution realized by the VWh LEDs, its results were compared with a lighting design obtained with only compact fluorescent lamps whose characteristics are shown in Table 7. In particular, 18 compact fluorescent sources were chosen with a correlated colour temperature coinciding with that one of VWh LEDs, since it was not possible to define their emission spectrum by experimental measurements. Because these sources are not dimmable, the type of lighting solution provided is only the base lighting. They were positioned at 4.10 m from the floor and located along the perimeter frame of the room similarly to the VWh LEDs sources of the new lighting proposal. The number of fluorescent sources, their position, rake angle, and beam opening were established by means of lighting simulations, imposing the limit of the maximum illuminance value of 150 lx on all the surfaces of the frescoes, vertical walls, and ceiling, in accordance with the current standards for the preventive protection and conservation of works of art [4,32].
The simulation results obtained for the lighting solution with compact fluorescent lamps show a lower illuminance uniformity and lower luminance balance as reported in Table 8. Still, under precautionary conditions (maximum luminous flux for all the hours of museum opening), the LENI and the annual energy consumption were calculated. In this case, LENI was 0.67 kWh/m2/y and the illumination energy consumption was 41 kWh. Therefore, the lighting solution with compact fluorescent lamps showed energy consumption appreciably higher than the newly proposed LED lighting.
6. Conclusions
This study of ours showed that there is an evident tension between designing the best lighting solutions suitable for improving understanding, perception, and vision, taking into account the observers’ diversity due to conceptual resources, connected their preferences and appreciation to their top-down and bottom-up cognitive mechanisms [18,23,24,25]).
Our study is a preliminary pilot project basis for a broader, extended operational research, but is a useful methodological and design tool for sustainable lighting solutions.
A lighting design based on sustainability was produced since it develops perception and vision, increasing the information transmission (also light communication) through the improvement of energy use due to light quality.
Real sustainability can only be obtained if the total irreversible entropy due to human activities is appreciably reduced. Our new LED lighting solution implies energy consumption reduction and lower entropy production in the environment, higher information transmission, but also greater visual and perception comfort, appreciation, and attractiveness for people. Light quality is synonymous with energy and environmental sustainability because it involves less energy consumption, but also lower consumption for vision and perception, as well as lower consumption for the conservation and maintenance of the lighting system and, especially, of works of art. All this entails a lower total entropy production, light quality for quality of vision and perception, which, in turn, are consequently linked to higher transmitted information.
Author Contributions
The authors equally contributed to this work. C.B. and G.V. thought and programmed this research, performed measurements and simulations, assessed obtained results, wrote the paper.
Acknowledgments
The authors thank the Natural History Museum of the University of Florence, the CNR-INO of Florence and the IRSOO Research Institute in Vinci (Florence), for supporting their research.
Conflicts of Interest
The authors declare no conflict of interest.
References
- CEN ISO/TR 9241-309:2015 Ergonomics of Human-System Interaction—Part 309: Organic Light Emitting Diode (OLED) Displays; (ISO/TR 9241-309:2008); Central Bureau of the CIE: Vienna, Austria, 2008.
- UNI CEN/TS 16163:2014 Conservation of Cultural Heritage. Guidelines and Procedures for Choosing Appropriate Lighting for Indoor Exhibitions; Central Bureau of the CIE: Vienna, Austria, 2014.
- CIE, Publication No. 127, Measurement of LEDs; Central Bureau of the CIE: Vienna, Austria, 2007.
- CIE 157:2004 Control of Damage to Museum Objects by Optical Radiation; Central Bureau of the CIE: Vienna, Austria, 2004.
- Fantozzi, F.; Leccese, F.; Salvadori, G.; Rocca, M.; Garofalo, M. LED Lighting for Indoor Sports Facilities: Can Its Use Be Considered as Sustainable Solution from a Techno-Economic Standpoint? Sustainability 2016, 8, 618. [Google Scholar] [CrossRef]
- Feltrin, F.; Leccese, F.; Hanselaer, P.; Smet, K. Analysis of painted artworks’color appearance under various lighting settings. In Proceedings of the 2017 IEEE International Conference on Environment and Electrical Engineering and 2017 IEEE Industrial and Commercial Power Systems Europe (EEEIC/I&CPS Europe), Milan, Italy, 6–9 June 2017. [Google Scholar]
- Marks, J.; Andalman, B.; Beardsley, A.; Freeman, W.; Gibson, S.; Hodgins, J.; Kang, T.; Mirtich, B.; Pfister, H.; Ruml, W.; et al. Design Galleries: A General Approach to Setting Parameters for Computer Graphics and Animation. Siggraph 1997, 389–400. [Google Scholar] [CrossRef] [Green Version]
- Malzbender, T.; Gelb, D.; Wolters, H.; Zuckerman, B. Enhancement of Shape Perception by Surface Reflectance Transformation; HP Laboratories Technical Report; HPL: Palo Alto, CA, USA, 2000; Volume 38. [Google Scholar]
- Gershbein, R.; Hanrahan, P. A Fast Relighting Engine for Interactive Cinematic Lighting Design. Siggraph 2000, 353–358. [Google Scholar] [CrossRef]
- Frascarolo, M.; Martorelli, S.; Vitale, V. An innovative lighting system for residential application that optimizes visual comfort and conserves energy for different user needs. Energy Build. 2014, 83, 217–224. [Google Scholar] [CrossRef]
- De Lieto Vollaro, R.; Evangelisti, L.; Carnielo, E.; Battista, G.; Gori, P.; Guattari, C.; Fanchiotti, A. An integrated approach for an historical buildings energy analysis in a smart cities perspective. Energy Procedia 2014, 45, 372–378. [Google Scholar] [CrossRef]
- Iliadis, I.G. Archaeological museum showcase lighting. Light. Res. Technol. 1998, 30, 75–83. [Google Scholar] [CrossRef]
- Scuello, M.; Abramov, I.; Gordon, J.; Weintraub, S. Museum lighting: Optimizing the illuminant. Color Res. Appl. 2004, 29, 121–127. [Google Scholar] [CrossRef]
- Piccablotto, G.; Aghemo, C.; Pellegrino, A.; Iacomussi, P.; Radis, M. Study on Conservation Aspects Using LED Technology for Museum Lighting. Energy Procedia 2015, 78, 1347–1352. [Google Scholar] [CrossRef] [Green Version]
- Di Salvo, S. Innovation in lighting for enhancing the appreciation and preservation of archaeological heritage. J. Cult. Herit. 2014, 15, 209–212. [Google Scholar] [CrossRef] [Green Version]
- Salata, F.; Golasi, I.; Falanga, G.; Allegri, M.; De Lieto Vollaro, E.; Nardecchia, F.; Pagliaro, F.; Gugliermetti, F.; De Lieto Vollaro, A. Maintenance and Energy Optimization of Lighting Systems for the Improvement of Historic Buildings: A Case Study. Sustainability 2015, 7, 10770–10788. [Google Scholar] [CrossRef]
- Magnusso, Y. Museum Lighting and LED Technology. E-Conserv. Int. J. 2014, 2, 34–42. [Google Scholar]
- Balbi, B.; Protti, F.; Montanari, R. Driven by Caravaggio Through His Painting. An Eye-Tracking Study. In Proceedings of the Eighth International Conference on Advanced Cognitive Technologies and Applications (COGNITIVE 2016), Rome, Italy, 20–24 March 2016. [Google Scholar]
- Massaro, D.; Savazzi, F.; Di Dio, C.; Freedberg, D.; Gallese, V.; Gilli, G.; Marchetti, A. When art moves the eyes: A behavioral and eye-tracking study. PLoS ONE 2012, 7, e37285. [Google Scholar] [CrossRef] [PubMed]
- Quiroga, Q.; Quian, R.; Pedreira, C. How do we see art: An eye-tracker study. Front. Hum. Neurosci. 2011, 98. [Google Scholar] [CrossRef] [PubMed]
- Krejtz, K.; Szmidt, T.; Duchowski, A.T.; Krejtz, I. Entropy-based statistical analysis of eye movement transitions. In Proceedings of the ETRA’14, Symposium on Eye Tracking Research and Applications, Safety Harbor, FL, USA, 26–28 March 2014; pp. 159–166. [Google Scholar]
- Mozaffari Chanijani, S.S.; Klein, P.; Bukhar, S.S.; Kuhn, J.; Dengel, A. Entropy Based Transition Analysis of Eye Movement on Physics Representational Competence. In Proceedings of the 2016 ACM International Joint Conference on Pervasive and Ubiquitous Computing, Heidelberg, Germany, 12–16 September 2016; pp. 1027–1034. [Google Scholar]
- Hooge, I.; Camps, G. Scan-path entropy and arrow plots: Capturing scanning behaviour of multiple observers. Front. Psychol. 2013, 4, 1–10. [Google Scholar] [CrossRef] [PubMed]
- Malzbender, T.; Ordentlic, E. Maximum Entropy Lighting for Physical Objects; External Publication; HP Laboratories: Palo Alto, CA, USA, 2005. [Google Scholar]
- Gilland, J. Driving, Eye-Tracking and Visual Entropy: Exploration of Age and Task Effects. Ph.D. Thesis, University of South Dakota, Vermillion, South Dakota, 2008. [Google Scholar]
- Shannon, C.; Weaver, W. The Mathematical Theory of Communication; University of Illinois Press: Urbana, IL, USA, 1949; ISBN 0-252-72548-4. [Google Scholar]
- Balocco, C.; Baldanzi, E.; Farnini, A.; Tito, A.; Raffaelli, M. Light and Art: Perceptual stimuli and eye-tracking techniques. LUCE 2016, 320, 101–106, (In Italian and English). [Google Scholar]
- CSN EN 12464-1. 2011 Light and Lighting—Lighting of Work Places—Part 1: Indoor Work Places; Central Bureau of the CIE: Vienna, Austria, 2011.
- Villani, D.; Morganti, F.; Cipresso, P.; Ruggi, S.; Riva, G.; Gilli, G. Visual exploration patterns of human figures in action: An eye tracker study with art paintings. Front. Pshicol. 2015, 6, 1–10. [Google Scholar] [CrossRef] [PubMed]
- Van Gompel, R.P.G.; Fischer, M.H.; Murray, W.S.; Hill, R.L. Eye Movements: A Window on Mind and Brain; Elsevier: New York, NY, USA, 2007. [Google Scholar]
- Smet, K.; Ryckaert, W.R.; Pointer, M.R.; Deconinck, G.; Hanselaer, P. A memory colour quality metric for white light sources. Energy Build. 2012, 49, 216–225. [Google Scholar] [CrossRef]
- MiBac, Atto di Indirizzo sui Criteri Tecnico-Scientifici e Sugli Standard di Funzionamento e Sviluppo Dei Musei [Italian Standard (Guideline on technical-scientific criteria and on the standards of functioning and development of museums)]. Previsto Dall’articolo 150 del D.Lgs.112 1998.
- Montfoort, I.; Frens, M.A.; Hooge, I.T.; Lagers-van Haselen, G.C.; Van der Geest, J.N. Visual search deficits in Williams-Beuren syndrome. Neuropsychologia 2007, 45, 931–938. [Google Scholar] [CrossRef] [PubMed]
- Henk, T. Understanding Probability, 3rd ed.; Cambridge University Press: Cambridge, UK, 2012. [Google Scholar]
- Ash, R.B. Basic Probability Theory; Dover Pub. Inc.: New York, NY, USA, 1970. [Google Scholar]
- 3DS Max plus V-Ray and Mental-Ray. 2018. Available online: https://www.autodesk.it/products/3ds-max/features (accessed on 21 May 2018).
- CSN EN 15193. 2007. Energy Performance of Buildings—Energy Requirements for Lighting; Central Bureau of the CIE: Vienna, Austria, 2007.
- Zakaria, S.A.; Bahauddin, A. Light Art for Historical Buildings: A Case Study of the Heritage Buildings in George Town, Penang Island. Procedia Soc. Behav. Sci. 2015, 184, 345–350. [Google Scholar] [CrossRef]
- Salvadori, G.; Fantozzi, F.; Rocca, M.; Leccese, F. The energy audit activity focused on the lighting systems in historical buildings. Energies 2016, 9, 998. [Google Scholar] [CrossRef]
Figure 1.
The flow chart of the experimental measurement method used.

Figure 2.
The comparison of spectral characteristics of the 3 LED light sources normalized at 450 nm wavelength.
Figure 2.
The comparison of spectral characteristics of the 3 LED light sources normalized at 450 nm wavelength.

Figure 3.
The areas of interest (AOI).

Figure 4.
The heat maps: STD-LED, top left; top right WP-LED; bottom centred, VWh-LED.

Figure 5.
The gaze plot: STD-LED, top left; top right WP-LED; bottom centred, Vivid-White-LED.

Figure 6.
The luminance distribution—North wall—Villa Castello fresco.

Figure 7.
The luminance distribution—South wall—Villa Caiano fresco.

Figure 8.
The illuminance distribution—North wall—Villa Castello fresco.

Figure 9.
The illuminance distribution—South wall—Villa Caiano fresco.

Figure 10.
Renders—Villa Castello fresco.

Figure 11.
Renders—Villa Caiano fresco.


Table 1.
The photometric measurement results—present state.
| Villa Caiano Fresco South Wall | Villa Castello Fresco North Wall | Pratolino Fresco West Wall | Medici Gardens East Wall—Right | Medici Gardens East Wall—Left | Floor | |
|---|---|---|---|---|---|---|
| Mean illuminance (lx) | 18.24 | 22.04 | 14.43 | 8.27 | 8.96 | 12.82 |
| Max illuminance (lx) | 25.80 | 29.5 | 18.4 | 15.5 | 16.5 | 18.9 |
| Minimum illuminance (lx) | 8.16 | 10.8 | 9.89 | 6.96 | 7.63 | 3.39 |
| (Min_Illuminance/Average Illuminance) | 0.45 | 0.49 | 0.69 | 0.84 | 0.85 | 0.26 |
| (Max_Illuminance/Average Illuminance) | 3.16 | 2.73 | 1.86 | 2.23 | 2.16 | 5.58 |
Table 2.
The ratio between higher fixations number and fewer visits number.
| AOI | LED_STD | LED_VWP | LED_VWh |
|---|---|---|---|
| courtyard | 3.9 | 3.5 | 5.3 |
| threes-right | 2.4 | 2.3 | 2.6 |
| three-left | 2.0 | 1.8 | 2.2 |
| avenue | 2.8 | 2.5 | 3.6 |
| sky | 2.2 | 2.1 | 2.4 |
Table 3.
The percentage of the time during which an area of interest (AOI) was fixed and observed, under the three LED lightings.
Table 3.
The percentage of the time during which an area of interest (AOI) was fixed and observed, under the three LED lightings.
| AOI | LED_STD | LED_VWP | LED_VWh |
|---|---|---|---|
| courtyard | 9.14% | 8.71% | 9.79% |
| threes-right | 2.17% | 1.83% | 2.95% |
| three-left | 4.01% | 3.78% | 4.85% |
| avenue | 7.18% | 6.78% | 8.94% |
| sky | 0.89% | 0.78% | 1.18% |
Table 4.
The probability and logarithm of the probability distribution for the three tested LEDs.
| STD | VWP | VWh | STD | VWP | VWh | |
|---|---|---|---|---|---|---|
| Observers | p(xi) | log2 p(xi) | ||||
| 1 | 0.119 | 0.014 | 0.175 | −3.068 | −6.129 | −2.511 |
| 2 | 0.122 | 0.083 | 0.211 | −3.039 | −3.585 | −2.244 |
| 3 | 0.395 | 0.389 | 0.522 | −1.340 | −1.360 | −0.939 |
| 4 | 0.318 | 0.167 | 0.189 | −1.652 | −2.585 | −2.402 |
| 5 | 0.395 | 0.351 | 0.340 | −1.340 | −1.509 | −1.556 |
| 6 | 0.143 | 0.012 | 0.096 | −2.807 | −6.392 | −3.377 |
| 7 | 0.032 | 0.245 | 0.077 | −4.954 | −2.030 | −3.700 |
| 8 | 0.357 | 0.509 | 0.155 | −1.485 | −0.974 | −2.689 |
| 9 | 0.157 | 0.198 | 0.337 | −2.668 | −2.339 | −1.568 |
| 10 | 0.288 | 0.241 | 0.314 | −1.798 | −2.053 | −1.671 |
| 11 | 0.265 | 0.352 | 0.466 | −1.918 | −1.505 | −1.102 |
| 12 | 0.410 | 0.421 | 0.488 | −1.286 | −1.248 | −1.034 |
| 13 | 0.535 | 0.476 | 0.615 | −0.902 | −1.072 | −0.700 |
Table 5.
The photometric properties of the three LEDs tested and their control and dimming conditions.
Table 5.
The photometric properties of the three LEDs tested and their control and dimming conditions.
| Project Proposal | Wall | Light Source | Tc (K) | Beam Opening | Nominal Power (W) | Rake Angle (Degrees) | Luminous Flux (lm) | Light Flux Reduction (%) |
|---|---|---|---|---|---|---|---|---|
| Accent lighting | Villa Caiano fresco (South) | 2 LED (COB) | 4100 | 28 | 24 | 16 | 1900 | 58 |
| 2600 | 79 | |||||||
| Villa Castello fresco (North) | 3000 | 91 | ||||||
| 3300 | 100 | |||||||
| Pratolino fresco (West) | 2200 | 67 | ||||||
| 2200 | 67 | |||||||
| Medici Gardens (East-right) | 3300 | 100 | ||||||
| Medici Gardens (East-left) | 3300 | 100 | ||||||
| Base lighting | Villa Caiano fresco (South) | 2 LED (COB) | 4100 | 28 | 24 | 16 | 1750 | 53 |
| 2500 | 76 | |||||||
| Villa Castello fresco (North) | 2900 | 88 | ||||||
| 3300 | 100 | |||||||
| Pratolino fresco (West) | 2000 | 61 | ||||||
| 2000 | 61 | |||||||
| Medici Gradens (East-right) | 3300 | 100 | ||||||
| Medici Gardens (East-left) | 3300 | 100 | ||||||
| Lowered Vault | 4 LED (COB) | 1300 | 39 | |||||
| 1500 | 45 | |||||||
| 1500 | 45 | |||||||
| 1500 | 45 |
Table 6.
The illuminance and luminance values—simulation results—comparison between the present state and new lighting proposal.
Table 6.
The illuminance and luminance values—simulation results—comparison between the present state and new lighting proposal.
| Wall | Emax (lx) | Emin (lx) | Emean (lx) | Emax/ Emean | Emax/ Emin | Mean Luminance (cd/m2) | |
|---|---|---|---|---|---|---|---|
| Villa Caiano fresco South | Present state | 25.8 | 8.16 | 18.24 | 0.45 | 3.16 | 0.76 |
| Proposal Accent Lighting | 150 | 90.4 | 119.99 | 0.75 | 1.66 | 4.42 | |
| Proposal Base Lighting | 149 | 90.8 | 121.53 | 0.75 | 1.64 | 4.45 | |
| Villa Castello fresco North | Present state | 29.5 | 10.8 | 22.04 | 0.49 | 2.73 | 0.91 |
| Proposal Accent Lighting | 149 | 80.1 | 110.2 | 0.73 | 1.86 | 4.15 | |
| Proposal Base Lighting | 149 | 82.6 | 112.53 | 0.73 | 1.80 | 4.29 | |
| Pratolino fresco West | Present state | 18.4 | 9.89 | 14.43 | 0.69 | 1.86 | 0.51 |
| Proposal Accent Lighting | 141 | 39 | 76.52 | 0.51 | 3.62 | 2.38 | |
| Proposal Base Lighting | 136 | 41.2 | 79.93 | 0.52 | 3.30 | 2.88 | |
| Medici Gardens East-left | Present state | 16.5 | 7.63 | 8.96 | 0.85 | 2.16 | 0.39 |
| Proposal Accent Lighting | 131 | 42 | 58.9 | 0.71 | 3.12 | 2.54 | |
| Proposal Base Lighting | 142 | 48.2 | 63.49 | 0.76 | 2.95 | 2.68 | |
| Medici Gardens East-right | Present state | 15.5 | 6.96 | 8.27 | 0.84 | 2.23 | 0.4 |
| Proposal Accent Lighting | 141 | 44 | 64.38 | 0.68 | 3.20 | 2.85 | |
| Proposal Base Lighting | 147 | 48.8 | 66.8 | 0.73 | 3.01 | 2.99 | |
| Lowered vault | Present state | 12.8 | 2.39 | 10.05 | 0.24 | 5.36 | 0.41 |
| Proposal Accent Lighting | 23.5 | 9.99 | 15.38 | 0.65 | 2.35 | 2.94 | |
| Proposal Base Lighting | 145 | 15.7 | 41.73 | 0.58 | 9.24 | 3.28 |
Table 7.
The photometric properties of the compact fluorescent lamps.
| Project Proposal | Wall | Compact Fluorescent Source | Tc (K) | Nominal Power (W) | Rake Angle (Degrees) | Luminous Flux (lm) |
|---|---|---|---|---|---|---|
| Base lighting | Villa Caiano fresco (South) | 5 | 4100 | 42 W | 16 | 3200 |
| 3200 | ||||||
| 3200 | ||||||
| Villa Castello fresco (North) | 5 | 16 | 3200 | |||
| 3200 | ||||||
| 3200 | ||||||
| Pratolino fresco (West) | 2 | 30 | 3200 | |||
| 40 | 3200 | |||||
| Medici Gardens fresco (East-right) | 2 | 17 | 3200 | |||
| Medici Gardens fresco (East-left) | 17 | 3200 | ||||
| Lowered vault | 4 | 18 | 3200 | |||
| 30 | 3200 | |||||
| 14 | 3200 | |||||
| 20 | 3200 |
Table 8.
The illuminance and luminance values—simulation results—lighting by compact fluorescent lamps.
Table 8.
The illuminance and luminance values—simulation results—lighting by compact fluorescent lamps.
| Wall | Emax (lx) | Emin (lx) | Emean (lx) | Emax/ Emean | Emax/ Emin | Mean Luminance (cd/m2) | |
|---|---|---|---|---|---|---|---|
| Villa Caiano fresco South | Base lighting | 111 | 73.20 | 93.97 | 0.78 | 1.52 | 3.72 |
| Villa Castello fresco North | Base lighting | 108 | 71.50 | 91.88 | 0.78 | 1.51 | 5.82 |
| Pratolino fresco West | Base lighting | 150 | 53.70 | 87.05 | 0.62 | 2.79 | 3.28 |
| Medici Gardens fresco East-right | Base lighting | 143 | 34.60 | 63.11 | 0.55 | 4.13 | 2.43 |
| Medici Gardens fresco East-left | Base lighting | 121 | 37.80 | 56.69 | 0.67 | 3.20 | 3.04 |
| Lowered vault | Base lighting | 150 | 7.58 | 81.59 | 0.09 | 19.79 | 2.65 |
© 2018 by the authors. Licensee MDPI, Basel, Switzerland. This article is an open access article distributed under the terms and conditions of the Creative Commons Attribution (CC BY) license (http://creativecommons.org/licenses/by/4.0/).
Share and Cite
MDPI and ACS Style
Balocco, C.; Volante, G. Lighting Design for Energy Sustainability, Information, and Perception. A Museum Environment as a Case Study. Sustainability 2018, 10, 1671. https://0-doi-org.brum.beds.ac.uk/10.3390/su10051671
AMA Style
Balocco C, Volante G. Lighting Design for Energy Sustainability, Information, and Perception. A Museum Environment as a Case Study. Sustainability. 2018; 10(5):1671. https://0-doi-org.brum.beds.ac.uk/10.3390/su10051671
Chicago/Turabian StyleBalocco, Carla, and Giulia Volante. 2018. "Lighting Design for Energy Sustainability, Information, and Perception. A Museum Environment as a Case Study" Sustainability 10, no. 5: 1671. https://0-doi-org.brum.beds.ac.uk/10.3390/su10051671
Note that from the first issue of 2016, this journal uses article numbers instead of page numbers. See further details here.