Balancing Urban Biodiversity Needs and Resident Preferences for Vacant Lot Management


1
Department of Biology, Pittsburg State University, 1701 S. Broadway, Pittsburg, KS 66762, USA
2
School of Natural Resources, University of Missouri, 302 Anheuser-Busch Natural Resources Building, Columbia, MO 65211, USA
3
Department of Environmental Conservation, University of Massachusetts, 160 Holdsworth Way, Amherst, MA 01003, USA
*
Author to whom correspondence should be addressed.
Sustainability 2018, 10(5), 1679; https://0-doi-org.brum.beds.ac.uk/10.3390/su10051679
Submission received: 19 April 2018
/
Revised: 16 May 2018
/
Accepted: 16 May 2018
/
Published: 22 May 2018
(This article belongs to the Special Issue Sustaining the Shrinking City: Concepts, Dynamics and Management)
Abstract
:Urban vacant lots are often a contentious feature in cities, seen as overgrown, messy eyesores that plague neighborhoods. We propose a shift in this perception to locations of urban potential, because vacant lots may serve as informal greenspaces that maximize urban biodiversity while satisfying residents’ preferences for their design and use. Our goal was to assess what kind of vacant lots are ecologically valuable by assessing their biotic contents and residents’ preferences within a variety of settings. We surveyed 150 vacant lots throughout Baltimore, Maryland for their plant and bird communities, classified the lot’s setting within the urban matrix, and surveyed residents. Remnant vacant lots had greater vegetative structure and bird species richness as compared to other lot origins, while vacant lot settings had limited effects on their contents. Residents preferred well-maintained lots with more trees and less artificial cover, support of which may increase local biodiversity in vacant lots. Collectively, we propose that vacant lots with a mixture of remnant and planted vegetation can act as sustainable urban greenspaces with the potential for some locations to enhance urban tree cover and bird habitat, while balancing the needs and preferences of city residents.
1. Introduction
Urban greenspaces are extremely diverse, not only in their ecological contents and uses, but in their value to local residents. Vacant lots are a common type of informal urban greenspace [1,2], especially in shrinking cities [3], which are particularly controversial among city residents. Areas within a city are considered vacant after a demolition of a building and then its abandonment, never being utilized due to poor building conditions, or simply remaining as unoccupied areas of the city [4]. Often considered a neighborhood eyesore, a place for crime and trash, or as dangerous, vacant lots are usually deemed a local problem for neighborhood residents. Even though vacant lots carry these negative social connotations, they also are locations that have enormous potential for increasing biodiversity and ecosystem services in cities [2,5,6,7,8].
Over the past decade, vacant lots have increasingly been assessed for their ecological and social value across a number of the world’s cities [5,9,10,11,12,13], however few studies have assessed these values together in the context of their characteristics and settings within the urban matrix. Each vacant lot within a city has unique features that either may constrain or promote ecological and social benefits for the surrounding community, and these features should all be evaluated together in order to maximize urban environmental potential [14]. For example, vacant lots may be defined by their settings within a city block [15], biological contents and habitat structure [12,16,17], and social uses [12,18], all of which are integral in determining how these spaces could be managed, their ecological integrity, and residents’ response to the lot.
Vacant lots are typically unmanaged lots; however, they are quite diverse depending on their location in the city and how the lot’s vegetation originated. Urban vegetation can be classified into three major groups: emergent, planted, and remnant vegetation [19]. Depending on their origin, vacant lots can be characterized into one of these three vegetation groups. For example, vacant lots that are abandoned following a demolition often are dominated by weedy, dense shrubs, or have other forms of emergent, or ruderal, vegetation [19]. These lots may have abundant and diverse plant life, which may provide increased primary production, additional sources of habitat for urban wildlife, air and water purification, and more regulating services [5,20]. Plant communities in these sites are often dependent on the surrounding vegetation, as ruderal plant species are similar to species in adjacent habitats [21,22], which may increase the potential for exotic invasive species colonization in emergent lots [19]. Even though these emergent lots may be ecologically beneficial, these lots are often negatively viewed by residents as uninviting wastes of space [18,23] due to their lack of cues to care [13,24].
On the other end of the spectrum, vacant lots may be adopted by local residents and heavily managed through plantings and other landscaping efforts. Residents, especially those who live adjacent to vacant lots, may voluntarily manage the site as a way to create the impression of extending their own property lines, for recreational purposes, or as ways to beautify their neighborhood as an act of community pride. These planted vacant lots may be used as locations for community gardens or places for the community to gather. Even though these lots may provide areas of recreation, improve the community’s aesthetic value, and enhance community cohesion with positive resident associations [25], they may not be beneficial in terms of urban biodiversity. Lots dominated by frequently mowed lawns or those that lack a shrub layer or other major sources of vegetation can reduce necessary food and cover resources for urban wildlife potential [8,14,26,27,28]. Consequently, conflict may result due to this imbalance between urban biodiversity goals and residents’ needs and preferences without understanding how to simultaneously maximize both aspects.
Remnant vacant lots are patches within the urban matrix that have not been developed in recent history due to steep slopes, irregular shapes, or flooding hazards [18] and remain unused or abandoned. Vacant lots with remnant vegetation tend to be rare and small in area, as the abundance of remnant vegetation tends to decrease along the urban-to-rural gradient [18,19]. Due to their age, remnant vacant lots may have old, large trees and other forms of unmanaged vegetation, providing an abundance of habitat sources for wildlife [8]. The biodiversity benefits of remnant vacant lots may juxtapose negative reactions by residents. Similar to emergent vacant lots, residents may not prefer remnant vacant lots in their neighborhoods due to their dense, unmanaged structure and composition. Conversely, residents may prefer remnant vacant lots for their natural features and species-rich plant and bird communities [29,30], depending on the vegetation structure and residents’ attitudes and environmental knowledge [31].
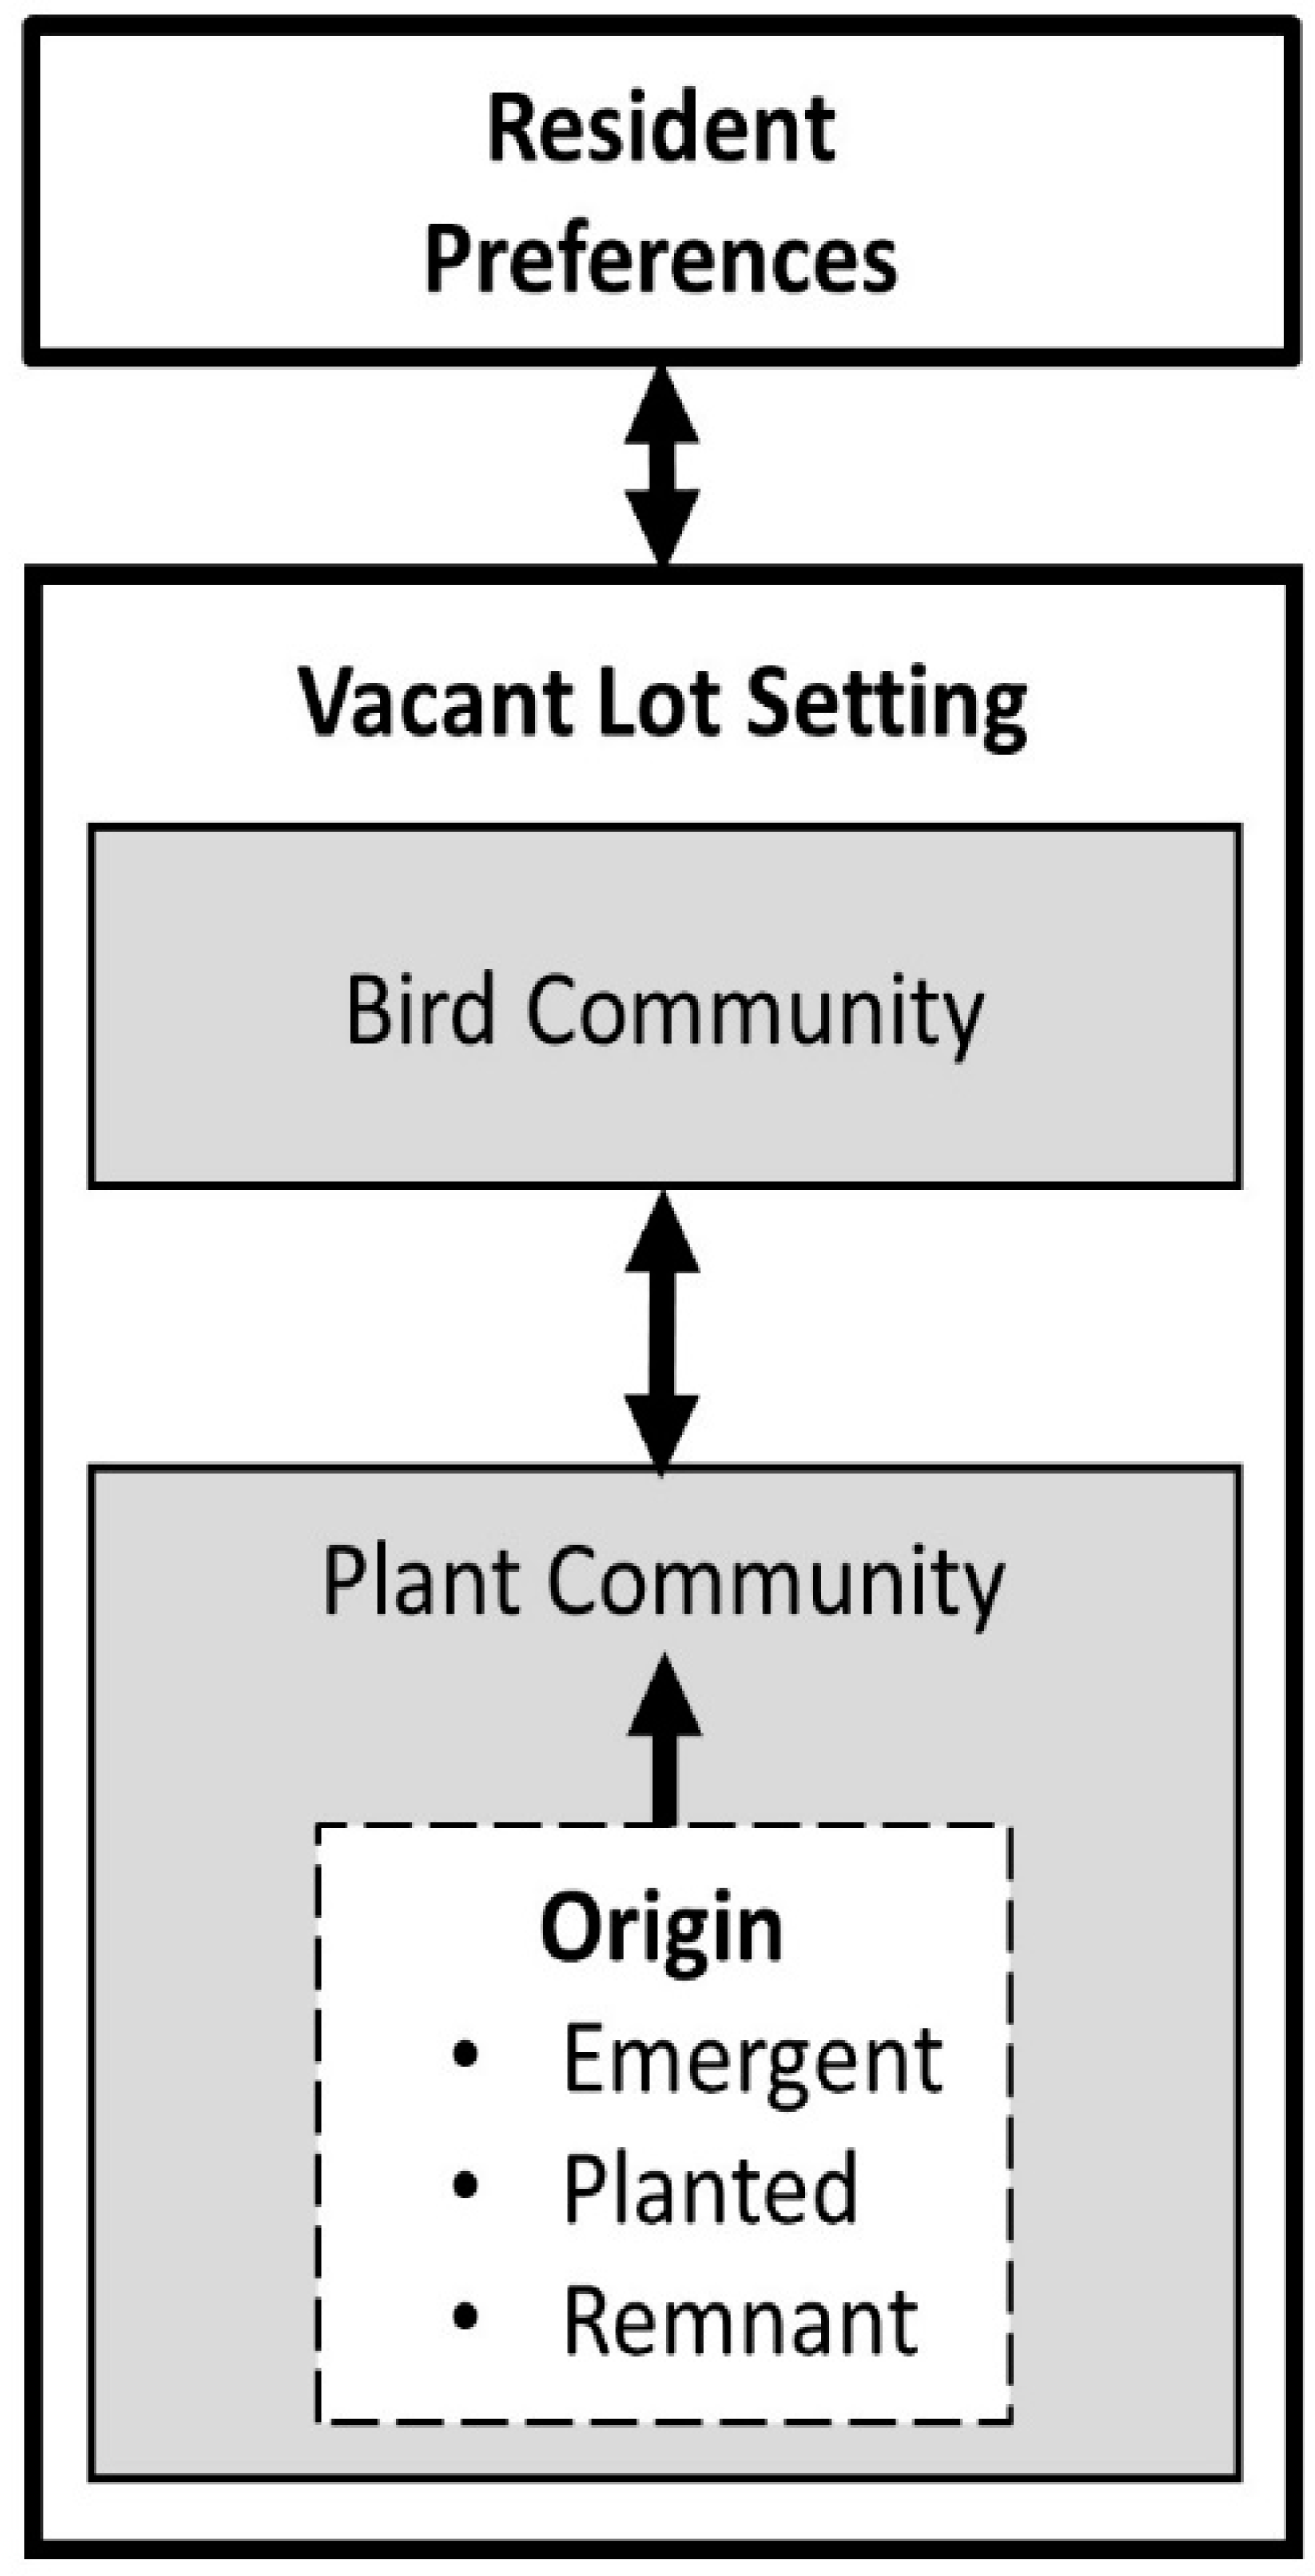
Beyond their vegetative characteristics, vacant lots also differ in their size, shape, and location within the city [15]. Each vacant lot setting offers its own benefits and constraints regarding urban biodiversity and resident use. Vacant lots are often small in area and not conducive to development [32], constrained by surrounding built features. For example, if a property becomes vacant within a city block, the size and contents of the vacant lot would be defined by the adjacent buildings. If the buildings are tall or surround the lot on three sides, vegetative growth may be hindered by a lack of direct sunlight [15]. If a remnant vacant lot is large and takes up an entire city block, it may have high biodiversity potential yet low resident value if the site is not actively used or lacks indicators of management [33]. Small, planted vacant lots may be ripe for community adoption as they are nearby residents’ homes, but may support little plant or animal diversity with large areas of lawn. Due to these conflicts between vacant lot origin, settings, and resident preferences, we ask if there is an achievable balance among multiple benefits for vacant lot management (Figure 1).
The goal of our research was to synthesize multiple features of vacant lots to determine which combination is the most sustainable for future vacant lot management. There are many ways to manage a vacant lot for both biodiversity and people; however, the strategies that we use should maximize ecological goals and human values to ensure the longevity of the space and limit conflict [14,34]. We may view the optimization of vacant lot settings, origin, and resident preferences as an urban sustainably goal, as these features promote biodiversity conservation, access to nearby nature for residents, and access to usable greenspaces, as defined by suiting residents’ preferences. Thus, in this paper, we define a vacant lot as sustainable if it can maximize both biodiversity and residents’ preferences within the constraints of a vacant lot’s setting and vegetation origin.
2. Materials and Methods
2.1. Study Area
Our study on vacant lots occurred in Baltimore, Maryland as a part of the Baltimore Ecosystem Study Long Term Ecological Research (LTER) project. Considered a shrinking city, Baltimore has lost 34% of its population since its peak in 1950 [35,36] due to loss of manufacturing jobs, increasing crime rates, and movement into the adjacent county. This loss of population and jobs since 1950 caused an increase in vacant lots throughout the city to its current level of 16,500 vacant parcels, comprising over 1700 hectares, or 7% of the city’s total area [8]. A vacant lot is defined by the Baltimore City Code Article 13 § 11 [37] as “an individual parcel of real property that is unimproved by an assessed building” or “any parcel of land that has the potential to be built.”
Vacancies in rowhouse neighborhoods accentuate the abundance of vacant land in the city and provide a variety of different settings for vacant lots. Rowhouses are medium-density housing with rows of connected narrow brick homes, an architectural style that has characterized Baltimore over the past 200 years [38]. Two kinds of rowhouses were built in block squares, larger homes lining the block’s roadways and smaller homes in their center [38]. Over time, these smaller interior units were demolished and made into inner block parks during the urban renewal of the 1960s; however, many of these inner block parks have since been abandoned, along with any vacancies created by single or multiple rowhouse demolition.
2.2. Site Selection
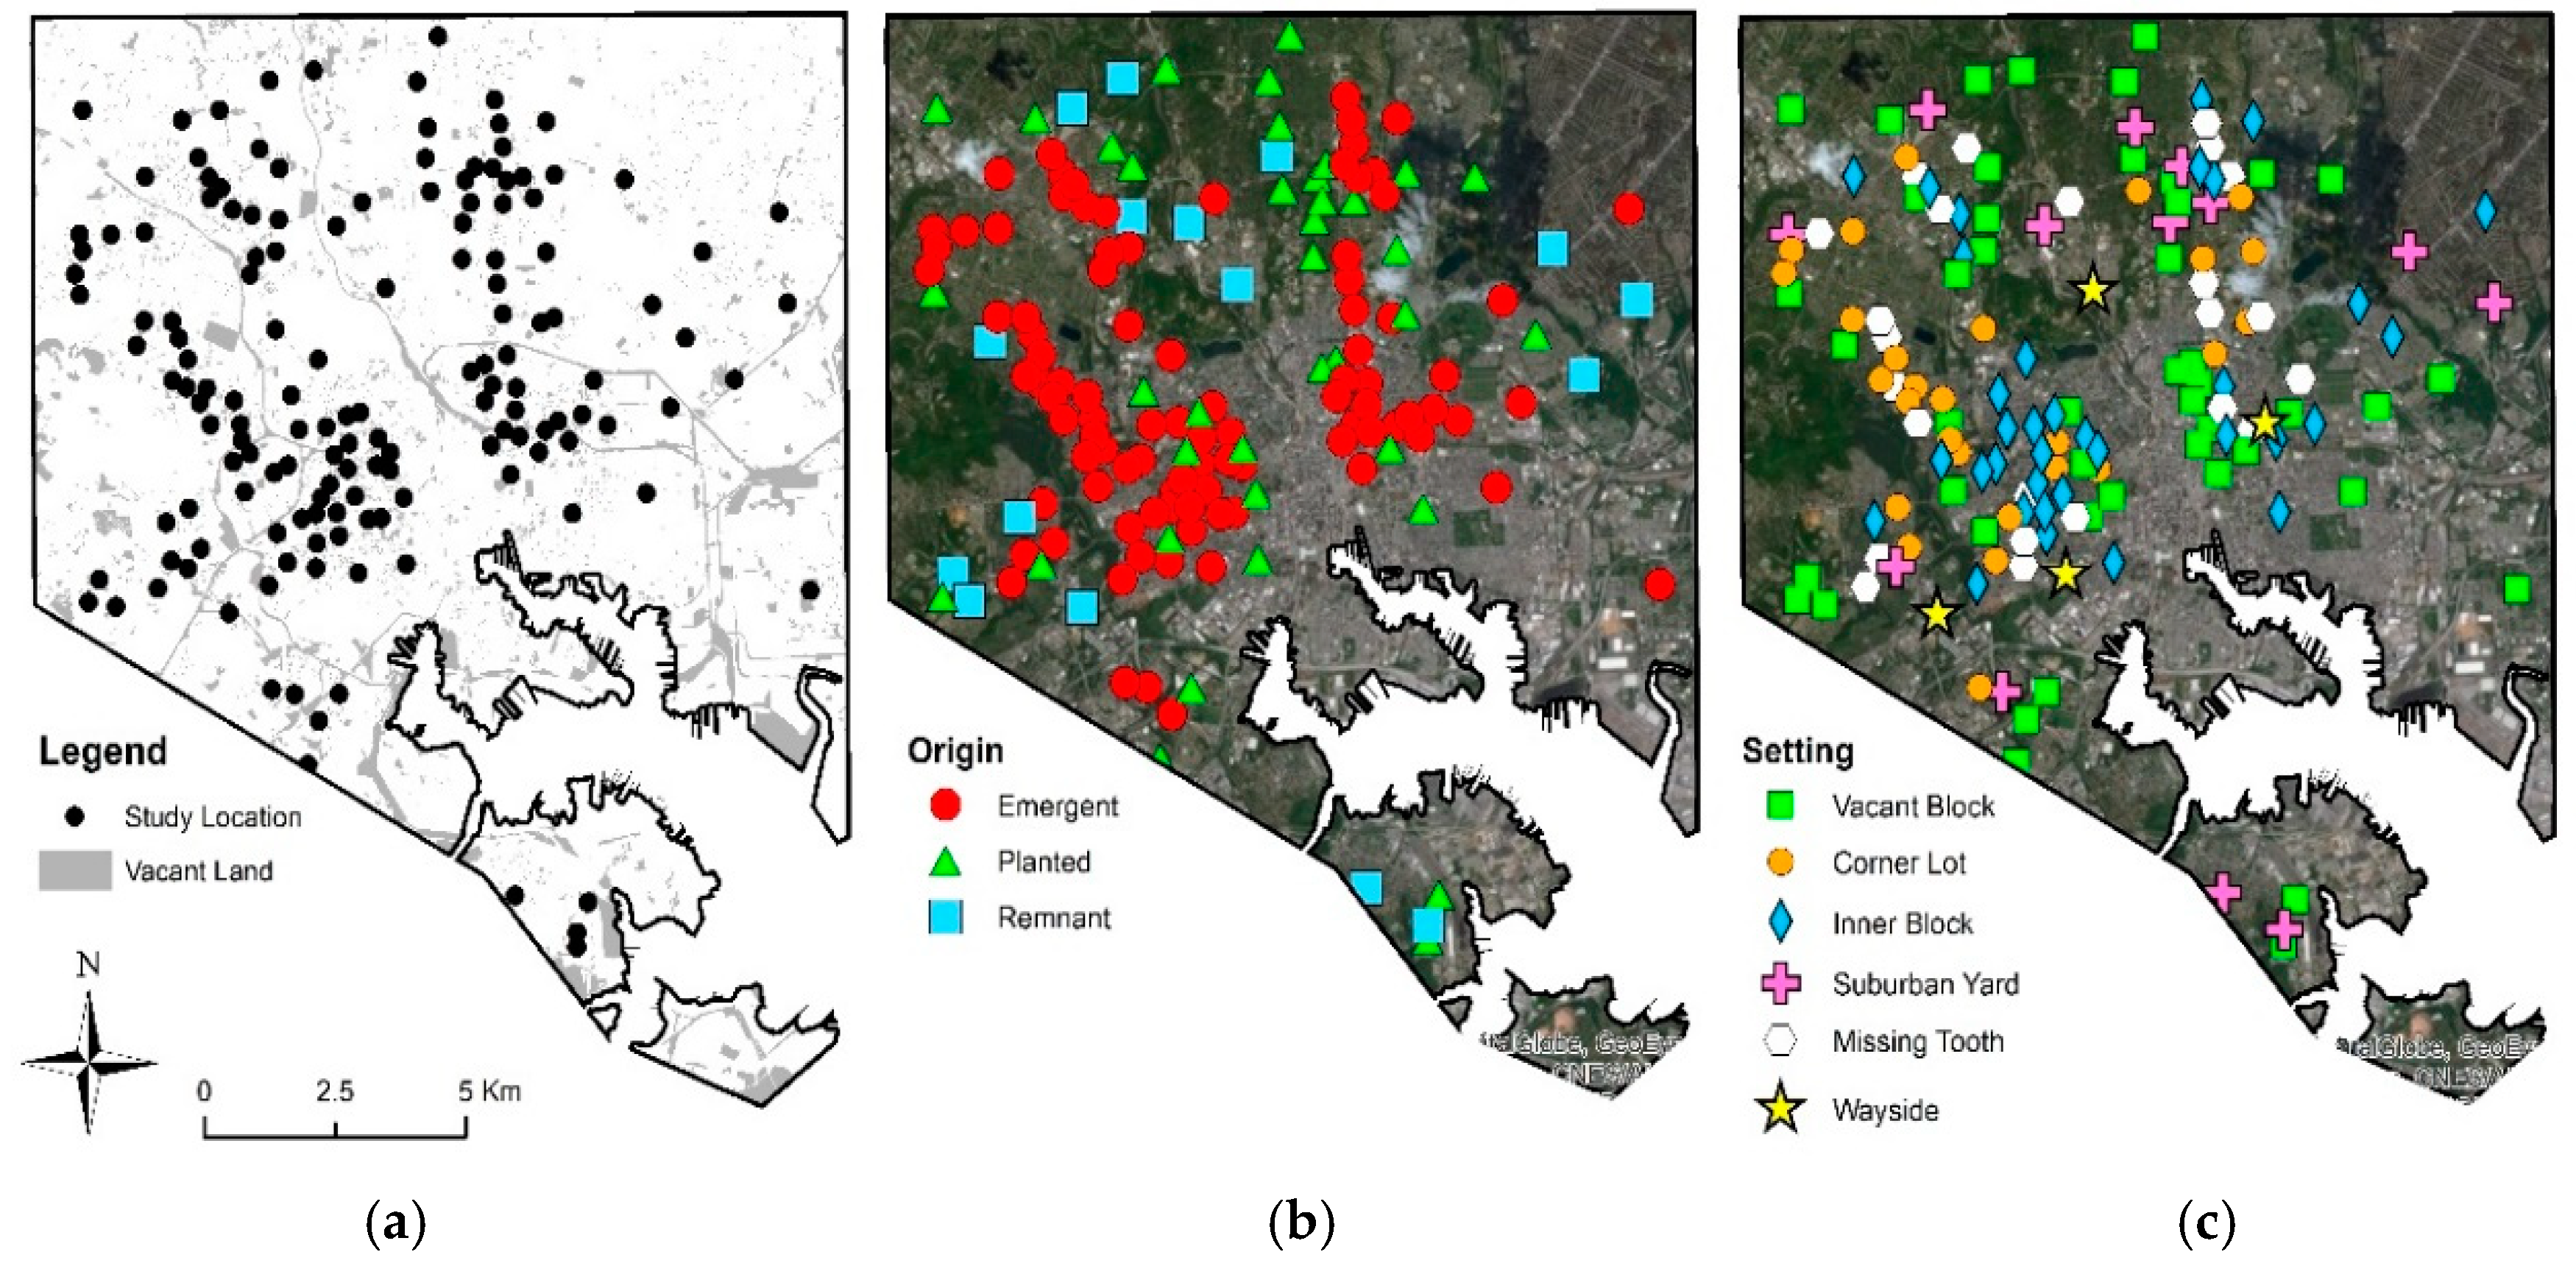
We randomly selected 150 vacant lots that were accessible, larger than 0.05 ha, and that contained some form of vertical vegetation (Figure 2). Inaccessible lots were typically those around major transportation routes, such as railway lines and highways. Vacant lot locations were provided by the Baltimore City Office of Sustainability. Lots were located at least 250 apart from one another, as a part of a parallel vacant lot bird community study [8,26]. We visited sites during May–July of 2013–2015 to classify the site by its setting and vegetation origin, sample the vegetation community and structure, and collect data on the bird community.
2.3. Vacant Lot Settings and Origins
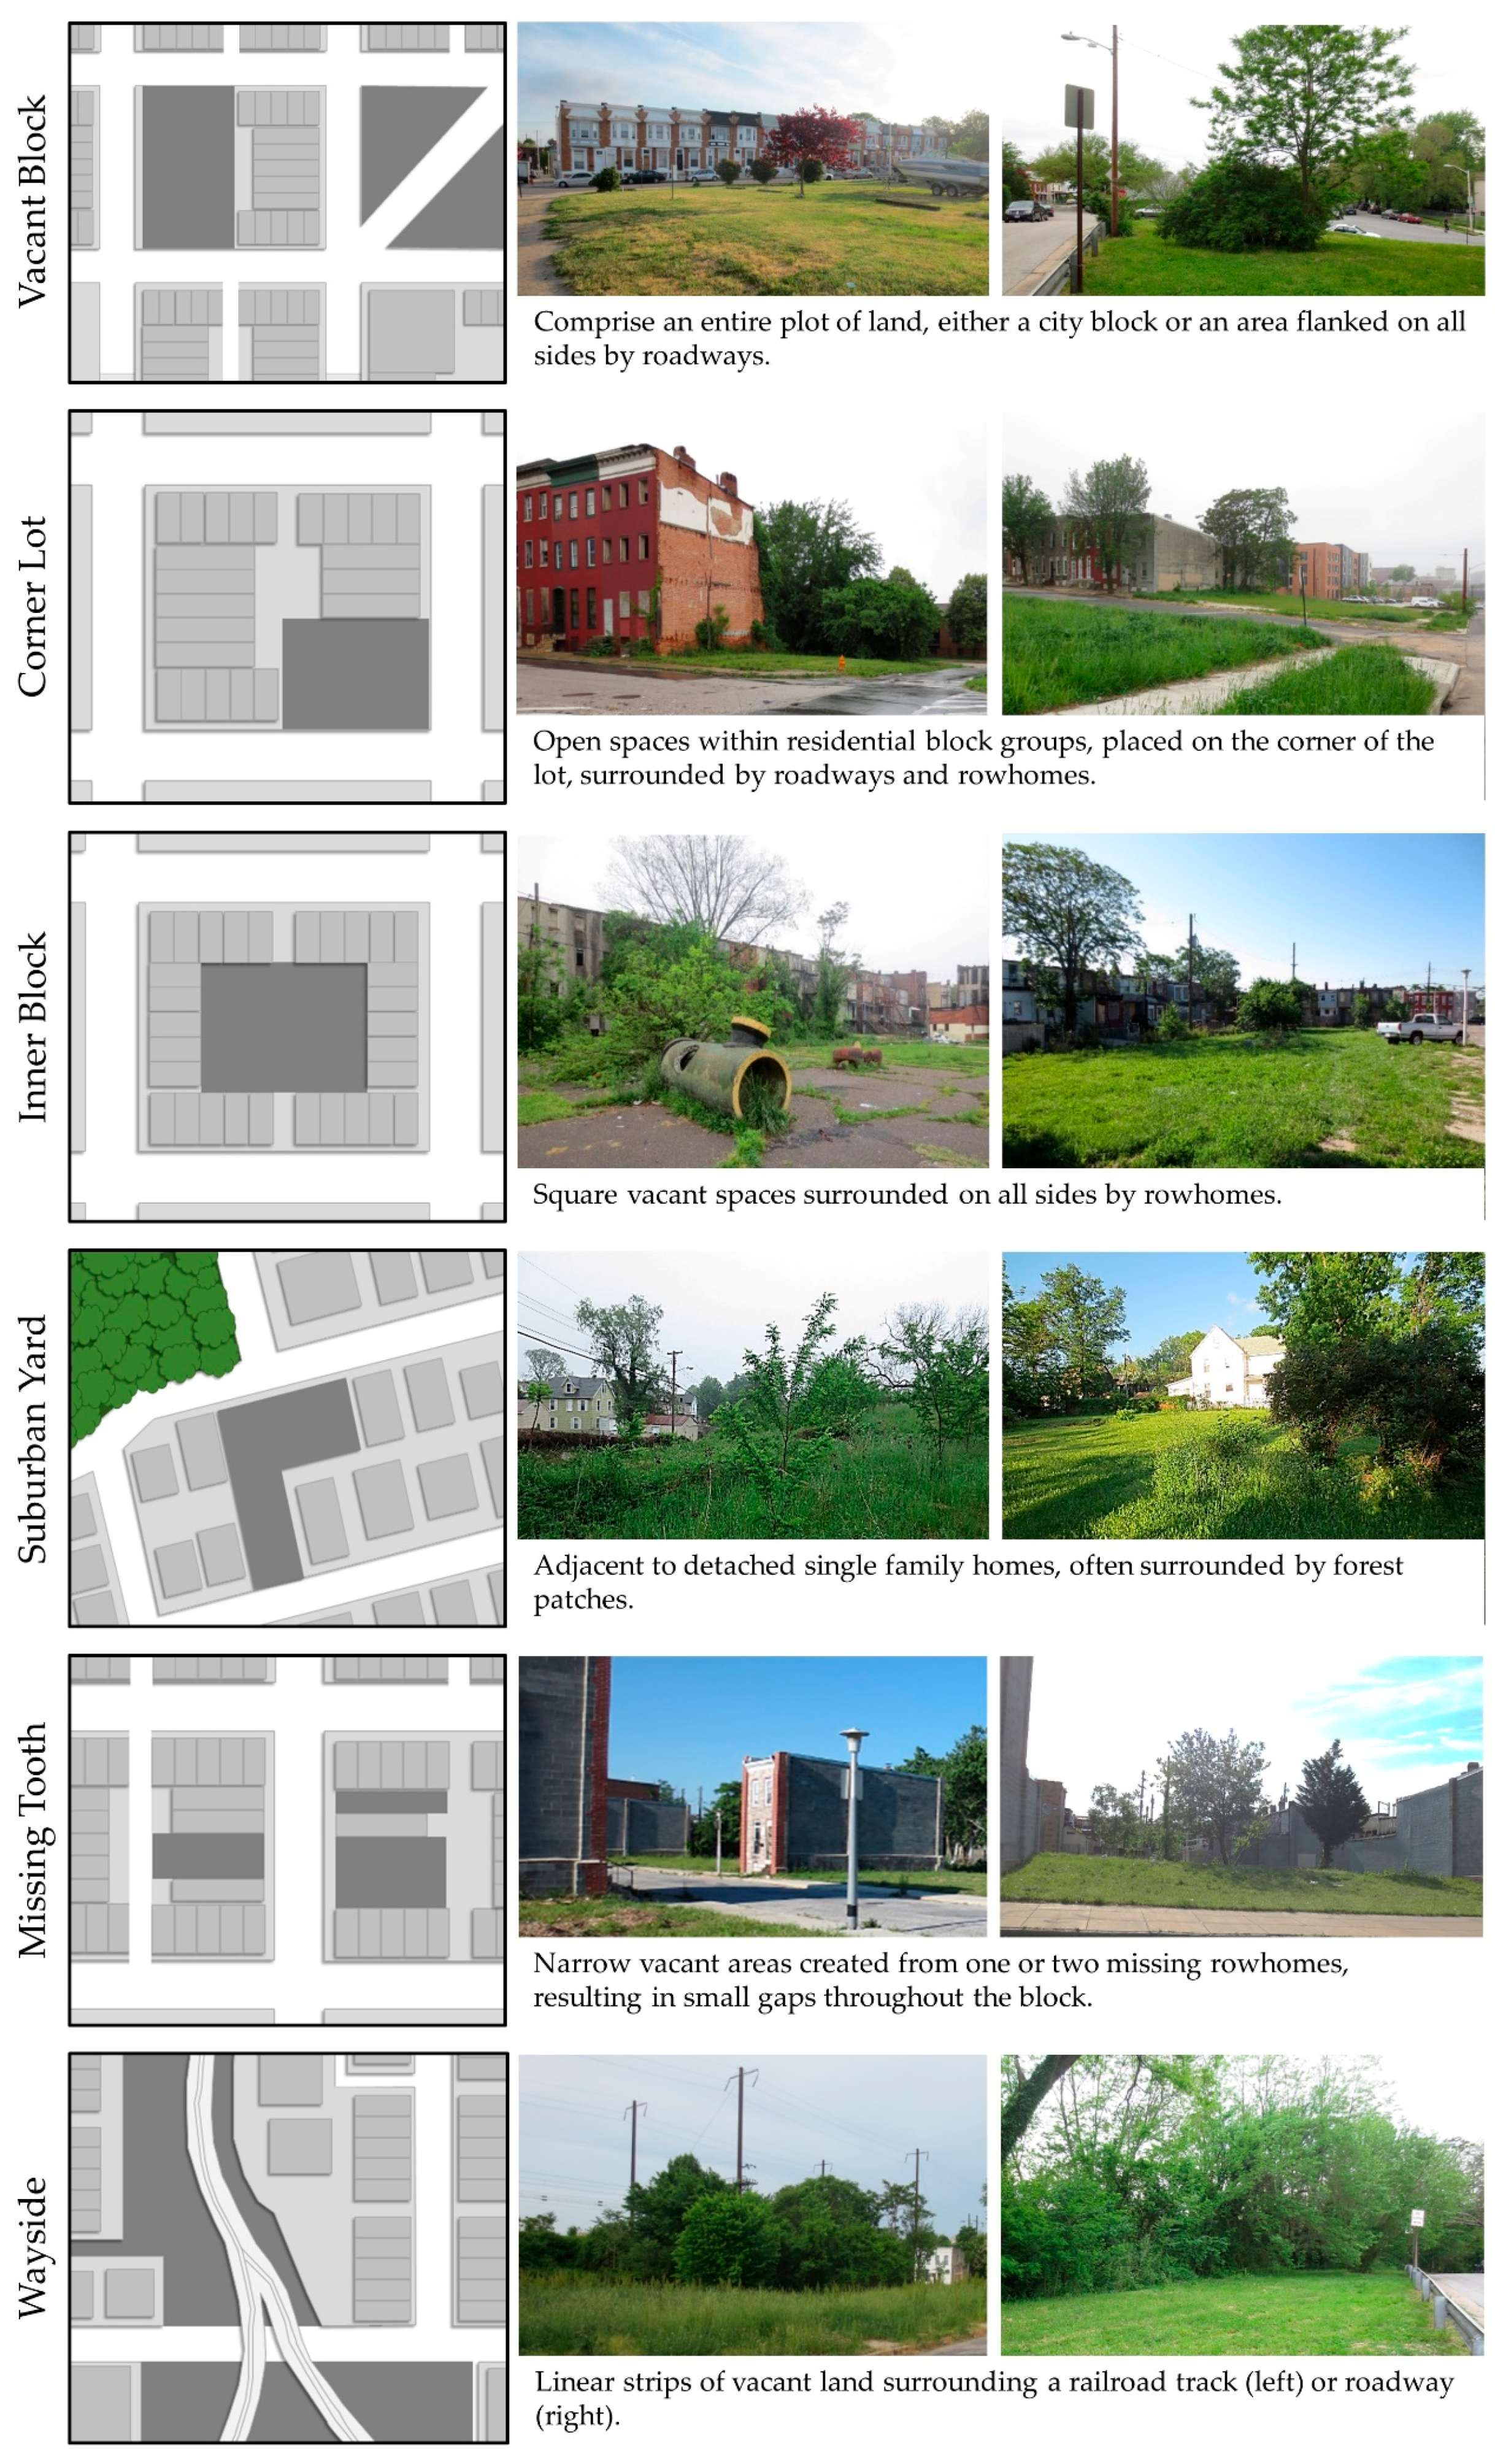
We identified unique classes of vacant lots, regarding the lot’s setting and vegetation origin. In order to classify vacant lots by their setting within a city block, we used descriptions provided by Spirn and Pollo [15] as an initial guideline, and then described additional unique settings found in Baltimore. We grouped the 150 lots into six settings: vacant block, inner block, corner lot, missing tooth, suburban yard, and waysides (Figure 3).
A vacant block was defined by a vacancy comprising an entire city block (>0.4 ha) or when a vacant lot was bordered by a roadway on all sides. Corner lots were lots adjacent to buildings, located at the corner of a city block. Inner blocks were surrounded by a complete square of rowhouses within a city block. Suburban yards were vacant lots located between homes in neighborhoods characterized by detached single family homes. Missing tooth vacant lots were small, narrow rectangular lots located between two or more buildings within rowhome neighborhoods. Waysides were narrow vacant lots bordering roadsides or railway lines.
We used categorizations provided by Zipperer [19,39] to determine the origin of vegetation in each lot. By evaluating the vegetation composition and structure of the lot, we categorized each lot by their observed vegetation origins: emergent, planted and remnant. Emergent vacant lots were those that were only recently cleared after site development and remain in an early successional stage. Emergent lots were dominated by pioneer species and small diameter trees, often weedy in appearance with tall grass and a dense shrub layer. Planted lots were those with clear gardening efforts, usually with planted trees, flower gardens, and intensively managed (i.e., dominated by lawn cover). Remnant lots existed before development of the area, usually with large diameter trees, leaf litter cover, old fallen trees, and minimal lot management. One vacant lot may have sections of different vegetation sources due to periodic removal of development surrounding the lot, so we classified the lot by the origin of the majority of its vegetation.
2.4. Plant and Bird Community
We used the lot’s vegetation and bird community as indicators of vacant lot ecological quality [40,41]. We sampled lot vegetation within three 0.04 ha plots spaced evenly 20 m at compass readings from 0°, 120°, and 240° from the lot’s center [42]. If one of the three sample plots fell outside the vacant lot, we did not sample it. To describe the vegetation structure and composition of the vacant lot, we measured 10 vegetation variables in each sample plot: canopy cover, canopy height, shrub density, ground cover height, and tree abundance, species richness, and diameter-at-breast-height (DBH). Shrub density was measured by calculating the number of shrub stems intersected across four transects from the plot’s center, in each cardinal direction. We measured percent ground cover for artificial ground cover and grass. We determined vacant lot area from maps provided by the Baltimore City Office of Sustainability [43].
The bird community was recorded via point count surveys during three site visits in one year during the breeding season. All birds seen and heard during a five-minute unlimited radius point count survey were documented and later analyzed for the site’s bird community species composition and species richness [44].
2.5. Residents’ Preference
We emailed an electronic survey to the leaders of 20 community groups in Baltimore (Supplementary Materials; University of Missouri Institutional Review Board Project #2003104). These community groups included residents that participated in park associations (e.g., Friends of Patterson Park, Baltimore, MD, USA), naturalist groups, and community associations located within neighborhoods with a large amount of vacant lots. We targeted these groups for our survey because they would include the residents that would most likely be those to maintain or drive management actions in vacant lots. Contacts for these community associations were often residents that were aware of our sampling efforts, and eventually became our contact source for those neighborhood residents. A snowball sampling approach [45] was used to distribute the survey, as community group members passed the survey along to friends and coworkers living within Baltimore. As our sampled lots occurred throughout the city, we assumed that most city residents encountered vacant lots during their daily lives. No incentive was given to survey participants.
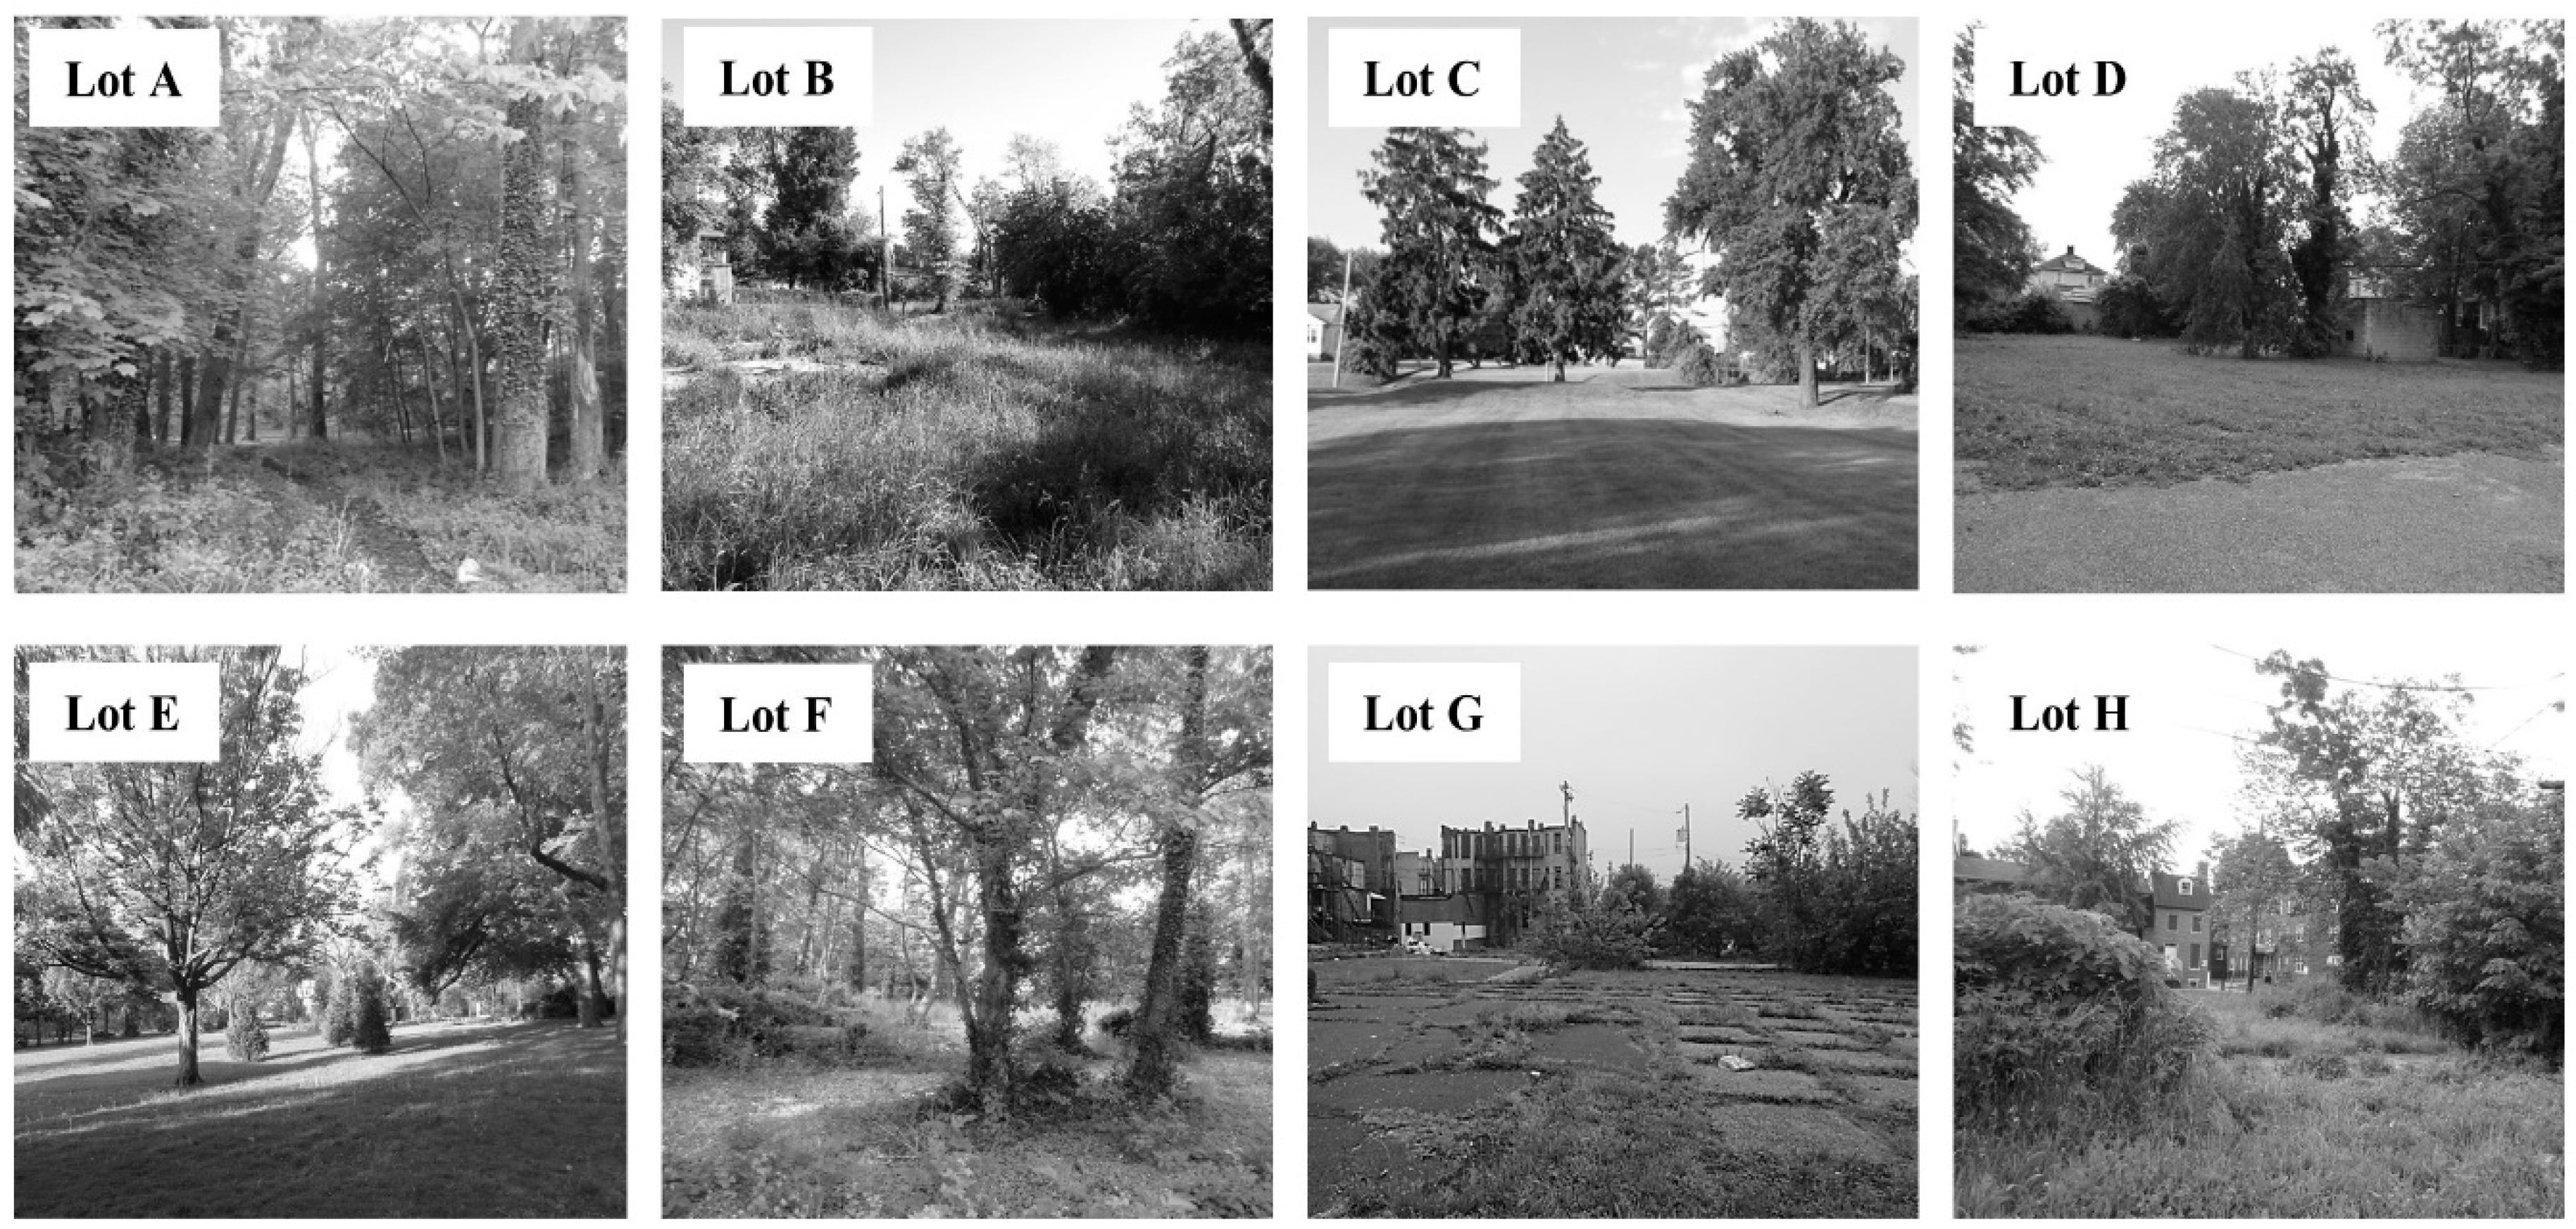
The first section of the survey consisted of demographic and socioeconomic questions to assess how the following variables influenced residents’ vacant lot preferences: sex, racial or ethnic group, education, home ownership, type of housing, marital status, presence of children at home, and household income (Supplementary Materials). In the second section of the survey, respondents were asked to rank photographs of eight example vacant lots from most preferred to least preferred (Figure 4). All photographs used in the survey were vacant lots previously sampled for their vegetation and bird communities. Each lot was presented as a black-and-white photograph without any information on the actual location of the lot within Baltimore, to remove any potential biases.
The eight photographs were selected to represent lots that differed in vegetation composition and structure, management intensity, and visual neatness or disorder, as these characteristics may influence preference and perception of nature [24,46,47]. Lots A and F represented two remnant vacant lots that had a high tree abundance and bird species richness, yet differed in their indications of use and cues-to-care [24,46] as Lot A had a walking path visible in the photograph. Lots B and H represented vacant lots with low management intensity via tall ground cover, with (H) and without (B) dense shrub cover. Lots C and E were selected for their clear management practices with mowed lawns (C) and structured landscaping (E). The remaining lots D and G were selected to assess vacant lots with open structure and levels of lot disorder, from minor lot management (D) to cracked asphalt and unmowed weeds (G). Lots were randomized in the order that they were presented.
A four-point Likert scale was used to assess how desirable each lot was to the respondent if they were to have the lot in their neighborhood (1 = Very undesirable; 2 = Somewhat undesirable; 3 = Somewhat desirable; 4 = Very desirable). After ranking the photographs, residents were asked to identify the lot that they would most and least like to see in their neighborhood, and to write an open-ended response explaining their choices. Residents were allowed to select more than one lot as their most and least desirable. The survey concluded with a question asking residents to rank how they would prefer vacant lots in their neighborhoods to be used for in the future.
2.6. Statistical Analyses
We conducted a Bray Curtis ordination to determine differences in the bird community across the lot settings and origins in PC-ORD [48]. To determine differences among the lot settings or origins, we conducted one-way analysis of variances (ANOVA) for vegetation and bird species richness data. Lot settings and origin were considered independent variables in these analyses as the vegetation’s origin may precede the lot’s setting (e.g., remnant vegetation confined to a suburban yard) or the setting may precede the vegetation origin (e.g., residents planting new vegetation in an inner block). We conducted post-hoc Tukey HSD analyses to determine differences across groups. All ANOVA and Tukey HSD analyses were conducted in Program R [49].
For the survey data, we averaged the respondents’ ranking scores for each lot to determine overall rankings for the eight sample lots. For the two vacant lots that were ranked as the most and least preferred, we ran Kruskal-Wallis tests in Program R to determine if any respondent demographic variable corresponded to their preference score. We ran Spearman’s rank correlations to determine if lot preference was related to the site’s 10 vegetation variables and bird species richness in Program R. We determined what words survey respondents used to describe their most and least preferred vacant lots by conducting a content analysis [50]. The words and phrases residents used to describe the most and least preferred lots were coded and sorted into thematic categories in RQDA (R-based Qualitative Data Analysis) [51].
3. Results
3.1. Vacant Lot Characteristics
As described by Spirn and Pollio [15], we were able to classify vacant blocks, corner lots, and missing tooth vacant lots throughout Baltimore. However, with Baltimore’s unique architecture and differences across residential areas along the urban-to-rural gradient, we described three new types of vacant lot settings: inner block, suburban yard, and wayside vacant lots (Figure 3). The most abundant vacant lot setting was the vacant block, which was also the largest in area among the lot settings and found throughout Baltimore (Table 1, Figure 2). Inner blocks, corner lots, and missing tooth vacant lots were also abundant across the city; however, these settings were the smallest in area and often found nearby one another in city block-style neighborhoods (Figure 2). Suburban yards were only found around Baltimore city’s periphery (Figure 2) and were moderate in size (Table 1). The least common vacant lot setting was the wayside lot. We only sampled four wayside lots due to their lack of accessibility and safety concerns surrounding rail and roadways. Wayside lots tended to be large in area (Table 1), yet narrow with more edge type habitats, often stretching along transportation routes.
Most vacant lots had emergent vegetation, which can often be described as the typical vacant lot following demolition or site abandonment. These lots tended to be small, yet they were found throughout Baltimore (Table 1, Figure 2). Planted vacant lots were also found throughout the city and had a variety of contents, from flower garden plots, neatly mowed play fields, to an outdoor movie theatre with a grill pit and colorful murals painted on the sides of buildings. These lots were voluntarily maintained by local community groups and residents. Even though they visually did not seem to be vacant by the traditional definition, these lots were still formally designated by the city as vacant. Remnant lots were the rarest, largest in area, and only found outside of the city center, away from areas of dense development (Table 1, Figure 2).
3.2. Vegetation
Vacant lot settings highlighted differences in the lot’s vegetation structure. Tree abundance and canopy height differed across lot settings (Table 2; Figure 5). Suburban yards had more than double the abundance of trees found in corner lots (Table 1). Wayside lots had more trees than suburban yards, but the sample size for wayside lots was too small to be significant. Aside from tree abundance, vegetation structure did not differ across lot settings (Table 1). The size of the vacant lot was greatest for vacant blocks, while corner lots, missing tooth, and inner blocks were significantly smaller (Figure 5).
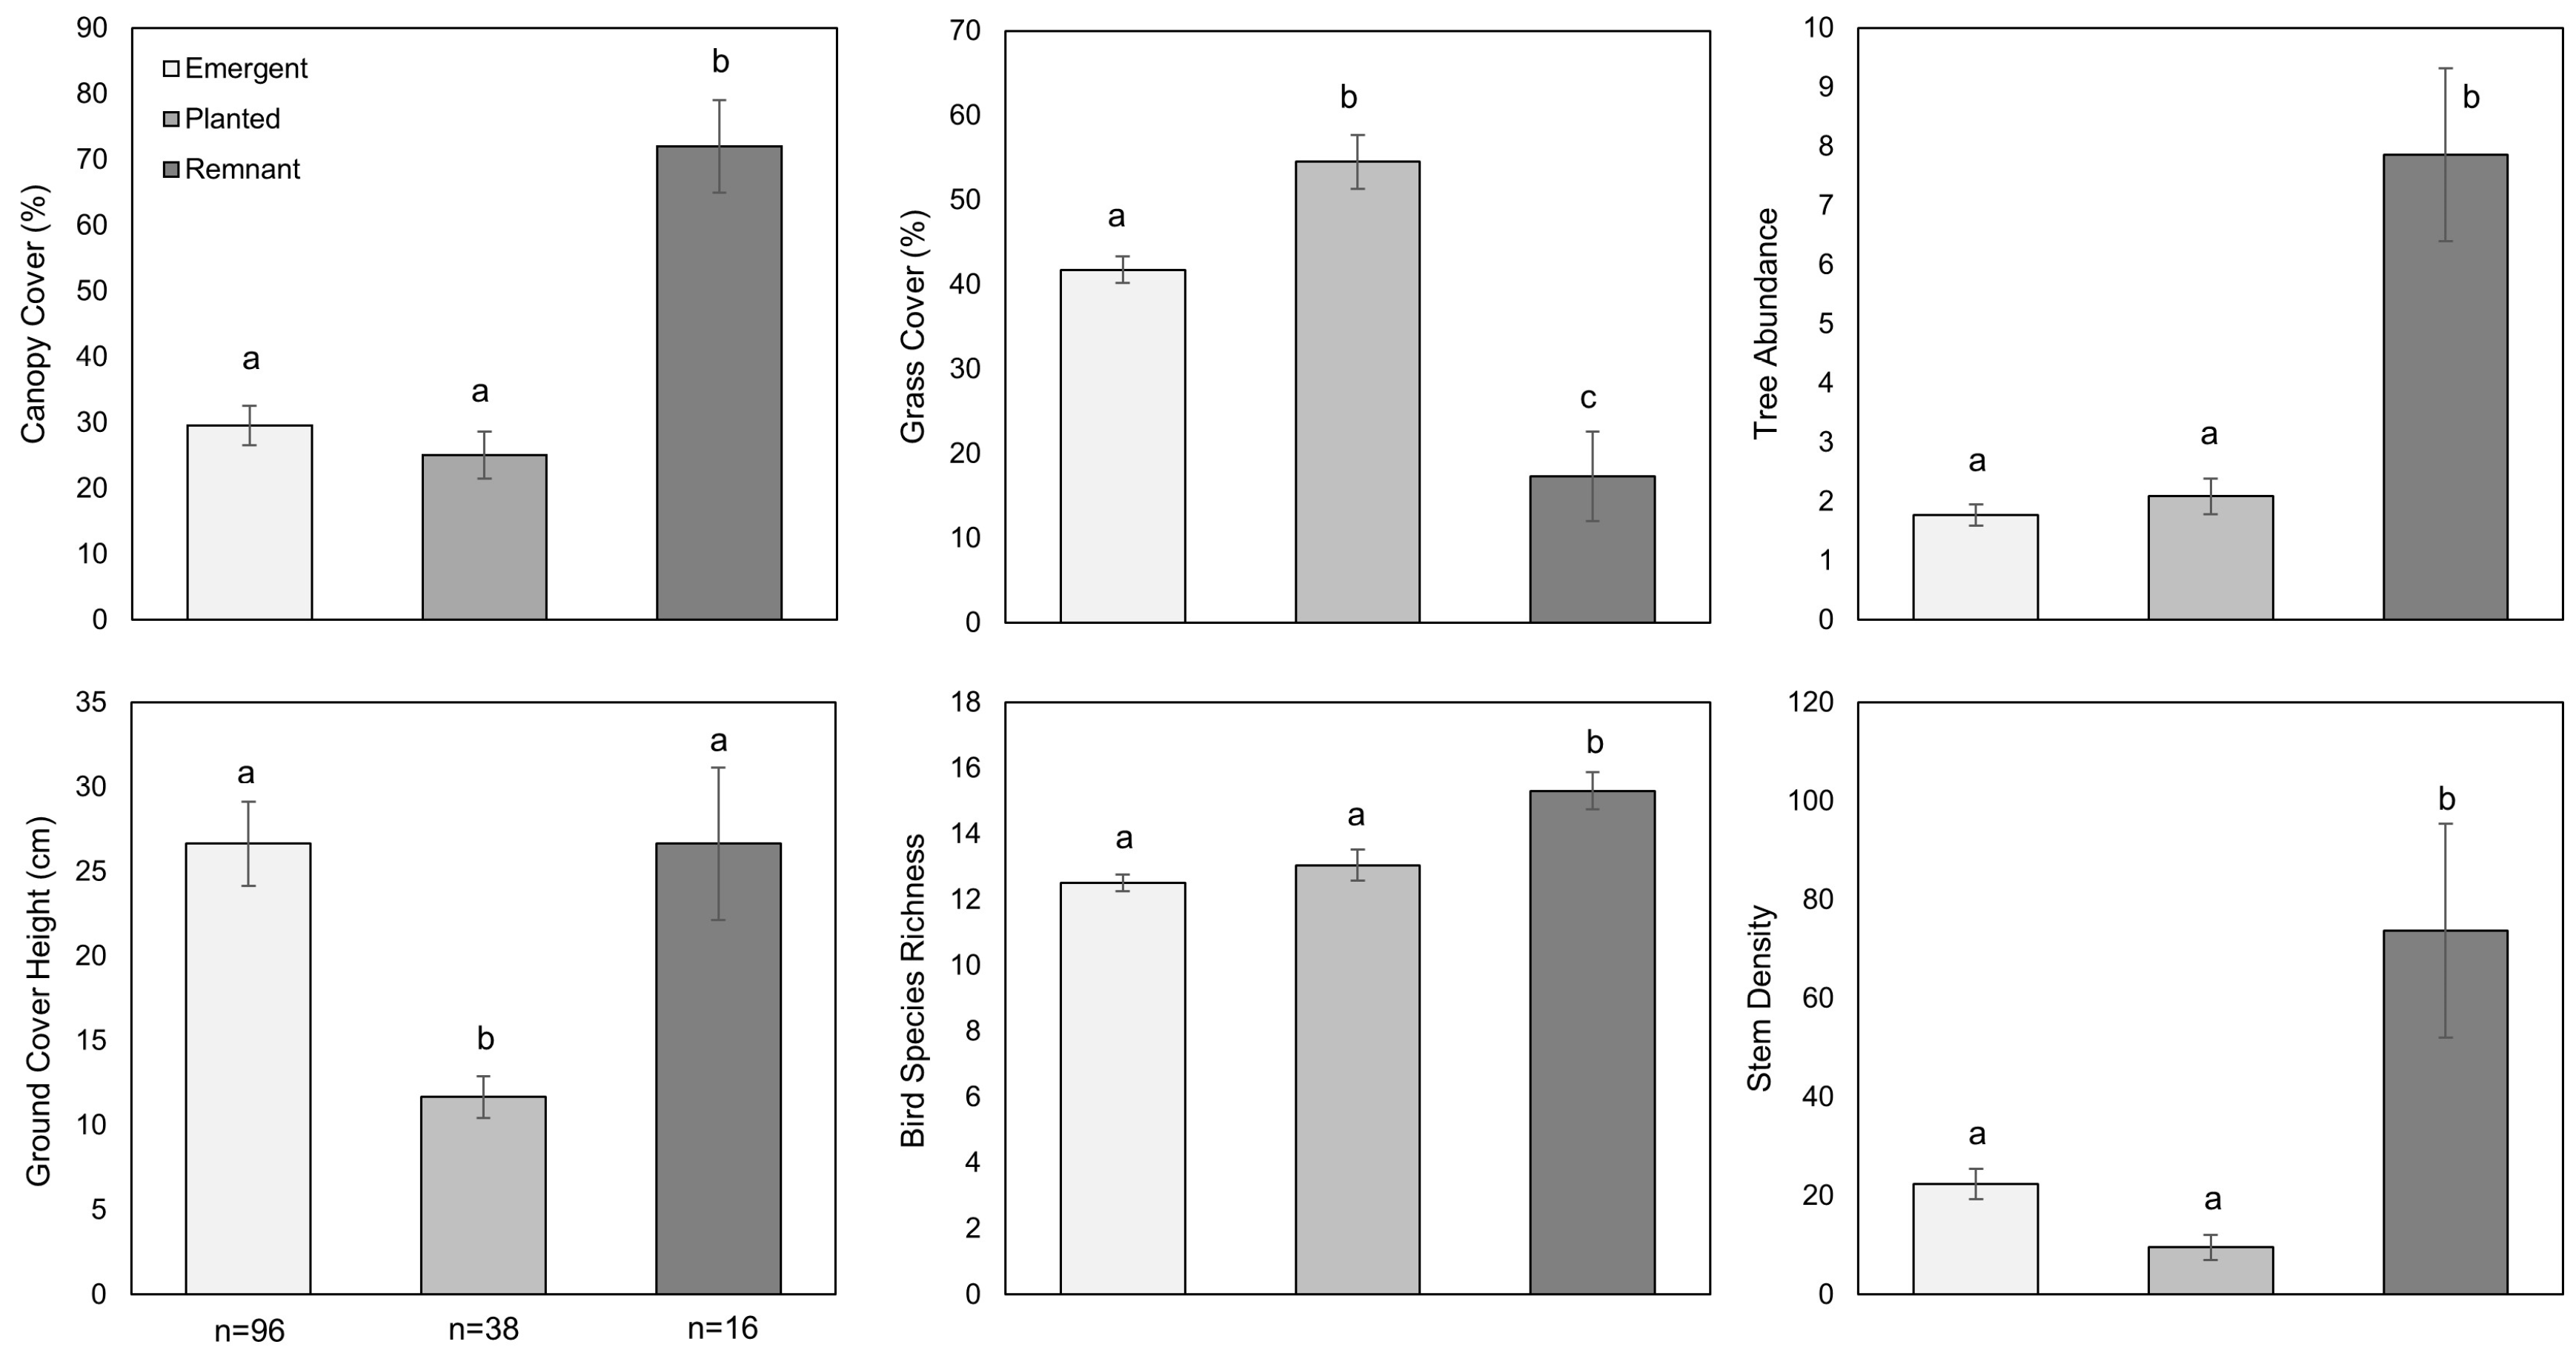
Vacant lot origin was a better descriptor of the plant community and structure. Remnant lots had a greater shrub stem density, tree abundance, tree species richness, and canopy cover; however, tree diameter did not vary with lot origin (Table 2; Figure 6). Even though more tree species were found in the average remnant lot, planted and emergent lots had more tree species overall (43 species each) compared to remnant lots (26 species; Table A2 in Appendix A). Planted lots had more grass ground cover, and this cover was much shorter compared to remnant and emergent lots as planted lots usually had large areas of mowed lawn. Emergent lots also had a large percentage of grass as ground cover, but it was often taller and unmanaged (Table 1 and Table 2).
3.3. Bird Community
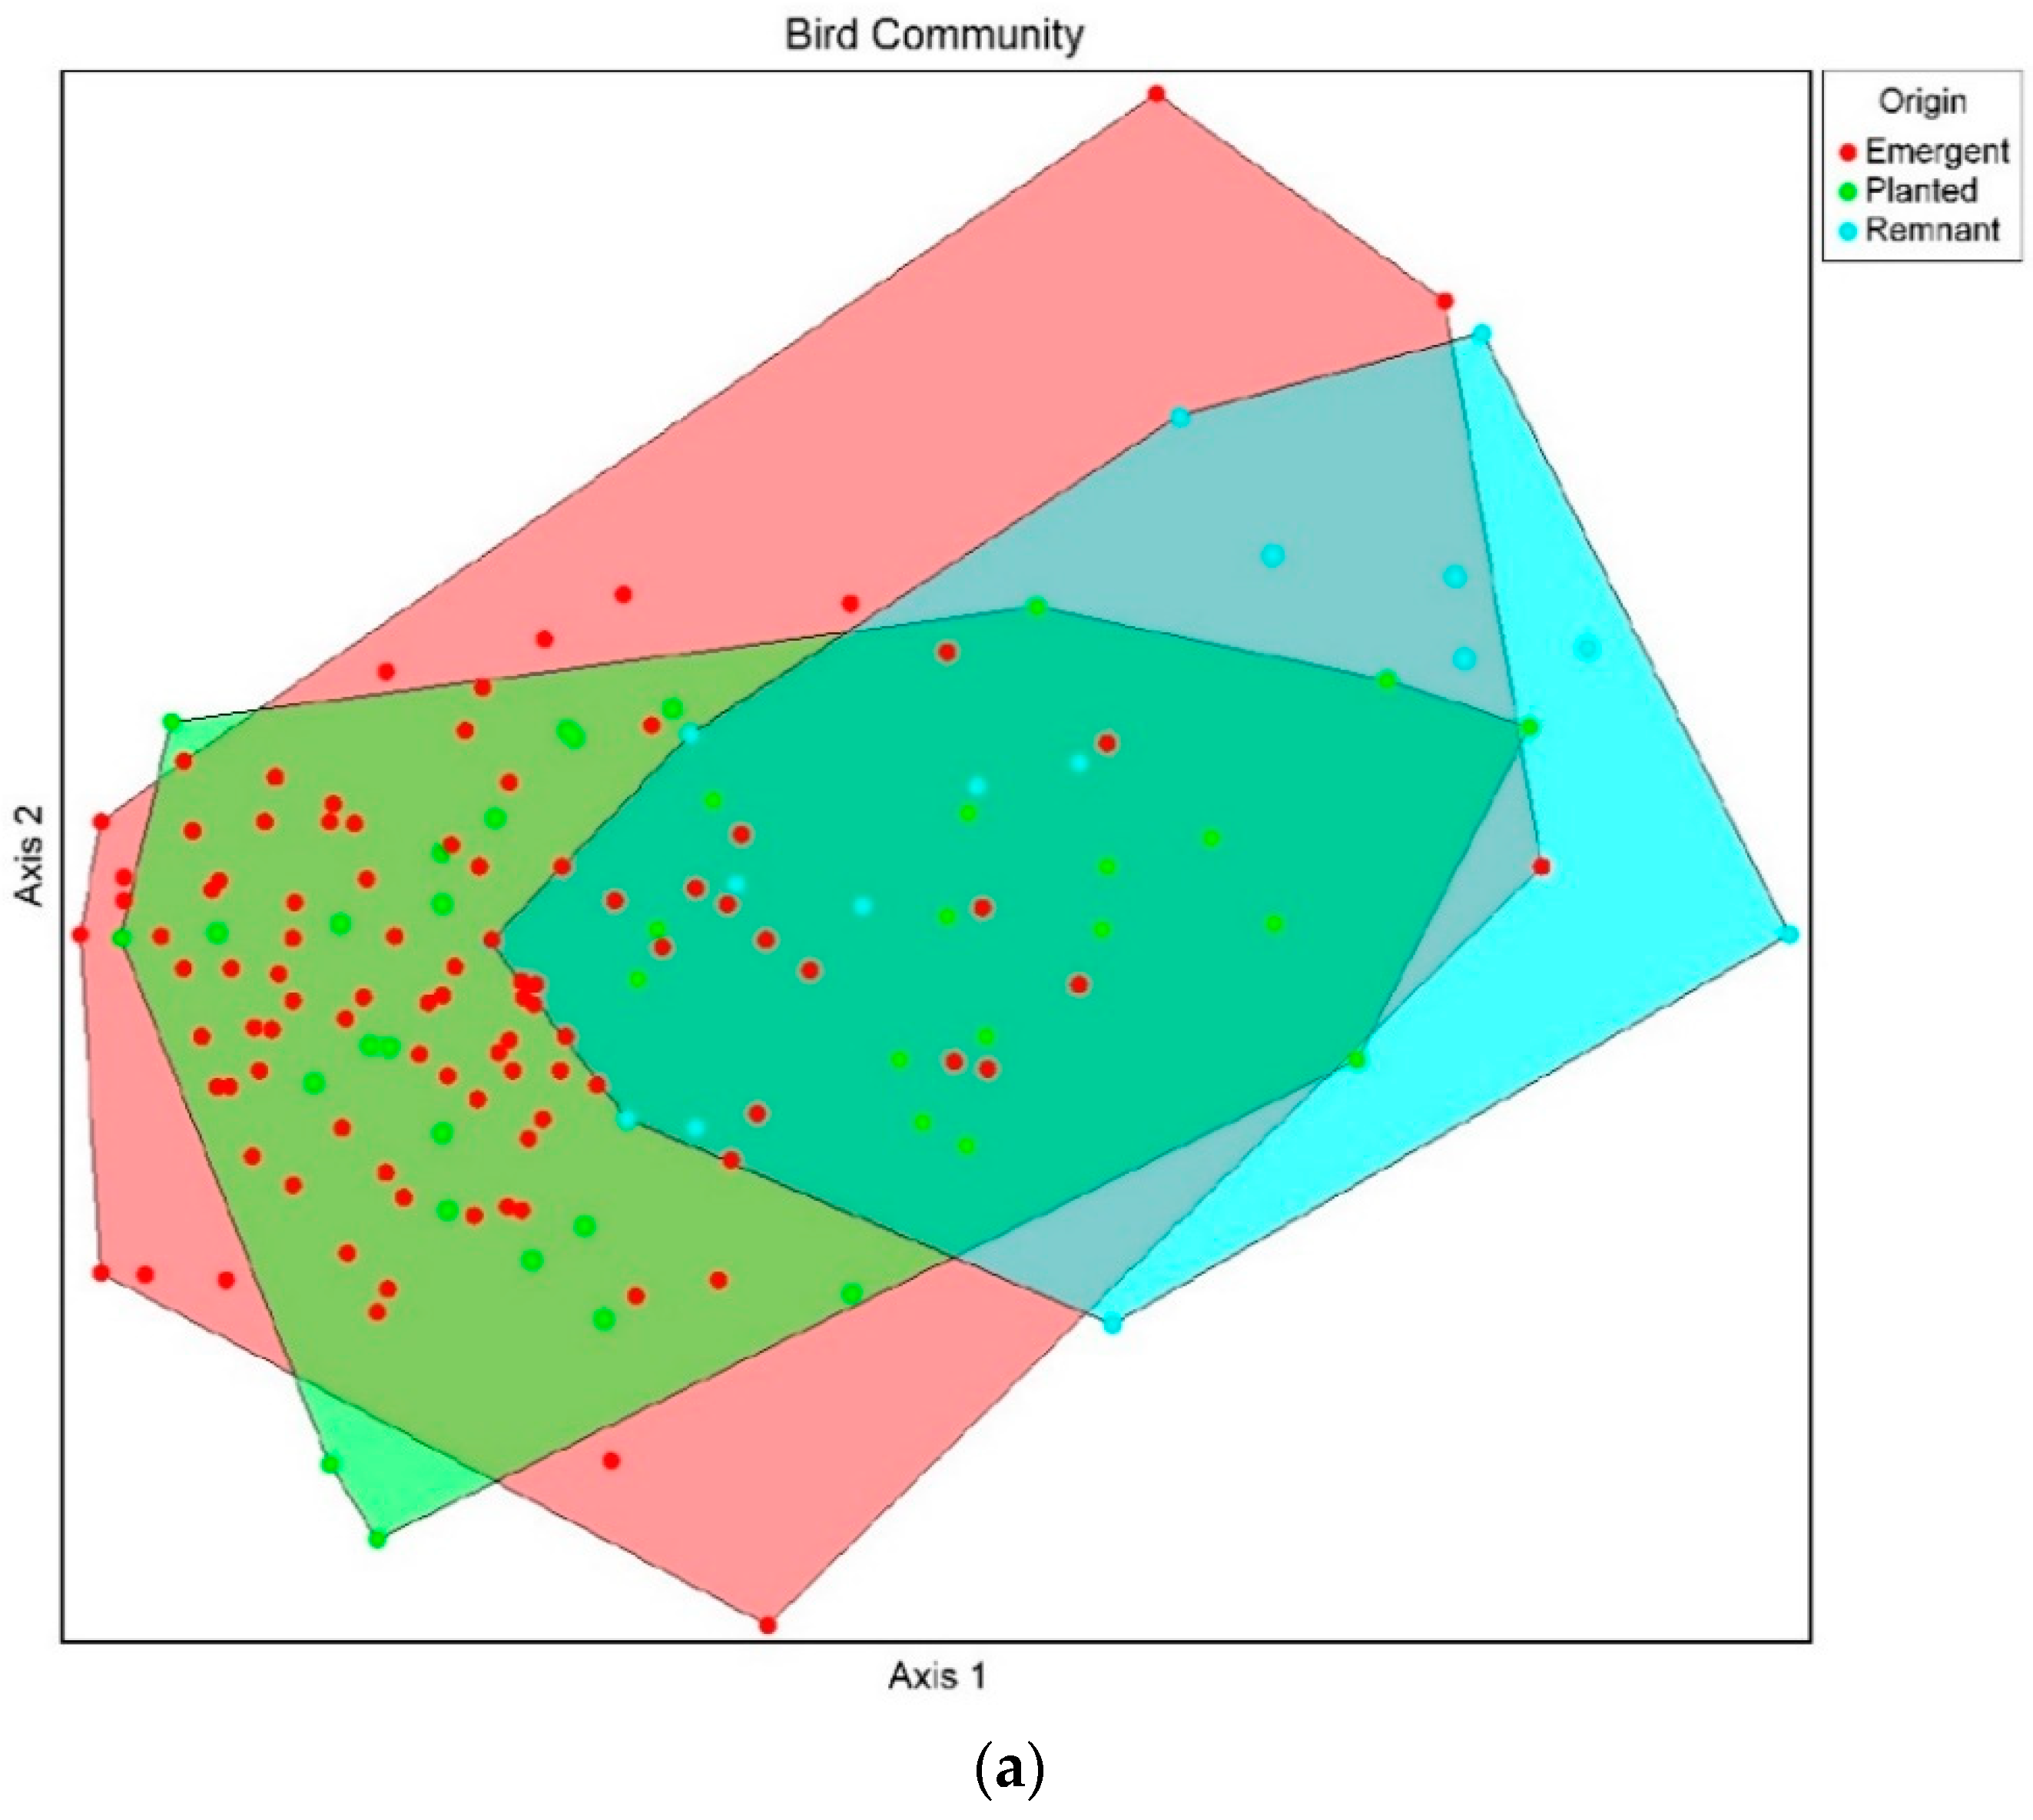
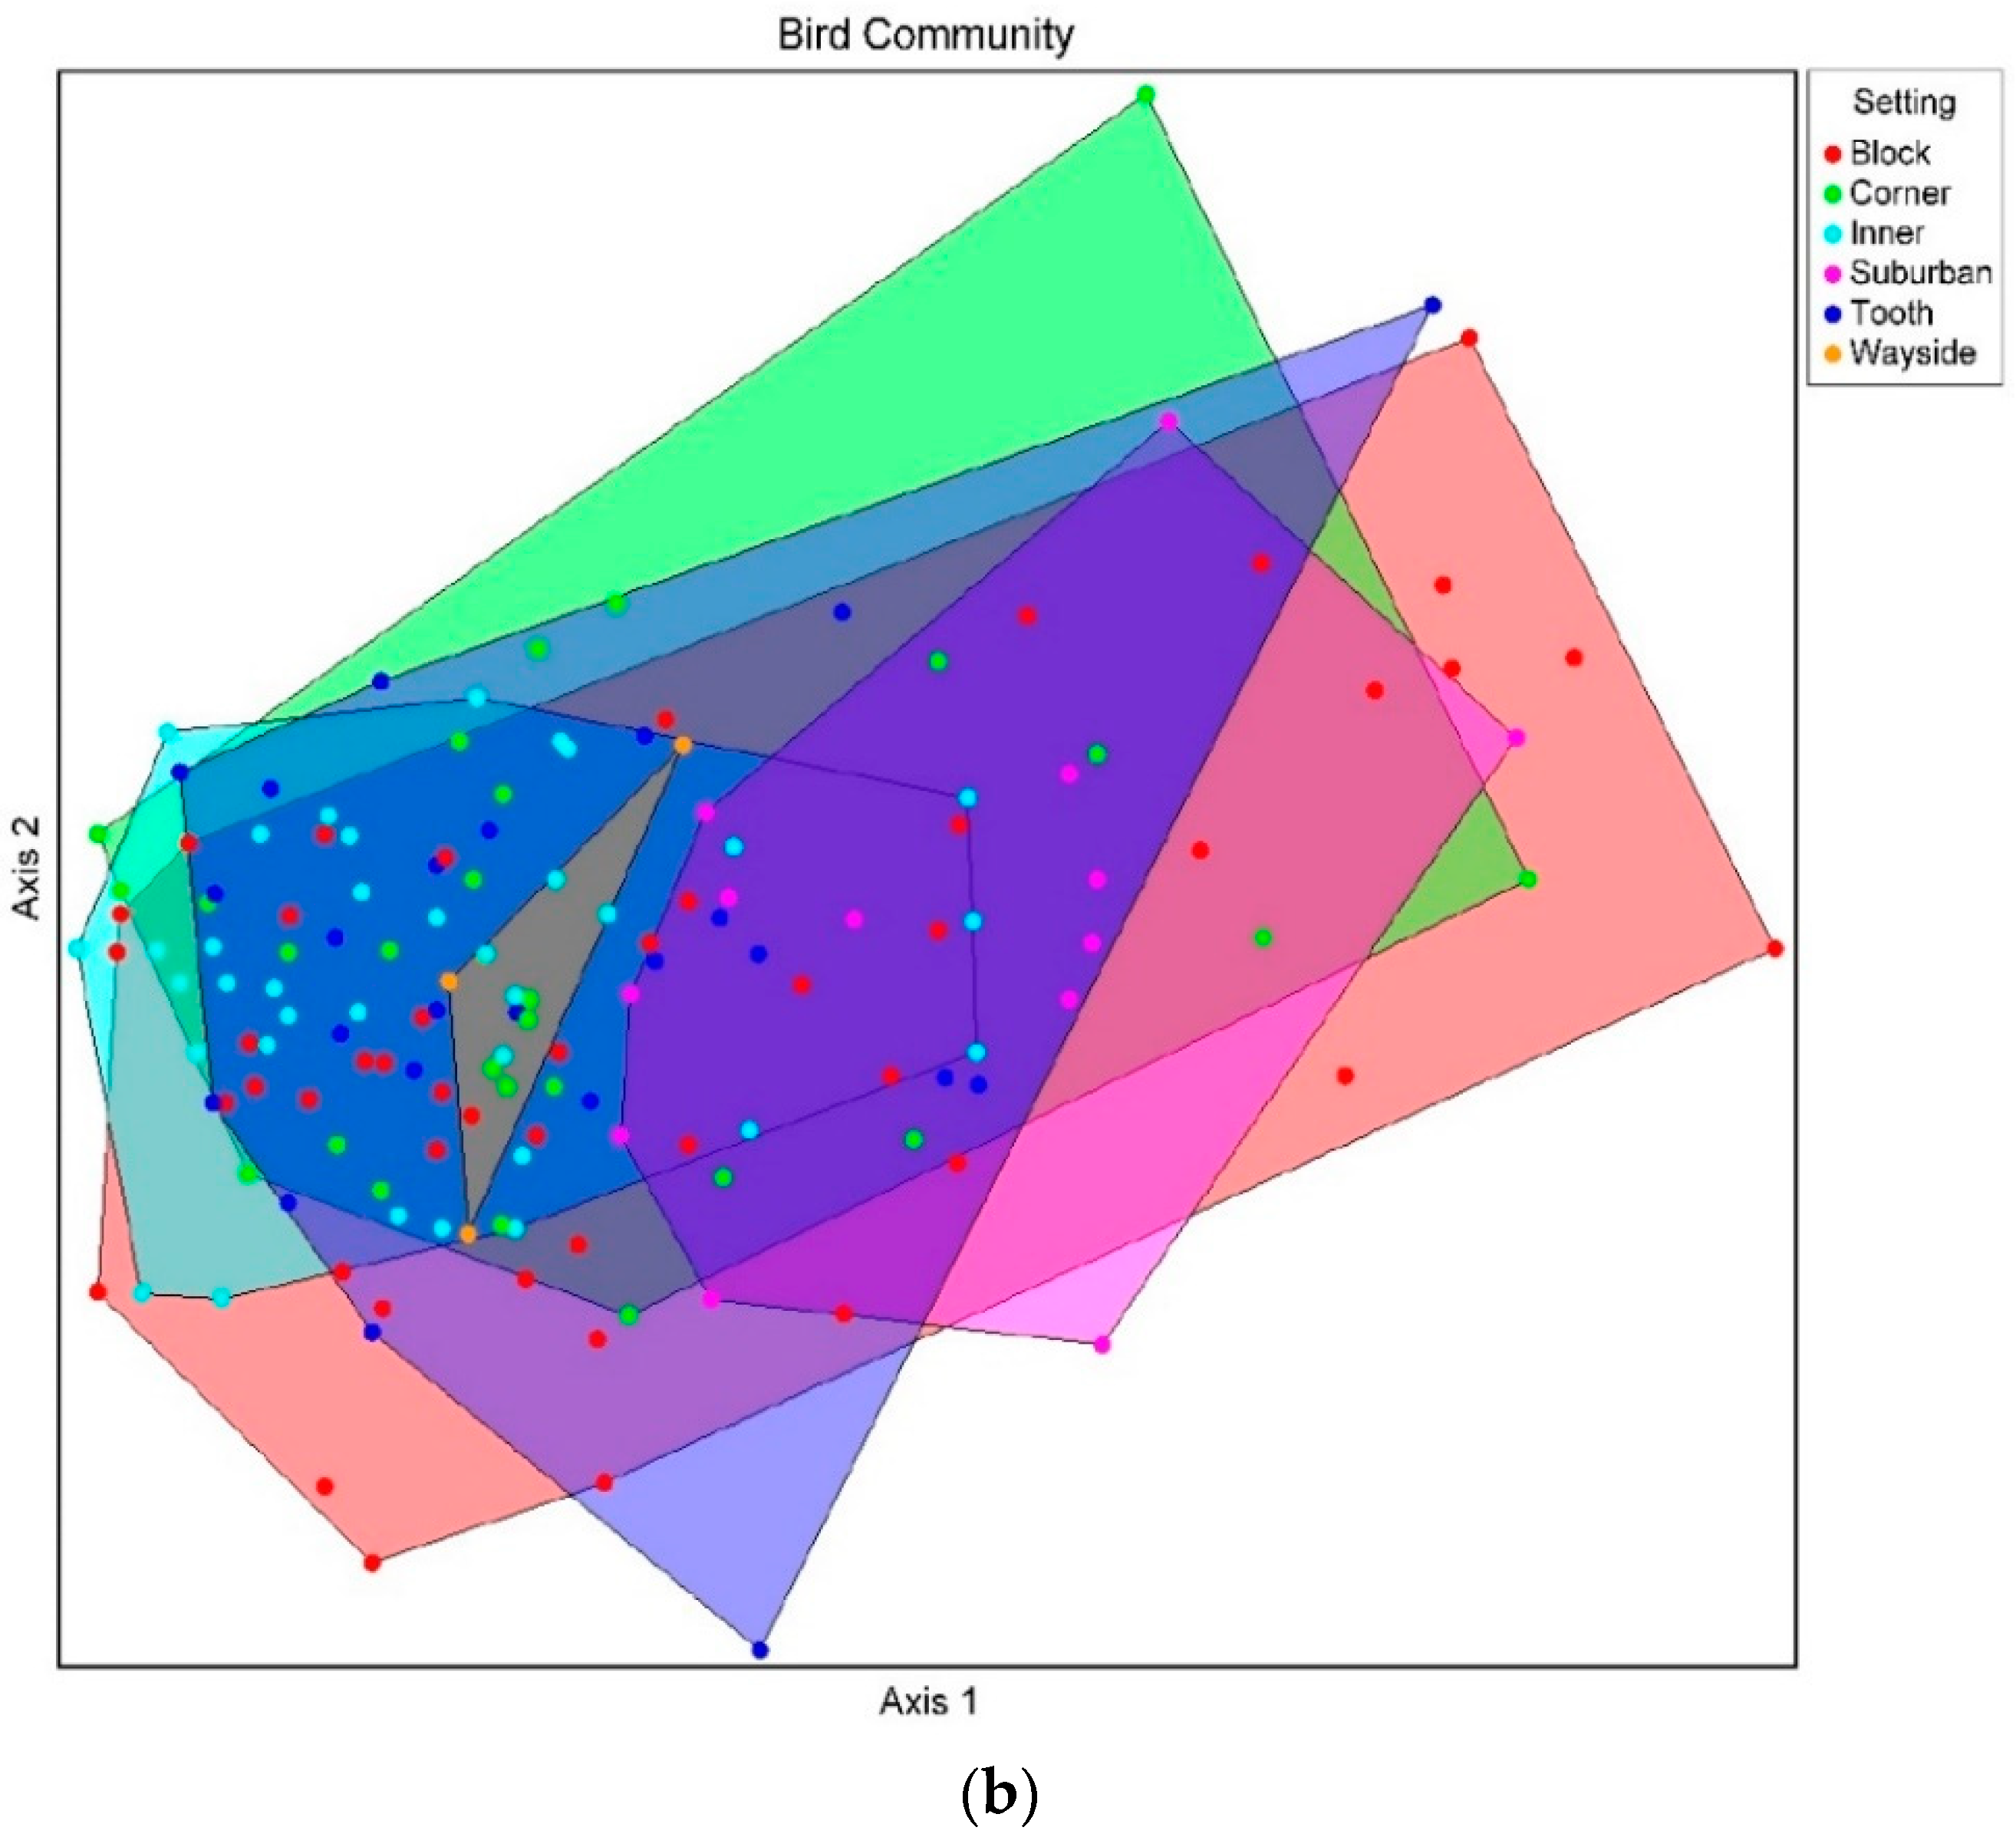
Species composition overlapped for all origins and most settings, indicating little difference in each lot’s bird communities (Figure A1). Remnant vacant lots supported more bird species (Figure 6; Table 2); however, all lot origins shared similar species compositions. In a previous study, we found that the bird community responded to ecological gradients in canopy height, canopy coverage, and tree species richness [8], thus the bird community should be responding to remnant lot’s vegetation structure.
Suburban yards had the most bird species of any lot setting (Table 1). Even though bird species richness did not significantly differ across lot settings, wayside and suburban yard lot communities were separated on the ordination (Figure A1). We recorded 39 species in suburban yards and 21 in wayside vacant lots; both lots shared 19 species (Table A1). Suburban yard birds could be characterized as more urban adapter species [52], specifically cavity-nesting and forest bird species, whereas the wayside lot bird community was dominated by urban exploiters. Even though we see these trends in the sampled wayside lots, we hesitate to draw firm conclusions, as our sample size for wayside lots was small (n = 4).
3.4. Resident Preferences
Of the 65 individuals who started the survey, 44 respondents from 28 different neighborhoods completed usable surveys (67% completion rate). Most respondents were affiliated with the Maryland Community Naturalist Network or Baltimore Green Space organizations (n = 18). None of the sociodemographic variables were associated with vacant lot preference rank (Kruskal-Wallis; p > 0.05).
Lots E, A, and C were the most desirable lots, indicated by their average preference score and selection as a lot that residents would prefer to have in their neighborhood (Table 3). These lots had a clear presence of natural features, cues to care via evidence of active landscape management or a walking path, and low visible lot disorder. Lot E was a planted vacant block used as a community garden and had an open shrub layer with tall trees and lawn habitat. Lot A was a remnant vacant block with a walking path through the lot. Lot C was planted vacant suburban yard with minimal shrub and trees, located adjacent to a church. The majority (51%) of residents indicated their preference for these lots by using terms that described the lots’ cleanliness, open space, visible maintenance and well-care.
Words describing the plants and wildlife within the site were used by 53% of respondents to describe their most preferred vacant lot. Trees were commonly used to describe the vacant lot and typically related to the openness of the site and how trees provide shade. Lots with larger trees (DBH) were positively correlated with preference scores (Spearman’s rank correlation; rho = 0.74, p = 0.045). Bird species richness and tree abundance were not correlated to the respondent’s preference score (bird richness: rho = 0.45; p = 0.27; tree abundance: rho = 0.39, p = 0.35)
Residents overwhelmingly ranked lot G as their least preferred vacant lot, and it was the only lot that no respondent selected as one that they would like to have in their neighborhood (Table 3). Lot G is an emergent inner block surrounded by demolished and abandoned row homes with limited plant structure. Out of all eight lots, most residents said that they would expect lot G to have problems with trash (95%), unwanted pests (89%), drugs (78%), and other illegal activities (76%). The words that respondents used to describe their least preferred lot selection primarily described the lack of care to the site, lack of safety, neglect, and an area for dumping trash and illegal activities. Additionally, vacant lots with more artificial ground cover, such as asphalt and concrete, were negatively correlated with preference scores (rho = −0.93, p = 0.001). All other vegetation variables were not significantly related to preference scores (p > 0.05).
If a vacant lot was in their neighborhood, residents preferred for that lot to be either used as a park with benches, trails and flowers (75%), or a community garden (73%). The least preferable use for the lot was to pave it over to use for more parking spaces (5%), followed by the construction of new buildings (20%).
3.5. Sustainable Vacant Lots
We synthesized positive and negative relationships between vacant lot setting, origins, and residents’ perceptions to determine which vacant lot features are sustainable (Table 4). Concerning urban biodiversity needs, vacant blocks provided large areas of tree habitat, while emergent and remnant lots provided habitat in terms of tall grass cover and shrub cover, respectively. Residents’ overall preferred the presence of trees, a characteristic of vacant blocks, suburban yards, and remnant lots, and managed lots, a feature of planted vacant lots. Even though corner, inner blocks, and missing tooth lots provided limited support for urban biodiversity conservation, they were small and allowed for easy access to nature for nearby residents.
4. Discussion
Our objective was to determine how vacant lot settings and origins constrain or enhance the biotic characteristics of the lot, and how these features influenced resident preference. If we define vacant lot sustainability by the maximization of biodiversity and resident preference, then vacant blocks and suburban yards containing a mixture of remnant and planted vegetation would be the most sustainable (Table 4). These lot features and settings provided locations for biodiversity while also eliciting positive reactions from residents.
Even though vacant lots are transitional in nature, they are a major component of urban greenspaces in Baltimore. The majority of vacant lots were relatively small in size (<1 ha), yet they were abundant across the landscape. Even with limited interventions to maintain or improve these lots with further tree plantings and landscaping efforts, vacant lots can still have a major impact on urban biodiversity and sustainability goals.
We found that the major driver of lot sustainability was the origin of the lot’s vegetation. Remnant and planted vacant lots supported the most bird and plant life, while also being the most preferred lots as assessed by residents. The sustainability of remnant lots, planted lots, and suburban yards was primarily driven by their tree abundance, a positive feature for both urban biodiversity and residents (Table 4).
The spatial distributions of vacant lots in Baltimore may impact their contents and structure. Lot origin may be dependent on the location of the vacant lot within the city, as remnant vacant lots are rare within more densely urbanized locations [18,19]. This may also be seen in the lot settings, as suburban yard lots were found along Baltimore city’s periphery due to the location of neighborhoods dominated by single family homes. Even among lot settings evenly distributed across Baltimore (e.g., vacant blocks), tree abundance and canopy cover were highly variable (Table 1). Tree cover is not evenly distributed across Baltimore, a consequence of urbanization, resident income [53], social capital [54], and pockets of resident resistance to tree plantings [55]. Thus, the vacant lot’s location in the city may have a stronger impact on the lot’s vegetation rather than limitations imposed by the lot’s setting.
In previous studies, we found that trees were the most important feature for abundant native bird species [8], while areas of dense shrubs best supported successful nesting efforts of common songbird species [26]. Additional global studies highlight the importance of vegetation structure to increase bird species richness in a variety of urban greenspaces (e.g., [6,56,57,58]). Thus, remnant vacant lots and lots with abundant trees should best support diverse and sustainable bird communities. Remnant vacant lots should be protected and, when possible, designated as park land to further enhance bird diversity [59]. However, remnant lots are rare and do not occur throughout the city (Table 1). To address citywide biodiversity needs, trees and small areas of dense shrubs could be incorporated into planted vacant lots. Through this approach, we may maximize wildlife benefits as well as providing features that residents prefer in more vacant spaces. Overall, conserving structurally complex, connected vacant lots should be a priority in urban ecosystems in order to support local biodiversity, provide ecosystem services, while also connecting people with nature [14,60,61]. To further optimize remnant lots, walking paths or other cues to care may enhance the site regarding resident preference and their use.
Maintaining a mosaic of vacant lot settings and origins may be the best way to provide a variety of habitats in different successional stages, while increasing access to nearby nature for residents. Vacant blocks were the most abundant, and were often found throughout the city, potentially accessible to many residents. Their larger size is a benefit for urban biodiversity conservation, but may make the site seem daunting if vacant lot management efforts were left up to local community groups. Small missing tooth or corner lots may not have the greatest abundance of vegetation, but they can be easily landscaped by a small group of people and may foster more personal and private connections with residents [15]. Thus, the vacant lot’s setting still needs to be considered prior to management as this feature can enhance or constrain the lot’s sustainability potential. Through simple modifications within the lot, such as picking up trash, planting a few flowers, mowing the grass, etc., many vacant lots have the potential to be positively viewed by residents and provide opportunities for residents to positively connect with nature.
Our resident survey results were indicative of Baltimore residents who were active in their communities, usually in a community group or nature-themed organization. We targeted these residents for our survey because they felt as though they could enact change within their neighborhoods. Overall, residents preferred lots that showed clear management efforts, contained trees and less artificial ground cover, and those that had potential for community or recreational use. The preference of large trees, vegetation complexity, and perceived naturalness is consistent with many landscape preference studies (e.g., [11,62,63,64,65]). Our study continues to highlight the importance of a moderate level of human influence and management for these spaces, balancing the site’s natural features with enough management to encourage the sites’ recreational use [2,11]. Our survey respondents overwhelmingly preferred for these sites to be used as a greenspace for community events, which is important in evaluating how a vacant lot’s setting may impact the potential for its use by residents.
Our resident survey results may be biased toward our sampled residents’ fondness for nature or those with some level of environmental education [31], which may not be representative of all city residents. Some residents may consider wildlife as a nuisance and resist tree planting programs [38]. Additionally, the public’s acceptance of these vacant lots may differ from their social acceptability, as acceptability is multidimensional, long-term management goal that incorporates the residents’ values, perceptions, and preferences for a habitat [66,67]. Thus, short-term acceptance of transitional vacant spaces may differ from the social acceptability of neighborhood aesthetics and lot use. Input from more residents as to the future of a neighborhood vacant lot is vital, as residents are the most familiar with the lot and may have shared preferences for the lots’ future structure and use [47,68].
In cities with an abundance of vacant lots, these spaces may not be temporary, as they are traditionally viewed. Especially for Baltimore, the transformation of vacant lots into useable spaces or forested parkland could be viewed as a long-term conservation management decision to increase neighborhood aesthetics, park land, and connect city-wide greenways [69]. Planting trees in vacant lots may promote Baltimore government’s goal of doubling the city’s tree canopy to 40% by 2036 [70]. Plant communities are slow to change in vacant lots, so management efforts are necessary to increase habitat connectivity and biodiversity across the city [22]. Baltimore City officials currently manage vacant lots by periodically mowing accessible spaces, slowing the process of vegetative succession and limiting potential wildlife habitat. However, mowing efforts are often infrequent due to budget limitations and staffing, much to the dismay of residents who dislike the resulting tall grass. Grassroots efforts, either through adopt-a-lot programs or community organizations could be the key to managing vacant lots.
One major pillar of resource sustainability that we did not assess here is the equitable access and use of biodiverse vacant lots for all residents. Vacant lots tend to be clustered in low-income, population dense neighborhoods [12]. Additionally, high quality greenspaces are often unequally distributed across cities by racial and economic lines [70,71,72]. We found that many vacant lots were located in dense areas of Baltimore, and the sustainable suburban yards and remnant lots were often located away from the urban center (Figure 2). Vacant lots in the center of Baltimore tended to be smaller inner blocks and corner vacant lots, which supported limited bird diversity and fewer plants, and often were emergent in origin. Even though inner-city neighborhoods would gain the most from transforming vacant lots into biodiverse, resident-friendly spaces, the resources to do so may be limited. This begs the question of whether vacant lots can be sustainable in these residential areas, or will they remain in poor environmental quality without substantial intervention? Monetary and other resource investments should be directed toward areas with abundant vacant lots, as these areas may offer the greatest in terms of overall greenspace size. These neighborhoods should be targeted by city sustainability managers and other stakeholders, as priority sites to manage for neighborhood enhancement.
Vacant lots can provide enormous resources to improve city-wide biodiversity and resident preferences as an urban sustainability goal. Even though sustainable management strategies for a vacant lot depends on the lot’s current features [5], biodiversity needs can be balanced with resident’s preferences for vacant lot contents through simple management efforts. Particularly in shrinking cities where vacant land is often abundant, future research on vacant lots should incorporate these multiple levels of sustainability to assess impacts not only on people, but also on the urban ecosystem [25]. Understanding how people perceive vacant lots and which aspects they prefer to have in their neighborhood is imperative in order to gain support from residents for any modifications [34].
5. Conclusions
The results of our study support our initial assessment that vacant lots should not be discarded as wasted spaces, but instead could be valued for their potential to enhance urban biodiversity while satisfying resident’s needs for nature and greenspace. However, due to the large variation in vacant lot settings, origins, and locations across a city, additional investment needs to occur in many spaces to make them sustainable as a public good. Each lot needs to be assessed for its benefits within the constraints of its setting and residents’ needs. Even so, our findings provide a new lens to evaluate vacant lots within an urban sustainability framework and may provide useful information for urban planners, landscape architects, community associations, and urban wildlife managers to synthesize their needs to achieve sustainability goals.
Supplementary Materials
The following are available online at https://0-www-mdpi-com.brum.beds.ac.uk/2071-1050/10/5/1679/s1, Figure S1: Baltimore vacant lot perception survey.
Author Contributions
All authors have contributed to the idea for the paper. C.C.R.-B. developed research design, collected and analyzed the data, and wrote the manuscript. C.H.N. assisted with the research design, statistical analyses, and reviewed the paper. P.S.W. provided core advice as to the structure and focus of the paper, its analyses, framing of the introduction and discussion, and reviewed the paper. All authors have read and approved the final manuscript.
Acknowledgments
We thank two anonymous reviewers whose comments helped to improve and clarify this manuscript. This project was supported by the National Science Foundation Long-Term Ecological Research Program (DEB-1027188). We are grateful for the field assistance provided by E. S. Carpenter, A. Savage, J. Bos, E. Suzuki, C. Griffith, and S. Scully.
Conflicts of Interest
The authors declare no conflict of interest.
Appendix A

Table A1.
Bird community composition for suburban yard and wayside vacant lots. Birds were listed as urban exploiters, adaptors, or avoiders based on descriptions by Blair [35].
Table A1.
Bird community composition for suburban yard and wayside vacant lots. Birds were listed as urban exploiters, adaptors, or avoiders based on descriptions by Blair [35].
| Guild | Species | Suburban Yard | Wayside | |
|---|---|---|---|---|
| Exploiter | Chimney swift | Chaetura pelagica | X | X |
| European starling | Sturnus vulgaris | X | X | |
| House finch | Carpodacus mexicanus | X | X | |
| House sparrow | Passer domesticus | X | X | |
| Mourning dove | Zenaida macroura | X | X | |
| Rock dove | Columba livia | X | X | |
| Adaptor | American crow | Crovus brachyrhynchos | X | |
| American goldfinch | Carduelis tristis | X | ||
| American robin | Turdus migratorius | X | X | |
| Barn swallow | Hirundo rustica | X | ||
| Blue jay | Cyanocitta cristata | X | X | |
| Brown-headed cowbird | Molothrus ater | X | ||
| Carolina wren | Thryothorus ludovicianus | X | X | |
| Chipping sparrow | Spizella passerina | X | ||
| Common grackle | Quiscalus quiscula | X | X | |
| Common yellowthroat | Geothlypis trichas | X | ||
| Eastern kingbird | Tyrannus tryannus | X | ||
| Fish crow | Corvus ossifragus | X | ||
| Gray catbird | Dumetella carolinensis | X | X | |
| House wren | Troglodytes aedon | X | ||
| Indigo bunting | Passerina cyanea | X | X | |
| Northern cardinal | Cardinalis cardinalis | X | X | |
| Northern mockingbird | Mimus polyglottos | X | X | |
| Ring-billed gull | Larus delawarensis | X | X | |
| Ruby-throated hummingbird | Archilochus colubris | X | ||
| Song sparrow | Melospiza melodia | X | X | |
| Avoider | American redstart | Setophaga ruticilla | X | |
| Blue-gray gnatcatcher | Polioptila caerulea | X | ||
| Carolina chickadee | Poecile carolinensis | X | X | |
| Downy woodpecker | Picoides pubescens | X | ||
| Eastern towhee | Pipilo erythrophthalmus | X | ||
| Eastern wood-peewee | Contopus virens | X | ||
| Hairy woodpecker | Leuconotopicus villosus | X | ||
| Northern flicker | Colaptes auratus | X | ||
| Northern parula | Setophaga americana | X | ||
| Red-bellied woodpecker | Melanerpes carolinus | X | X | |
| Tufted titmouse | Baeolophus bicolor | X | X | |
| White-breasted nuthatch | Sitta carolinensis | X | ||
| Wilson’s warbler | Cardellina pusilla | X | ||
| Wood thrush | Hylocichla mustelina | X | ||
| Yellow-billed cuckoo | Coccyzus americanus | X | ||
Table A2.
Tree species found across lot origins. Even though remnant lots had greater average tree abundances and species richness per lot (Table 1), emergent and planted lots contained more species overall. Species with an asterisk (*) are not native to Baltimore, as determined by the USDA PLANTS Database [73]. Species are in alphabetical order by their Latin name.
| Species | Emergent | Planted | Remnant | |
|---|---|---|---|---|
| Balsam fir | Abies balsamea | X | ||
| Box elder | Acer negundo | X | X | X |
| Norway maple * | Acer platanoides | X | X | X |
| Red maple | Acer rubrum | X | X | X |
| Silver maple | Acer saccharinum | X | X | X |
| Sugar maple | Acer saccharum | X | X | |
| Horse chestnut * | Aesculus hippocastanum | X | ||
| Tree of heaven * | Ailanthus altissima | X | X | |
| American hornbeam | Carpinus caroliniana | X | ||
| Bitternut hickory | Carya cordiformis | X | X | X |
| Pignut hickory | Carya glabra | X | X | |
| Shagbark hickory | Carya ovata | X | ||
| Mockernut hickory | Carya tomentosa | X | ||
| Southern catalpa | Catalpa bignonioides | X | ||
| Northern catalpa | Catalpa speciosa | X | ||
| Common hackberry | Celtis occidentalis | X | X | X |
| Eastern redbud | Cercis canadensis | X | X | |
| Atlantic white cedar | Chamaecyparis thyoides | X | ||
| Flowering dogwood | Cornus florida | X | ||
| Persimmon | Diospyros virginiana | X | X | |
| American beech | Fagus grandifolia | X | X | |
| Green ash | Fraxinus pennsylvanica | X | X | X |
| Ginkgo * | Ginkgo biloba | X | ||
| Honeylocust | Gleditsia triacanthos | X | X | X |
| American holly | Ilex opaca | X | X | |
| Black walnut | Juglans nigra | X | X | X |
| Common juniper | Juniperus communis | X | ||
| Eastern red cedar | Juniperus virginiana | X | X | |
| Crapemyrtle * | Lagerstroemia indica | X | ||
| Tamarack | Larix laricina | X | ||
| Sweetgum | Liquidambar styraciflua | X | ||
| Tuliptree | Liriodendron tulipifera | X | X | X |
| Osage-orange | Maclura pomifera | X | X | |
| Southern magnolia | Magnolia grandiflora | X | ||
| Sweetbay | Magnolia virginiana | X | X | |
| Chinese magnolia * | Magnolia x soulangiana | X | ||
| Apple | Malus spp. | X | ||
| White mulberry * | Morus alba | X | X | X |
| Paper mulberry * | Morus papyrifera | X | ||
| Blackgum | Nyssa sylvatica | X | X | |
| Princesstree * | Paulownia tomentosa | X | X | |
| Norway spruce * | Picea abies | X | X | |
| Shortleaf pine | Pinus echinata | X | ||
| Austrian pine * | Pinus nigra | X | ||
| Eastern white pine | Pinus strobus | X | X | |
| American sycamore | Platanus occidentalis | X | X | X |
| Cherry plum * | Prunus cerasifera | X | ||
| Black cherry | Prunus serotina | X | X | X |
| Callery pear * | Pyrus calleryana | X | X | X |
| White oak | Quercus alba | X | X | X |
| Southern red oak | Quercus falcata | X | X | |
| Pin oak | Quercus palustris | X | ||
| Willow oak | Quercus phellos | X | X | |
| Red oak | Quercus rubra | X | X | X |
| Black oak | Quercus velutina | X | ||
| Black locust | Robinia pseudoacacia | X | X | X |
| Arborvitae | Thuja occidentalis | X | ||
| American basswood | Tilia americana | X | X | |
| Eastern hemlock | Tsuga canadensis | X | ||
| Chinese elm * | Ulmus parvifolia | X | ||
| Siberian elm * | Ulmus pumila | X | ||
Figure A1.
Bray Curtis ordinations of bird communities across different lot origins (a) and settings (b).
Figure A1.
Bray Curtis ordinations of bird communities across different lot origins (a) and settings (b).
References
- Barron, P.; Mariani, M. Terrain Vague: Interstices at the Edge of the Pale; Routledge: New York, NY, USA, 2013. [Google Scholar]
- Rupprecht, C.D.D.; Byrne, J.A.; Garden, J.G.; Hero, J.-M. Informal urban green space: A trilingual systematic review of its role for biodiversity and trends in the literature. Urban For. Urban Green. 2015, 14, 883–908. [Google Scholar] [CrossRef] [Green Version]
- Newman, G.D.; Bowman, A.O.M.; Lee, R.J.; Kim, B. A current inventory of vacant urban land in America. J. Urban Design 2016, 21, 302–319. [Google Scholar] [CrossRef]
- Bowman, A.O.M.; Pagano, M.A. Terra Incognita: Vacant Land and Urban Strategies; Georgetown University Press: Washington, DC, USA, 2004. [Google Scholar]
- Kim, G. The public value of urban vacant land: Social responses and ecological value. Sustainability 2016, 8, 486. [Google Scholar] [CrossRef]
- Meffert, P.J.; Dziock, F. What determines occurrence of threatened bird species on urban wastelands? Biol. Conserv. 2012, 153, 87–96. [Google Scholar] [CrossRef]
- Haase, D.; Haase, A.; Rink, D. Conceptualizing the nexus between urban shrinkage and ecosystem services. Landsc. Urban Plan. 2014, 132, 159–169. [Google Scholar] [CrossRef]
- Rega-Brodsky, C.C.; Nilon, C.H. Forest cover is important across multiple scales for bird communities in vacant lots. Urban Ecosyst. 2016, 20, 561–571. [Google Scholar] [CrossRef]
- Burkholder, S. The new ecology of vacancy: Rethinking land use in shrinking cities. Sustainability 2012, 4, 1154–1172. [Google Scholar] [CrossRef]
- Bonthoux, S.; Brun, M.; Di Pietro, F.; Greulich, S.; Bouché-Pillon, S. How can wastelands promote biodiversity in cities? A review. Landsc. Urban Plan. 2014, 132, 79–88. [Google Scholar] [CrossRef]
- Hofmann, M.; Westermann, J.R.; Kowarik, I.; van der Meer, E. Perceptions of parks and urban derelict land by landscape planners and residents. Urban For. Urban Green. 2012, 11, 303–312. [Google Scholar] [CrossRef]
- Kremer, P.; Hamstead, Z.A.; McPhearson, T. A social–ecological assessment of vacant lots in New York City. Landsc. Urban Plan. 2013, 120, 218–233. [Google Scholar] [CrossRef]
- Nassauer, J.I.; Raskin, J. Urban vacancy and land use legacies: A frontier for urban ecological research, design, and planning. Landsc. Urban Plan. 2014, 125, 245–253. [Google Scholar] [CrossRef]
- Kowarik, I. Urban wilderness: Supply, demand, and access. Urban For. Urban Green. 2018, 29, 336–347. [Google Scholar] [CrossRef]
- Spirn, A.W.; Pollio, M. Vacant Land: A Resource for Reshaping Urban Neighborhoods; West Philadelphia Landscape Plan, Department of Landscape Architecture and Regional Planning, University of Pennsylvania: Philadelphia, PA, USA, 1991. [Google Scholar]
- Johnson, A.L.; Tauzer, E.C.; Swan, C.M. Human legacies differentially organize functional and phylogenetic diversity of urban herbaceous plant communities at multiple spatial scales. Appl. Veg. Sci. 2015, 18, 513–527. [Google Scholar] [CrossRef]
- Mathey, J.; Arndt, T.; Banse, J.; Rink, D. Public perception of spontaneous vegetation on brownfields in urban areas—results from surveys in Dresden and Leipzig (Germany). Urban For. Urban Green. 2018, 29, 384–392. [Google Scholar] [CrossRef]
- Németh, J.; Langhorst, J. Rethinking urban transformation: Temporary uses for vacant land. Cities 2014, 40, 143–150. [Google Scholar] [CrossRef]
- Zipperer, W.C. Species composition and structure of regenerated and remnant forest patches within an urban landscape. Urban Ecosyst. 2002, 6, 271–290. [Google Scholar] [CrossRef]
- Kim, G.; Miller, P.; Nowak, D. The value of green infrastructure on vacant and residential land in Roanoke, Virginia. Sustainability 2016, 8, 296. [Google Scholar] [CrossRef]
- Bastin, L.; Thomas, C.D. The distribution of plant species in urban vegetation fragments. Landsc. Ecol. 1999, 14, 493–507. [Google Scholar] [CrossRef]
- Johnson, A.L.; Borowy, D.; Swan, C.M. Land use history and seed dispersal drive divergent plant community assembly patterns in urban vacant lots. J. Appl. Ecol. 2018, 55, 451–460. [Google Scholar] [CrossRef]
- Accordino, J.; Johnson, G.T. Addressing the vacant and abandoned property problem. J. Urban Aff. 2000, 22, 301–315. [Google Scholar] [CrossRef]
- Nassauer, J.I. Messy ecosystems, orderly frames. Landsc. J. 1995, 14, 161–170. [Google Scholar] [CrossRef]
- Anderson, E.C.; Minor, E.S. Vacant lots: An underexplored resource for ecological and social benefits in cities. Urban For. Urban Green. 2017, 21, 146–152. [Google Scholar] [CrossRef]
- Rega-Brodsky, C.C.; Nilon, C.H. Vacant lots as a habitat resource: Nesting success and body condition of songbirds. Ecosphere 2016, 7, 1–11. [Google Scholar] [CrossRef]
- Aronson, M.F.J.; Lepczyk, C.A.; Evans, K.L.; Goddard, M.A.; Lerman, S.B.; MacIvor, J.S.; Nilon, C.H.; Vargo, T. Biodiversity in the city: Key challenges for urban green space management. Front. Ecol. Environ. 2017, 15, 189–196. [Google Scholar] [CrossRef]
- Lerman, S.B.; Contosta, A.R.; Milam, J.; Bang, C. To mow or to mow less: Lawn mowing frequency affects bee abundance and diversity in suburban yards. Biol. Conserv. 2018, 221, 160–174. [Google Scholar] [CrossRef]
- Lindemann-Matthies, P.; Junge, X.; Matthies, D. The influence of plant diversity on people’s perception and aesthetic appreciation of grassland vegetation. Biol. Conserv. 2010, 143, 195–202. [Google Scholar] [CrossRef] [Green Version]
- Lindemann-Matthies, P.; Marty, T. Does ecological gardening increase species richness and aesthetic quality of a garden? Biol. Conserv. 2013, 159, 37–44. [Google Scholar] [CrossRef]
- Unterweger, P.A.; Schrode, N.; Betz, O. Urban nature: Perception and acceptance of alternative green space management and the change of awareness after provision of environmental information. A chance for biodiversity protection. Urban Sci. 2017, 1, 24. [Google Scholar] [CrossRef]
- Northam, R.M. Vacant urban land in the American city. Land Econ. 1971, 47, 345–355. [Google Scholar] [CrossRef]
- Qiu, L.; Lindberg, S.; Nielsen, A.B. Is biodiversity attractive?—On-site perception of recreational and biodiversity values in urban green space. Landsc. Urban Plan. 2013, 119, 136–146. [Google Scholar] [CrossRef]
- Gobster, P.H.; Nassauer, J.I.; Daniel, T.C.; Fry, G. The shared landscape: What does aesthetics have to do with ecology? Landsc. Ecol. 2007, 22, 959–972. [Google Scholar] [CrossRef]
- U.S. Census Bureau. State and County Quickfacts; U.S. Department of Commerce: Washington, DC, USA, 2014.
- Pallagst, K.; Wiechmann, T.; Martinez-Fernandez, C. Shrinking Cities: International Perspectives and Policy Implications; Routledge: New York, NY, USA, 2015. [Google Scholar]
- Housing and Urban Renewal; Chapter 13 § 11; Baltimore City Department of Legislative Reference: Baltimore, MD, USA, 2017.
- Hayward, M.E.; Belfoure, C. The Baltimore Rowhouse; Princeton Architectural Press: New York, NY, USA, 1999. [Google Scholar]
- Zipperer, W.; Sisinni, S.; Pouyat, R.; Foresman, T. Urban tree cover: An ecological perspective. Urban Ecosyst. 1997, 1, 229–246. [Google Scholar] [CrossRef]
- Angelstam, P.; Roberge, J.-M.; Lõhmus, A.; Bergmanis, M.; Brazaitis, G.; Breuss, M.; Edenius, L.; Kosinski, Z.; Kurlavicius, P.; Lārmanis, V.; et al. Habitat modelling as a tool for landscape-scale conservation—A review of parameters for focal forest birds. Ecol. Bull. 2004, 51, 427–453. [Google Scholar]
- Sandström, U.G.; Angelstam, P.; Mikusiński, G. Ecological diversity of birds in relation to the structure of urban green space. Landsc. Urban Plan. 2006, 77, 39–53. [Google Scholar] [CrossRef]
- James, F.C.; Shugart, H.H. A quantitative method of habitat description. Audubon Field Notes 1970, 24, 727–736. [Google Scholar]
- Baltimore Office of Sustainability. Vacant Land Cover; Baltimore Office of Sustainability: Baltimore, MD, USA, 2012. [Google Scholar]
- Bibby, C.J.; Burgess, N.D.; Hill, D.A. Bird Census Techniques, 2nd ed.; Academic Press Limited: Cambridge, MA, USA, 2000. [Google Scholar]
- Goodman, L.A. Snowball sampling. Ann. Math. Stat. 1961, 32, 148–170. [Google Scholar] [CrossRef]
- Nassauer, J.I. Care and stewardship: From home to planet. Landsc. Urban Plan. 2011, 100, 321–323. [Google Scholar] [CrossRef]
- Kaplan, R.; Kaplan, S.; Brown, T. Environmental preference: A comparison of four domains of predictors. Environ. Behav. 1989, 21, 509–530. [Google Scholar] [CrossRef]
- McCune, B.; Mefford, M.J. PC-ORD. Multivariate Analysis of Ecological Data; Version 7; MjM Software Design: Gleneden Beach, OR, USA, 2016. [Google Scholar]
- R Core Team. R: A Language and Environment for Statistical Computing; R Foundation for Statistical Computing: Vienna, Austria, 2016; Available online: https://www.R-project.org (accessed on 18 April 2018).
- Weber, R.P. Basic Content Analysis; Sage: Newbury Park, CA, USA, 1990. [Google Scholar]
- Huang, R. RQDA: R-Based Qualitative Data Analysis; R Package Version 0.2-7; Sage Publications: Thousand Oaks, CA, USA, 2014. [Google Scholar]
- Blair, R.B. Land use and avian species diversity along an urban gradient. Ecol. Appl. 1996, 6, 506–519. [Google Scholar] [CrossRef]
- Schwarz, K.; Fragkias, M.; Boone, C.G.; Zhou, W.; McHale, M.; Grove, J.M.; O’Neil-Dunne, J.; McFadden, J.P.; Buckley, G.L.; Childers, D.; et al. Trees grow on money: Urban tree canopy cover and environmental justice. PLoS ONE 2015, 10, e0122051. [Google Scholar] [CrossRef] [PubMed]
- Holtan, M.T.; Dieterlen, S.L.; Sullivan, W.C. Social life under cover: Tree canopy and social capital in Baltimore, Maryland. Environ. Behav. 2014, 47, 502–525. [Google Scholar] [CrossRef]
- Battaglia, M.; Buckley, G.L.; Galvin, M.; Grove, J.M. It’s not easy going green: Obstacles to tree-planting programs in East Baltimore. Cities Environ. 2014, 7, 6. [Google Scholar]
- Carbó-Ramírez, P.; Zuria, I. The value of small urban greenspaces for birds in a Mexican city. Landsc. Urban Plan. 2011, 100, 213–222. [Google Scholar] [CrossRef]
- Ferenc, M.; Sedláček, O.; Fuchs, R. How to improve urban greenspace for woodland birds: Site and local-scale determinants of bird species richness. Urban Ecosyst. 2014, 17, 625–640. [Google Scholar] [CrossRef]
- MacGregor-Fors, I. Relation between habitat attributes and bird richness in a western Mexico suburb. Landsc. Urban Plan. 2008, 84, 92–98. [Google Scholar] [CrossRef]
- Barth, B.J.; FitzGibbon, S.I.; Wilson, R.S. New urban developments that retain more remnant trees have greater bird diversity. Landsc. Urban Plan. 2015, 136, 122–129. [Google Scholar] [CrossRef]
- Dearborn, D.C.; Kark, S. Motivations for conserving urban biodiversity. Conserv. Biol. 2010, 24, 432–440. [Google Scholar] [CrossRef] [PubMed]
- Lindenmayer, D.B.; Franklin, J.F.; Fischer, J. General management principles and a checklist of strategies to guide forest biodiversity conservation. Biol. Conserv. 2006, 131, 433–445. [Google Scholar] [CrossRef]
- Ulrich, R.S. Human responses to vegetation and landscapes. Landsc. Urban Plan. 1986, 13, 29–44. [Google Scholar] [CrossRef]
- Kuo, F.E.; Sullivan, W.C.; Coley, R.L.; Brunson, L. Fertile ground for community: Inner-city neighborhood common spaces. Am. J. Community Psychol. 1998, 26, 823–851. [Google Scholar] [CrossRef]
- Bjerke, T.; Østdahl, T.; Thrane, C.; Strumse, E. Vegetation density of urban parks and perceived appropriateness for recreation. Urban For. Urban Green. 2006, 5, 35–44. [Google Scholar] [CrossRef]
- Ode, Å.; Fry, G.; Tveit, M.S.; Messager, P.; Miller, D. Indicators of perceived naturalness as drivers of landscape preference. J. Environ. Manag. 2009, 90, 375–383. [Google Scholar] [CrossRef] [PubMed]
- Stankey, G.H.; Shindler, B. Formation of social acceptability judgments and their implications for management of rare and little-known species. Conserv. Biol. 2006, 20, 28–37. [Google Scholar] [CrossRef] [PubMed]
- Shindler, B.A.; Brunson, M.; Stankey, G.H. Social Acceptability of Forest Conditions and Management Practices: A Problem Analysis; Gen. Tech. Rep. PNW-GTR-537; U.S. Department of Agriculture, Forest Service, Pacific Northwest Research Station: Portland, OR, USA, 2002.
- Harrison, C.M.; Burgess, J. Social constructions of nature: A case study of conflicts over the development of rainham marshes. Trans. Inst. Br. Geogr. 1994, 19, 291–310. [Google Scholar] [CrossRef]
- Newman, G.D.; Smith, A.L.; Brody, S.D. Repurposing vacant land through landscape connectivity. Landsc. J. 2017, 36, 37–57. [Google Scholar] [CrossRef]
- Boone, C.G.; Buckley, G.L.; Grove, J.M.; Sister, C. Parks and people: An environmental justice inquiry in Baltimore, Maryland. Ann. Assoc. Am. Geogr. 2009, 99, 767–787. [Google Scholar] [CrossRef]
- Vaughan, K.B.; Kaczynski, A.T.; Wilhelm Stanis, S.A.; Besenyi, G.M.; Bergstrom, R.; Heinrich, K.M. Exploring the distribution of park availability, features, and quality across Kansas City, Missouri by income and race/ethnicity: An environmental justice investigation. Ann. Behav. Med. 2013, 45, 28–38. [Google Scholar] [CrossRef] [PubMed] [Green Version]
- Rigolon, A. A complex landscape of inequity in access to urban parks: A literature review. Landsc. Urban Plan. 2016, 153, 160–169. [Google Scholar] [CrossRef]
- USDA. PLANTS Database. 2018. Available online: https://plants.usda.gov/ (accessed on 13 May 2018).
Figure 1.
To maximize vacant lot sustainability, we hypothesize that biodiversity and residents’ preferences can be balanced through residents’ top-down management goals and bottom-up limitations of the lot’s setting and origin. Vegetation origin directly influences biotic composition in the vacant lot, all of which is constrained by the vacant lot’s setting in the urban matrix. The top-down management of vacant lots driven by residents’ preferences may impact the lot’s setting or its plant community origin, thus impacting the bird community.

Figure 2.
Vacant land and study locations (a) in Baltimore, Maryland; Vacant lots differed in their vegetation origin (b) and settings within the urban matrix (c).
Figure 2.
Vacant land and study locations (a) in Baltimore, Maryland; Vacant lots differed in their vegetation origin (b) and settings within the urban matrix (c).

Figure 3.
Six settings of vacant lots (dark gray) within urban areas, surrounded by houses (gray rectangles), roads (white), and railways (light gray lines).
Figure 3.
Six settings of vacant lots (dark gray) within urban areas, surrounded by houses (gray rectangles), roads (white), and railways (light gray lines).

Figure 4.
Vacant lots selected for a resident survey to assess preferences for lot structure and composition.
Figure 4.
Vacant lots selected for a resident survey to assess preferences for lot structure and composition.

Figure 5.
Vegetation and bird community differences across vacant lot settings. Means (± standard error) grouped by similar letters (i.e., a, b, c) are not significantly different from each other (Tukey HSD, p > 0.05). Figures without letters did not have significant differences across lot settings (ANOVA, p > 0.05).

Figure 6.
Vegetation and bird community differences across vacant lot origins. Means (± standard error) grouped by similar letters (i.e., a, b, c) are not significantly different from each other (Tukey HSD, p > 0.05).
Figure 6.
Vegetation and bird community differences across vacant lot origins. Means (± standard error) grouped by similar letters (i.e., a, b, c) are not significantly different from each other (Tukey HSD, p > 0.05).

Table 1.
Sample size (n) and vegetation and bird community variable means (± standard error) for each vacant lot settings and origin.
Table 1.
Sample size (n) and vegetation and bird community variable means (± standard error) for each vacant lot settings and origin.
| Lot Characteristic | Setting | Origin | |||||||
|---|---|---|---|---|---|---|---|---|---|
| Vacant Block | Corner Lot | Inner Block | Suburban Yard | Missing Tooth | Wayside | Emergent | Planted | Remnant | |
| n (%) | 47 (31%) | 27 (18%) | 35 (23%) | 13 (9%) | 24 (16%) | 4 (3%) | 96 (64%) | 38 (25%) | 16 (11%) |
| Lot Area (ha) | 0.93 (0.13) | 0.21 (0.00) | 0.25 (0.01) | 0.46 (0.03) | 0.25 (0.01) | 0.64 (0.06) | 0.39 (0.08) | 0.52 (0.04) | 0.97 (0.06) |
| Ground Cover Height (cm) | 21.18 (1.47) | 29.43 (2.30) | 21.60 (1.54) | 26.36 (2.33) | 18.14 (1.64) | 25.79 (1.03) | 26.64 (1.98) | 11.67 (0.62) | 26.66 (1.47) |
| Artificial Ground Cover (%) | 8.04 (0.97) | 9.88 (1.44) | 10.35 (0.96) | 0.74 (0.11) | 7.86 (1.12) | 7.25 (0.74) | 10.22 (1.22) | 5.24 (0.58) | 3.38 (0.62) |
| Grass Ground Cover (%) | 45.83 (2.04) | 42.73 (1.47) | 40.12 (0.92) | 41.03 (2.09) | 42.35 (1.35) | 23.67 (1.38) | 41.75 (1.24) | 54.51 (1.60) | 17.29 (1.73) |
| Canopy Cover (%) | 29.24 (2.72) | 34.96 (2.53) | 27.49 (1.89) | 38.33 (2.46) | 37.00 (2.53) | 68.86 (3.43) | 29.56 (2.40) | 25.06 (1.80) | 72.04 (2.29) |
| Stem Density (stems/plot) | 19.32 (3.61) | 21.15 (1.54) | 17.10 (1.46) | 47.49 (6.17) | 33.10 (4.18) | 49.21 (2.44) | 22.33 (2.48) | 9.55 (1.25) | 73.72 (7.06) |
| Canopy Height (m) | 19.81 (0.56) | 18.15 (0.43) | 15.89 (0.36) | 19.87 (0.37) | 18.44 (0.44) | 17.00 (0.29) | 17.24 (0.40) | 18.25 (0.44) | 24.83 (0.56) |
| Tree Abundance | 2.42 (0.28) | 1.75 (0.13) | 2.31 (0.16) | 4.79 (0.51) | 2.00 (0.14) | 5.75 (0.21) | 1.77 (0.14) | 2.09 (0.15) | 7.85 (0.47) |
| Average DBH (cm) | 33.66 (2.26) | 36.42 (2.34) | 31.71 (1.95) | 30.54 (1.75) | 36.16 (1.95) | 41.31 (2.30) | 33.20 (2.16) | 36.56 (2.18) | 33.07 (1.44) |
| Tree Species Richness | 1.36 (0.11) | 1.22 (0.08) | 1.34 (0.08) | 2.03 (0.14) | 1.54 (0.10) | 2.17 (0.04) | 1.15 (0.08) | 1.50 (0.09) | 3.04 (0.13) |
| Bird Species Richness | 13.19 (0.23) | 12.89 (0.24) | 12.40 (0.17) | 14.92 (0.21) | 12.33 (0.20) | 12.50 (0.08) | 12.51 (0.20) | 13.05 (0.24) | 15.31 (0.18) |
Table 2.
ANOVA results for differences in the vegetation and bird community across vacant lot settings and origins.
Table 2.
ANOVA results for differences in the vegetation and bird community across vacant lot settings and origins.
| Independent Variable | Dependent Variable | F | P |
|---|---|---|---|
| Setting | Lot area (ha) | 3.43 | 0.006 |
| Ground cover height (cm) | 0.88 | 0.50 | |
| Grass ground cover (%) | 1.00 | 0.42 | |
| Artificial ground cover (%) | 1.33 | 0.26 | |
| Tree species richness | 1.09 | 0.39 | |
| Tree abundance | 2.89 | 0.016 | |
| Tree DBH (cm) | 0.25 | 0.94 | |
| Canopy height (m) | 2.21 | 0.056 | |
| Canopy cover (%) | 1.67 | 0.14 | |
| Stem density | 1.73 | 0.13 | |
| Bird species richness | 2.08 | 0.072 | |
| Origin | Lot area (ha) | 2.58 | 0.079 |
| Ground cover height (cm) | 7.53 | <0.001 | |
| Grass ground cover (%) | 25.56 | <0.001 | |
| Artificial ground cover (%) | 2.15 | 0.12 | |
| Tree species richness | 19.02 | <0.001 | |
| Tree abundance | 40.05 | <0.001 | |
| Tree DBH (cm) | 0.24 | 0.78 | |
| Canopy height (m) | 14.09 | <0.001 | |
| Canopy cover (%) | 18.22 | <0.001 | |
| Stem density | 16.78 | <0.001 | |
| Bird species richness | 8.03 | <0.001 |
Table 3.
Resident preference ranks for each vacant lot presented in the survey (Figure 4). Preference ranks are averages (± standard error) from survey respondents. Residents may have selected multiple lots as most and least preferred to have in their neighborhoods.
Table 3.
Resident preference ranks for each vacant lot presented in the survey (Figure 4). Preference ranks are averages (± standard error) from survey respondents. Residents may have selected multiple lots as most and least preferred to have in their neighborhoods.
| Lot | Preference Rank | Most Preferred (%) | Least Preferred (%) |
|---|---|---|---|
| A | 3.38 (0.12) | 63.6 | 15.9 |
| B | 2.60 (0.13) | 20.5 | 38.6 |
| C | 3.29 (0.10) | 59.1 | 6.8 |
| D | 2.67 (0.11) | 31.8 | 15.9 |
| E | 3.83 (0.08) | 77.3 | 2.3 |
| F | 2.74 (0.14) | 27.3 | 25.0 |
| G | 1.48 (0.12) | 0 | 84.1 |
| H | 2.43 (0.11) | 6.8 | 61.4 |
Table 4.
Positive (+) and negative (−) features of various vacant lot settings and origins, grouped by urban biodiversity attributes and resident preferences. Biodiversity and preference features highlighted in this table represent the significant relationships between lot origins and settings as detailed in Table 2 and Table 3. Vacant lot settings and origins in which both urban biodiversity and resident preferences are maximized may be considered sustainable.
| Lot Characteristic | Urban Biodiversity | Resident Preferences | |
|---|---|---|---|
| Setting | Vacant Block | + Common, large area | + Features: Trees, shade |
| + Wildlife habitat: Greater canopy cover | |||
| Corner Lot | − Small in area | + Access: Surrounded by rowhomes | |
| − Wildlife habitat: Fewer trees | |||
| Inner Block | − Small in area | + Access: Surrounded by rowhomes | |
| Suburban Yard | + Wildlife habitat: More trees, canopy cover | + Trees, shade + Access: Surrounded by single family homes | |
| Missing Tooth | − Small in area | + Access: Surrounded by rowhomes | |
| Wayside | + Large in total area | − Near busy, dangerous transportation routes | |
| − Narrow lots, edge habitat | |||
| Origin | Emergent | + Common | − Low preference rank |
| + Wildlife habitat: Tall grass | − Association with trash, unwanted pests, illegal activities | ||
| − Lack of visible care with tall grass | |||
| Planted | − Wildlife habitat: Lawn | + High preference rank | |
| + Landscaped lawns | |||
| + Preferred future use (Community gardens, flowers) | |||
| Remnant | + Wildlife habitat: More trees, canopy cover, shrub cover | + High preference rank | |
| + More bird species | + Trees, shade | ||
| − Rare in urban areas | − Less lawn, tall ground cover, dense shrubs | ||
© 2018 by the authors. Licensee MDPI, Basel, Switzerland. This article is an open access article distributed under the terms and conditions of the Creative Commons Attribution (CC BY) license (http://creativecommons.org/licenses/by/4.0/).
Share and Cite
MDPI and ACS Style
Rega-Brodsky, C.C.; Nilon, C.H.; Warren, P.S. Balancing Urban Biodiversity Needs and Resident Preferences for Vacant Lot Management. Sustainability 2018, 10, 1679. https://0-doi-org.brum.beds.ac.uk/10.3390/su10051679
AMA Style
Rega-Brodsky CC, Nilon CH, Warren PS. Balancing Urban Biodiversity Needs and Resident Preferences for Vacant Lot Management. Sustainability. 2018; 10(5):1679. https://0-doi-org.brum.beds.ac.uk/10.3390/su10051679
Chicago/Turabian StyleRega-Brodsky, Christine C., Charles H. Nilon, and Paige S. Warren. 2018. "Balancing Urban Biodiversity Needs and Resident Preferences for Vacant Lot Management" Sustainability 10, no. 5: 1679. https://0-doi-org.brum.beds.ac.uk/10.3390/su10051679
Note that from the first issue of 2016, this journal uses article numbers instead of page numbers. See further details here.