1. Introduction
In 2010, buildings accounted for 32% of total global final energy usage [
1]. The European Directive 2012/27/EU [
2] requires member states to have a strategy for renovation of the building stock with the target of reducing energy usage by 20% by 2020 compared with 1990. In many European countries, the building stock increased at a rapid pace during the period 1950–1975 [
3]. This aging building stock needs to be renovated, and there is a possibility to introduce energy efficiency measures in the renovation process [
4,
5].
Building condition, building ownership, and rent affordability determine what kind of renovation measures are possible and optimal [
6]. Furthermore, tenure types, building regulations, construction practices etc. vary between different contexts, which increases the need for country-specific studies on renovation investments and energy performance [
7,
8,
9]. The authors have developed methods for analyzing investments in renovation and building energy performance based on comprehensive building-specific information that can be used to analyze subgroups of building owners and specific socio-economic inhabitant groups. This was done for the Swedish case and to be used by the Swedish authorities. The paper tries to answer the question how can merged official comprehensive building specific information be used to describe the developments in the multi-family dwelling stock?
There are several studies on how ownership and socio-economic area conditions affect investment and energy performance. For rental multi-family dwellings, the landlord–tenant problem can be a barrier to energy retrofitting and renovation [
10,
11,
12,
13,
14]. The multi-family dwellings that are resident-owned also have internal barriers to larger investments in energy retrofitting [
15,
16,
17]. There is also not a consensus on which parameters should be included in an optimization of renovation projects. For instance, renovations financed by increased rents in socio-economically disadvantaged areas risk aggravating societal inequities [
18,
19,
20].
The purpose of this article is to describe quantitative methods developed for analyzing how overall renovation progress and improved energy performance of buildings is related to ownership structures. The methods were developed for the multi-family dwellings in Gothenburg, Sweden, with the intention of being applicable for the entire national building stock in the update of the national strategy of energy efficient renovation in 2019. This article also contributes within the field of analysis of building specific information coupled with measured energy usage, also presented as Building Energy Epidemiology by the International Energy Agency, Annex 70. Countries have different registers and specific ways of storing and working with information. This article presents the Swedish case and methods developed for working with Swedish building specific information.
Building specific energy usage for all Gothenburg multi-family dwellings was gathered from Swedish Energy Performance Certificates (EPC). In most other counties in Europe the EPCs contain estimated energy usage, while in Sweden the EPCs should be issued by an certified energy expert that registers measured energy for heating from the 13 most commonly used heating sources, heating for tap water, and domestic electricity usage [
21,
22]. Renovation investments were deduced from official property taxation records. By aligning these datasets with building-specific information on ownership, tenure, and living-area socio-economic information, it is possible to analyze the progress toward the goals of reduced energy usage and decreased segregation. Michelsen et al. [
23] also used measured energy usage from EPC data for German the building stock and made similar analyses focusing mainly on the difference between smaller and larger real estate owners. Michelsen et al. [
23] found that larger real estate companies outperform smaller companies in terms of extensive renovations, but smaller companies can be better at continuous maintenance. This article compares real estate companies with other types of ownership. Albatici et al. [
24] and Šijanec Zavrl et al. [
25] merged mainly energy-related databases for the Italian and Slovenian building stock to model scenarios of developments toward energy efficiency. Our additional contribution is to work toward the development of methods that also include socio-economic parameters of building stock development.
Matschoss et al. [
17] made a larger European summary of renovation policy that include tenure and found that incentives for condominium owners to energy retrofit buildings are needed in Europe to reach the 20-20-20 targets. This article sheds light on the renovation activities of multi-family dwellings in Sweden in two main ways. First, it describes methods developed for analyzing energy usage and investment in renovation in different ownership groups intended to be applied future analysis of impact of building regulations and subsidies. Second, we add to the literature on decision-making by presenting an empirical analysis of a large sample of homogeneous organizations, where one can distinguish between individual and social decision making.
Real-Estate Ownership in Sweden
To analyze the impact of regulations and subsidy schemes, it is necessary to distinguish between different ownership for which decision-making structures, taxation rules, subsidies, and the availability of funds are different. In addition, there is a variation between the ownership types in living area per person and in the resident profit or increased cost from improved living standards and energy performance.
Swedish multi-family dwellings are primarily of two tenure types: rental apartments or resident owned apartments, which is a type of tenure comparable with condominiums. Residents own a tradable share in a resident’s organization that gives them the right to inhabit a specific apartment of the building. Member of the resident’s organization are required to pay a membership fee toward maintenance and capital costs.
The rental apartments can be divided in two larger groups: municipally owned and privately owned [
26]. From 1960 to 1975, a national initiative was initiated with the aim to build one million dwellings to cover an urgent housing need in Sweden [
26,
27]. The multi-family dwellings constructed during this period were constructed as privately owned rental apartments (20%), municipal rental apartments (50%), and resident-owned apartments (30%) [
26]. Details about the building age typology can be found in
Table A1. The main construction types in the Gothenburg multi-family building stock are slab block, enclosed block, point block, and gallery access block.
Private real estate firms are for-profit organizations that typically are family controlled, though investment funds are growing in importance within this group. Private real estate firms span from private individuals that own one building to large firms that own properties nationally as well as internationally. The modus operandi of private building owners is expected to be that of for-profits in general—to maximize asset value over time. For this reason, renovation as investments in general by private building owners are more likely to take place in attractive areas where risk is lower. With lower risk, the value added to money invested is higher. Some variation should also be found between different private tenants in how they make decisions. For instance, large firms possess superior organizational capacity and have better access to external finance. This means that they are likely to be better equipped to make investments in general and thereby are more inclined to follow through with investments [
23].
Municipality owned multi-family dwellings in Gothenburg consist of four large companies. Municipally owned apartments are located in both areas with higher and lower income. They differ from private firms as they, historically, have not had profits as an organizational goal. In fact, they have not even been allowed to make profits. Instead, their focus has been to provide sufficient and affordable housing. The pro-social goal of these firms indicates that they are more inclined to make investments in lower income areas. Renovation can also be more common in municipally owned building due the fact that these companies have had access to cheaper finance through municipal bails.
Resident-owned apartments differ from both private and municipal housing companies. To start with, they are not subject to rental regulation. That means that they can increase their member fees for supplying value-adding features to their members in ways that rental housing companies cannot. For instance, if a private real estate company invests in reduced energy usage and improved indoor climate, this investment has to be carried by the cost reductions from the lower energy usage only. They are not allowed to charge a higher rent for the improved indoor climate and area branding. The group of resident-owned apartments, by contrast, can internalize such features in their member fees. This should increase the scope for more far-reaching renovation.
However, investments in resident-owned buildings are dampened by obstacles associated with social choice. In particular, if the membership fee is increased, the market value of the apartment decreases, making it difficult for all tenants to agree on a time when renovation should happen. Mastschoss et al. [
17] studied barriers to energy retrofitting of owner-occupied multi-family dwellings in nine European countries, not including Sweden, finding that collective decision problems is a challenge in every country and that lack of professional experience of real estate management is another challenge. Indeed, suboptimal decisions in co-ops can be costly [
28].
As part of the strategy to tackle the housing need that existed before the 1960–1975 era, two cooperatives for groups of resident owned apartments were founded, HSB and Riksbyggen. These cooperatives constructed buildings that were sold to their member groups. The cooperatives also manage and maintain the resident-owned buildings. The cooperatives promote maintenance plans and certain types of renovations. The economic model may include a larger maintenance plan with more frequent visits and thus require less renovation projects.
After the Swedish bank crisis in 1991, privately owned rental apartments were converted into resident-owned apartments at an increased pace. It is more common with resident-owned buildings in attractive parts of the city, and the price increase of apartments in resident owned buildings has had a strong positive development during the past 20 years. During the same period, municipally owned multi-family dwellings have been sold to private capital funds in order to finance renovation and maintenance [
29].
3. Methods
The regressions were made to find and compare patterns of renovation investments and energy usage. The intention is to use these types of regressions for the assessment of building regulations and subsidy schemes in 2019. However, there are several other data analysis methods and visualization tools that are needed to communicate results with decision makers. The categorization of the building owners in this paper is an illustration of how to make the comprehensive building specific information more understandable. Timelines is another way to illustrate development that make it easy for practitioners, academics and decision makers to work together in the development of policy.
Regressions were made in R to explain variance in renovation investments and energy performance, see
Table 2. Renovation investments and energy performance were derived from value year and renovation year in the register of the Swedish National Land Survey and from the Energy Performance Certificates (EPC). The value year is initially the year of construction, but as the building is renovated, the value year will be changed depending on the cost of the renovation. This is further described in
Table A4. The purpose of recording a value year is to have an official record of anticipated remaining service life of buildings [
32].
3.1. Renovation Investments
In Sweden, renovations are registered on a municipal level. The Swedish Tax Office require that a renovation is registered as a change in value year depending on the cost of the renovation in relation to new building cost as described in
Table A4 and Equation (1). New building cost is revised yearly by the Swedish tax authority to reflect inflation and changes in construction costs.
The groups in
Table A4 were used in the ordinal (logit) regression in model 1. The groups are further described in
Table A5. Using Equation (1), it was possible to calculate the renovation extent and equivalent cost of previous renovation projects from the value year and reconstruction year for group 2. The renovation extent was used as a dependent in model 2.
3.2. Energy Performance
Most EPCs for multi-family dwellings in Gothenburg were issued in 2008 and 2009 [
30]. Since only one measurement of energy use is available from the EPC the statistical analysis for the relationship between building energy performance and investment in renovation the buildings were divided using renovation year of 2009 as a watershed. Energy performance of buildings renovated before 2009 include the impact of renovations. Only these buildings were used to analyze the importance of renovation investment for building energy performance,
N = 5697. The buildings renovated after 2009 were used to analyze the importance of energy savings advice provided in the EPC for renovation investments.
The EPC will be renewed in 2019. This will make it possible to replace energy performance with change in energy performance as a dependent in the future analyses of success and impact of changed building regulations and subsidy schemes.
Energy for heating domestic hot water is included in the energy performance presented in the EPC. However, regression analyses have been made for both energy performance including and excluding energy for heating domestic hot water. There is a large difference in registered heating for domestic hot water between the building ownership groups in Gothenburg (see
Figure 1). Removal of outliers was conducted with the criterion 2.5 standard deviation above average buildings energy performance (223 and 182 kWh/m
2.year for energy performance with and without energy for heating domestic hot water).
Some studies suggest that water usage can be used as a proxy for number of inhabitants and time spent at home [
33]. In
Figure 1, the energy for heating of domestic hot water has been separated from the energy performance to illustrate the differences between the ownership groups. Living area per person has impact on both the need of renovation and on energy usage in buildings.
3.3. Independent Variables in Regression Analyses
Nominal, ordinal, and scalar variables were used in the regression analyses. The independent variables building age, heating system, and ownership group are nominal variables that were converted into nominal groups of variables for the linear regression analyses. One variable in each group was kept outside of the linear regression analyses as a reference category; these are indicated with asterisk in
Table A6. In the regression analyses, it was also possible to use base area average income as an independent variable instead of separating private company and municipal ownership into subgroups. For the statistical analyses of building energy performance, the importance of the time period in which the renovation happened was studied by creation an ordinal variable in segments 1979–1989, 1990–1999, and 2000–2009. This variable was excluded in the analyses of renovation investment because of the strong interdependence of the two variables both derived from renovation year.
3.4. Robustness Checks
In order to estimate renovation investments made in the entire building stock and be able to make a linear regression for the renovation costs, costs for renovations for group 1 and group 3 in
Table A4 were assumed. The robustness of these assumptions was checked through the comparison between model 1 and 2, as well as an additional linear regression for only group 2. The assumptions caused no larger differences in the predictions.
Data on building ownership from Swedish National Land Survey only describe the building ownership in 2014. The changes in ownership were included by the addition of conversions registered in Retriever Business. The analysis of investment in relation to conversion was done only for the buildings registered in Retriever Business.
4. Results
Analyses of total costs and estimates of future cost of renovations and energy retrofitting were conducted by Mangold et al. [
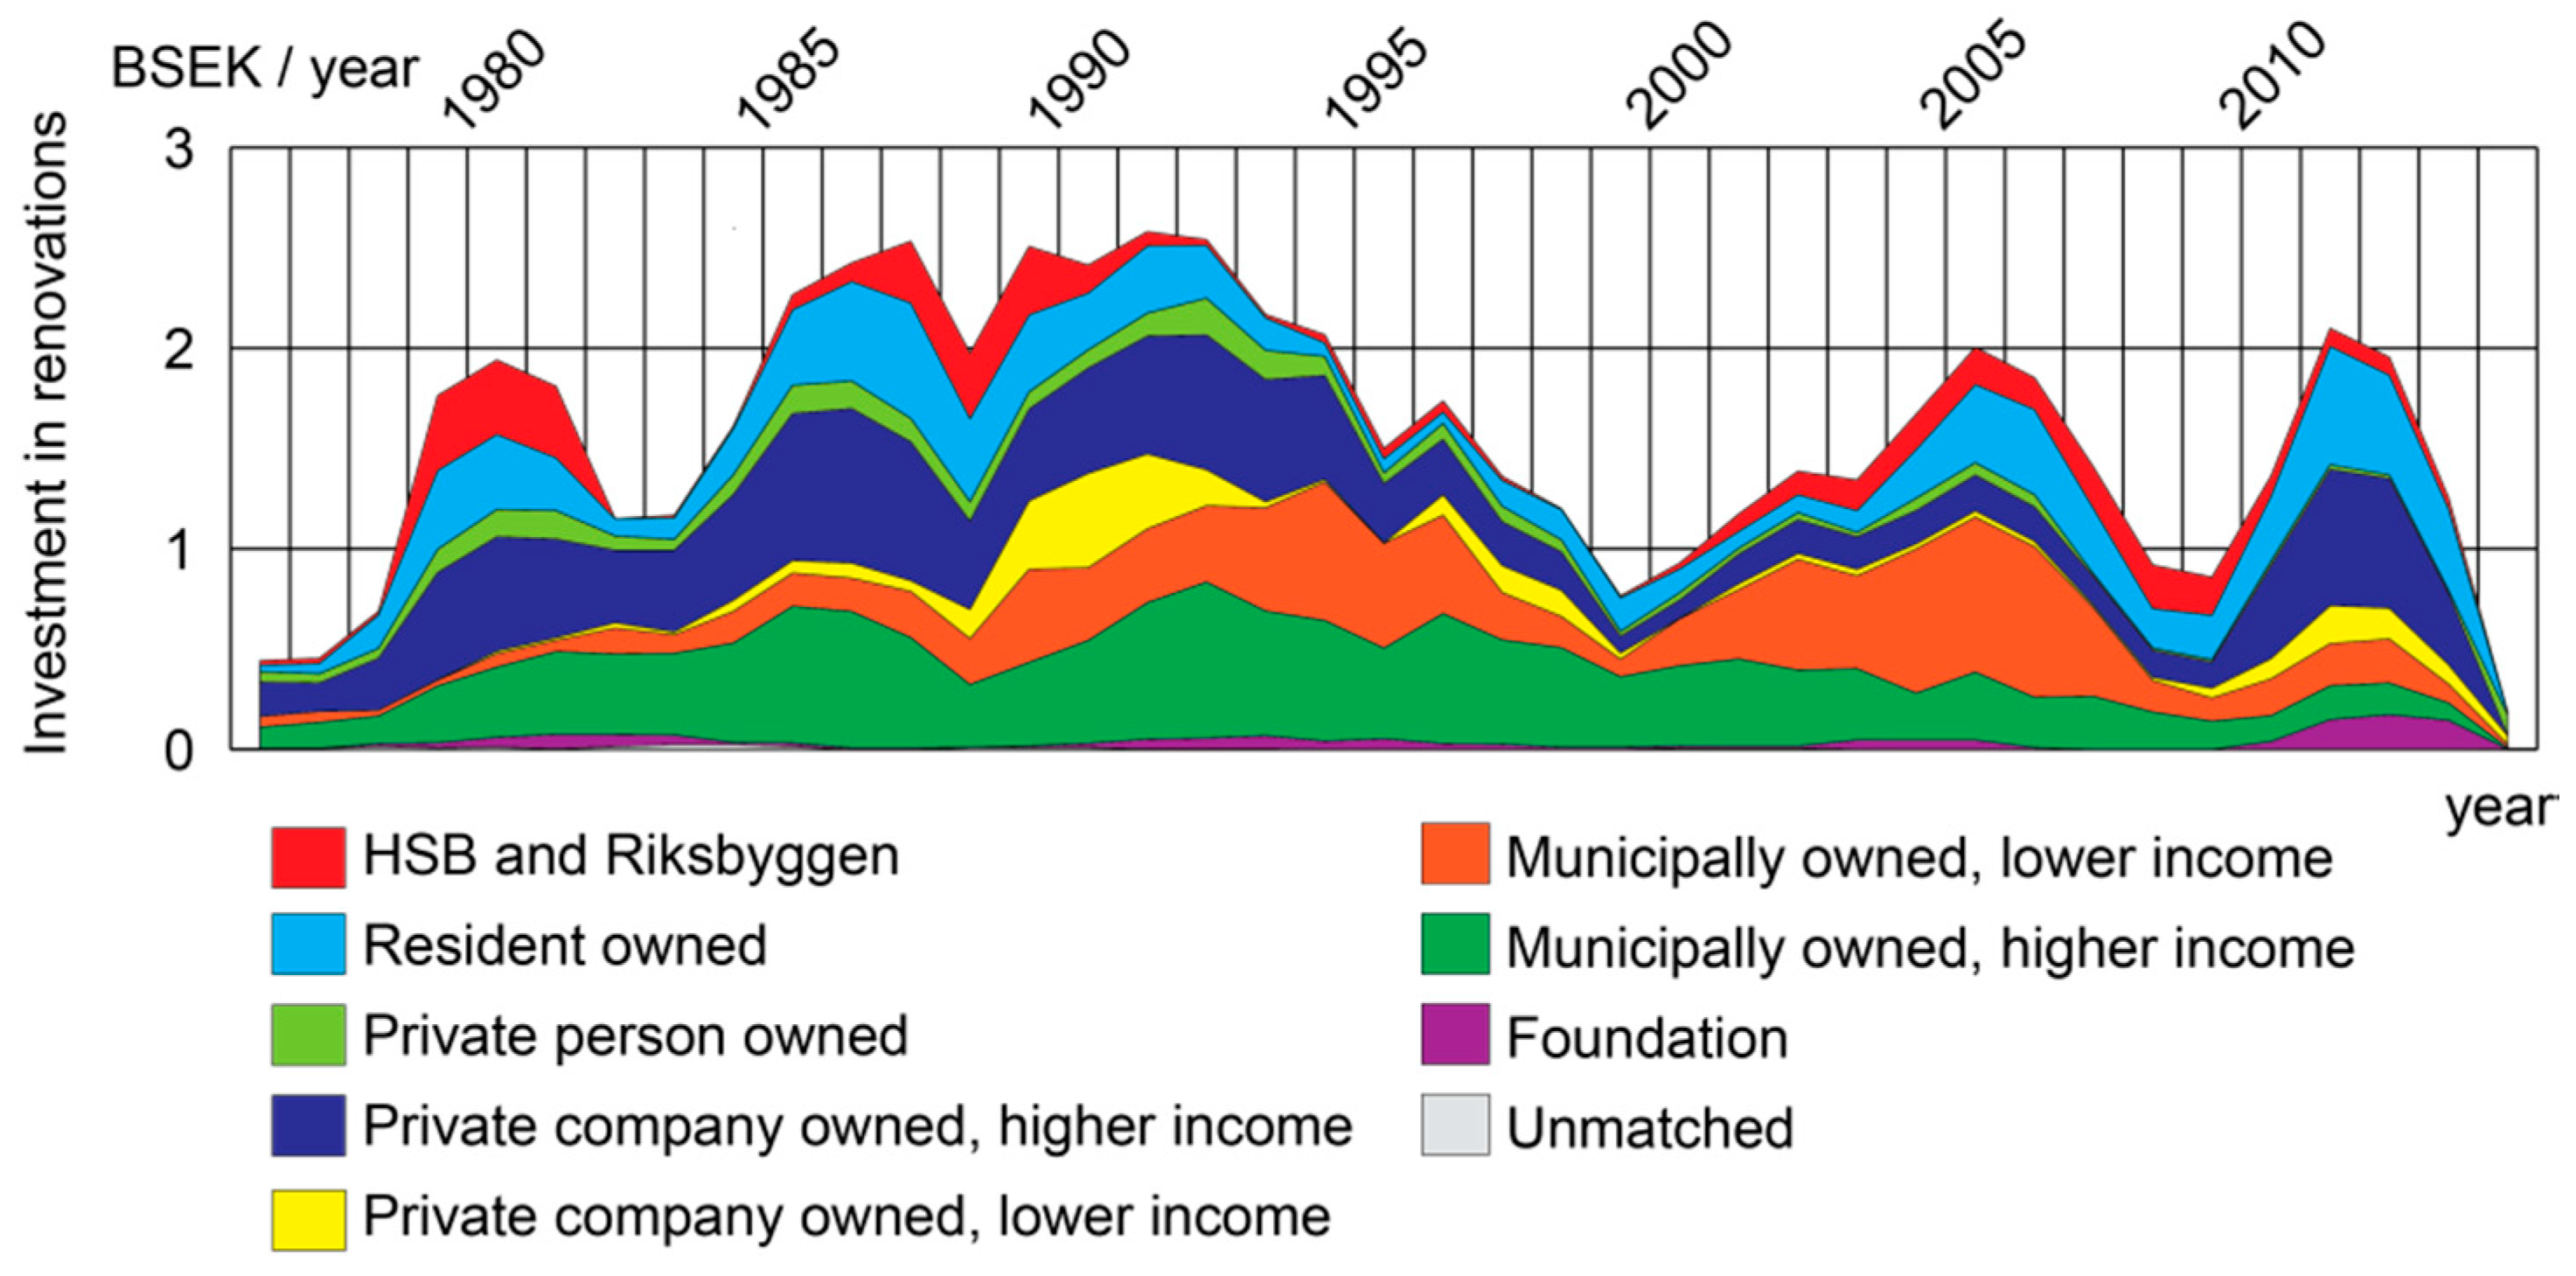
31]. In
Figure 2, past renovation costs have been separated further in the ownership groups. A difference in how consistently the members in ownership groups invest in renovations can be seen and the economic crises in 1991 and 2000 are observable.
The division of areas into higher and lower income is based on income statistics from 2015 which means that changes in income is not reflected in
Figure 2. Some of the renovation costs in the municipally owned, higher income areas in the 1980ties and 1990ties were made in central areas that had a lower income level when they were renovated but are now higher income areas.
The renovation costs in
Figure 2 include buildings from all construction periods. In the two largest ownership groups of multi-family dwellings constructed during 1960–1975—HSB and Riksbyggen and municipally owned, lower income—there is a considerable amount of multi-family dwellings that has not been renovated (see
Table 3). The group resident-owned contain the most renovations that have been conducted with a cost of less than 20% of new building cost in
Table 3. It is easier for resident that own their buildings to agree on and carry out smaller renovation investments than it is for other ownership groups.
For the discussion on municipal or private ownership of rental buildings in lower income areas, it is relevant to notice that private companies, and especially private persons, have registered fewer investments through renovations than municipal companies in
Table 3.
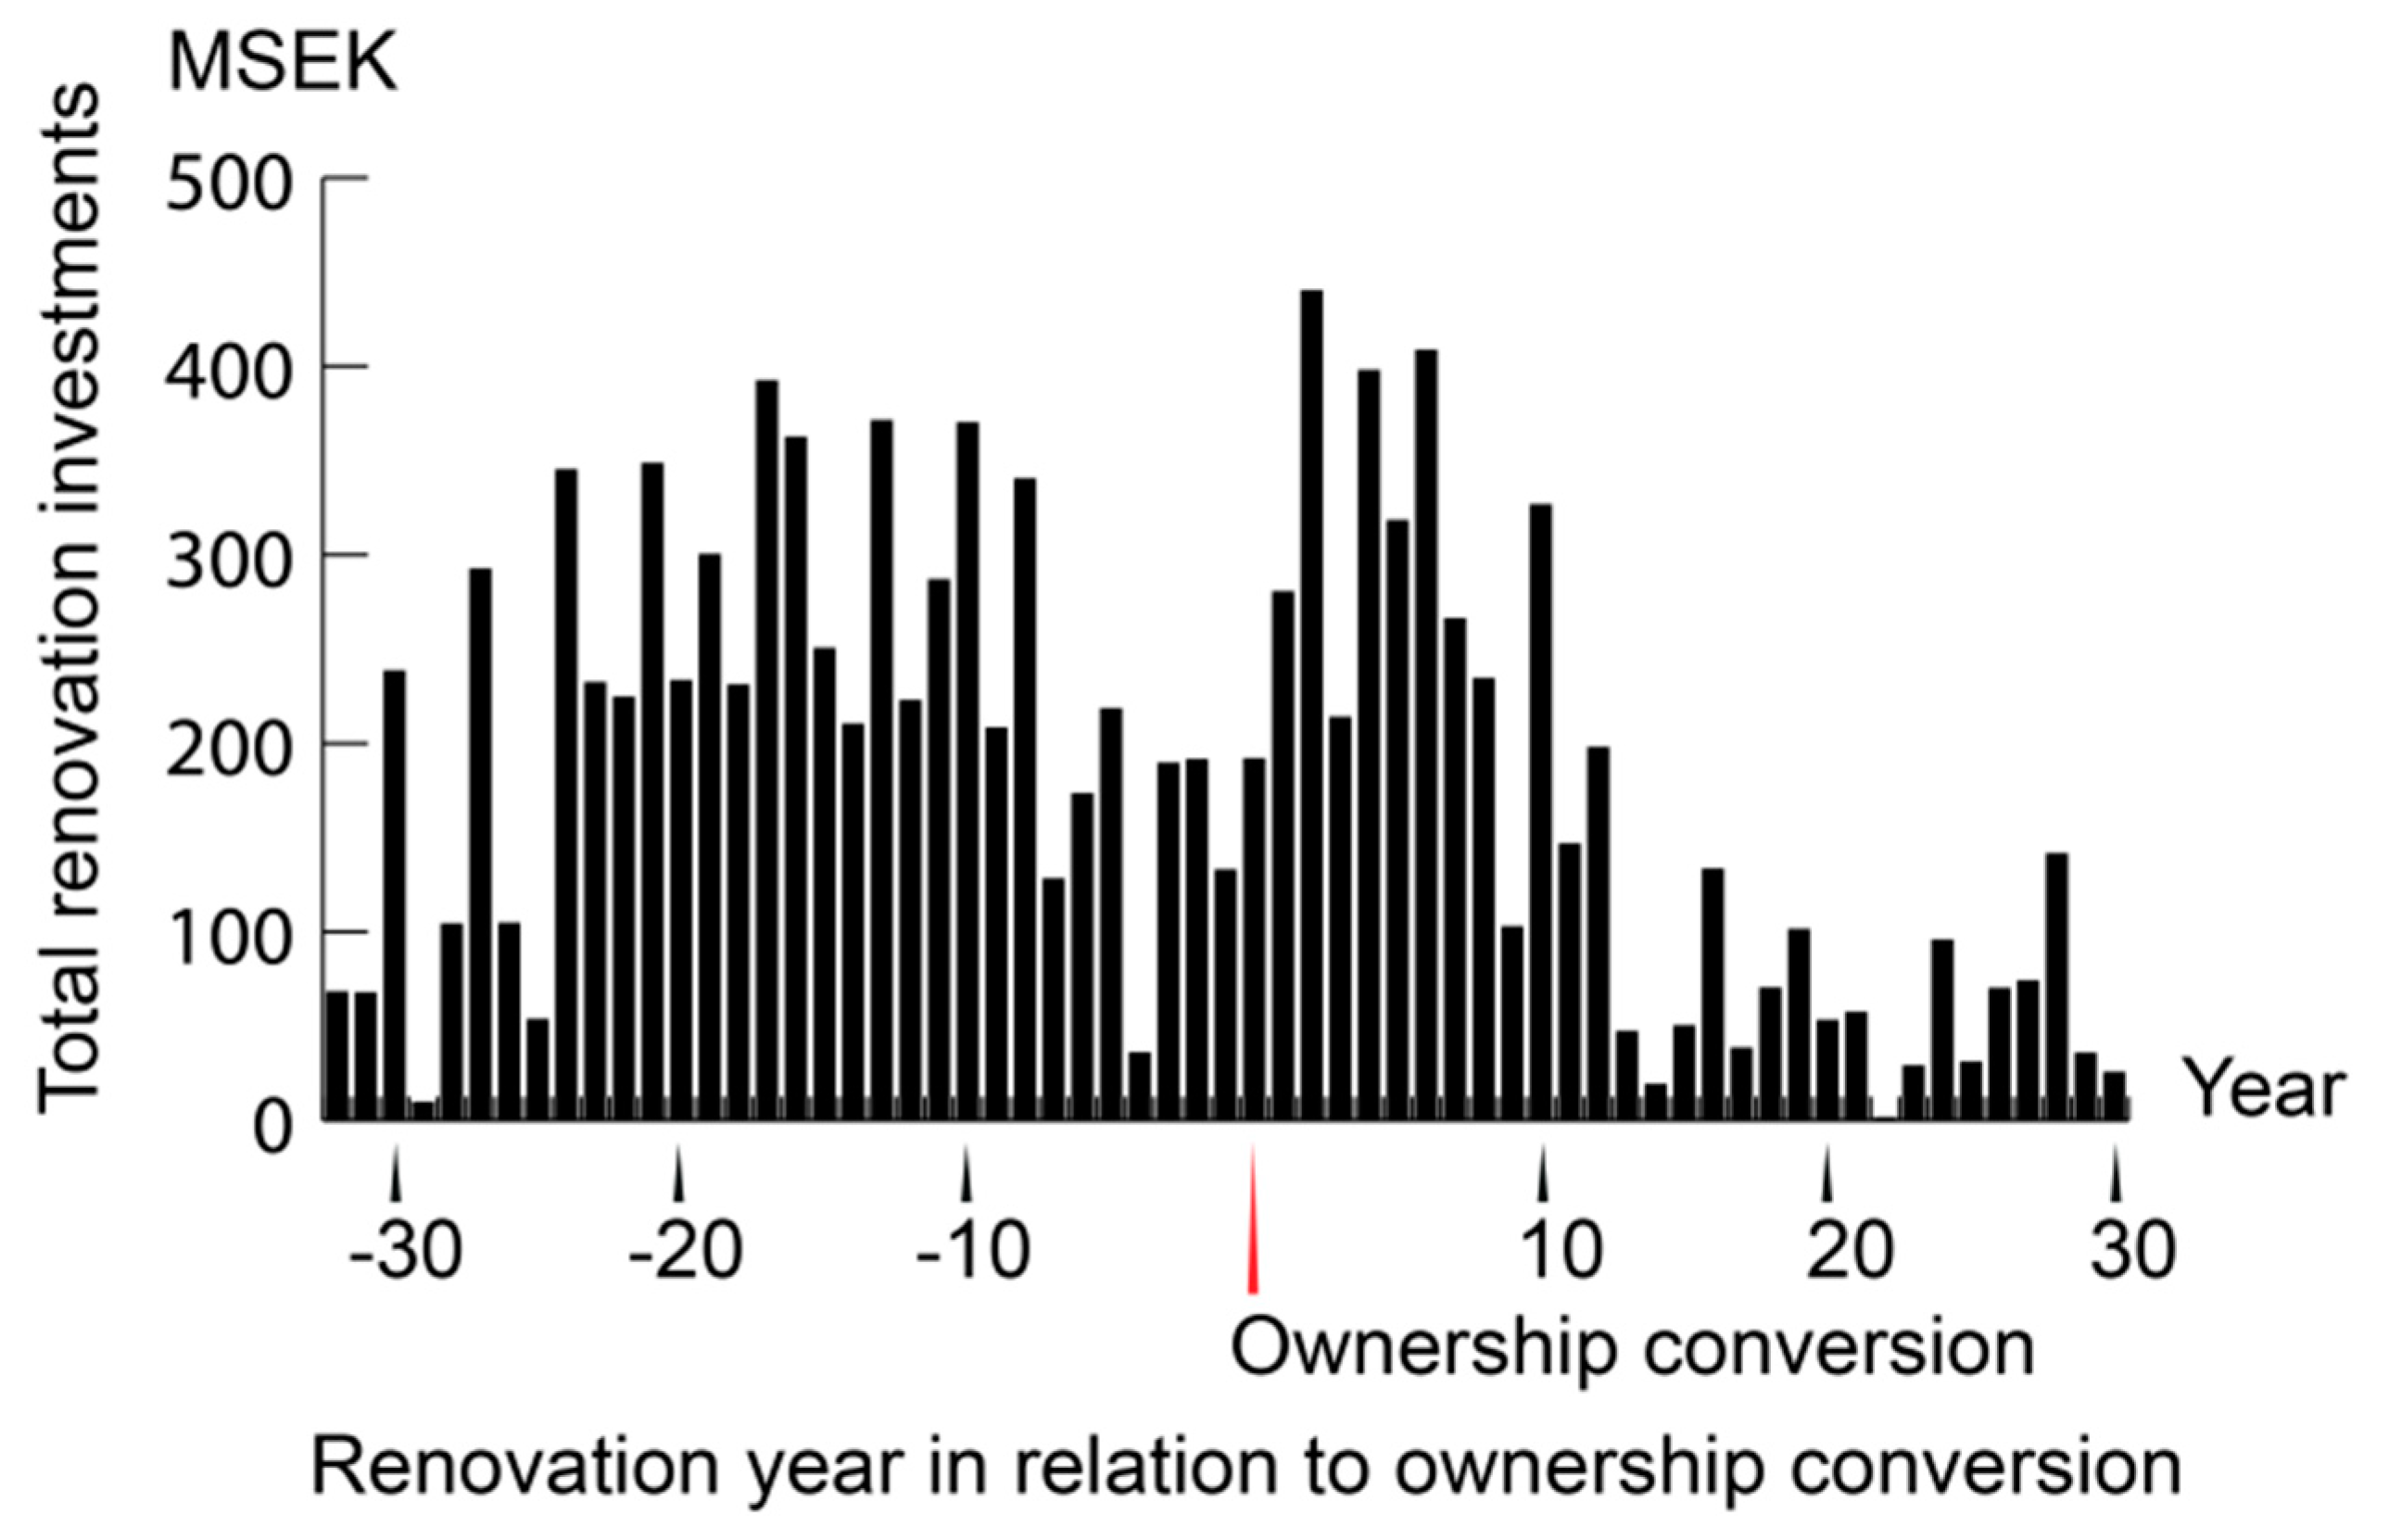
In
Figure 3, the renovation costs in relation to conversion to resident ownership have been illustrated. Right after the conversion renovation projects are the most frequent. Fewer buildings were renovated and then converted. In connection with the analysis of shared ownership (such as resident owned buildings) it was hypothesized that larger multi-family dwellings would be less renovated. However, a separation of the building stock in regard to building heated floor area did not show any significant relationship between resident owned buildings’ size and renovation cost.
Regression Results
The coefficients in
Table 4 mostly reflect expected patterns in the building stock of Gothenburg. This is a promising result for the later analysis of changes in energy usage connect using the same methods for the national building stock in 2019. However, there are also some important considerations to be made when applying these methods.
Models 3 and 4 explain variance in energy performance including and excluding heating for domestic hot water. This separation is important to make in order to understand why municipally owned multi-family dwellings have worse energy performance registered in the EPC than other ownership groups.
More costly renovations have resulted in lower energy usage, but buildings that have been renovated during the last decades have a higher energy usage when accounting for current heating system, ownership, and resident socio-economic background. As seen in
Table 4, parts of the variance in energy performance are explainable by variables describing the energy systems of the buildings. The types of energy systems also differ between the ownership groups, as seen in
Table 5. This should also be considered when comparing the energy performance of the different ownership groups. The group heat pump stands out in the regression analysis because the energy supplied to the heat pump is recorded in the EPC, and not the energy provided by the heat pump to the building. Installation of ventilation with heat recovery and changing heating systems from electricity or boilers to heat pumps or district heating have been registered as renovations. Buildings constructed after the 1975 and after the oil crises were built with better energy performance.
Table 5 also illustrates how different ownership results in different types of energy savings measures. Installing heat pumps have been a profitable energy savings measure for especially private persons and residents owning their buildings. The price of district heating is close to the price of electric heating directly which incentivizes building owners to install heat pump. However, for municipal housing companies, buying district heat from waste heat and more carbon-neutral heating distributed by the municipal energy company is the most prevalent solution. Other commonly used energy savings measures in Sweden have been roof insulation, ventilation heat recovery, wall insulation, replacement of windows, and balcony heat bridge mitigation.
Table 4 also illustrates that municipally owned real estate companies make most of the larger investments in renovations. Fewer renovations are registered for resident owned buildings. Contributing factors to this pattern are that: parts of the renovations cost are shifted from the building owner to the apartment owner, ownership of the apartment reduces needs of maintenance, it is more difficult to agree on larger investments in larger groups of owners, HSB and Riksbyggen sell maintenance services which reduce the need for more costly renovations, and finally one unverified interpretation is that buildings built by HSB and Riksbyggen are in larger need of renovations.
Multi-family dwellings in base areas inhabited by economically disadvantaged people have a worse energy performance and fewer renovations have been made in these areas. This emphasizes the importance of including affordability aspects in the sustainability analysis of renovations of multi-family dwellings.
Separate statistical analyses were also made for the buildings renovated between 2009 and 2014 (N = 485). The EPCs were issued in 2009, so for this analysis, the recorded energy performance was instead seen as a predictor of renovation. It was found that buildings with a poor energy performance were prioritized for larger renovations after 2009. The average building energy performance (excluding heating for domestic hot water) was 161 kWh/m2.year for renovation investment cost Group 3 (N = 17); compared with total average energy performance of 131 kWh/m2.year. However, it was not possible to establish a significant relationship between suggested energy saving measures and renovation extent.
For the statistical analysis of the socio-economic information, we found that using base area as a level of aggregation for socio-economic information introduces error sources and limitations for the interpretation of results. Existence of other building types made it difficult to establish clear links between number of residents in multi-family dwellings and base areas. Analyses that explain socio-economic status of areas would need to include information aggregated to the multi-family dwelling level.
5. Discussion
In this article methods of analyzing building-specific investment and energy performance have been described. The methods are intended to be used to present decision makers with analyses of developments in the multi-family dwelling stock. The interpretation of results is highly context specific and is also a political matter. Different subsidy schemes apply for the separate ownership groups and priorities in housing policy are based on political decisions.
Hsu [
34] also used comprehensive building energy usage and engineering audits and found that variance in energy performance of buildings is not sufficiently explained by building and heating system characteristics. In this article we demonstrate that variance in building energy performance can be further described when adding building ownership and area socio-economic information. Huber et al. [
20] studied the challenges of renovating and energy retrofitting multi-family dwellings in socio-economically disadvantaged areas. In this article, we find that the municipally owned real estate companies in Gothenburg are most exposed to those challenges. Trade-offs need to be made between energy usage reductions, rent increases, and increased living standards. Curtis et al. [
35] used EPC data matched with census data for the Irish building stock, and found building energy performance to be worse in buildings in socio-economically disadvantaged areas.
Michelsen et al. [
23] found that larger real estate companies outperform smaller companies in terms of extensive renovations, but that smaller companies can be better at continuous maintenance. Company size was not part of the analysis in this article. However, we would like to add that the least number of renovations were registered for private person owned rental buildings. The municipally owned real estate companies are large, and they have executed most large renovation projects.
Matschoss et al. [
17] compared energy efficiency renovations in multi-family dwellings in eight European countries with regard to building ownership, not including Sweden. They found that resident joint ownership may have internal barriers to making larger investments in energy retrofitting. In Sweden, the costs of renovating the interior of the resident owned apartments are not included in renovation cost of the entire building. Interior apartment renovations are frequent in resident owned buildings, due to the strong market development of resident owned apartments. Including these renovations costs and associated environmental impact would be necessary to make a more complete evaluation of multi-family dwelling resident ownership as a tenure type. Furthermore, other studies have shown that it is not possible to establish that energy usage cost calculations in the EPC affect the price of the resident owned apartments [
36,
37,
38,
39].
For rental apartments, the landlord–tenant problem can be a barrier to energy retrofitting and renovation [
10,
12,
13,
14]. It was difficult to isolate these aspects in the analysis of the Gothenburg multi-family dwellings. In Sweden, the real estate owner pays the heating cost. In the past decades, individual volumetric metering billing of electricity and water have been increasingly installed in rental apartments in Gothenburg [
40].
Central for the regression analyses with building energy performance as dependent was the removal of domestic hot water heating. Only a minor share of the heat in domestic hot water remains in the building after usage. Most of the heat exits the building in the waste water [
41]. Excluding heating for water usage from energy performance, which is most strongly predicted by living area per person [
33,
40], is one manner of separating the impact of user behavior. When excluding energy for heating domestic hot water, no significant association between energy performance and building ownership could be made. This finding is relevant in the context that European countries are reissuing EPCs in which more countries will include measured, instead of calculated, energy and water usage. Because of the differences in water usage between the ownership groups, there are risks that groups of multi-family dwellings that are more crowded appear as have comparatively poorer energy performances depending on how the energy performance certification with measured energy usage is implemented in European counties.
6. Conclusions
This article analyzed variance in investments in renovations and building energy performance of multi-family dwellings, based on building ownership, location and building characteristics. We found that both building ownership and socio-economic area characteristics are useful in explaining variance. Central findings are that energy used for heating domestic hot water and heating systems varies between ownership groups and that municipally owned real estate companies face challenges in the renovation of building in socio-economically disadvantaged areas. Including affordability aspects in the sustainability analyses of larger renovations in such areas is necessary since economically disadvantaged groups are overrepresented in multi-family dwellings with poor energy performance. Buildings which have had higher energy usage are overrepresented in the group of buildings having gone through larger renovations in recent years. Large renovation is a predictor of lower energy usage. However, when accounting for current heating system, ownership, and resident socio-economic background, buildings that have been renovated during the last decades have a higher energy usage.
Building ownership is context specific, but the overall renovation progress and energy performance of buildings in different types of ownership groups can be described using official and publicly accessible databases. Comprehensive building specific information, separated in ownership groups, made it possible to demonstrate the differences in renovations and building energy performance between ownership groups. Furthermore, statistical analyses of the data can be used to reinforce conclusions.
Future Studies
The EPCs were designed to be renewed every 10 years. This will make it possible to describe and explain the changes in energy usage in Sweden in 2019. These studies will investigate predictors of energy retrofitting projects and changes in socio-economic inhabitation characteristics. Ideally, casual relationships can be made between these changes and changes in building regulation and subsidy schemes. In this study, sensitive socio-economic inhabitant information should be aggregated to the multi-family dwelling level during the time of the two waves of EPCs.
In this article, information about the Gothenburg multi-family dwelling stock has been studied. Johansson et al. [
42] also used the information sources described in this paper to develop methods for connecting the entire Swedish national databases. This will make it possible to provide decision support to the national authorities which are responsible for building regulation and subsidy schemes.
Adding building-specific energy models would enable comprehensive strategic advice for building owners [
43,
44]. Using the records of renovation cost and energy performance linked with scenarios will make it possible to point out which building owners should be in line for energy retrofitting.


