Article

Climate Change Perceptions and Observations of Agricultural Stakeholders in the Northern Great Plains

1
Department of Cell Biology and Neuroscience, Montana State University, Bozeman, MT 59717-3148, USA
2
The Food and Health Lab, Sustainable Food Systems Program, Department of Health and Human Development, Montana State University, Bozeman, MT 59717-3540, USA
3
Department of Sociology and Anthropology, Montana State University, Bozeman, MT 59717-2380, USA
4
Western Agricultural Research Center, Montana State University, Corvalis, MT 59828, USA
5
Department of Land Resources and Environmental Sciences, Montana State University, Bozeman, MT 59717-3120, USA
*
Author to whom correspondence should be addressed.
Sustainability 2018, 10(5), 1687; https://0-doi-org.brum.beds.ac.uk/10.3390/su10051687
Submission received: 25 April 2018 / Revised: 18 May 2018 / Accepted: 19 May 2018 / Published: 22 May 2018

Abstract

:
This study explored whether Montana agricultural stakeholders’ perceptions and observations of climate change vary according to four socio-ecological variables: income, political view, agricultural occupation, and production region. A survey including 27 questions was developed into five sections: (1) agricultural background information; (2) perceptions about climate change; (3) observed changes in climate-related variables; (4) adaptation practices and strategies; and (5) demographic information. The survey included Likert-scored responses and multiple-choice questions, and was completed by 452 participants, including conventional and organic farmers and ranchers, extension agents, crop consultants, and researchers. The results indicate that while a notable fraction of agricultural stakeholders are alarmed about climate change and optimistic about the human capacity to reduce climate change, the degree of concern and optimism significantly varies depending on the stakeholder’s political views, production region, and agricultural occupation group. We found that observations of changes in climate, perceptions about climate change, and potential risks to agricultural production are driven mainly by political views. Both perceptions and observations drive the choice of adaptation and mitigation practices. It is thus essential to understand farmers’ socio-ecological characteristics when designing agricultural outreach programs in order to reduce barriers for the adoption of climate-resilient agriculture.

1. Introduction

Climate change threatens agricultural sustainability and the ability of food systems to provide adequate nutrition for a growing population. While agriculture affects climate, it is also impacted by its changes [1,2] in a cycle that frequently amplifies negative impacts through decreased agricultural production, the disruption of food supply chains, increased food prices, and reduced food quality [3]. In response to these challenges, efforts are being implemented to promote climate resilient agriculture, i.e., systems that are able to cope with or rebound from climate disturbances to a pre-disturbed state [4]. Examples of agricultural strategies to increase climate resiliency include agricultural diversification including mixed crop-livestock systems, varietal substitution, changing harvest calendars, no-tillage management, integrated pest management, and precision agriculture [5].
Climate change has profound implications for the sustainability of United States (U.S.) agriculture, particularly in the semi-arid environments of the Northern Great Plains. In this region, unprecedented warming trends and changes in precipitation patterns [6] pose multiple opportunities and challenges to the well-being of farmers and the provision of ecosystem services, including food and fiber production [7]. While areas of the Northern Great Plains that experience increased precipitation could benefit from enhanced yields, depending on the timing and severity of precipitation events [8], the risk of drought and heat stress are augmented in areas where increased temperatures and reduced moisture co-occur. For example, in addition to a reduction in spring wheat yield, which is a staple crop in the region, increased temperatures have been associated with a decrease in grain volume weight [9] and a reduction in grain protein concentration [10]. These challenges are further enhanced due to barriers of implementing mitigation and adaptation strategies, including increased production costs [11] as well as a lack of farmer buy-in regarding the need for a climate resilient agriculture.
It is increasingly recognized that in order to promote climate-resilient agriculture, including implementing climate mitigation and adaptation strategies, farmers and other agricultural stakeholders must first perceive climate change and its impacts in their agricultural systems [12,13]. Despite the scientific consensus regarding the human influence on the climate trends observed over the past century [14], there is considerable debate among those in the agricultural sector, as well as the general public, about the reality, extent, and causes of these changes. In the United States, 63% of Americans agree that global warming is happening, but county-level estimates range between 43–80% [15]. For example, in rural Idaho, most farmers acknowledge observing changes in precipitation patterns as well as increases in growing season length and temperatures, but fail to relate these patterns to long-term global climate change [16]. In addition, many agricultural producers in the United States disagree that climate change has been scientifically proven [17,18,19], or reject the link between anthropogenic activities and climate change [20]. The lack of consensus regarding causes, attitudes, and perceptions of changes in climate is driven by multiple social variables, such as political, psychological, and cultural practices. These variables are associated with differences in how people relate to the natural environment, including their agricultural practices. Ultimately, these disagreements hinder the successful outcomes of science-based interventions and outreach activities related to climate change mitigation and/or adaptation [21], and the move toward climate resilient agriculture that supports sustainable food systems.
Previous studies conducted in the United States regarding agricultural producers’ perceptions, concerns, and attitudes toward climate change have been conducted in the Midwest [2,20,22], southeast [23,24], and northeast [25,26] regions. However, to our knowledge, no systematic study has been published across the Northern Great Plains region, which is one of the largest expanses of small grain, pulse, and oilseed agriculture, as well as low-intensity livestock production [16]. As a semi-arid area, the Northern Great Plains region is regarded a high-risk region for climate change. With a continental climate characterized by long and cold winters, short and dry summers, large diurnal ranges in temperature, strong winds, high evapotranspiration, and variable and unpredictable precipitation [27], this region’s agriculture is highly sensitive to changes in climatic conditions. In particular, in the driest sections of the Northern Great Plains, crops usually undergo terminal drought after anthesis, which reduces yield and quality [28]. Temperature projections in the Northern Great Plains indicate that evapotranspiration constraints in midsummer will increase [29], further threatening the sustainability of the agricultural enterprise. As a result, this region will be one of four global vulnerability regions for water availability by 2030, where water withdrawals could exceed 40% of resources [30].
As one of the driest and coldest part of the Northern Great Plains, Montana is a compelling case for assessing agricultural stakeholders’ (i.e., farmers, ranchers, county extension agents, and agricultural researchers) perceptions and observations regarding climate change. Montana is home to over 27,000 farms and ranches on over 2.38 × 10⁷ hectares. Its diverse climate supports a range of high-quality food products, including beef, small grains, hay, legume crops, potatoes, sugar beets, oilseed crops, and small fruits [31]. During the 20th century, Montana experienced an overall increase in temperatures, the number of frost-free days, and the number of days with temperatures above 32.2 °C [7,32]. While precipitations have increased in the northeast (NE) region of the state during the last century, there has been a decrease in precipitation across the central and western sections of the state [29]. Climate projections for Montana indicate that by the end of the 21st century, temperatures will further rise between 2.5–3.3 °C, depending on the greenhouse emission scenario; this increase will be observed in all of the geographic locations and seasons. Models also predict a decrease in precipitation during the summer months [7].
It is important to understand farmers’ attitudes and perceptions regarding climate change, as farmers must first perceive and have knowledge of the causes for the changes in climate and their impact on agricultural systems in order to effectively adapt and have the motivation to do so [12]. The goal of this study was to document the beliefs about the causes and risks (hereafter “perceptions”), observations, and priorities of agricultural stakeholders in Montana regarding climate change by addressing the following research questions: (1) What are Montana’s agricultural stakeholders’ perceptions and observations regarding climate change and its impact on agriculture? (2) Do climate change perceptions and observations vary among agricultural stakeholders, and what demographic factors and socio-ecological characteristics (e.g., political ideologies, income, occupation, and production region) account for this variability? Findings from this study are expected to inform outreach and extension programs regarding climate change and climate-resilient agriculture. Additionally, findings have the potential to elucidate specific demographic factors that may present barriers or opportunities to adopting mitigation and adaptation strategies that support sustainable and resilient agriculture.

2. Materials and Methods

2.1. Survey Development

A structured survey was utilized to assess perceptions (e.g., beliefs and opinions) and observations regarding climate change of agricultural stakeholders. The survey items addressed stakeholders perceptions—including attitudes toward climate change, concerns about the impact of climate change on agricultural production, causes, and seriousness of climate change in time—and observations of changes in climate variables that relate to agricultural production, such as temperature, temperature extremes, length of growing season, and water availability. Demographic information about stakeholders’ agricultural occupation, political views, production region, annual income, and age was also collected.
The survey used in this study was based on previous surveys [5,33], but new items were incorporated or adapted to reflect the socio-ecological factors and practices of the Northern Great Plains stakeholders. The refining process included a two-step process. First, the face validity of the first draft survey was established by a panel of five field experts in agriculture, global change sciences, and sociology. In addition, the survey was pre-tested with 40 participants for further revisions. The resulting survey had a total of 27 questions and was divided into five sections: (1) agricultural background information; (2) perceptions about climate change; (3) observed changes in climate-related variables; (4) adaptation practices and strategies; and (5) demographic information. The survey included Likert-scored responses to address issues of perceptions, and multiple-choice questions for observations of changes in climate variables, mitigation and adaption strategies, and demographic factors.

Human Subject’s Approval

We received the approval of human subjects to participate in this study by the Institutional Review Board (IRB) at Montana State University before administering surveys. Informed consent was obtained from all of the study participants following IRB guidelines before taking the survey.

2.2. Survey Administration

The survey instrument was administered in person in eight agriculture extension meetings that were held across Montana, as well as online. Links to the online survey were posted on the websites of the Montana Farmers Union and the Montana Agro Business Association, and circulated through the listserve of the Montana Organic Association. Although respondents do not represent a truly random sample, it is expected that coverage and non-response error were reduced through the multi-modal nature of the survey, and the extensive network reached through stakeholder organizations and Montana State University’s Extension Service [34]. A total of 452 completed surveys were received between December 2015 and July 2016. However, not all of the participants answered all of the survey questions, so the sample size varied among survey items.

2.3. Survey Sample

The total sample was divided into demographic groups based on participants’ self-reported agricultural occupation group (hereafter agricultural group), production region, annual income, political view, and age (see Table 1). The agricultural group variable included seven categories: (1) Extension specialists; (2) crop consultants; (3) university participants—researchers and students; (4) conventional small grain producers (designated as grain); (5) conventional small grain farmers and ranchers (grain rancher); (6) organic grain and vegetable producers (organic); and (7) ranchers. Seven production regions were considered: (1) north central, where primarily small grains are grown; (2) northeast, where pulse and oil seed crops are grown; (3) central, a region dominated by small grains, vegetables, and ranching; (4) western, characterized by primarily ranching, and fruit and vegetable production; (5) northwest, dominated by small grain and fruit production; (6) southwest, with potatoes, small grain, and ranching production; and (7) southeast, with primarily sugar beets and small grains production. The respondents were grouped into three self-identified political view categories: (1) liberal; (2) moderate; and (3) conservative; and three annual income groups: less than $39,999 year−1 (low income), incomes greater than $40,000 year−1 but less than $99,999 year−1 (medium income), and incomes greater than $100,000 year−1 (high income). Finally, we considered four age range categories: (1) 26 years old or younger; (2) 27 to 40 years old; (3) 41 to 67 years old; and (4) 68 years old or older. The distributions of the survey participants in the aforementioned categories are described in Table 1. Race was not included in the analyses, as the sample included mostly white (79%), and gender was also omitted because it was skewed toward males (64%), with 24% females, 11% no response, and 1% other.
To answer the aforementioned research questions, we conducted descriptive, comparative, correlational, and predictive statistics analyses. Descriptive analyses included frequency distributions, means, and standard deviations of attitudes and perceptions on climate change and impacts according to agricultural group, region, political view, income, and age. To estimate differences in the mean values of variable distributions, we performed non-parametric comparative analyses among groups for each perception variable utilizing the Kruskal–Wallis H-test. If differences were observed (p < 0.05), we performed pairwise group comparisons using Dunn’s (1964) [35] procedure with a Bonferroni correction for multiple comparisons, ( n 2 ) , with n being the number of categories of a demographic variable. Correlation analyses between perceptions and demographic variables were performed using non-parametric bivariate Spearman’s ρ and Kendall’s τb correlation tests, with the latter suitable for multinomial ordinal variables. Predictive analysis included ordinary least square test to predict the amount of variance for perception and observation variables according to the effects of region, income, age, political view, and agricultural group. Two perception variables, “main cause for climate change” and “human capability [to mitigate climate change]” were recoded to fit an ordinal scale for the correlation analysis. The main cause for climate change was recoded in a dichotomous variable (i.e., anthropogenic or other causes), while human capability was recoded in a three-point scale (i.e., 1 = not capable, 2 = uncertain, and 3 = capable). Responses that denied climate change were omitted from the correlation analyses. All of the analyses were performed using IBM® SPSS® Statistics for Windows, Version 24, Armonk, NY, USA software.

3. Results

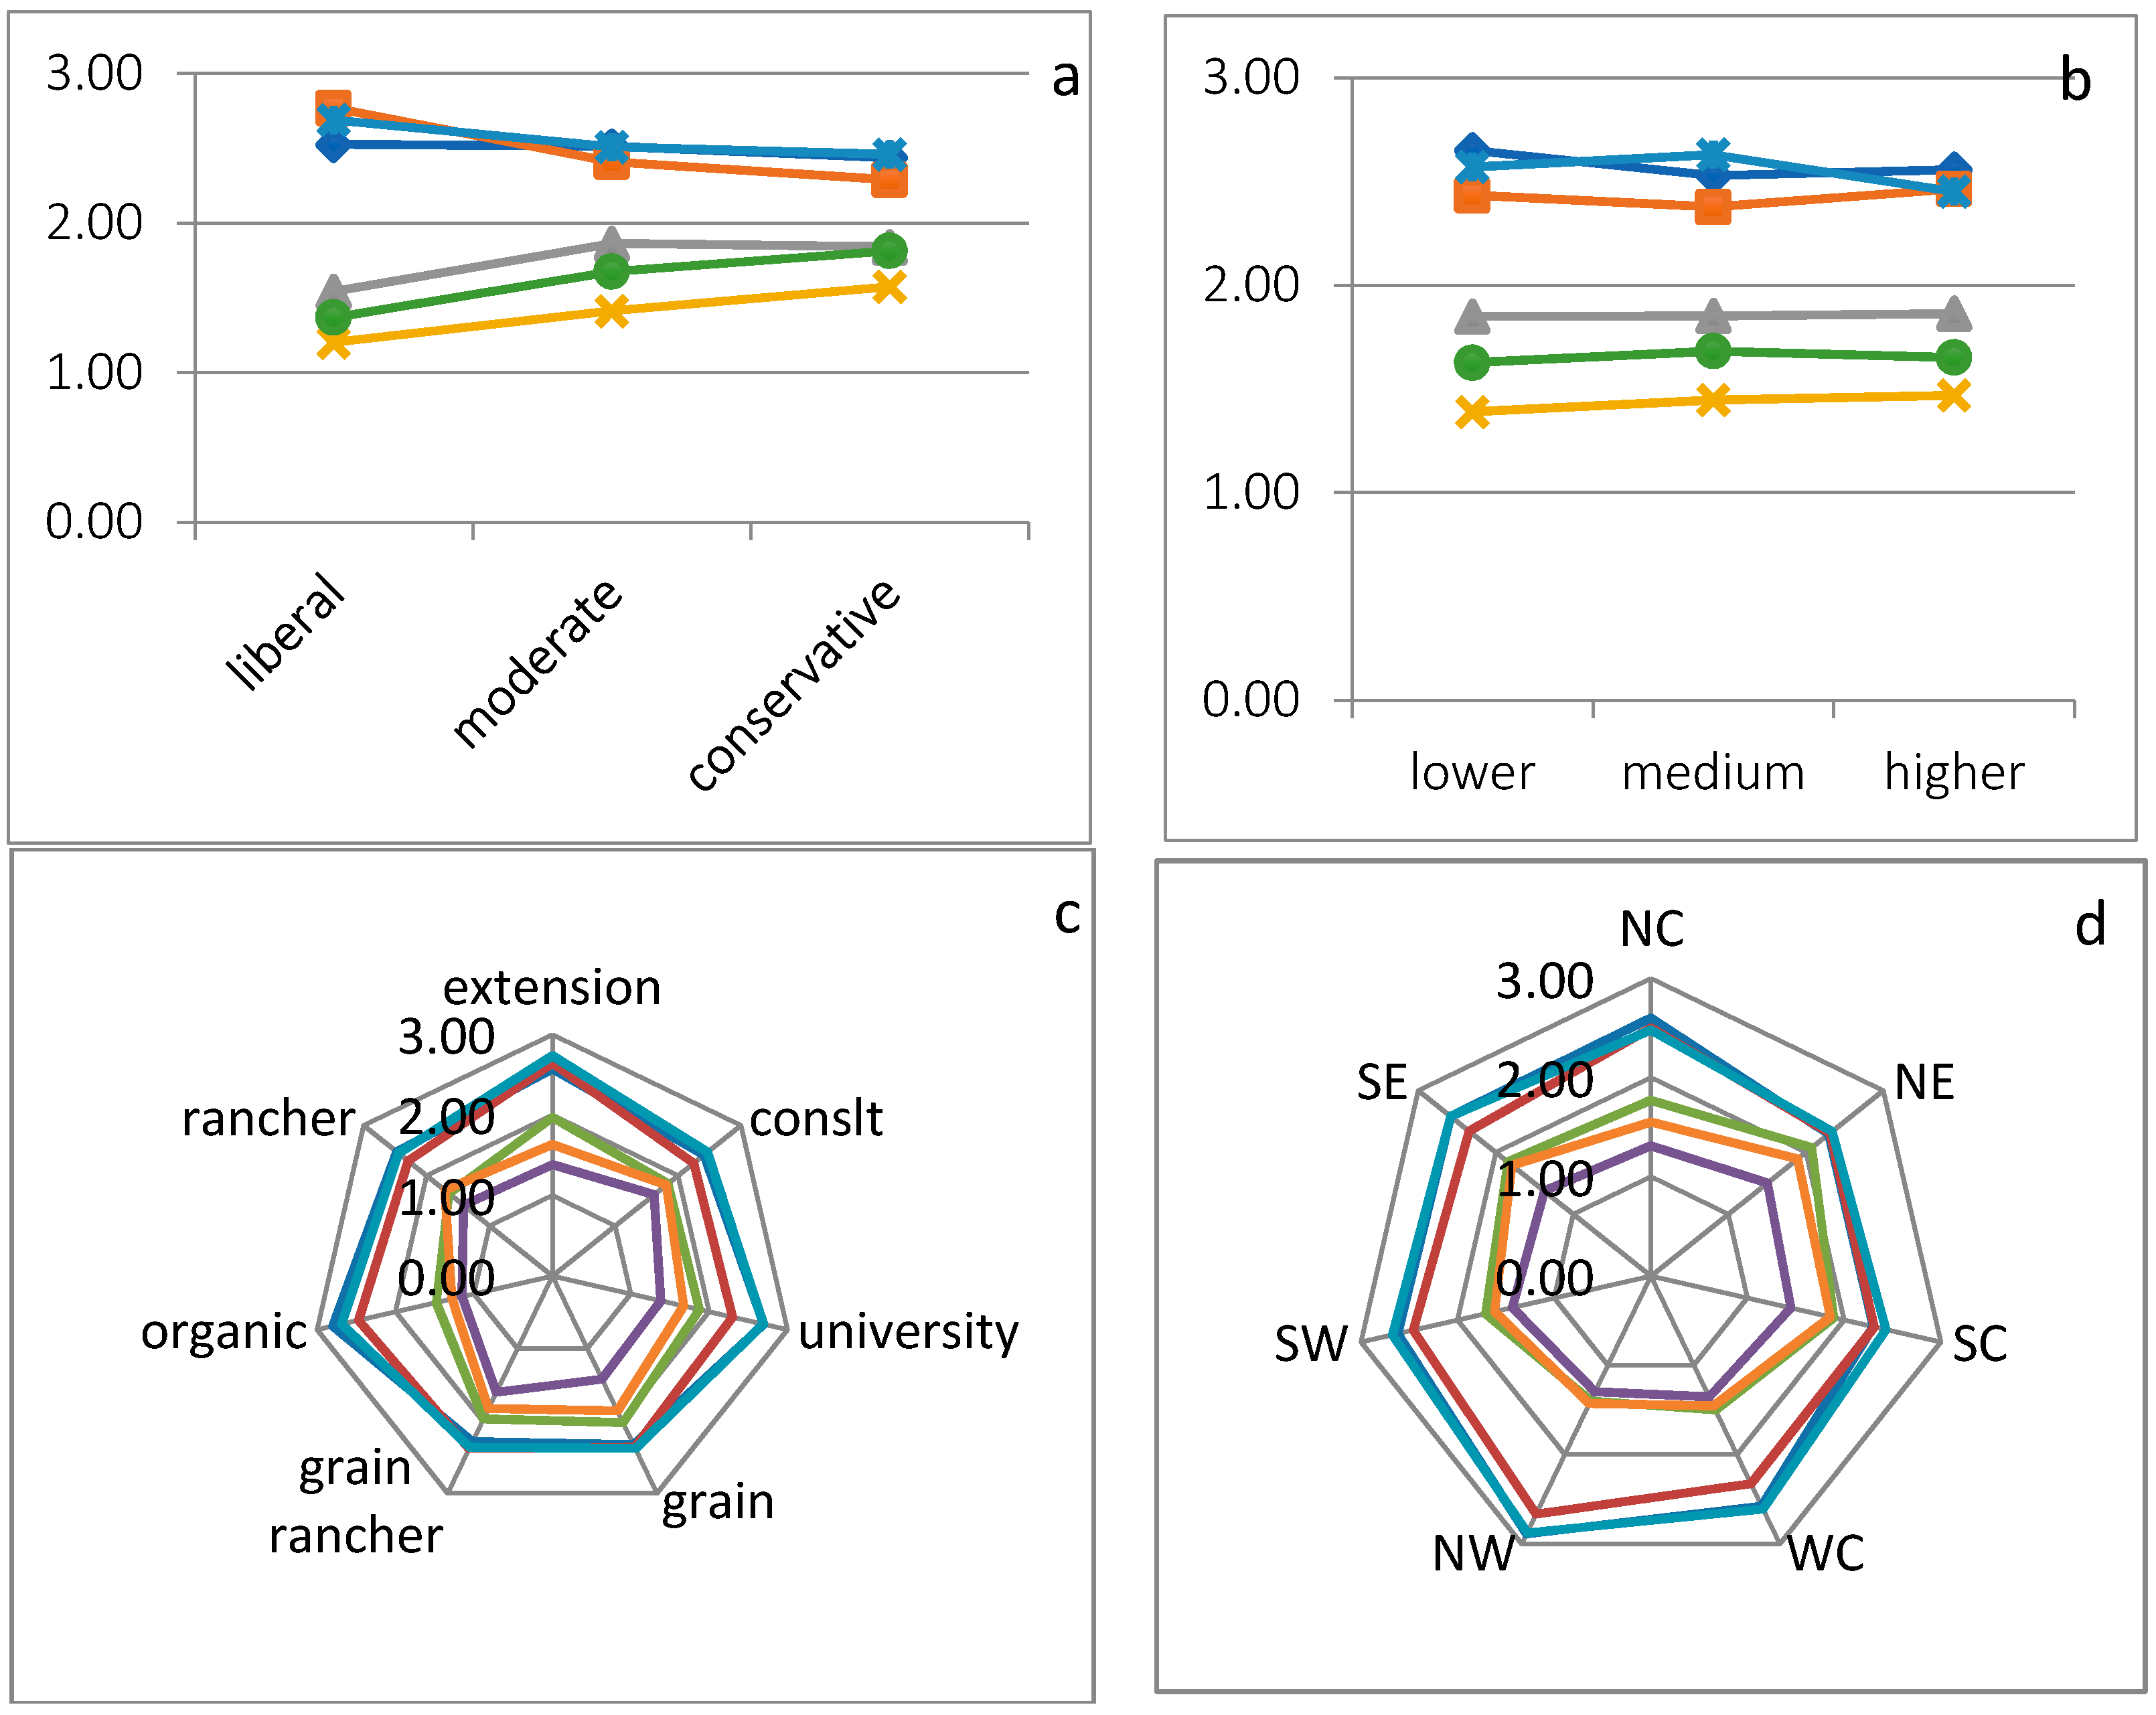
3.1. Agricultural Stakeholders Perceptions on Climate Change

The majority of respondents at least recognized the existence of climate change (86.9%, see Table 2). Nearly half of respondents (48.3%) reported being concerned or alarmed about climate change, while 86.7% reported being somewhat to very concerned about the impacts of climate change on agricultural production. Accordingly, 51.8%; of respondents recognized that climate change is a serious issue now, and will continue to be into the future (Table 2).
Perceptions regarding the causes of climate change varied among study participants. The percentage of respondents that agreed with the concept that anthropogenic activities are the principal drivers of climate change was similar to the those who considered natural causes as the main cause for climate change (36.6% and 37.4%, respectively; see Table 2). While 41.2% of respondents believed that humans are capable of reducing changes in climate, 23.7% of participants did not think that humans are capable of reducing climate changes, and 21% of participants were uncertain (Table 2). There was a strong correlation between participants who considered anthropogenic activities as the main cause of climate change and those who considered humans to have the capability to reduce climate change (correlation coefficient r = 0.58, n = 400, p < 0.01), and between the attribution of climate change to human activity and a high degree of concern about climate change (r = 0.57, n = 377, p < 0.01).
Agricultural stakeholders reported observing changes in multiple climate variables, with 42% of respondents reporting observing an increment in temperature. Similarly, 40.9% of respondents reported observing an increase in the length of the growing season, while 32.7% reported otherwise (see Table 2). A similar proportion of respondents reported observing either no change in or an increase of extreme temperature fluctuations (36.3% and 34.3%, respectively). There was a moderate correlation between the reported observations of an increase in the length of the growing season and an increase in temperature (r = 0.32, n = 297, p < 0.01); and a weak correlation between the reported observations of an increase in the length of the growing season and extreme temperature fluctuations (r = 0.14, n = 321, p < 0.01).
Participant responses concerning observed changes in precipitation and water availability were variable, with most reporting that it has continued to be relatively dry or has gotten drier. Most of the agricultural stakeholders reported that water supply and rainfall have remained the same (39.4% and 37.4%, respectively; see Table 2), while the percentage who reported observing a decline in rainfall (26.3%) and water supplies (29.2%) was about two to five times the percentage who reported observing an increase in rainfall and water supplies. Nearly half (48.2%) of the respondents reported observing a decrease in snowfall during their time in the agricultural sector in Montana, while 25.2% reported no change. Findings show a moderate correlation between reported observations of changes in snowfall and changes in rainfall (r = 0.40, n = 336, p < 0.01).

3.2. Comparison of Perceptions by Demographic Group

Comparisons of stakeholder perceptions toward climate change according to three demographic variables are presented in Figure 1, including political views (ranging from liberal to conservative; Figure 1a), production region (Figure 1b), and agricultural group (Figure 1c). The polygons’ vertices of the radar graphs in Figure 1 correspond to response mean-values. These graphs allow a quick estimation of differences in perceptions between demographic categories; for example, the more irregular the polygon, the higher the variation of the mean values among the demographic categories.
The significance of the differences in perceptions according to groups of socio-ecological factors was obtained from non-parametric comparative analyses of the perception variables of the following demographic groups: political view, region, agricultural group, income, and age. Results for income and age are not included here (Table 3), because the distributions of the climate perception variables were not significantly different across the categories of income and age. Comparisons of perceptions of climate according to political view categories indicated that agricultural stakeholders with conservative views were less alarmed by the impact of climate change and its seriousness over time, and less confident in the capability of humans to reduce changes in climate when compared with the perceptions of participants with more liberal political views. Participants with liberal views were significantly more likely to be alarmed about climate change and see it as a serious issue in the present and future compared with moderates and conservatives (χ2 statistics and difference in mean values of perceptions are shown in Table 3). Liberals were significantly more likely to be concerned about the impact of climate change on agricultural production than conservatives, and they were more optimistic of humans’ capability to reduce the changes in climate than moderates and conservatives.
Significant differences in some perceptions related to climate change were found among production regions (χ2 statistics and difference in mean values of perceptions are shown in Table 3). It is noteworthy that stakeholders from all of the regions were similarly concerned regarding the impact of climate change on agricultural production and the seriousness of changes in climate over time. The average level of concern about the impact of climate change on agricultural production was “somewhat concerned”, with 2.21 out of a scale of 3; while the average perception about the seriousness of climate change in time was that it will be serious in the lifetime of next generations, with 3.17 out of a scale of 4.
Levels of alarm about climate change and belief in human capacity to reduce its impacts varied among regions, with the western regions being more concerned than the eastern regions (see Table 3). Participants from the southwest region (production of potatoes, small grain, and ranching) were more likely to be alarmed about climate change than participants from northeast (pulse and oil seed crops), central (small grain, vegetables, and ranching) and southeast (sugar beets and small grain), but were less likely to be alarmed than participants from the northwest region (small grain and fruit production). Additionally, participants from the western region (ranching, fruit, and vegetables) were more likely to be alarmed than participants from the northeast. Survey participants from Montana’s northeast region were less optimistic about the capability of humans to reduce changes in climate than participants from the western and southwest regions (see Table 3).
Significant differences in respondents’ attitudes towards climate change (Figure 1b) were found among production regions (χ2 statistics and difference in mean values of perceptions are shown in Table 3). While perceptions about the capability of humans to reduce climate change were similar for stakeholders of different regions, as depicted by the almost regular polygon in Figure 1b, its low variability was accounted by significant differences of only two region pairs (Table 3).
Differences in responses related to attitudes towards climate change, the seriousness of climate change over time, and the capability of humans to reduce the changes in climate were found for participants of different agricultural group categories (χ2 statistics and difference in the mean values of perceptions are shown in Table 3). Organic farmers and university participants (researchers and students) were more likely to be alarmed about climate change than crop consultants, grain growers–ranchers, and ranchers. Additionally, university participants were more likely to be concerned about climate change than extension agents. Organic producers were more likely to be concerned about climate change than traditional grain growers. Organic producers and extension agents perceived climate change as being a serious issue in the present and future to a greater extent than traditional grain growers and ranchers. Organic producers and university participants were more likely to be optimistic about the capability of humans to reduce changes in climate than grain growers and grain grower–ranchers. Organic producers had the highest mean value for alarmed attitude toward climate change as well as perceptions of seriousness of climate change over time, while they were also the most optimistic group regarding human capability to reduce climate change. Extension agents were the group that most considered climate change a serious issue over time compared with the other groups. It is noteworthy that no significant differences regarding concerns of the impact of climate change on agricultural production were found based on agricultural group. The average level of concern about the impact of climate change on agricultural production was high: 2.97 out of a scale of 3.
A multiple regression (ordinary least squares, or OLS) was run to predict “attitudes” [alarmed attitudes towards climate change], “concern” [of the impact of climate change on agricultural production], “seriousness” [of climate change over time], and “human capability” [to mitigate the effects of climate change] according to political view, region, agricultural group, income, and age. The regression model predicted “attitudes”, F(16,236) = 11.078, p < 0.0005, adjusted R2 = 0.39; with political view and region (south central region with production of small grain and vegetables, and northeast with production of pulse and oil seeds) added statistically significant coefficients to the predictive model (see Table 4). The model that best predicted “concern” included three socio-ecological independent variables: region, income, and political view, F(8290) = 2.127, p = 0.033, adjusted R2 = 0.029; only political view added a statistically significant coefficient to the predictive model (see Table 4). The regression model predicted “seriousness”, F(16,221) = 2.364, p < 0.003, adjusted R2 = 0.084; only political view added a statistically significant coefficient to the predictive model (see Table 4). The regression model predicted “capability”, F(16,233) = 3.913, p < 0.0005, adjusted R2 = 0.158; political view and region (south central region with production of small grain and veggies) added statistically significant coefficients to the predictive model (see Table 4). Regression coefficients and standard errors are reported in Table 4 below.
Based on the multiple regression models, an increase of one degree in liberal political view produces a 0.48 increment in the amount of alarmed attitude towards climate change, a 0.17 increment in the amount of concern about the impacts of climate change on agricultural production, a 0.26 increment on the notion that climate change always will be serious, and a 0.31 increment on the idea that humans have the capability to mitigate the effects of climate change. Stakeholders from the northeast and south central regions demonstrated a decrease in alarmed attitudes about climate change by a factor of 0.19 and 0.16, respectively. Additionally, south central stakeholders are less confident that humans can mitigate the effects of climate change by a factor of 0.17. Categories of the other socio-ecological variables such as income, age, and agricultural group did not add to the regression models of the perception variables.

3.3. Comparisons of Observations by Demographic Factor Group

Comparisons of participant observations of climate variables (length of the growing season, temperature increase, extreme temperature fluctuations, rainfall, snowfall, and water supply) by demographic categories of political view, income, agricultural group, and production region, are presented in Figure 2a–d, respectively. Observations of these variables significantly differed among demographic categories, as is shown by the results of non-parametric comparative analyses (Table 4).
According to survey respondents’ political views (Figure 2a), observations of changes in temperature, extreme temperature fluctuations, and length of the growing season decreased with increasing conservative views. At the same time, the mean values for observations of changes in rainfall, snowfall, and water supply increased with conservative political views. Respondents with liberal political views were more likely than participants with conservative views to observe an increase in the length of the growing season and extreme temperature fluctuations, and a decline in snowfall and water supply. Liberal participants were also more likely than moderates to report an increase in temperature and extreme temperature fluctuations, and a decline in rainfall and water supply (χ2 statistics and differences in the mean values of observation variables are shown in Table 5).
Responses of stakeholders from different production regions are similar for observations of temperature increase, but differ for observations in changes in the length of the growing season (Figure 2b). The response mean value distributions by production region are irregular and similar for observed changes in rainfall and the availability of the water supply (Figure 2b). Stakeholders of the central region observed an increase in the growing season to a greater extent than stakeholders from the north central, northeast, west, and southeast regions (Table 5). Respondents in the northeast were more likely to report an increase in rainfall and a decrease in water supply than stakeholders from the western and southwestern regions. Participants from the southwest region were less likely than those in the central region to report a decrease in the water supply. No significant differences between regions were found for observations of extreme temperature fluctuations and snowfall (see Table 5).
Participants from different agricultural group categories reported different observations of some climate-related variables. The mean value of observations of temperature increase is similar among categories, with the exception of organic producers and university participants, who reported an increase in temperature more than the other groups did (Figure 2b). Organic producers were significantly more likely than traditional grain growers and grain growers–ranchers to observe an increase in temperature, and university participants were also significantly more likely than grain growers to report an increase in temperature (Table 5). Similarly, organic producers observed a decrease in rainfall, snowfall, and water supply to a greater extent than other agricultural groups (Figure 2b). Organic producers were significantly more likely to report a decline in rainfall than traditional grain growers, grain growers–ranchers, and extension agents. Traditional grain growers were also significantly more likely than ranchers to see a decline in rainfall. Organic producers were more likely than consultants and grain growers–ranchers to report a decline in snowfall, and more likely than grain growers, grain growers–ranchers, ranchers, and consultants to report a decline in the water supply (χ2 statistics and difference in mean values of the observation variables are shown in Table 5).
Mean values of observations of changes in the length of the growing season decrease with stakeholder income, with a higher difference between low and medium-income stakeholders than for medium and high income (Figure 2d). However, reported observations of changes in temperature, extreme temperature fluctuations, rainfall, snowfall, and water supply were similar among income categories (Table 5).
A multiple regression (OLS) was run to predict “temperature” [change], “warm days” [number of warm days], “rainfall”, and “Extreme-temperature” [extreme temperature fluctuations], according to political view, region, agricultural group, income, and age. The regression model statistically significantly predicted “temperature”, F(16,183) = 2.827, p < 0.0005, adjusted R2 = 0.128; with political view, region (north central region with production of small grain, and southeast with production of beets and potatoes), and agricultural group (crop consultant and small grain traditional producer) added significantly statistically coefficients to the predictive model (see Table 6). The regression model “warm days”, F(16,186) = 2.529, p = 0.002, adjusted R2 = 0.108; with political view and region (northeast region with production of pulse and oil seeds, and south central with production of small grain and vegetables) added statistically significant coefficients to the predictive model (see Table 6). The regression model predicted “rainfall”, F(16,179) = 3.025, p < 0.0005, adjusted R2 = 0.142; with age, region (north central region with production of small grain, west central with production of fruits and vegetables, northwest with production of small fruits, and southwest with production of ranching, potatoes, and small grain) added statistically significant coefficients to the predictive model (see Table 6). The regression model for “Extreme-temperature” that resulted statistically significant included all of the aforementioned socio-ecological variables but age; F(16,223) = 2.369, p = 0.003, adjusted R2 = 0.079; with political view and agricultural group (crop consultant and rancher) added statistically significant coefficients to the predictive model (see Table 6). Regression coefficients and standard errors are reported in Table 6 below.
Based on the multiple regression models, an increase of one degree in liberal political view produced an increment in the observation of temperature change by a factor of 0.14, a 0.25 increment in the observation of number of warm days, and a 0.25 increment in the observation of extreme temperature fluctuations. Stakeholders from the north central region increased the tendency to observe a temperature change by a factor 0.20, and a decrease in rainfall by a factor of 0.20. Similarly, stakeholders from the north central, northwest, and southwest regions decreased the observations of rainfall by a factor of 0.22, 0.15, and 0.17, respectively. Additionally, southeast stakeholders increased the observation of a change in temperature by a factor of 0.15. Crop consultants decreased the observation of changes in temperature and extreme temperature fluctuations by a factor of 0.22 and 0.16, respectively; while small grain producers reduced the observation of temperature change by a factor of 0.28. Finally, older people decreased the observation of rainfall by a 0.19 factor. Categories of the income variable did not add to the regression models of the observation variables.

4. Discussion and Conclusions

Understanding climate perceptions and the observations of agricultural stakeholders is critical in designing effective outreach on climate resilient agriculture. This study demonstrates that the majority of Montana’s agricultural stakeholders who participated in this survey acknowledged the existence of climate change, yet there is disagreement regarding its causes, as well as a lack of consensus of observations on changes in climate variables. This variation can be accounted on the basis of stakeholders’ demographic characteristics, pointing to the importance of considering stakeholders’ characteristics when designing agricultural outreach programs to facilitate the adoption of climate resilient agricultural practices.
Findings from this study are in agreement with previous results that show that the majority of agricultural stakeholders in various regions of the United States recognize the existence of climate change [36], which is in agreement with the perceptions of 67% of Americans, who think that climate change is happening [37]. The difference in the responses regarding the causes of climate change that were found in this study is in agreement with previous findings on agricultural stakeholder perceptions in various regions of the United States [36], but shy from the over half (53%) of the American public and over 97% of scientists who think that human-caused climate change is happening [37]. Producer perceptions of the causes of climate change have notable implications for sustainability given the recognized links between climate perceptions and producer decisions to implement climate mitigation and adaptation strategies [12,20]. Previous research has demonstrated that producers in the upper Midwest of the United States who believe that human activity is a driver of climate change were more positive toward adaptive and mitigation activities [20]. Alternatively, producers who do not think that human-driven climate change has been scientifically proven [17,18] make management decisions to mitigate risks based on perceptions that are aligned with their values, oblivious to the consensus of the scientific community [38]. Past studies have further shown that Iowa farmers who were not concerned about climate change tended to be overly confident in the capability of humans to control the effects of climate change, and were thus optimistic about “human ingenuity” for overcoming natural constrains [39,40]. Our findings in the state of Montana, along with those in the literature, more broadly point to the need for outreach efforts and stakeholder dialogues regarding evidence and perceptions on the causes of climate change.
The discrepancy between the relatively high consensus of participant perceptions regarding the existence of climate change and low consensus of the reported observations of changes in climate variables suggest that agricultural stakeholders’ perceptions of climate change are influenced by other factors in addition to observations. The discrepancy in the observations of changes in climate variables further deviate from some previous studies that show a high degree of consensus among farmer observations [12]. The discrepancy of observations found in this study is likely due to differences in the demographic characteristics of our study participants, as previous case studies have shown that farmers’ perceptions of climate risks in agricultural systems are driven by observations of local climate trends along with demographic factors such as farm acreage, income, age, and market diversification [22,40,41,42,43].
This study found significant differences regarding climate change perceptions and observations between agricultural stakeholders on the basis of socio-ecological characteristics. Although about 87% of participants were very concerned or somewhat concerned about the impact of climate change on agricultural production, differences in concern were accounted by stakeholders’ political view, with liberals being more likely to be concerned than conservatives. The mean values for all of the climate observations (length of the growing season, increase in temperature, rainfall, snowfall, and water supply) depended on stakeholders’ agricultural group, production region, and political views. Additionally, observations of the length of the growing season were associated with participants’ annual income, while all of the other observations of climate variables were similar among stakeholders’ annual income. Observations of extreme temperature fluctuations were associated with political view and production region, but did not depend on other demographic factors.
Findings from this study on significant differences in climate perceptions based on political views are in agreement with previous studies that highlight that the perceptions of the risks posed by climate change are predicted by factors related to the views of the social groups to which people belong [16,38,42]. In addition, disagreement regarding the anthropogenic causes of climate change based on political views support the political polarization regarding climate change in the general public of the United States [43,44], as well as in other countries around the world [45]. Past studies have indicated that stakeholders’ concerns about climate change differ because of their political views rather than their production region. This political divide with respect to climate change beliefs and concerns has been found predominantly in the U.S., and to a lesser extent in the European Union (EU) [46,47].
Furthermore, the political divide with respect to climate change is indicative of the larger distrust of science based on political affiliation, which has increased as of late in the United States. A longitudinal study from 1974 to 2010 regarding public trust in science found that conservatives in the United States have become increasingly distrustful of science [43]. Specifically, Gauchat (2012) [43] demonstrated that in 1974, conservatives had greater trust in science compared with liberals and moderates. However, by 2010, conservatives had the lowest trust in science relative to liberals and moderates [43]. Gauchat (2012) [43] further shows variation in trust for science based on social class, ethnicity, gender, church attendance, and region. McCright et al. (2013) [48] highlighted that the variation in trust in science based on political affiliation is related to the type of science and its use in policy making. They differentiate between production science, which provides new inventions or innovations for economic production, and impact science, which identifies environmental and public health issues derived from economic production and anthropogenic activities [48]. McCright et al. (2013) [48] demonstrated that while liberals report greater trust in scientists and support the use of science in policy-making compared with conservatives, the latter actually have greater trust in production scientists that provide new inventions or innovations for economic production compared with their liberal counterparts. Our work aligns with McCright et al. (2013) [48,49] regarding the lack of effect of income on views about science, and is in contrast to previous studies regarding the variation of perceptions and observations about climate based on income [42]. Specifically, we found few differences amongst income categories, although medium-income stakeholders were more likely than those with lower incomes to report increases in the length of the growing season.
Our finding about organic producers’ greater concern regarding the impacts of climate change compared with other producers deviates from a previous study in Yoyo county, California, where organic producers and traditional farmers were equally concerned about climate change [50]. The results from our study regarding the greater concern of organic producers toward climate change compared with traditional grain growers, while being the most optimistic group regarding the human capability to reduce climate change, can suggest that this group may also be most likely to adopt climate resilient agriculture, including mitigation and adaption strategies.
Overall, this study highlights that while a notable fraction of agricultural stakeholders in Montana are alarmed about climate change and optimistic about the human capacity to reduce the changes in climate, the degree of concern and optimism significantly varies depending on stakeholder’s political views, production region, and agricultural occupation group. We found that not only perceptions, but also the causes and potential risks of climate change to agricultural production are driven by both political views and stakeholders’ observations of climate variables. Both perceptions and observations drive the choice of adaptation and mitigation practices. It is thus essential to understand farmer demographics and socio-ecological characteristics when designing agricultural outreach programs in order to reduce barriers for the adoption of climate resilient agriculture.

Authors Contributions

B.I.G., F.M., S.A., C.E. and Z.M. worked on the conceptualization and methodology of the study, and validation of the survey; B.I.G. performed the formal analysis, curated the data, and developed the visualizations included in this manuscript; Data was collected by F.M. and Z.M.; F.M. and B.I.G. provided the necessary software resources; B.I.G., F.M., S.A., C.E. and Z.M. wrote sections of the original draft; B.I.G., S.A. and F.M. reviewed and edited the final manuscript. This study was conducted with funds provided by F.M., B.I.G. and S.A.

Funding

This research was funded by USDA-WSARE grant number MW16-004 and by NSF RII Track-2 FEC OIA grant number 1632810.

Acknowledgments

Authors are grateful to HELPS Lab of Montana State University for their assistance in data compilation.

Conflicts of Interest

The authors declare no conflict of interest.

References

  1. Campbell, B.M.; Vermeulen, S.J.; Aggarwal, P.K.; Corner-Dolloff, C.; Girvetz, E.; Loboguerrero, A.M.; Ramirez-Villegas, J.; Rosenstock, T.; Sebastian, L.; Thornton, P.K.; et al. Reducing risks to food security from climate change. Glob. Food Secur. 2016, 11, 34–43. [Google Scholar] [CrossRef]
  2. Arbuckle, J.G.; Prokopy, L.S.; Haigh, T.; Hobbs, J.; Knoot, T.; Knutson, C.; Loy, A.; Mase, A.S.; McGuire, J.; Morton, L.W.; et al. Climate change beliefs, concerns, and attitudes toward adaptation and mitigation among farmers in the Midwestern United States. Clim. Chang. 2013, 117, 943–950. [Google Scholar] [CrossRef]
  3. Edenhofer, O.; Steckel, J.C.; Jakob, M. Does Environmental Sustainability Contradict Prosperity? Glob. Policy 2014, 5, 15–20. [Google Scholar] [CrossRef]
  4. Herforth, A.; Arimond, M.; Coates, J.; Alvarez, C.; Christianson, K.; Muehlhoff, E. A global overview of food-based dietary guidelines. Ann. Nutr. Metab. 2017, 71, 781–782. [Google Scholar]
  5. Ahmed, S.; Stepp, J.R. Beyond yields: Climate change effects on specialty crop quality and agroecological management. Elem. Sci. Anth. 2016, 4, 1–16. [Google Scholar] [CrossRef]
  6. Mastrandrea, M.D.; Mach, K.J.; Barros, V.R.; Bilir, T.E.; Dokken, D.J.; Edenhofer, O.; Field, C.B.; Hiraishi, T.; Kadner, S.; Krug, T.; et al. IPCC, 2015: Meeting Report of the Intergovernmental Panel on Climate Change Expert Meeting on Climate Change, Food, and Agriculture; World Meteorological Organization: Geneva, Switzerland, 2015; 68p. [Google Scholar]
  7. Whitlock, C.W.; Maxwell, B.; Silverman, N.; Wade, A.A. 2017 Montana Climate Assessment; Montana State University: Bozeman, MT, USA; University of Montana: Missoula, MN, USA; Montana Institute on Ecosystems: Bozeman, MT, USA, 2017. [Google Scholar]
  8. Melillo, J.; Richmond, T.; Yohe, G. Climate Change Impacts in the United States: The Third National Climate Assessment; U.S. Global Change Research Program: Washington, DC, USA, 2014; 841p. Available online: http://nca2014.globalchange.gov (accessed on 20 January 2018).
  9. Lanning, S.P.; Kephart, K.; Carlson, G.R.; Eckhoff, J.E.; Stougaard, R.N.; Wichman, D.M.; Martin, J.M.; Talbert, L.E. Climatic change and agronomic performance of Hard Red Spring Wheat from 1950 to 2007. Crop Sci. 2010, 50, 835–841. [Google Scholar] [CrossRef]
  10. Porter, J.R.; Semenov, M.A. Crop responses to climatic variation. Philos. Trans. R. Soc. B Biol. Sci. 2005, 360, 2021–2035. [Google Scholar] [CrossRef] [PubMed]
  11. Walthall, C.L.; Hatfield, J.; Backlund, P.; Lengnick, L.; Marshall, E.; Walsh, M.; Adkins, S.; Aillery, M.; Ainsworth, E.A.; Ammann, C.; et al. Climate Change and Agriculture in the United States: Effects and Adaptation; USDA Technical Bulletin 1935; USDA: Washington, DC, USA, 2012; 186p. Available online: https://www.usda.gov/oce/climate_change/effects_2012/CC%20and%20Agriculture%20Report%20(02-04-2013)b.pdf (accessed on 20 February 2018).
  12. Maddison, D. The Perception of and Adaptation to Climate Change in Africa; University of Pretoria: Pretoria, South Africa; World Bank Development Research Group, Sustainable Rural and Urban Development Team, World Bank: Washington, DC, USA, 2007. [Google Scholar]
  13. Ahmed, S.; Stepp, J.R.; Orians, C.; Griffin, T.; Matyas, C.; Robbat, A.; Cash, S.; Xue, D.Y.; Long, C.L.; Unachukwu, U.; et al. Effects of extreme climate events on tea (Camellia sinensis) functional quality validate indigenous farmer knowledge and sensory preferences in tropical China. PLoS ONE 2014, 9, 109–126. [Google Scholar] [CrossRef] [PubMed]
  14. Cook, J.; Nuccitelli, D.; Green, S.A.; Richardson, M.; Winkler, B.; Painting, R.; Way, R.; Jacobs, P.; Skuce, A. Quantifying the consensus on anthropogenic global warming in the scientific literature. Environ. Res. Lett. 2013, 8, 024024. [Google Scholar] [CrossRef]
  15. Howe, P.D.; Mildenberger, M.; Marlon, J.R.; Leiserowitz, A. Geographic variation in opinions on climate change at state and local scales in the USA. Nat. Clim. Chang. 2015, 5, 596–603. [Google Scholar] [CrossRef]
  16. Running, K.; Burke, J.; Shipley, K. Perceptions of environmental change and climate concern among Idaho’s farmers. Soc. Nat. Resour. 2017, 30, 659–673. [Google Scholar] [CrossRef]
  17. Rejesus, R.M. Farmer Perceptions and Beliefs about Climate Change: A North Carolina Perspective; NC State Economist: Raleigh, NC, USA, 2012. [Google Scholar]
  18. Rejesus, R.; Mutuc-Hensley, M.; Mitchell, P.D.; Coble, P.H.; Knight, T.O. U.S. agricultural producer perceptions of climate change. J. Agric. Appl. Econom. 2013, 45, 701–718. [Google Scholar] [CrossRef]
  19. Gramig, B.M.; Barnard, J.M.; Prokopy, L.S. Farmer beliefs about climate change and carbon sequestration incentives. Clim. Res. 2013, 56, 157–167. [Google Scholar] [CrossRef]
  20. Arbuckle, J.G.; Morton, L.W.; Hobbs, J. Farmer beliefs and concerns about climate change and attitudes toward adaptation and mitigation: Evidence from Iowa. Clim. Chang. 2013, 118, 551–563. [Google Scholar] [CrossRef]
  21. Bartels, W.L.; Furman, C.A.; Diehl, D.C.; Royce, F.S.; Dourte, D.R.; Ortiz, B.V.; Zierden, D.F.; Irani, T.A.; Fraisse, C.W.; Jones, J.W. Warming up to climate change: A participatory approach to engaging with agricultural stakeholders in the Southeast US. Reg. Environ. Chang. 2013, 13, S45–S55. [Google Scholar] [CrossRef]
  22. Doll, J.E.; Petersen, B.; Bode, C. Skeptical but adapting: What Midwestern farmers say about climate change. Weather Clim. Soc. 2017, 9, 739–751. [Google Scholar] [CrossRef]
  23. Liu, Z.; Smith, W.J., Jr.; Safi, A.S. Rancher and farmer perceptions of climate change in Nevada, USA. Clim. Chang. 2014, 122, 313–327. [Google Scholar] [CrossRef]
  24. Smith, W.J., Jr.; Liu, Z.; Safi, A.S.; Chief, K. Climate change perception, observation and policy support in rural Nevada: A comparative analysis of Native Americans, non-native ranchers and farmers and mainstream America. Environ. Sci. Policy 2014, 42, 101–122. [Google Scholar] [CrossRef]
  25. Takahashi, B.; Burnham, M.; Terracina-Hartman, C.; Sopchak, A.R.; Selfa, T. Climate change perceptions of NY State farmers: The role of risk Perceptions and adaptive capacity. Environ. Manag. 2016, 58, 946–957. [Google Scholar] [CrossRef] [PubMed]
  26. Tobin, D.; Radhakrishna, R.; Chatrchyan, A.; Allred, S.B. Addressing climate change impacts on agriculture and natural resources: Barriers and priorities for land-grant universities in the Northeastern United States. Weather Clim. Soc. 2017, 9, 591–606. [Google Scholar] [CrossRef]
  27. Padbury, G.W.; Caprio, J.; Coen, G.; McGinn, S.; Mortensen, D.; Nielsen, G.; Sinclair, R. Agroecosystems and land resources of the northern Great Plains. Agron. J. 2002, 94, 251–261. [Google Scholar] [CrossRef]
  28. Miller, P.R.; McConkey, B.G.; Clayton, G.W.; Brandt, S.A.; Staricka, J.A.; Johnston, A.M.; Lafond, G.P.; Schatz, B.G.; Baltensperger, D.D.; Neill, K.E. Pulse crop adaptation in the northern Great Plains. Agron. J. 2002, 94, 261–272. [Google Scholar] [CrossRef]
  29. National Climate Assessment (NCA). Our Changing Climate. 2014. Available online: https://nca2014.globalchange.gov/report (accessed on 10 December 2017).
  30. Liu, J.; Folberth, C.; Yang, H.; Rockstrom, J.; Abbaspour, K.; Zehnder, A.J.B. A global and spatially explicit assessment of climate change impacts on crop production and consumptive water use. PLoS ONE 2013, 8, e57750. [Google Scholar] [CrossRef] [PubMed] [Green Version]
  31. National Agriculture Statistic Service (NASS). 2017 State Agriculture Overview. Available online: https://www.nass.usda.gov/Quick_Stats/Ag_Overview/stateOverview.php?state=MONTANA (accessed on 7 March 2018).
  32. Pederson, G.T.; Graumlich, L.J.; Fagre, D.B.; Kipfer, T.; Muhlfeld, C.C. A century of climate and ecosystem change in Western Montana: What do temperature trends portend? Clim. Chang. 2010, 98, 133–154. [Google Scholar] [CrossRef]
  33. Mertz, O.; Mbow, C.; Reenberg, A.; Diouf, A. Farmers’ perceptions of climate change and agricultural adaptation strategies in rural Sahel. Environ. Manag. 2009, 43, 804–816. [Google Scholar] [CrossRef] [PubMed]
  34. Robert, C. Mixing Modes of Data Collection in Surveys: A Methodological Review; ESRC National Center for Research Methods: Southampton, UK, 2007; pp. 1–30. Available online: http://eprints.ncrm.ac.uk/418/ (accessed on 12 December 2017).
  35. Dunn, O.J. Multiple comparisons using rank sums. Technometrics 1964, 6, 241–252. [Google Scholar] [CrossRef]
  36. Chatrchyan, A.M.; Erlebacher, R.C.; Chaopricha, N.T.; Chan, J.; Tobin, D.; Allred, S.B. United States agricultural stakeholder views and decisions on climate change. Wiley Interdiscip. Rev. Clim. Chang. 2017, 8. [Google Scholar] [CrossRef]
  37. Leiserowitz, A.; Maibach, E.; Roser-Renouf, C.; Feinberg, G.; Rosenthal, S. Climate Change in the American Mind: October 2015; Yale Program on Climate Change Communication: New Haven, CT, USA, 2015. [Google Scholar]
  38. Kahan, D.M.; Jenkins-Smith, H.; Braman, D. Cultural cognition of scientific consensus. J. Risk Res. 2011, 14, 147–174. [Google Scholar] [CrossRef]
  39. Dunlap, R.E. The new environmental paradigm scale: From marginality to worldwide use. J. Environ. Educ. 2008, 40, 3–18. [Google Scholar] [CrossRef]
  40. Arbuckle, J.G., Jr.; Morton, L.W.; Hobbs, J. Understanding farmer perspectives on climate change adaptation and mitigation: The roles of trust in sources of climate information, climate change beliefs, and perceived risk. Environ. Behav. 2015, 47, 205–234. [Google Scholar] [CrossRef] [PubMed]
  41. Deressa, T.T.; Hassan, R.M.; Ringler, C.; Alemu, T.; Yesuf, M. Determinants of farmers’ choice of adaptation methods to climate change in the Nile Basin of Ethiopia. Glob. Environ. Chang. Hum. Policy Dimens. 2009, 19, 248–255. [Google Scholar] [CrossRef]
  42. Rejesus, R.M.; Martin, A.M.; Gypmantasiri, P. Enhancing the impact of natural resource management research: Lessons from a meta-impact assessment of the Irrigated Rice Research Consortium. Glob. Food Secur. 2014, 3, 41–48. [Google Scholar] [CrossRef]
  43. Gauchat, G. Politicization of Science in the Public Sphere: A Study of Public Trust in the United States, 1974 to 2010. Am. Sociol. Rev. 2012, 77, 167–187. [Google Scholar] [CrossRef]
  44. McCright, A.M.; Dunlap, R.E. The politicization of climate change and polarization in the American public’s views of global warming, 2001–2010. Sociol. Q. 2011, 52, 155–194. [Google Scholar] [CrossRef]
  45. Kvaløy, B.; Finseraas, H.; Listhaug, O. The publics’ concern for global warming: A cross-national study of 47 countries. J. Peace Res. 2012, 49, 11–22. [Google Scholar] [CrossRef]
  46. Morton, L.W.; Hobbs, J.; Arbuckle, J.G.; Loy, A. Upper Midwest climate variations: Farmer responses to excess water risks. J. Environ. Qual. 2015, 44, 810–822. [Google Scholar] [CrossRef] [PubMed]
  47. McCright, A.M.; Dunlap, R.E.; Marquart-Pyatt, S.T. Political ideology and views about climate change in the European Union. Environ. Politics 2016, 25, 338–358. [Google Scholar] [CrossRef]
  48. McCright, A.M.; Dentzman, K.; Charters, M.; Dietz, T. The influence of political ideology on trust in science. Environ. Res. Lett. 2013, 8, 044029. [Google Scholar] [CrossRef]
  49. McCright, A.M.; Marquart-Pyatt, S.T.; Shwom, R.L.; Brechin, S.R.; Allen, S. Ideology, capitalism, and climate: Explaining public views about climate change in the United States. Energy Res. Soc. Sci. 2016, 21, 180–189. [Google Scholar] [CrossRef]
  50. Jackson, L.E.; Wheeler, S.M.; Hollander, A.D.; O’Geen, A.T.; Orlove, B.S.; Six, J.; Sumner, D.A.; Santos-Martin, F.; Kramer, J.B.; Horwath, W.R.; et al. Case study on potential agricultural responses to climate change in a California landscape. Clim. Chang. 2011, 109, 407–427. [Google Scholar] [CrossRef]
Figure 1. Radar graphs with distributions of response mean values of perception variables by groups of demographic factors. Blue polygon: attitudes, red polygon: concern, green polygon: seriousness, and purple polygon: human capability. Clockwise: (a) responses by political view; (b) income bracket; (c) region; and (d) agricultural group.
Sustainability 10 01687 g001
Figure 2. Radar graphs with distributions of response mean values of observed changes variables by groups of demographic and geographical factors. Blue trace: changes in temperature; red: fluctuations of extreme temperature; green: rainfall; purple: snowfall; aqua: length of growing season; orange: water supply. Clockwise: (a) responses by political view; (b) income bracket; (c) agricultural group; and (d) region.
Sustainability 10 01687 g002
Table 1. Distribution of the demographic factors of the survey sample. All of the quantities are in percentages.
Agricultural GroupExtensionConsultantUniversityGrainGrain-RancherOrganicRancher
NR = 11.610.910.412.220.19.79.815.3
Production RegionNCNECWNWSWSE
NR = 6.314.624.38.012.62.427.24.6
Political ViewLiberalModerateConservative
NR = 16.411.151.321.2
Annual Income<$39,999 year−1$40,000 year−1 < x < $99,999 year−1>$100,000 year−1
NR = 10.931.237.320.6
Age (years)≤2627–4041–6768≥
NR = 22.94.019.745.48.0
NR = non-responses. NC: North Central, NE: Northeast, C: Central, W: West, NW: Northwest, SW: Southwest, SE: Southeast.
Table 2. Distribution of responses to perception and observation survey items. All of the quantities are in percentages.
Perceptions about Climate Change
Attitudes toward climate changealarmedconcernedrecognizedno changeno response
12.835.438.710.82.3
Concern about agricultural productionverysomehownot concerned
30.356.410.8 2.5
Seriousness of climate change in timealwaysin futurein my lifetimenever
51.817.76.415.09.1
Main cause of climate changeman-madeterrestrialextra-terrestrialnon-physical
36.534.33.14.421.7
Human capability to reduce the change in climatenouncertainyes
23.721.041.2 14.1
Observations of Changes in Climate-Related Variables
Temperaturedecreasedsameincreasedno response
3.830.542.0 23.7
Extreme temperature fluctuations4.636.334.3 24.8
Water supplies29.239.45.8 25.6
Rainfall26.337.412.6 24.7
Snowfall48.225.23.5 23.1
Length of growing season3.129.640.9 26.4
Table 3. Comparative analysis between demographic factor groups for perception variables.
FactorPerception Variablesχ2-Statistic (N)Significant Different Groups and Mean Differences (G1-G2)
Political View
(df = 2)
Alarmed attitudes towards climate change114.6 **
(N = 373)
Liberals > Conservatives (1.65)
Liberals > Moderates (1.05)
Moderates > Conservatives (0.60)
Concerns on the impacts on agricultural production6.86 *
(N = 371)
Liberals > Conservatives (0.28)
Seriousness in time33.09 **
(N = 352)
Liberals > Conservatives (1.12)
Liberals > Moderates (0.45)
Moderates > Conservatives (0.67)
Human capability to mitigate effects of climate change56.61 **
(N = 368)
Liberals > Conservatives (1.27)
Liberals > Moderates (0.72)
Moderates > Conservatives (0.55)
Region
(df = 6)
Alarmed attitudes towards climate change45.37 **
(N = 427)
W > NE (0.46)
SW > NE, Central, SE (0.67, 0.56, 0.54)
SW < NW (‒0.26)
Concerns on the impacts on agricultural production6.18
(N = 426)
Similar among groups
Seriousness in time9.97
(N = 397)
Similar among groups
Human capability to mitigate effects of climate change27.57 **
(N = 392)
NE < W & SW (‒0.54, ‒0.48)
Agricultural Group
(df = 6)
Alarmed attitudes towards climate change60.34 **
(N = 441)
Extension > Grain (0.47)
Organic > Grain, Consultant (0.96, 0.94)
Organic > Grain-rancher, Rancher (0.93, 0.89)
University > Extension, Consultant (0.25, 0.71)
University > Grain-rancher, Rancher (0.70, 0.66)
Concerns on the impacts on agricultural production3.12
(N = 373)
Similar among groups
Seriousness in time25.19 **
(N = 344)
Organic > Grain, Rancher (0.81, 0.71)
Extension > Grain, Rancher (0.87, 0.77)
Human capability to mitigate effects of climate change33.54 **
(N = 343)
Organic > Grain, Grain-rancher (0.71, 0.95)
University > Grain, Grain-rancher (0.61, 0.85)
* Significance 0.001 ≤ p < 0.05. ** Significance p < 0.001.
Table 4. Multiple regression analysis model coefficients for perception variables.
AttitudesConcernSeriousnessCapability
VariableBSEBBetaBSEBBetaBSEBBetaBSEBBeta
Intercept1.5330.278 1.9850.169 2.2640.455 2.5430.364
Political view0.6920.0770.482 *0.1750.0580.175 *0.4760.1240.260 *0.4950.1000.311 *
Income0.0850.0640.067−0.0530.051−0.0600.0050.1030.0030.0010.0840.001
Age−0.0040.003−0.0610.0040.0050.051−0.0020.004−0.029
NC region0.0070.1510.0030.0570.1110.340.0610.2340.019−0.0030.196−0.001
NE region−0.3810.129−0.190 *−0.1030.100−0.071−0.1490.292−0.36−0.1950.168−0.088
SC region−0.5100.178−0.159 *−0.2240.139−0.1010.0240.2530.008−0.6230.235−0.173 *
WC region−0.1550.149−0.0630.0260.1160.015−0.1190.412−0.190.0690.1940.025
NW region0.1940.2580.0390.0530.2030.015−0.1680.212−0.0670.1090.3350.020
SE region−0.1100.170−0.0370.1190.1420.053−0.0580.277−0.015−0.0600.220−0.018
Extension0.1130.1800.0360.2480.2890.062−0.0170.234−0.005
Crop consult−0.3800.163−0.143−0.2080.261−0.063−0.4100.212−0.144
University0.0900.1730.0310.1160.2890.0310.0980.2240.031
Small grain−0.2960.154−0.136−0.4040.248−0.145−0.2620.200−0.109
Smlgr + ranch−0.1040.187−0.034−0.4440.310−0.109−0.4620.243−0.137
Organic0.2460.1720.0840.2810.2850.073−0.460.224−0.014
Rancher−0.2050.147−0.086−0.3080.237−0.103−0.1590.193−0.060
* Significance, p < 0.05.
Table 5. Comparative analysis between demographic factor groups for observation variables.
FactorObservation Variablesχ2-Statistic (N)Significant Different Groups and Mean Differences (G1–G2)
Political view
(df = 2)
Temperature21.61 **
(N = 300)
Liberals > Conservatives (0.50)
Liberals > Moderates (0.31)
Moderates > Conservatives (0.19)
X-temperature17.86 **
(N = 294)
Liberals > Conservatives (0.47)
Liberals > Moderates (0.35)
Rainfall7.63 *
(N = 298)
Liberals < Moderates (−0.33)
Snowfall10.74 *
(N = 302)
Liberals < Conservatives (−0.37)
Warm days19.27 **
(N = 303)
Liberals > Conservatives (0.47)
Liberals > Moderates (0.33)
Water supply17.43 **
(N = 289)
Liberals < Conservatives (−0.46)
Liberals < Moderates (−0.31)
Region
(df = 6)
Temperature24.76 **
(N = 337)
NE < SW (−0.32)
X-temperature9.44
(N = 332)
Similar among groups
Rainfall28.02 **
(N = 337)
NE > W, SW (0.58, 0.37)
SW < Central (−0.18)
Snowfall7.67
(N = 342)
Similar among groups
Warm days18.85 *
(N = 343)
NE < SW (0.34)
Water supply26.46 **
(N = 329)
NE > W, SW, NC (0.44, 0.28, 0.34)
SW < Central (−0.24)
Agricultural group
(df = 6)
Temperature25.74 **
(N = 344)
Organic > Grain and Grain–rancher (0.47, 0.52)
University > Grain–rancher (0.37)
Extreme-temp11.00
(N = 340)
Similar among groups
Rainfall27.38 **
(N = 344)
Organic < Grain, Grain–rancher, Extension (−0.63, −0.56, −0.58)
Grain > Rancher (0.40)
Snowfall22.01 *
(N = 347)
Organic < Consultant and Grain–rancher (−0.52, −0.52)
Warm days21.20 *
(N = 349)
Organic > Grain (0.36)
Water supply28.59 **
(N = 335)
Organic < Grain, Grain–rancher, Rancher, Consultant (−0.62, −0.60, −0.49, −0.58)
* Significance 0.001 ≤ p < 0.05. ** Significance p < 0.001.
Table 6. Multiple regression analysis model coefficients for observation variables.
TemperatureWarm daysRainfallExtreme-temp
VariableBSEBBetaBSEBBetaBSEBBetaBSEBBeta
Intercept2.1910.258 2.2570.252 2.7390.294 2.2000.214
Political view0.1350.0690.143 *0.2320.0680.253 *−0.1160.077−0.1080.2390.0660.246 *
Income−0.0550.057−0.0670.0300.0570.037−0.0210.064−0.0230.0050.0560.005
Age0.0040.0030.104−0.0010.003−0.019−0.0090.003−0.195 *
NC region0.3270.170.200 *−0.0780.137−0.048−0.3710.145−0.198 *0.0950.1280.060
NE region−0.2710.122−0.204 *−0.1850.119−0.130
SC region−0.1310.155−0.066−0.4530.154−0.229−0.1540.177−0.067−0.0110.57−0.005
WC region−0.0060.142−0.004−0.1240.132−0.082−0.4050.161−0.223 *−0.0980.138−0.057
NW region0.4000.2420.1170.0470.2610.013−0.5090.250−0.147 *0.2400.2290.072
SW region0.1810.1250.129−0.2660.136−0.171 *
SE region0.3000.1490.154 *−0.0550.147−0.029−0.2290.159−0.112−0.0120.152−0.006
Extension0.0310.1670.0140.1800.1620.0880.0730.1770.0340.1200.1560.058
Crop consult−0.4100.159−0.220 *−0.2600.157−0.1430.1830.1920.078−0.3200.153−0.162 *
University0.0440.1630.023−0.0920.162−0.0490.1960.1820.090−0.2800.146−0.149
Small grain−0.3870.140−0.279 *−0.1390.140−0.1030.1630.1550.108−0.1980.135−0.137
Smlgr+ranch−0.2480.169−0.1250.2370.1670.122−0.0060.192−0.003−0.1220.164−0.057
Organic0.0600.1640.0300.0160.1570.009−0.2580.179−0.116−0.2620.156−0.123
Rancher−0.1390.136−0.089−0.0440.132−0.029−0.2860.148−0.170−0.3030.128−0.188 *
* Significance, p < 0.05. NC: north central region; NE: northeast region; SC: south central region; WC: western region; NW: northwest region; SW: southwest region; SE: southeast region.

