Can Farmers’ Markets in Shrinking Cities Contribute to Economic Development? A Case Study from Flint, Michigan

1
Department of Geography, Planning, and Environment, University of Michigan-Flint, Flint, MI 48502, USA
2
Center for Regional Food Systems, Michigan State University, East Lansing, MI 48824, USA
*
Author to whom correspondence should be addressed.
Sustainability 2018, 10(6), 1714; https://0-doi-org.brum.beds.ac.uk/10.3390/su10061714
Submission received: 1 May 2018
/
Revised: 20 May 2018
/
Accepted: 21 May 2018
/
Published: 24 May 2018
(This article belongs to the Special Issue Sustaining the Shrinking City: Concepts, Dynamics and Management)
Abstract
:We examine the extent to which the Flint Farmers’ Market produces positive spillover effects on nearby businesses in downtown Flint, Michigan. We care about spillover spending in shrinking cities like Flint because farmers’ markets may contribute to growth beyond their boundaries, and thus help to sustain their surrounding areas. We surveyed visitors of the Flint market to determine the percentage who spend downtown outside of the market, how much they spend, the demographic characteristics that predict spending, and the additional businesses that visitors would like to see in the downtown. We also interviewed downtown business owners and managers to capture their perspectives on the market, including whether its relocation in 2014 helped their businesses. This study differs from prior research on spillover effects because it uses a mixed-methods approach and it explores how the shrinking-city context affects market outcomes. Overall, we find that the Flint market has minimal impact on nearby businesses compared to markets in non-shrinking cities. We discuss the possible reasons why the Flint market under-performs, including potential visitor concerns about crime and a site design that does not promote walking to other destinations. We also discuss how these concerns (e.g., crime, walkability) stem from the shrinking-city context.
1. Introduction
Driven by large increases in consumer demand for local foods [1] and farmers’ markets’ potential to contribute to community and economic development, the number of farmers’ markets in the United States has increased nearly 400% since 1994, to more than 8600 [2]. Farmers’ markets provide a source of fresh, high-quality produce [3,4]; encourage consumption of fruits and vegetables [4,5,6]; improve access to healthy foods for low-income communities [7]; connect consumers to the seasonality of agriculture [8]; and serve as community gathering places and social spaces [9,10]. Farmers’ markets also contribute to the economic viability of small-scale farms and other small businesses by lowering start-up costs and overhead, fostering innovation, and increasing profits through direct sales [8,11,12]. Moreover, because dollars spent at local businesses—particularly local food businesses—are more likely to remain local [1,13], farmers’ markets increase retention of dollars in the local economy, presumably by strengthening rural-urban linkages and driving import substitution [14,15,16,17]. Even when accounting for the potential opportunity costs of reduced spending at grocery stores, garden stores, and restaurants, input-output models of aggregate vendor sales indicate that farmers’ markets create jobs and stimulate wholesale and personal spending by market vendors and employees [15,18,19].
There is emerging evidence that farmers’ markets also generate positive spillover for nearby, businesses because visitors will likely frequent other places as part of their trip to the market [20]. Customer surveys conducted by the Project for Public Spaces in eight major U.S. cities (Berkeley, San Francisco, Brooklyn, Los Angeles, Philadelphia, Cincinnati, Washington, D.C., and Los Angeles) [21] indicated that upwards of sixty percent of farmers’ market visitors shopped or planned to shop at businesses outside of these markets. A gray literature report from Oregon State University Extension (written by Lev et al. [22]) found that 33 to 65% of visitors across seven markets in the Pacific Northwest spent money nearby, with the ratio of spending ranging from 0.31 to 0.92—meaning that for every dollar spent at a market, an additional 31 to 92 cents were spent elsewhere as part of the visit. While the authors did not examine why the ratios differed from market to market, they speculated it had to do with operating hours and the number of retailers in the vicinity. Studies of five markets in Michigan by the Michigan Farmers’ Market Association—conducted in Marquette [23], Menominee (two markets) [24,25], Port Huron [26], and Traverse City [27] in 2016—showed comparable ranges to Lev et al.’s report, with 48–77% of visitors planning to do additional shopping, eating, or other activities near the respective farmers’ markets. Estimates of this external spending ranged from an average of $26 per person at the Vantage Point Market in Port Huron [26], to $60 per person at the downtown Marquette market [23]. In 2017, the Michigan Farmers’ Market Association reported that across 15 Michigan markets, 45% of visitors spent money at neighboring businesses, and among those spending outside the market, the average was $40 spent per person [28]. Henneberry et al. [29] also used customer surveys from 21 farmers’ markets in Oklahoma to estimate that each market visitor spends at least $15 on food, drinks, gas, and other general merchandise outside of the market as part of their visit.
1.1. Our Contribution
Although these studies found positive spillover, many of them come from gray literature with small sample sizes or incomplete descriptions of their methodology. No study has empirically examined the factors that encourage spillover spending, nor has any study attempted to measure spillover using a method other than customer surveys. Although farmers’ markets are thought to promote economic development [15,29,30], no study has examined whether spillover effects are as strong in shrinking cities, also known as “legacy” cities [31]. This question of context is relevant because shrinking cities are not merely the opposite of growing cities. According to Schilling and Logan [32], shrinking cities are a special subset of older industrial cities with significant and sustained population losses (of 25% or greater over 40 years in their study) and which face increasing levels of vacancy and blight. The dynamics of shrinking and growing cities likewise vary considerably [33]. For example, shrinking cities tend to lack job opportunities for residents [34], lack access to goods and services for vulnerable populations [33], experience retail leakage [35], and have an insufficient tax base to pay for oversized, aging infrastructure and services [36]. These, and other challenges, make it crucial for planners, policy makers, and market managers to understand how and why farmers’ markets contribute (or do not contribute) to the economic vitality and sustainability of their surrounding areas.
We help fill these gaps in the literature by using a mixed-methods approach to examine the spillover generated by a farmers’ market in the mid-sized shrinking city of Flint, Michigan. Other studies of the Flint market [37,38,39] have examined the effects of its relocation in 2014 on variables like patron demographics, healthy food access, market vendors’ satisfaction, and total direct sales. This study considers a different angle by exploring the effects of the market and its relocation on nearby businesses in Flint’s downtown. Flint serves as a suitable case study for considering the effects of shrinkage on spillover, given that its population declined from nearly 200,000 in 1960, to just over 100,000 by 2010 [40]. USA Today noted that Flint lost nearly 20,000 residents between 2010 and 2015, making it one of America’s fastest shrinking cities [41].
1.2. The Flint Farmers’ Market
In late June 2014, the 105-year-old Flint Farmers’ Market moved one-half mile from an isolated location on the periphery of downtown Flint to a newer, larger facility in the heart of downtown. Many vendors and community members initially opposed the move due to concerns about vendor retention, the market losing its historic charm, insufficient parking, and perceived crime in the downtown [42]. Nonetheless, the decision to move the market was made for a number of reasons including the poor condition of the old market’s facility, the inability to make the market fully accessible to people with disabilities, and a lack of space to expand (Personal communication with market manager: 18 July 2013). In terms of visitor attendance, the market relocation was successful. The relocated market attracts more than 500,000 visitors per year, compared to the old market site which averaged only 275,000 [43]. Additionally, the relocated market has more vendors and more public spaces (e.g., indoor seating, a community room, an adjacent park), and it generates more total sales [38].
Based on these figures and the aforementioned literature on spillover effects, one might presume that the relocation also increased foot-traffic in the downtown and generated activity for surrounding businesses (i.e., positive spillover). That was the hope for the market, even at its former location. As part of a 2007 study on placemaking and revitalization in Flint, the Project for Public Spaces stated the following:
Most people are starved to be a part of something meaningful in their everyday lives, something which makes them feel better. The Flint Farmers’ Market is that something, it is that place—and everyone who participates gets something they need, creating a cumulative effect that will hopefully be contagious for revitalizing the larger downtown and surrounding neighborhoods [44].(p. 11)
Now that the market has a more central location, it has greater potential to generate this “cumulative effect” than it did in the late 2000s. However, without empirical evidence, we cannot rule out the possibility that the market’s relocation has instead had a limited or even deleterious effect, given the paucity of research on farmers’ markets in shrinking cities. Perhaps due to fear of crime or a lack of retail or entertainment options in the downtown—concerns voiced by visitors of downtown Flint prior to the move [45]—the market may act as an island of prosperity, with visitors frequenting it and proceeding directly home. Further, because a high percentage of Flint residents are poor, and because Flint and its metropolitan area are both losing population [40], the downtown may be limited in how much economic activity it can support. The market’s relocation may have therefore increased competition and displaced existing businesses, opposite of the intended effect.
2. Materials and Methods
2.1. Research Questions
Based on the aforementioned literature, we consider the following questions:
- (1)
- What are the spillover effects of the Flint Farmers’ Market on downtown Flint? Are these effects comparable to the effects found in places that are not shrinking cities?
- (2)
- What are some of the factors that influence the probability that a market visitor will spend money elsewhere in downtown Flint as part of a visit to the farmers’ market?
- (3)
- What are some other businesses that could be added to downtown Flint to encourage additional spillover spending?
- (4)
- What do downtown business owners and managers think about the market’s relocation? Has it helped their businesses?
2.2. SEED Survey and Participants
We administered a SEED survey (“Sticky Economic Evaluation Device”) to 119 Flint Farmers’ Market visitors in fall 2015 and 340 visitors in summer 2016. This survey instrument was developed by Market Umbrella in partnership with Loyola University [46] and has been used to collect basic data on market visitors’ spending patterns in many cities, including Baltimore, Maryland [47] and New Orleans, Louisiana [48]. Because we were interested in identifying businesses that have potential synergy with the Flint Farmers’ Market but are currently absent from Flint’s downtown, we added a question to the standard SEED survey which asked, “Are there businesses that are not currently downtown that you would visit if they opened downtown? If so, please list them here.” The survey instrument is available as a Supplementary File called “SEED Survey”.
We recruited survey participants on market days (Tuesdays, Thursdays, and Saturdays) via convenience sampling. Random sampling was not practical due to the market having both indoor and outdoor spaces with multiple points of entry. Trained research assistants approached visitors and asked them to participate. Care was taken to administer surveys on different days of the week and at different times of the day. Before combining the two data collection efforts (fall and summer) into one sample, we checked that visitors’ demographics, frequency of visiting the downtown, and dollars spent outside of the market as part of a market visit did not differ by season. Fall and summer visitors were similar demographically, although we surveyed proportionally more African Americans in the summer than in the fall. The percentage of market visitors who planned to spend money elsewhere in the downtown did not differ by season, neither did the average dollars spent outside of the market. Further, the demographics of the combined fall and summer sample were similar to those found by another study of the Flint market [38] which examined the characteristics of 1830 visitors from July 2014 to June 2015.
2.3. SEED Survey Analyses
To address the first research question (Q1) and calculate the market’s spillover, we used data from the SEED surveys to determine the average dollars spent per person outside of the market, and multiplied this figure by the number of people visiting from 1 September 2015 to 31 August 2016. The attendance figure came from the market’s ShopperTrak device, which counts the number of people entering the indoor portion of market. We used this 12-month period of September through August, instead of the traditional calendar year of January through December because of our dates of data collection and the desire to use a larger, combined dataset. Although people enter the facility all days of the week (e.g., market employees, vendors setting up their stands, people using the community room or commercial kitchens), we only considered attendance on the days the market is fully open and vendors are selling (Tuesdays, Thursdays, Saturdays). We also controlled for whether the market was the primary reason for visiting downtown, since spending would not reflect market spillover if it was generated by people coming downtown for other reasons (e.g., school, work).
For the second research question (Q2), we used logistic regression to explore the demographic factors that influence the probability that a market visitor spent or planned to spend money elsewhere in the downtown (no = 0, yes = 1). Participants who stated they were “unsure” were not included, making the sample size for this analysis 386. We chose to predict whether one would spend, instead of predicting the dollar amount spent, because the distribution for the spending variable was negatively skewed by the large proportion of participants who indicated little spending outside the market. For the independent variables, we included gender (0 = male, 1 = female), race (two dummy codes: Caucasian 0 = no, 1 = yes; African American 0 = no, 1 = yes), and whether the participant lived in Flint (0 = no, 1 = yes). While there are certainly other factors that influence spending, to maximize sample size, we followed the simplicity of the SEED survey which only asks participants these basic demographic questions. We then used the software program NVivo Plus 11 to conduct content analysis on the 178 responses we received to the open-ended question about new businesses market visitors would frequent if they opened downtown (Q3). We report businesses that at least 5% of our sample identified.
2.4. Business Owner Interviews and Interview Analysis
Finally, to examine the fourth research question (Q4), we interviewed business owners and managers two years after the market relocated. We conducted foot surveys and used property data from the city of Flint to identify all occupied, commercial properties within the downtown in summer 2016, with the boundaries defined by the city’s 2013 master plan. We then selected food, retail, and personal service establishments within these boundaries, and removed other businesses unlikely to experience market spillover. (For example, an engineering firm located downtown would probably not see increases in business because of increased foot traffic from the market—nor would it lose business because of increased competition from the market’s vendors). Using these criteria, we identified 34 businesses appropriate for inclusion, and were able to contact owners or managers for 30 of the 34 (hereafter referred to as “owners/managers” for convenience and to maintain the anonymity of respondents). Seventeen of the 30 (56.7%)—representing 9 restaurants, 7 retail establishments, and one that sold both food and retail items—completed a recorded interview with a trained research assistant between September 2016 and April 2017.
The interviews were transcribed and analyzed using the software program NVivo Plus 11. The program facilitated counts of common themes and responses among participants. While the interviews covered a variety of topics about changes in the downtown, we focused on the questions about the farmers’ market: “Are you happy that the Flint Farmers’ Market relocated to downtown in the summer of 2014? Why or why not?” and “Is there anything else you would like for us to know about how the farmers’ market impacted, or currently impacts, your business?” These questions were analyzed concurrently in the software program because responses to the second often reflected happiness about the relocation (i.e., responses to the first). While our interview sample was small and only represented businesses still open two years after the market’s relocation, the narratives helped contextualize the SEED survey results, as demonstrated in the following sections.
3. Results
3.1. Spillover Effects
As previously noted, to calculate annual spillover (Q1), we multiplied the average dollars spent per visitor outside of the market by the number of people visiting the market during the 12-month period of interest. Because it was not possible to produce estimates for participants who were “unsure” if they would spend (15.5%), we only included data from those who indicated whether they spent or had an intention to spend (“yes” respondents = 16.4% of the sample; “no” respondents = 68.1% of the sample). The average spent per visitor was therefore only $6.26 because of the large percentage who indicated no spillover spending (i.e., $0.00). The average for the “yes” respondents alone was $26.73.
From ShopperTrak, the total attendance for Tuesdays, Thursdays, and Saturdays for the 12-month period was 543,301. We therefore estimate that market visitors spent $3.4 million [$6.26 × 543,301] outside of the farmers’ market for the year of interest. However, some visitors were downtown for other reasons (e.g., school or work)—meaning that to some extent, businesses or activities in the downtown generated spending at the farmers’ market, rather than the other way around. To account for this directionality, we asked participants, “Is the market your primary reason for visiting the downtown today?” 65.9% said yes. Consequently, we could say that only the spending from these market visitors represents a spillover effect—and thus, we could argue that 65.9% of the $3.4 million ($2.24 million) is the better estimate. Given that prior studies estimated the annual direct economic impact of the Flint Farmers’ Market to be between $14.5 and $16.5 million [38,39], then spillover spending represents only about 12% to 14% of the total spent by market visitors in the downtown [2.24/(16.5 + 2.24) = 11.95; 2.24/(14 + 2.24) = 13.79]. Although $2.24 million may sound significant, if the market could somehow generate enough activity to meet the middle of Lev et al.’s range of ratios (0.61) [22], then spillover would be $6.3 million (0.61 (the ratio) × $28.88 (the direct spending per person) = $17.62 (in external spending); $17.62 × 543,301 (the attendance figure) = 9,572,964 (total external spending); 0.659 (percentage of people whose spending downtown originates from the market) × 9,572,964 = 6,308,583 (spillover)).
3.2. Factors That Influence Individual Spending
We used logistic regression to assess whether the three demographic variables available in the SEED survey (gender, race, and residency) predict whether a visitor of the Flint Farmers’ Market spends or plans to spend money elsewhere in the downtown. The combination of variables was statistically significant (X2 = 16.311, df = 4, p = 0.003), although the proportion of variance explained was low (Nagelkerke R2 = 0.069). Gender and whether one lives in Flint were individually statistically significant when controlling for the other variables (p < 0.050 for both), but race was not significant (p = 0.770 for the Caucasian dummy variable; p = 0.829 for the African American dummy variable). Race remained insignificant when running the analysis with only one race variable to control for potential multicollinearity. Table 1 presents the model’s results. The odds of spending money elsewhere in the downtown are lower for females than males (the B coefficient is negative and female was coded 1), and greater for Flint residents than non-residents.
3.3. Other Businesses That Could Encourage Spending
One-hundred seventy-eight participants provided an affirmative response to the question, “Are there businesses that are not currently downtown that you would visit if they opened downtown? If so, please list them here.” The majority listed only one business or type, with restaurants being the most frequent (n = 94). Nineteen of the 94 who stated restaurants did not provide the name of an establishment or type of cuisine. Of the remainder who did, there was little agreement. The most frequent responses were coffee shops (n = 13, with 5 stating Starbucks and 4 stating Tim Hortons) and Asian food (n = 13, with 7 stating sushi specifically). A similar pattern emerged for retail. Seventy-six participants indicated they would like to see more retail downtown, but there was little agreement on what the retail should be. The most frequent responses were a clothing store (in general, n = 17), shoe store (n = 16), and media store (i.e., a store that sells items like comic books, video games, music, movies/videos, and electronics; n = 9). Other frequent responses not included with retail were pharmacies (n = 11) and grocery stores (n = 20), with some participants specifying high-end or specialty stores (i.e., Trader Joes or Whole Foods, n = 5 of 20) and one stating “a real grocery store.” Very few participants (7 of 178) showed an interest in more services downtown (n = 1 for salon, n = 2 for shoe repair, n = 2 for tailor, n = 2 for exercise classes). Similarly, very few showed an interest in more entertainment options, with 2 stating they would visit a movie theater and 7 stating they would visit a (non-specified) theater, which could mean a movie or live performance venue.
3.4. Interviews
The interviews demonstrated that owners and managers of nearby businesses were generally nonplused about the market’s relocation. Collectively, responses were not overwhelmingly positive or negative. Six owners/managers stated the market had no effect on their businesses, with two of six indicating a limited impact because of a lack of other things for visitors to do downtown. Three owners/mangers stated the market increased competition and reduced their business slightly on market days, while four others noted increases in foot traffic because of the market’s presence. The more enthusiastic responses included statements like, “People say, let’s go to the market, but let’s go do something else too [so they come to our business]” and “They would go there [to the market] and see how long they had to wait for lunch, and we would have like a second lunch, so our lunch rush would come more later [because if the market gets too busy, people come downtown to eat instead].” (For clarity and context, we added the parentheticals).
While downtown business owners/managers do not believe that the market’s relocation significantly affected sales, several indicated it provides other benefits and conveniences. For example, three owners/managers held events at the market to promote their businesses and/or to connect with community. Although we focused on spending by market visitors, one downtown business owner/manager noted how market vendors buy their products and services. Further, three restaurant owners/managers purchase produce from the market, indicating a relationship in the opposite direction—i.e., the market benefits from downtown businesses, instead of (or in addition to) downtown businesses benefitting from the market. One owner/manager stated, “We want to be able to incorporate more local products in our business.” Another indicated, “It’s saved us a lot of money, being able to go [to the market] and be able to buy stuff, you know, because we can walk.” A third stated, “We use products from the farmers’ market, so it’s very convenient to have them so close.”
Interestingly, despite market visitors expressing a desire for more restaurants in the downtown (as indicated by the results for Q3), three owners/managers, without prompting indicated there is no need for more restaurants, especially now that the market has relocated and serves prepared foods. One stated, “There’s kind of this feeling like, we’re full [with restaurants], there’s a lot of food options downtown.” Another stated, “There’s a lot more places to eat down here, too [with the farmers’ market], so I think we have enough [restaurants] now.” And another, “We need to get some other things for people to do down here, because they eat only three times a day.”
4. Discussion
Compared to the spillover generated by farmers’ markets in non-shrinking cities [23,24,25,26,27,28,29,30,31,32,33,34,35,36,37,38,39], the Flint market under-performs. Because we are interested in increasing the Flint market’s spillover so that it is more on par with other markets, we spend most of this section (Section 4) discussing potential reasons why the Flint market generates less spillover than others, and how or why the context of shrinkage matters. While we cannot examine why the market under-performs statistically (for we asked if and how much visitors spent or would spend, not why they would spend), we propose explanations based on existing research, our limited results, and personal observations from time spent in Flint.
4.1. Fear of Crime
Shrinking cities tend to have both high levels of crime and a reputation for crime [49]. The embedded nature of crime in these cities is due, in large part, to the correlation of criminal activities with other social problems like unemployment [50] and concentrations of poverty [51]—to which population loss and economic decline are contributors [52]. According to annual violent crime statistics from the Federal Bureau of Investigation, Flint is one of the most dangerous cities in America [53]. The Flint market’s lack of spillover may therefore be related to crime or fear of crime, with fear being more prevalent [54,55,56]. This notion that fear of crime hinders spillover is supported by a 2013 study (Morckel and Rybarczyk [45]) that showed that crime was the number one issue to address to encourage more people to visit or to live in downtown Flint. Like our study, this study found a residency effect, with non-Flint residents being more concerned about crime than residents. It is logical that non-residents would be more concerned, either because of a lack of familiarity with Flint or self-selection bias (i.e., not living in Flint because of crime). While Morckel and Rybarczyk did not examine differences in responses by gender, many studies have shown that women are more concerned about crime than men [56,57,58]—and given that we found that women are less likely to spend money outside of the market, fear of crime may explain why.
Likewise, the market may have limited spillover because of Flint’s poor image as a post-industrial city with challenges stemming from shrinkage. Efforts should therefore be taken to make the downtown feel, or actually be, safer. Perhaps better marketing is needed to emphasize that the downtown is as safe as suburban shopping centers [54] despite the city’s overall high crime rate. And while private security companies have been hired to patrol the downtown, some visitors expressed a preference for real, uniformed police officers [59]. Urban planners and other stakeholders might also consider implementing crime prevention through environmental design (CPTED) techniques to improve real or perceived safety [60], including ways to have more natural surveillance and so-called “eyes on the street” [61]. On a larger scale, attention to fostering social integration (which supports collective efficacy) can reduce fear of crime [58], thereby mitigating potential deterrents to market spillover.
4.2. The Market’s Lack of Physical Connection to the Downtown
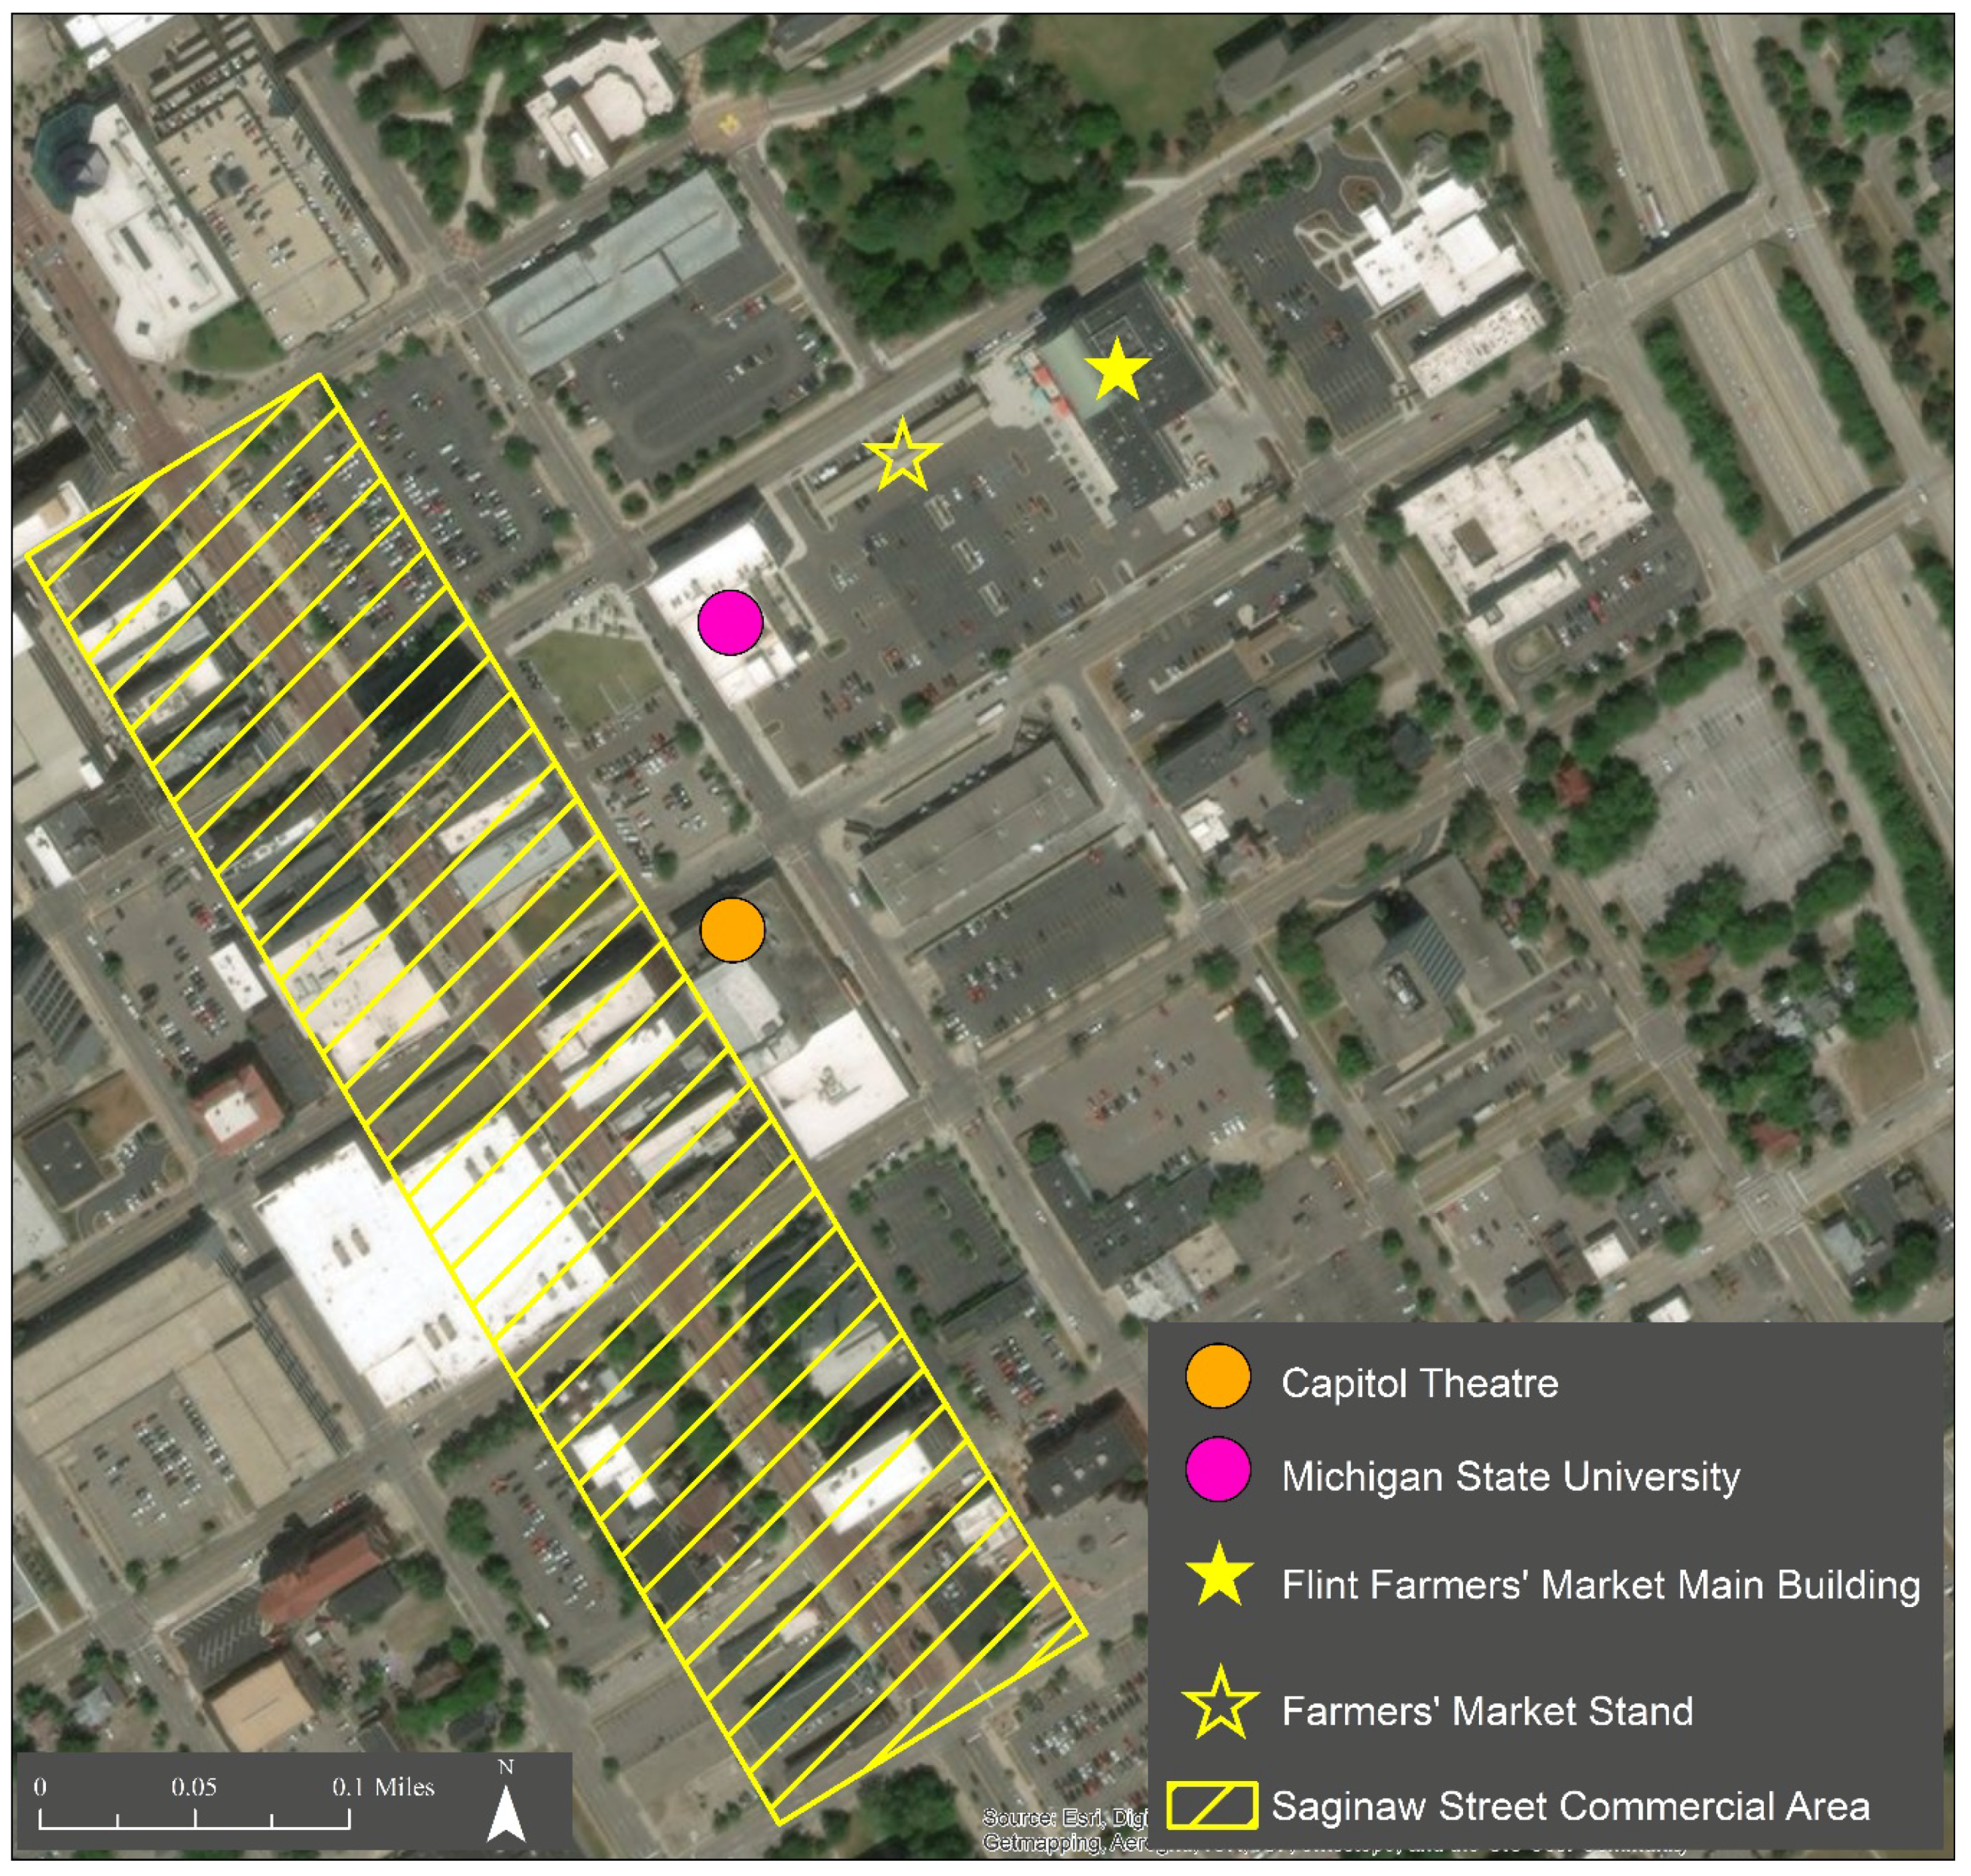
Another potential explanation for the market’s lack of spillover is its lack of physical connection to destinations within walking distance, particularly the Saginaw Street commercial area two blocks away. This area is where the majority of restaurant and retail activity in the downtown is concentrated, and it is where we conducted the most interviews. As shown in Figure 1, several large parking lots and wide streets isolate the market. The streets that comprise the market’s block are around forty-feet wide to accommodate three lanes, when two lanes would be sufficient given the lack of traffic. These streets are not “complete streets” because they are not designed and operated to enable safe access for all users, including pedestrians, bicyclists, motorists and transit riders of all ages and abilities [62].
The arrangement of the farmers’ market’s structures and parking lot also form a superblock double the size of other blocks in the downtown, further reducing connectivity. Although there were already several parking structures and lots near the market prior to its relocation, part of the structure that is now the indoor marketplace was demolished to make way for even more parking. Journalists’ reports suggest the decision to prioritize super-convenient parking for both visitors and vendors was made based on fears that the relocated Flint market would not compete with a new suburban market that had ample parking [42,43,63]. The market’s owners also situated the outdoor stand in the middle of the superblock and placed vendor parking adjacent to the sidewalk, causing pedestrians who walk from the main entrance to Saginaw Street to walk very near or around the back of vendors’ vehicles. Additionally, there are no pedestrian crossings to connect the middle of this superblock to the sidewalks on perpendicular streets, including the street that provides direct access to the University of Michigan—Flint campus. Moreover, the orientation of the Michigan State University building—which shares the same block as the market and is located between the market and the Saginaw Street commercial area—does not encourage visitors to walk along the most direct path from the market to Saginaw Street. The building’s entrances and parking are oriented towards the block’s interior, which results in an absence of pedestrian and other activity on the sides of the building that face the street and sidewalk, creating “dead space”.
Overall, the market is sited and situated like a 1970s shopping mall, with visitors parking their cars close to the building, walking a short distance to the main structure, and visiting the different businesses inside on foot. This design works fine if the goal is to have the market function as an isolated entity—but if the goal is for it to contribute to the development or sustainability of a walkable, traditional downtown, it should not be designed in this way [64]. It would have been preferable for the market’s owners to have restored the traditional street grid, situated the stand along the newly connecting street, and placed the parking behind the stand. But to their defense, reconstructing a road that was probably removed decades ago would have been a large undertaking, requiring collaboration with the city and/or state, and possibly years of effort.
These observations bring into question whether the market’s lack of spillover is the result of poor urban design decisions or the shrinking city context, as suggested in the introduction. We suspect it is a combination of both. The city’s continued loss of population and economic decline have reduced the number of potential visitors, their incomes, and their purchasing power, which limits the number of viable businesses downtown. Poor urban design decisions may have therefore originated (perhaps subconsciously) from a “shrinking cities mentality.” In shrinking cities, a risk-avoiding style becomes ingrained in all the urban area’s institutions [65]. As Galster [65] observes, residents and policy-makers in shrinking cities are psychologically conservative, with potential losses weighed more heavily than equivalent gains—and thus people strive to conserve threatened physical, social, and psychological resources (i.e., the Conservation of Resources theory). So rather than take risks with a site design that embraced urbanity and promoted walkability—especially in a metropolitan area known for its love of the car [66]—the Flint market’s owners selected a seemingly safer, suburban design. Granted, the relocated Flint Farmers’ Market attracts more visitors than it did previously, but if Flint’s downtown is to remain viable, it is our view that policy makers, business owners, and other stakeholders need to capitalize on its unique assets, especially its urbanity. Downtown Flint is by far the densest place in its metropolitan area; it should likewise embrace this character, rather than emulate its suburbs. There are several walkable cities within an hour’s drive of Flint that have significant pedestrian and retail activity despite a lack of free parking (e.g., the cities of Ann Arbor, Frankenmuth, Royal Oak). This suggests that if a destination is sufficiently attractive and the built environment supports walking, people will walk, even in Michigan where winters are long and reliance on automobiles is almost sacred.
4.3. Future Spillover Spending
Although addressing the aforementioned concerns (e.g., crime, site design) would encourage more people to venture from the market, having additional restaurants and retail options downtown would likely increase spillover as well. A “critical mass” of destinations may be necessary to attract visitors, which could explain why our SEED survey participants wanted even more restaurants, in contrast to business owners/managers who perhaps feared competition. Further, because a large proportion of market visitors are from the suburbs [37] and are likely to have restaurant and retail alternatives near their homes, visiting and spending money in downtown Flint may only be attractive if it is a unique experience. Perhaps there is potential for the downtown to reinvent itself as an arts and culture or small-scale tourist destination, a strategy which has shown promise in other shrinking cities [67]. This shift in character may already be occurring with the renovation of the Capitol Theatre (two blocks from the market) which reopened in December 2017 after being closed for around twenty years [68,69]. It is also important to consider, and capitalize upon, synergies between prospective downtown businesses and the farmers’ market, like how some downtown restaurants purchase produce from the market.
The question, of course, is how to attract more businesses—which is a question that has been contemplated by local policy makers for decades [70]. The need for additional businesses to increase spillover is, in some respects, a so-called “catch-22.” More spillover from the market could generate additional demand for more businesses, yet more businesses are necessary to encourage visitors to spend and create spillover. Nonetheless, we acknowledge that despite its best efforts, Flint’s downtown may remain limited in the number of restaurants and retailers it can sustain—even with additional foot traffic from the market—because of the aforementioned dynamics of population loss and demographic change. Pursuing measures to increase the downtown’s residential population may therefore be a necessary, alternative strategy for creating demand—not to mention that “life-style options” like farmers’ markets may help the city attract more of the “creative class,” spurring economic development [71]. According to a housing market analysis by the U.S. Department of Housing and Urban Development [72], there is demand for housing in downtown Flint. This demand has also been recognized by local developers [73]. By attracting more residents, crime and fear of crime may decrease due to subsequent increases in pedestrian activity and natural surveillance. More people walking in the downtown could further justify investing in changes to the market’s site design that promote greater connectivity between the market and other destinations.
Finally, we acknowledge that because the Flint metropolitan area is losing population, if downtown Flint is successful at attracting more people and businesses from the greater Flint metro, then by default it is taking business from somewhere else. The same is true for the farmers’ market, which probably takes business away from other food providers in the region [74]. How do we account for these shifts in economic activity whereby some businesses, neighborhoods, or communities win and others lose? By generating more activity in Flint, are we creating another dead retail district elsewhere in the county? We believe that Flint needs the activity more than other places because its residents are lacking in employment opportunities and access to goods and services—not to mention the city needs more tax revenues to avoid further disinvesting in infrastructure and essential services (e.g., water crisis) [36]. Nonetheless, we are left to wonder how to resolve the seemingly “zero sum game” created by a shrinking city attempting to generate economic activity in a shrinking metropolitan area.
4.4. Limitations and Future Directions for Research
Before applying our recommendations to other shrinking cities, or using our findings to make changes to the Flint market or downtown, one should consider this study’s limitations. To explain why the Flint Farmers’ Market generates less spillover than other markets, we relied on existing literature, limited demographic data from SEED surveys, business owner interviews (that may have been positively biased), and personal experience. However, simply asking market visitors why they do or do not venture elsewhere in the downtown would have been instructive. We compared the spillover effects found by studies that differed slightly in their methodologies, but to better understand the contextual variables that influence spillover, comparative studies are needed that utilize the same methodology across multiple cities and/or markets. Additionally, we did not examine all forms of spillover from the Flint market. For example, because the market is a vibrant, safe space in Flint, it is probable that people who visit leave with a better impression of the downtown or of the city in general—and they may tell others about their positive experience, thereby encouraging them to visit. Positive experiences at the market may also encourage later visits to the downtown for different reasons (e.g., special events, entertainment).
Lastly, given time and data limitations, we did not consider how multiple variables or factors might interact with one another to discourage spillover spending, nor did we examine every potential explanation for the lack of spillover. Here are four additional hypotheses aligned with our findings that are suitable for future research:
- (1)
- Since many Flint Farmers’ Market visitors do not reside in the city and travel a substantial distance to visit (as shown in a recent study [37]), perhaps visitors do not venture from the market’s site because they are unfamiliar with the area.
- (2)
- Because the new Flint market has such a wide variety of vendors, including an extensive prepared food selection, perhaps there is no compelling reason for visitors to look beyond the market.
- (3)
- Given that Flint has the highest poverty rate in the country amongst cities with a population of at least 65,000 [75], residents may not have money to spend outside of the market. Wealthier, suburban visitors might not make up the difference if they visit the market and proceed directly home.
- (4)
- Some people visit the Flint market for social, leisure, or entertainment purposes—in which case, it may not be reasonable to expect spillover spending if the market itself is not acting as a transactional space (i.e., a place to make purchases) for some segments of the population.
5. Conclusions
Despite these limitations, this study is significant because it provides evidence that farmers’ markets in shrinking cities generate less spillover than markets in non-shrinking cities. More broadly, it demonstrates that the ability of farmers’ markets to contribute to economic activity in their surrounding areas is contextually dependent and should not be assumed. As Jablonski argues [17], it is a mistake to view farmers’ markets as a one-size-fits all strategy without adequately considering where markets locate, how they contribute to sustainable development, and what they need to be successful in their specific context. Of the studies we found on farmers’ market spillover effects, the Flint market has the lowest percentage of visitors spending elsewhere, the lowest dollar amount spent per visitor outside of the market, and the lowest spending ratio per visitor. While it may always be the case that shrinking cities’ farmers’ markets produce less spillover than comparable markets in non-shrinking cities (more research is necessary to confirm), we believe there are opportunities to increase the Flint market’s external impacts—both because its spillover is so much lower than other markets’ (i.e., “there is nowhere to go but up”) and because it is already successful in terms of its attendance figures and annual sales. Ultimately, rather than give up on farmers’ markets’ potential to contribute to economic development and stability in shrinking cities like Flint, we believe that more care needs to be taken to identify and mitigate factors limiting spillover. Farmers’ markets should be assets to leverage to attract more people and businesses to their surrounding areas, regardless of context. It may merely take more effort in shrinking cities.
Supplementary Materials
The following are available online at https://0-www-mdpi-com.brum.beds.ac.uk/2071-1050/10/6/1714/s1, Survey 1: SEED Survey.
Author Contributions
V.M. was responsible for the funding acquisition; methodology, investigation, and formal analyses; project administration and supervision of student assistants. K.C. was responsible for the literature review and formatting. Both authors shared in writing, editing, and reviewing the manuscript. Both have read and approved the final version.
Funding
This study was funded by a Research and Creative Activity (RCA) award from the University of Michigan-Flint’s Office of Research and Sponsored Programs.
Acknowledgments
We thank the many student research assistants from the University of Michigan-Flint who administered the SEED surveys and assisted with data entry. We thank Kristin Ball for conducting the business owner interviews, and Troy Rosencrants of the University of Michigan-Flint’s Geographic Information Systems Center for creating the figure. We especially thank the Flint Farmers’ Market’s management team for allowing us to survey visitors. The lead author further acknowledges the market’s managers for working with her over the course of five years and three scholarly publications about the market’s relocation, of which this publication is the third and final.
Conflicts of Interest
The authors declare no conflict of interest. The funding sponsor had no role in the design of the study; in the collection, analyses, or interpretation of data; in the writing of the manuscript, and in the decision to publish the results.
References
- Tropp, D.; Moraghan, M.R. Local food demand in the U.S.: Evolution of the marketplace and future potential. In Harvesting Opportunity: The Power of Regional Food System Investments to Transform Communities; Dumont, A., Davis, D., Wascalus, J., Wilson, T.C., Barham, J., Tropp, D., Eds.; Federal Reserve Bank of St. Louis: St. Louis, MO, USA, 2017; pp. 15–42. [Google Scholar]
- Agricultural Marketing Service. Farmers Market Promotion Program: 2016 Highlights. United States Department of Agriculture, 2017. Available online: https://www.ams.usda.gov/sites/default/files/media/FMPP2016Highlights.pdf (accessed on 27 June 2017).
- Wolf, M.M.; Spittler, A.; Ahern, J. A profile of farmers’ market consumers and the perceived advantages of produce sold at farmers’ markets. J. Food Distrib. Res. 2005, 36, 192–201. [Google Scholar]
- Govindasamy, R.; Italia, J.; Adelaja, A. Farmers’ Markets: Consumer Trends, Preferences, and Characteristics. J. Ext. 2002, 40, 1. Available online: https://www.joe.org/joe/2002february/rb6.php (accessed on 1 April 2018).
- Cromp, D.; Cheadle, A.; Solomon, L.; Maring, P.; Wong, E.; Reed, K.M. Kaiser Permanente’s farmers’ market program: Description, impact, and lessons learned. J. Agric. Food Syst. Comm. Dev. 2011, 2, 29–36. [Google Scholar] [CrossRef]
- McCormack, L.A.; Laska, M.N.; Larson, N.I.; Story, M. Review of the nutritional implications of farmers’ markets and community gardens: A call for evaluation and research efforts. J. Am. Diet. Assoc. 2010, 110, 399–408. [Google Scholar] [CrossRef] [PubMed]
- Project for Public Spaces; Columbia University. Farmers Markets as a Strategy to Improve Access to Healthy Food for Low-Income Families and Communities. 2013. Available online: https://www.pps.org/wp-content/uploads/2013/02/RWJF-Report.pdf (accessed on 27 April 2018).
- Gillespie, G.; Hilchey, D.L.; Hinrichs, C.C.; Feenstra, G. Farmers’ markets as keystones in rebuilding local and regional food systems. In Remaking the North American Food System: Strategies for Sustainability; Hinrichs, C., Lyson, T., Eds.; University of Nebraska Press: Lincoln, NE, USA, 2007; pp. 65–83. [Google Scholar]
- Hinrichs, C.C. Embeddedness and local food systems: Notes on two types of direct agricultural market. J. Rural Stud. 2000, 16, 295–303. [Google Scholar] [CrossRef]
- Lyson, T.A. Civic Agriculture. Reconnecting Farm, Food, and Community; Tufts University Press: Medford, MA, USA, 2004. [Google Scholar]
- Hinrichs, C.C.; Gillespie, G.W.; Feenstra, G.W. Social learning and innovation at retail farmers’ markets. Rural Sociol. 2004, 69, 31–58. [Google Scholar] [CrossRef]
- Schmit, T.M.; Jablonski, B.B.R.; Minner, J.; Kay, D.; Christensen, L. Rural wealth creation of intellectual capital from urban local food system initiatives: Developing indicators to assess change. Community Dev. J. 2017, 48, 639–656. [Google Scholar] [CrossRef]
- Persky, J.; Ranney, D.; Wiewel, W. Import substitution and local economic development. Econ. Dev. Q. 1993, 7, 18–29. [Google Scholar] [CrossRef]
- Jablonski, B.B.R.; Hendrickson, M.; Vogel, S.; Schmit, T.M. Local and regional food systems driving rural economic development. In Harvesting Opportunity: The Power of Regional Food System Investments to Transform communities; Dumon, A., Davis, D., Wascalus, J., Wilson, T.C., Barham, J., Tropp, D., Eds.; Federal Reserve Bank of St. Louis: St. Louis, MO, USA, 2017. [Google Scholar]
- Hughes, D.W.; Brown, C.; Miller, S.; McConnell, T. Evaluating the economic impact of farmers’ markets using an opportunity cost framework. J. Agric. Appl. Econ. 2008, 40, 253–265. [Google Scholar] [CrossRef]
- Pinchot, A. The Economics of Local Food Systems: A Literature Review of the Production, Distribution, and Consumption of Local Food; Extension Center for Community Vitality, University of Minnesota: St. Paul, MN, USA, 2014; Available online: http://www.extension.umn.edu/community/research/reports/docs/2014-Economics-of-Local-Food-Systems.pdf (accessed on 4 December 2017).
- Jablonski, B.B.R. Evaluating the impact of farmers’ markets using a rural wealth creation approach. In Rural Wealth Creation; Pender, J.L., Johnson, T.G., Weber, B.A., Fannin, J.M., Eds.; Routledge: New York, NY, USA, 2014; pp. 218–231. [Google Scholar]
- Hughes, D.W.; Isengildina-Massa, O. The economic impact of farmers’ markets and a state level locally grown campaign. Food Policy 2015, 54, 78–84. [Google Scholar] [CrossRef]
- Otto, D.; Varner, T. Consumers, Vendors, and the Economic Importance of Iowa Farmers’ Markets: An Economic Impact Survey Analysis. Leopold Center for Sustainable Agriculture, 2005. Available online: http://lib.dr.iastate.edu/leopold_pubspapers/145 (accessed on 27 April 2018).
- Brown, A. Farmers’ market research 1940–2000: An inventory and review. Am. J. Altern. Agric. 2002, 17, 167–176. [Google Scholar] [CrossRef]
- Project for Public Spaces; Partners for Livable Communities. Public Markets as a Vehicle for Social Integration and Upward Mobility. The Ford Foundation, 2003. Available online: https://www.pps.org/pdf/Ford_Report.pdf (accessed on 27 April 2018).
- Lev, L.; Brewer, L.; Stephenson, G. Research Brief: How do Farmers’ Markets Affect Neighboring Businesses; Technical Report Number 16; Oregon State University Extension Service. 2003. Available online: http://smallfarms.oregonstate.edu/sites/default/files/publications/techreports/TechReport16.pdf (accessed on 14 August 2017).
- Michigan Farmers Market Association. Downtown Marquette Farmers Market: 2016 Impacts. Available online: http://mifma.org/wp-content/uploads/2015/01/Marquette-FM-2016-Impacts-Full-Report.pdf (accessed on 27 April 2018).
- Michigan Farmers Market Association. M&M Farmers Market: 2016 Impacts. Available online: http://mifma.org/wp-content/uploads/2015/01/MCFFE-2016-Impacts-Full-Report-6-12-17.pdf (accessed on 27 April 2018).
- Michigan Farmers Market Association. Menominee Historic Downtown Farmers Market: 2016 Impacts. Available online: http://mifma.org/wp-content/uploads/2017/07/Downtown-Menominee-FM-2016-Impacts-Full-Report.pdf (accessed on 27 April 2018).
- Michigan Farmers Market Association. Vantage Point Farmers Market: 2016 Impacts. Available online: http://mifma.org/wp-content/uploads/2015/01/Vantage-Point-2016-Impacts-Full-Report-6-5-17.pdf (accessed on 27 April 2018).
- Michigan Farmers Market Association. Sara Hardy Downtown Farmers Market: 2016 Impacts. Available online: http://mifma.org/wp-content/uploads/2017/07/Sara-Hardy-FM-2016-Impacts-Full-Report.pdf (accessed on 27 April 2018).
- Michigan Farmers Market Association. 2017 Impacts. Available online: http://mifma.org/wp-content/uploads/2018/03/2017-Market-Summary-Report.pdf (accessed on 27 April 2018).
- Henneberry, S.R.; Whitacre, B.; Agustini, H.N. An evaluation of the economic impacts of Oklahoma farmers markets. J. Food Distrib. Res. 2009, 40, 64–78. [Google Scholar]
- Market Umbrella. Catalysts for Growth: Farmers Markets as Stimulus for Economic Development. Available online: http://www.marketumbrella.org/uploads/file/gpCataylsts_1999.pdf (accessed on 1 April 2018).
- Mallach, A. Rebuilding America’s Legacy Cities: New Directions for the Industrial Heartland; The American Assembly, Columbia University: New York, NY, USA, 2012. [Google Scholar]
- Schilling, J.; Logan, J. Greening the rust belt: A green infrastructure model for right sizing America’s shrinking cities. J. Am. Plan. Assoc. 2008, 74, 451–466. [Google Scholar] [CrossRef]
- Herrmann, D.; Shuster, W.; Mayer, A.; Garmestani, A. Sustainability for shrinking cities. Sustainability 2016, 8, 911. [Google Scholar] [CrossRef]
- Rhodes, J.; Russo, J. Shrinking ‘smart’? Urban redevelopment and shrinkage in Youngstown, Ohio. Urban Geogr. 2013, 34, 305–326. [Google Scholar] [CrossRef]
- Murtagh, B. The role of the social economy in the shrinking city. In Future Directions for the European Shrinking City; Neill, W.J.V., Schlappa, H., Eds.; Routledge: New York, NY, USA, 2016. [Google Scholar]
- Morckel, V. Why the Flint, Michigan, USA water crisis is an urban planning failure. Cities 2017, 62, 23–27. [Google Scholar] [CrossRef]
- Morckel, V. Patronage and access to a legacy city farmers’ market: A case study of the relocation of the Flint, Michigan, market. Local Environ. 2017, 22, 1268–1289. [Google Scholar] [CrossRef]
- Morckel, V. The direct economic impact of the Flint, Michigan, farmers’ market relocation. Community Dev. J. 2018, 49, 161–174. [Google Scholar] [CrossRef]
- Sadler, R.C. Strengthening the core, improving access: Bringing healthy food downtown via a farmers’ market move. Appl. Geogr. 2016, 67, 119–128. [Google Scholar] [CrossRef]
- Houseal Lavigne Associates. Imagine Flint: Master Plan for a Sustainable Flint; City of Flint, Michigan. 2013. Available online: http://www.imagineflint.com/Documents.aspx (accessed on 27 April 2018).
- Frohlich, T.C. Going, Gone: America’s Fastest-Shrinking Cities. USA Today. 8 April 2016. Available online: https://www.usatoday.com/story/money/2016/04/08/24-7-wallst-america-shrinking-cities-population-migration/82740600/ (accessed on 12 January 2018).
- Allen, J. Two Vendors Say They Won’t Follow Flint Farmers’ Market to New Downtown Location. MLive 5 July 2013. Available online: http://www.mlive.com/business/mid-michigan/index.ssf/2013/07/largest_produce_meat_vendors_w.html (accessed on 5 April 2018).
- Atkinson, S. One Year Later, Flint Farmers’ Market Doubles Customers, Draws People Downtown. MLive 12 June 2015. Available online: http://www.mlive.com/entertainment/flint/index.ssf/2015/06/one_year_later_new_flint_farme.html (accessed on 5 April 2018).
- Project for Public Spaces. Flint Market Revitalization Strategy: Flint Farmers’ Market (Flint, Michigan); Project for Public Spaces: New York, NY, USA, 2007; pp. 1–62. [Google Scholar]
- Morckel, V.; Rybarczyk, G. Improving downtown in a mid-sized legacy city: Examining responses to potential downtown improvements in Flint, Michigan. Community Dev. J. 2015, 46, 341–360. [Google Scholar] [CrossRef]
- Market Umbrella. Sticky Economy Evaluation Device. Available online: http://www.marketumbrella.org/marketshare/seed (accessed on 15 December 2017).
- Market Umbrella. Sticky Economy Evaluation Device: Measuring the Financial Impact of a Public Market—Baltimore Farmers Market. 2011. Available online: http://www.marketumbrella.org/_downloads/JFX_BOPA-20111017.pdf (accessed on 27 April 2018).
- Market Umbrella. Sticky Economy Evaluation Device: Measuring the Financial Impact of a Public Market—Crescent City Farmers Market. 2012. Available online: http://www.crescentcityfarmersmarket.org/uploads/file/Crescent_City_Farmers_Market_x3_2012-20121021.pdf (accessed on 27 April 2018).
- Beauregard, R.A. Urban population loss in historical perspective: United States, 1820–2000. Environ. Plan. A 2009, 41, 514–528. [Google Scholar] [CrossRef]
- Raphael, S.; Winter-Ebmer, R. Identifying the effect of unemployment on crime. J. Law Econ. 2001, 44, 259–283. [Google Scholar] [CrossRef]
- Powell, J. Sprawl, fragmentation, and the persistence of racial inequality: Limiting civil rights by fragmenting space. In Urban Sprawl: Causes, Consequences & Policy Responses; Squires, G.D., Ed.; The Urban Institute Press: Washington, DC, USA, 2002; pp. 73–117. [Google Scholar]
- Hollingsworth, T.; Goebel, A. Revitalizing America’s Smaller Legacy Cities: Strategies for Postindustrial Success from Gary to Lowell; Lincoln Institute of Land Policy: Cambridge, MA, USA, 2017. [Google Scholar]
- Adams, D. Flint Ranked Ninth-Most Violent City in America, FBI Stats Say. MLive 28 September 2017. Available online: http://www.mlive.com/news/flint/index.ssf/2017/09/flint_once_again_in_top_10_mos.html (accessed on 27 April 2018).
- Lawlor, J. Crime Statistics in Downtown Flint Mirror Those of the Suburbs, Journal Comparison Shows. MLive 31 May 2009. Available online: http://www.mlive.com/news/flint/index.ssf/2009/05/crime_statistics_in_downtown_f.html (accessed on 5 April 2018).
- LaGrange, R.L.; Ferraro, K.F.; Supancic, M. Perceived risk and fear of crime: Role of social and physical incivilities. J. Res. Crime Delinq. 1992, 29, 311–334. [Google Scholar] [CrossRef]
- Perkins, D.D.; Taylor, R.B. Ecological assessments of community disorder: Their relationship to fear of crime and theoretical implications. Am. J. Community Psychol. 1996, 24, 63–107. [Google Scholar] [CrossRef] [PubMed]
- Box, S.; Hale, C.; Andrews, G. Explaining fear of crime. Br. J. Criminol. 1988, 28, 340–356. [Google Scholar] [CrossRef]
- Gibson, C.L.; Zhao, J.; Lovrich, N.P.; Gaffney, M.J. Social integration, individual perceptions of collective efficacy, and fear of crime in three cities. Justice Q. 2002, 19, 537–564. [Google Scholar] [CrossRef]
- Angus, L. Businesses Hire Private Security for Downtown Flint; Some Fear it’s not enough. MLive 7 May 2010. Available online: http://www.mlive.com/news/flint/index.ssf/2010/05/some_concerned_about_private_s.html (accessed on 5 April 2018).
- Colquhoun, I. Design out crime: Creating safe and sustainable communities. Crime Prev. Community Saf. 2004, 6, 57–70. [Google Scholar] [CrossRef]
- Loukaitou-Sideris, A. Is it safe to walk? Neighborhood safety and security considerations and their effects on walking. J. Plan. Lit. 2006, 20, 219–232. [Google Scholar] [CrossRef]
- Smart Growth America. What Are Complete Streets? Available online: https://smartgrowthamerica.org/program/national-complete-streets-coalition/what-are-complete-streets/ (accessed on 5 April 2018).
- Ketchum, W.E., III. Davison Farmer’s Market Celebrates Grand Opening. MLive 17 May 2014. Available online: http://www.mlive.com/news/flint/index.ssf/2014/05/davison_farmers_market_celebra.html (accessed on 27 April 2018).
- Kunstler, J.H. Geography of Nowhere: The Rise and Decline of America’s Man-Made Landscape; Simon and Schuster: New York, NY, USA, 1994. [Google Scholar]
- Galster, G. Why shrinking cities are not mirror images of growing cities: A research agenda of six testable propositions. Urban Aff. Rev. 2017. [Google Scholar] [CrossRef]
- Hannemann, C. The industrial city as a shrinking city and the special case of Flint, MI. In Industrial Cities: History and Future; Zimmermann, C., Ed.; Campus Verlag: Frankfurt, Germany, 2013; pp. 142–164. [Google Scholar]
- Winkler, R.; Oikarinen, L.; Simpson, H.; Michaelson, M.; Gonzalez, M.S. Boom, bust and beyond: Arts and sustainability in Calumet, Michigan. Sustainability 2016, 8, 284. [Google Scholar] [CrossRef]
- May, J. Tour Flint’s Newly-Restored, Historic Capitol Theatre. MLive 7 December 2017. Available online: http://www.mlive.com/news/flint/index.ssf/2017/12/tour_flints_newly-restored_his.html (accessed on 5 April 2018).
- Adams, D. Capitol Theatre to Open Summer 2017 Following Approval of Tax Freeze. MLive 13 May 2016. Available online: http://www.mlive.com/news/flint/index.ssf/2016/05/capitol_theatre_to_open_summer.html (accessed on 27 April 2018).
- Highsmith, A.R. Demolition Means Progress: Flint, Michigan, and the Fate of the American Metropolis; University of Chicago Press: Chicago, IL, USA, 2015. [Google Scholar]
- Florida, R. The Rise of the Creative Class: And How Its Transforming Work, Leisure, Community and Everyday Life; Basic Books: New York, NY, USA, 2002. [Google Scholar]
- U.S. Department of Housing and Urban Development. Comprehensive Housing Market Analysis: Flint, Michigan. Office of Policy Development and Research, 2014. Available online: https://www.huduser.gov/publications/pdf/FlintMI_comp_2014.pdf (accessed on 5 April 2018).
- Dresden, E. ‘Demand Is There’ for More Apartments, Housing in Downtown Flint. MLive 3 November 2014. Available online: http://www.mlive.com/news/flint/index.ssf/2014/11/the_demand_is_there_as_apartme.html (accessed on 27 April 2018).
- Jablonski, B.B.; Schmit, T.M.; Kay, D. Assessing the Economic Impacts of Food Hubs on Regional Economies: A Framework that Includes Opportunity Cost. Agric. Resour. Econ. Rev. 2016, 45, 143–172. [Google Scholar] [CrossRef]
- Adams, D. Here’s How Flint Went from Boom Town to Nation’s Highest Poverty Rate. MLive 2017. Available online: http://www.mlive.com/news/flint/index.ssf/2017/09/heres_how_flint_went_from_boom.html (accessed on 27 April 2018).
Figure 1.
Map of the Flint Farmers’ Market location in downtown Flint, Michigan.


Table 1.
Logistic regression predicting who will spend money in downtown Flint, outside of the farmers’ market, as part of a market visit.
Table 1.
Logistic regression predicting who will spend money in downtown Flint, outside of the farmers’ market, as part of a market visit.
| Variable | B | SE | Odds Ratio | p-Value |
|---|---|---|---|---|
| Gender | −0.754 | 0.268 | 0.470 | 0.005 |
| Caucasian | −0.113 | 0.388 | 0.893 | 0.770 |
| African American | −0.103 | 0.473 | 0.903 | 0.829 |
| Flint Resident | 0.772 | 0.286 | 2.163 | 0.007 |
| Constant | −1.263 | 0.420 | 0.283 | 0.003 |
Note: We also ran the analysis with only one race dummy code. The results were similar, with race remaining statistically insignificant, and gender and residency significant.
© 2018 by the authors. Licensee MDPI, Basel, Switzerland. This article is an open access article distributed under the terms and conditions of the Creative Commons Attribution (CC BY) license (http://creativecommons.org/licenses/by/4.0/).
Share and Cite
MDPI and ACS Style
Morckel, V.; Colasanti, K. Can Farmers’ Markets in Shrinking Cities Contribute to Economic Development? A Case Study from Flint, Michigan. Sustainability 2018, 10, 1714. https://0-doi-org.brum.beds.ac.uk/10.3390/su10061714
AMA Style
Morckel V, Colasanti K. Can Farmers’ Markets in Shrinking Cities Contribute to Economic Development? A Case Study from Flint, Michigan. Sustainability. 2018; 10(6):1714. https://0-doi-org.brum.beds.ac.uk/10.3390/su10061714
Chicago/Turabian StyleMorckel, Victoria, and Kathryn Colasanti. 2018. "Can Farmers’ Markets in Shrinking Cities Contribute to Economic Development? A Case Study from Flint, Michigan" Sustainability 10, no. 6: 1714. https://0-doi-org.brum.beds.ac.uk/10.3390/su10061714
Note that from the first issue of 2016, this journal uses article numbers instead of page numbers. See further details here.