Bi-Objective Optimization Model Based on Profit and CO2 Emissions for Pig Deliveries to the Abattoir


1
Department of Mathematics, University of Lleida, 25001 Lleida, Spain
2
Agrotecnio Research Center, 25198 Lleida, Spain
*
Author to whom correspondence should be addressed.
†
These authors contributed equally to this work.
Sustainability 2018, 10(6), 1782; https://0-doi-org.brum.beds.ac.uk/10.3390/su10061782
Submission received: 3 May 2018
/
Revised: 26 May 2018
/
Accepted: 26 May 2018
/
Published: 29 May 2018
(This article belongs to the Special Issue Sustainable Supply Chain System Design and Optimization)
Abstract
:This paper presents a bi-objective model for optimizing pig deliveries to the abattoir accounting for total revenue and CO emissions. Fattening farms house the most important stage in pig production, and operations on farms must be coordinated with the rest of the pig supply chain when batch management is generally applied. The novelty of the model lies in the change of attitude in producers towards a greener production, which is becoming one of the major concerns in our society. In this context, we enrich the classical approach focused on revenues with the addition of the CO emissions from the pigs on the fattening farms. Emissions derived from feeding and transportation are considered since they are the most important sources of CO . The model is tested using parameters representing a typical integrated Spanish fattening farm. Our findings reveal the impact and the relationship between revenues and emissions, highlight that the break-even is reached achieving 459 kg of CO per pig, which corresponds to a reduction of 6.05%. On the other hand, the profit is slightly reduced by 4.48% in favor of the environment.
1. Introduction
The pig production industry has evolved greatly over recent years [1] to increase its efficiency financially and productively. At the same time, the increment of pig production worldwide has highlighted society’s concerns about its environmental impact and future sustainability [2]. For example, in Spain, production is concentrated in bigger firms acting as supply chains. They own the different agents covering the activity and operate under a vertical integration scheme [3,4]. However, there are regions like Catalonia with areas saturated with farms and with manure pollution problems. The actual pig supply chain (PSC) organization of the sector represents benefits like farm specialization and disease control [1]. It is usual to find pig companies owning compound feed mills, farms of different kinds producing piglets or fattening pigs, abattoirs and meat packing plants, veterinary consultancies or even software business units. As a result, each production unit, like a farm, has to operate in coordination with the rest of the pig supply chain, and the farmer has to obey the rules from the head office of the company, the so-called integrator [5]. However, this vertically-integrated system leads to intensive farming, with a bigger concentration of manure to manage in limited areas and additional transportation requirements to transfer and move piglets and pigs from one farm to another while they are growing (i.e., increasing total CO emissions). Furthermore, society’s attitude towards environmental issues is sensitive to greener and more respectful production means. This makes pig producers and pig companies more receptive to considering and evolving to greener supply chains, incorporating other criteria other than solely revenues into the traditional objective function.
In this context, this paper is concerned with fattening farms, these being the last stage in the pig production system and where most of the CO emissions that affect the environment are generated. This is so, because as several authors have confirmed [6], feeding is the main source of CO emissions, with transportation being the second depending on fuel oil consumption. Fattening farms in a PSC receive piglets from rearing farms and operate under batch management. Batch management, or all-in-all-out (AIAO) management, implies the entry of a batch of pigs into a farm, where they are fattened and sold when they reach a marketable weight (i.e., around 100 kg). This is achieved in around 16 weeks after arriving on the farm depending on the growth of pigs. Once all the pigs in a batch have been sent to the abattoir, the facility is cleaned and sanitized and made ready to receive a new batch of animals [7]. The fattening period depends on several factors like the feeding regime, growth curve, carcass and reward system [8]. Hence, marketing policies take into account that partial sales produce better economic returns than selling the whole batch at a time. Visual inspection is the least expensive and most customary method of selecting pigs to be sent to the abattoir, as innovative sensor technology solutions (based on individual records) are still too expensive [9]. In addition, carcass quality (i.e., aspects related to fat and lean content) is used by the abattoir to reward or penalize producers and makes the delivery decision even more difficult. Thus, the research questions addressed in this paper are:
- RQ1: Is the inclusion of CO emissions penalizing optimal decisions regarding the delivery of fattened pig to the abattoir?
- RQ2: What is a reasonable margin of profit reduction in favor of a greener production?
- RQ3: Are the policy of deliveries to the abattoir affected by the inclusion of CO emissions?
- RQ4: Is there room for additional gains in reducing CO reduction preserving pig production efficiency?
Therefore, the aim of this paper is to explore conflicting objectives like revenues and CO emissions in fattening farms’ formulation and using a bi-objective mixed linear integer model to balance the revenue for sending the pigs to the abattoir optimally and accounting for the CO emissions during the fattening stage. The bi-objective model is based on the modeling approach presented by [8] and enriched with the information provided by the LCA of fattening farms presented by [6]. The response to global climate change has focused attention on the main sources of emissions with all significant sources coming under scrutiny, but neglecting many times the economic impact. This proposal represents a first approach to the consideration of CO emissions besides relevant pig herd management decisions.
It is structured as follows: In Section 2, a literature review with relevant papers by previous researchers is carried out. In Section 3, the problem of deliveries to the abattoir and the mathematical model are presented. The results and discussion are analyzed in Section 4. Finally, Section 5 presents the conclusions.
2. Literature Review
Optimizing PSC and, more precisely, the problem of optimizing the deliveries to the abattoir are not new in the literature [8]. For instance, ref. [10] modeled a simple PSC with several farms and abattoirs all belonging to one cooperative, while [11] formulated a model for the entire PSC that was then extended later with more features like the inclusion of AIAO management in fattening farms. The work in [7] considered an independent producer confronted with the optimal marketing of fattened pigs to multiple packers, while [12] were concerned with the procurement plan of a PSC and provided a schedule for deliveries to an abattoir looking for homogeneous pig sizes. The works in [13] and [14] proposed a model that took advantage of online live weight estimation telling the farmer, at the pen level, the number of pigs ready for marketing. Furthermore, ref. [14] considered feeding decisions affecting animal growth and carcass composition made during the fattening process. The work in [15] evaluated selected marketing policies under a limited number of scenarios and was able to identify the best one, but without solving the structured problem in general. Hence, ref. [8] asserted that the problem of optimal marketing of fattening pigs has been addressed mainly from a theoretical point of view, without practical application for the real world. This is not a criticism as such, because new technologies have to be adapted and new methods developed for the future, as [13,14] recognized. Although those models took into consideration economic and financially-related aspects like the marketing window, bonus and discount policies for valuing carcasses, feed conversion and growth rate, no other sustainable criteria like CO emissions were considered.
On the other hand, regarding the assessment of the environmental performance of the PSC, life cycle assessment (LCA) is one of the most widely-applied methodologies. Several applications of LCA regarding pig-production systems can be found in the literature [16] and in particular to fattening farms [6]. Notarnicola et al. [17] argued the need for dedicated modeling approaches for food production systems like PSCs. Several studies about the environmental profile of pig-meat production systems have revealed crucial factors like [18], who investigated the potential fossil-fuel energy and GHG (greenhouse gas) savings in pig farming in Europe. The analysis showed that pig farming in Europe presents a high potential for reducing fossil fuel use and GHG emissions. The work in [19] conducted an LCA study concluding that the environmental burdens related to the production and delivery of pig feed can be decreased by: (1) optimizing the fertilization of the crop-based ingredients; (2) utilizing more locally-produced feed ingredients; (3) reducing concentrations of metals like Cu and Zn in the feed; and (4) adopting cereals like wheat rather than maize as base feeds.
A review specifically about European LCA studies on pork production [20] mentioned that these assessments showed an average GWP (global warming potential) of 3.6 kg CO per kg of pork. The carbon footprint was emphasized by [21] as an indicator of the environmental impact of meat production (including pork). The main reason was related to animal feeding since a more efficient use of nitrogen leads to less eutrophying and acidifying substances being released into the environment and lower GHG emissions in nitrous oxide form, as well as increased productivity resulting in lower land requirements for feed production. Additional studies about the LCA of pig production are those by [22] in France; ref. [23] in Sweden with an emphasis on feed choice; ref. [24] regarding livestock protein feed production and the impact on land use and GHG emissions; ref. [25] in Portugal concerning the LCA of pig-meat production; ref. [26] in Denmark regarding an environmental assessment; ref. [27] regarding the environmental impact of 15 pig farming systems in the European Union Q-PorkChains project; ref. [28] in Spain concerning the water footprint of the pork industry; ref. [29] in Italy concerning the environmental impact of the typical heavy pig production; ref. [30] in Spain regarding the carbon and water footprints of the pork supply chain; ref. [31] in France about the environmental impact of extensive outdoor pig-production systems; and [6], focusing on the LCA of Spanish fattening farms.
This literature review for individual farms concludes that fattening farms are an important source of revenue and CO emissions for the PSC and pig production in general. While optimal deliveries of pigs to the abattoir has been studied from an economic point of view and also GHG emissions at this stage have been assessed, no studies have been found exploring together the managerial decision of delivering pig to the abattoir and derived CO emissions during the fattening process. Therefore, the analysis of greener practical proposals joining both perspectives (economic and environmental) is lacking.
3. Mathematical Modeling
3.1. The Optimal Delivery Problem
The production process in a PSC is structured into three phases (maternity, rearing and fattening) encompassing different agents or farmers. This situation can correspond to a private vertically-integrated company owning all or most of the farms, or a cooperative of associated producers who own one or several farms. In all cases, it is assumed the PSC operates under the general rules given by a PSC manager and followed by all farmers. In particular, fattening farms have to coordinate with the rest of the farms to free facilities from time to time to receive batches of pigs to be fattened under AIAO management. Decisions made at the PSC level may include the feeding regime, supply of medicines, veterinary assistance, control of entries and exits of animals from facilities, deliveries and transport to the abattoir, etc. In each phase, there is a set of specialized farms, i.e., breeding, rearing and fattening farms. The second phase focuses on rearing piglets born in breeding farms. Piglets from different rearing farms move to compound fattening batches assigned to different fattening farms belonging to the PSC. Transfers between farms and/or to the abattoir are performed by different trucks, often contracted to a third party by the PSC company. The capacity of the trucks depends on the type and the weight of animals, and it is subject to EU regulations.
Fattening farms are the last and most important stage of pig production before pigs are sold to the abattoir. We assume pigs are incorporated onto a farm under AIAO management. The impact of selling prices, bonus and penalization, besides the need to free facilities to keep the system producing, affect delivery decisions to the abattoir directly. Even when a batch of pigs is eating the same feed, individual growth is not uniform, and the animals reach marketing weight differently. This requires pigs to remain longer on the farm to gain the missing weight. This way, the emptying of a fattening farm occurs over a time window usually ranging for four weeks since the first delivery to the abattoir. A longer fattening period implies higher feeding cost and CO emissions. In addition, truck CO emissions depend on the size and capacity of each type of truck represented by its fuel consumption. However, the growth and carcass values can increase, thus making the delay beneficial. Each abattoir applies bonuses or discounts to the base price according to the live weight and quality of the carcass (percentage of lean meat). Carcasses are sorted using the SEUROPclassification method (Commission Regulation (EC) No.1249/2008), which is mandatory in the European Union (EU), but also required in countries exporting to the EU. Transport and feeding have an impact in terms of CO emissions throughout the PSC, and the fattening farms are the most significant stage [6].
3.2. The Optimization Model
In this section, we present the formulation of the bi-objective optimization model for the deliveries to the abattoir.
3.2.1. Indices and Sets
- t ∈ T,
- Index (in weeks) the fattening period is divided into, .
- i ∈ P,
- Index of partitions to cluster pigs into growth categories .
- k ∈ K,
- Index of types of truck .
3.2.2. Parameters
- N,
- Batch size representing the number of pigs moved to the fattening farms.
- ni,
- Cluster of growth category i, in which the initial batch was partitioned.
- ,
- Mean value of the live weight of pigs (kg) in the growth category i at week t. We assume the live weight of the batch follows a normal distribution, ).
- ω,
- Selling price, € per kg of carcass weight.
- ,
- Cumulative feed intake average (kg) by a pig in growth category i until week t.
- ,
- Bonus given by the abattoir (€/kg of carcass weight) as a function of growth category i at week t.
- δ,
- cost in Euros per kg of feed intake.
- λk,
- Fixed cost in Euros for trucks of type k sent to the abattoir.
- αi,
- Cost in Euros for other expenses in the system for growth category i, such as vets and medicines.
- ξ,
- Cost in Euros per young pig purchased.
- ψk,
- Capacity of trucks of type k in number of animals.
- τk,
- Capacity of trucks of type k in kilograms of load.
- ϱit,
- Carcass weight per growth category i at week t.
- κ,
- kg CO -eq per kg of meat produced.
- v,
- Euros per kg of CO .
- γk,
- Emissions kg CO per trip and k-truck type
- φ,
- Weight for the bi-objective function ().
3.2.3. Decision Variables
- xit,
- Number of pigs from partition i to be sent to the abattoir in fattening week t.
- ykt,
- Integer variable with the number of trucks of type k needed at week t to ship pigs.
- zit,
- Inventory of pigs for partition i at the beginning of the fattening week t.
- hit,
- Binary variable with a value of one when pigs from two consecutive partitions (, i) are sent to the abattoir, zero otherwise.
- dit,
- Binary variable with a value of one when pigs from partition i at week t are sent to the abattoir, zero otherwise.
- wit,
- Live weight when animals are sent to abattoir.
3.2.4. Objective Function
The objective Function (1) represents the profit from the pigs delivered to the abattoir and the CO emissions from the pigs on the fattening farm and trucks during transport.
The aim is to maximize the profits from the pigs delivered to the abattoir and minimize the CO emissions. To do so, assigns a weight for each objective being the optimal maximization of the profit and the optimal minimization of the CO emissions. Profit is calculated by the total of sales value minus the corresponding production cost. On the other hand, CO emissions are calculated summarizing the total CO emissions produced by the total kg of meat in week t per category i and by the trucks used for transport.
3.2.5. Constraints
Constraint (2) fixes the initial inventory of pigs per growth category i in the first week. Constraint (3) establishes a limit for the deliveries no higher than the current inventory, while Constraint (4) determines the binary variable for ensuring all pigs in the i growth category at week t need to be sold before selling pigs from category (lighter pigs). Constraint (5) updates the inventory for each category for the following week . Constraint (6) forces selling all the pigs in the current batch to be sold by the end of the marketing window (week ). This is necessary to meet the AIAO management requirements. Constraints (7) and (8) determine the number of trucks of each type needed to deliver pigs to the abattoir, taking into account the capacity of the trucks in terms of the number of animals and kilos of load. Constraint (9) determines whether a group of pigs in growth category i at time t must be sent to the abattoir or not. Constraints (10) and (11) link the binary variables and to force the delivery of heavier pigs first. Constraint (12) controls the live weight for the animals to be sent to the abattoir in order to manage the CO emissions.
4. Results and Discussion
4.1. Default Parameters
The parameters representing a vertically-integrated Spanish fattening farm operating under AIAO management with a batch N of 1000 pigs was considered. A marketing window of five weeks was also considered as the maximum. However, the model itself started to deliver pigs once they were profitable. Piglets were entered to the fattening farm at the age of nine weeks and stayed on the fattening farm between 10 and 17 additional weeks. We divided the batch of pigs into ten growth partitions P representing different weight categories derived from a normal distribution. Table 1 shows the mean and standard deviation of live weight and accumulated feed intake by week t.
Weekly pigs costs are considered from [32] with a cost per pig purchase of 40.55€. The weekly feeding cost is established at 0.28€/kg. Other related costs per pig are fixed to 21€ per pig. The transport of finished pigs considered four different types of trucks with the characteristics detailed in Table 2. The emissions were estimated for an abattoir located 100 km from the farm and considering an interurban trip. Estimated CO emissions per type of truck were taken from the official website [33].
The income is calculated by considering the base price of the abattoir referring usually to the price fixed in the auction market in Mercolleida (Spain), the most important in Spain. In this case, €/kg. In practice, carcass information is detailed individually and given to the producer after each delivery has been slaughtered. Table 3 shows the distribution of bonuses and discounts in the SEUROP classification to determine the final price value.
Finally, the price per CO , , is set at 0.01275€/kg according to [34] with set at 5.5 kilos of CO per kilo of meat produced, which is the worst case considered by [6]. This way, the bi-objective function is expressed in homogeneous units for both objectives.
The model was developed with IBM ILOG CPLEX Optimization Studio that includes OPL, a modeling language, and solved using CPLEX v12.8 on a Pentium 4 CPU at 2.1 GHz and 16 GB RAM. Microsoft Excel was used for data storage for both the input and output parameters due its user friendliness and flexibility when managing the data and the easy linkage to CPLEX.
In order to make an informed decision, the model was solved for different values of and considering a marketing time window of five weeks. Depending on the relative importance given by the decision maker to the two objectives, a different marketing plan will be proposed. In this sense, the fleet of trucks available may give flexibility in pig transport if capacities are different. To summarize the information given by the model, we present two type of graphics in Figure 1: (a) the distribution of the number of animals (in percentage) sent to the abattoir each week and (b) the number of trucks of each type employed.
4.2. Maximizing Revenues and Minimizing CO Emissions
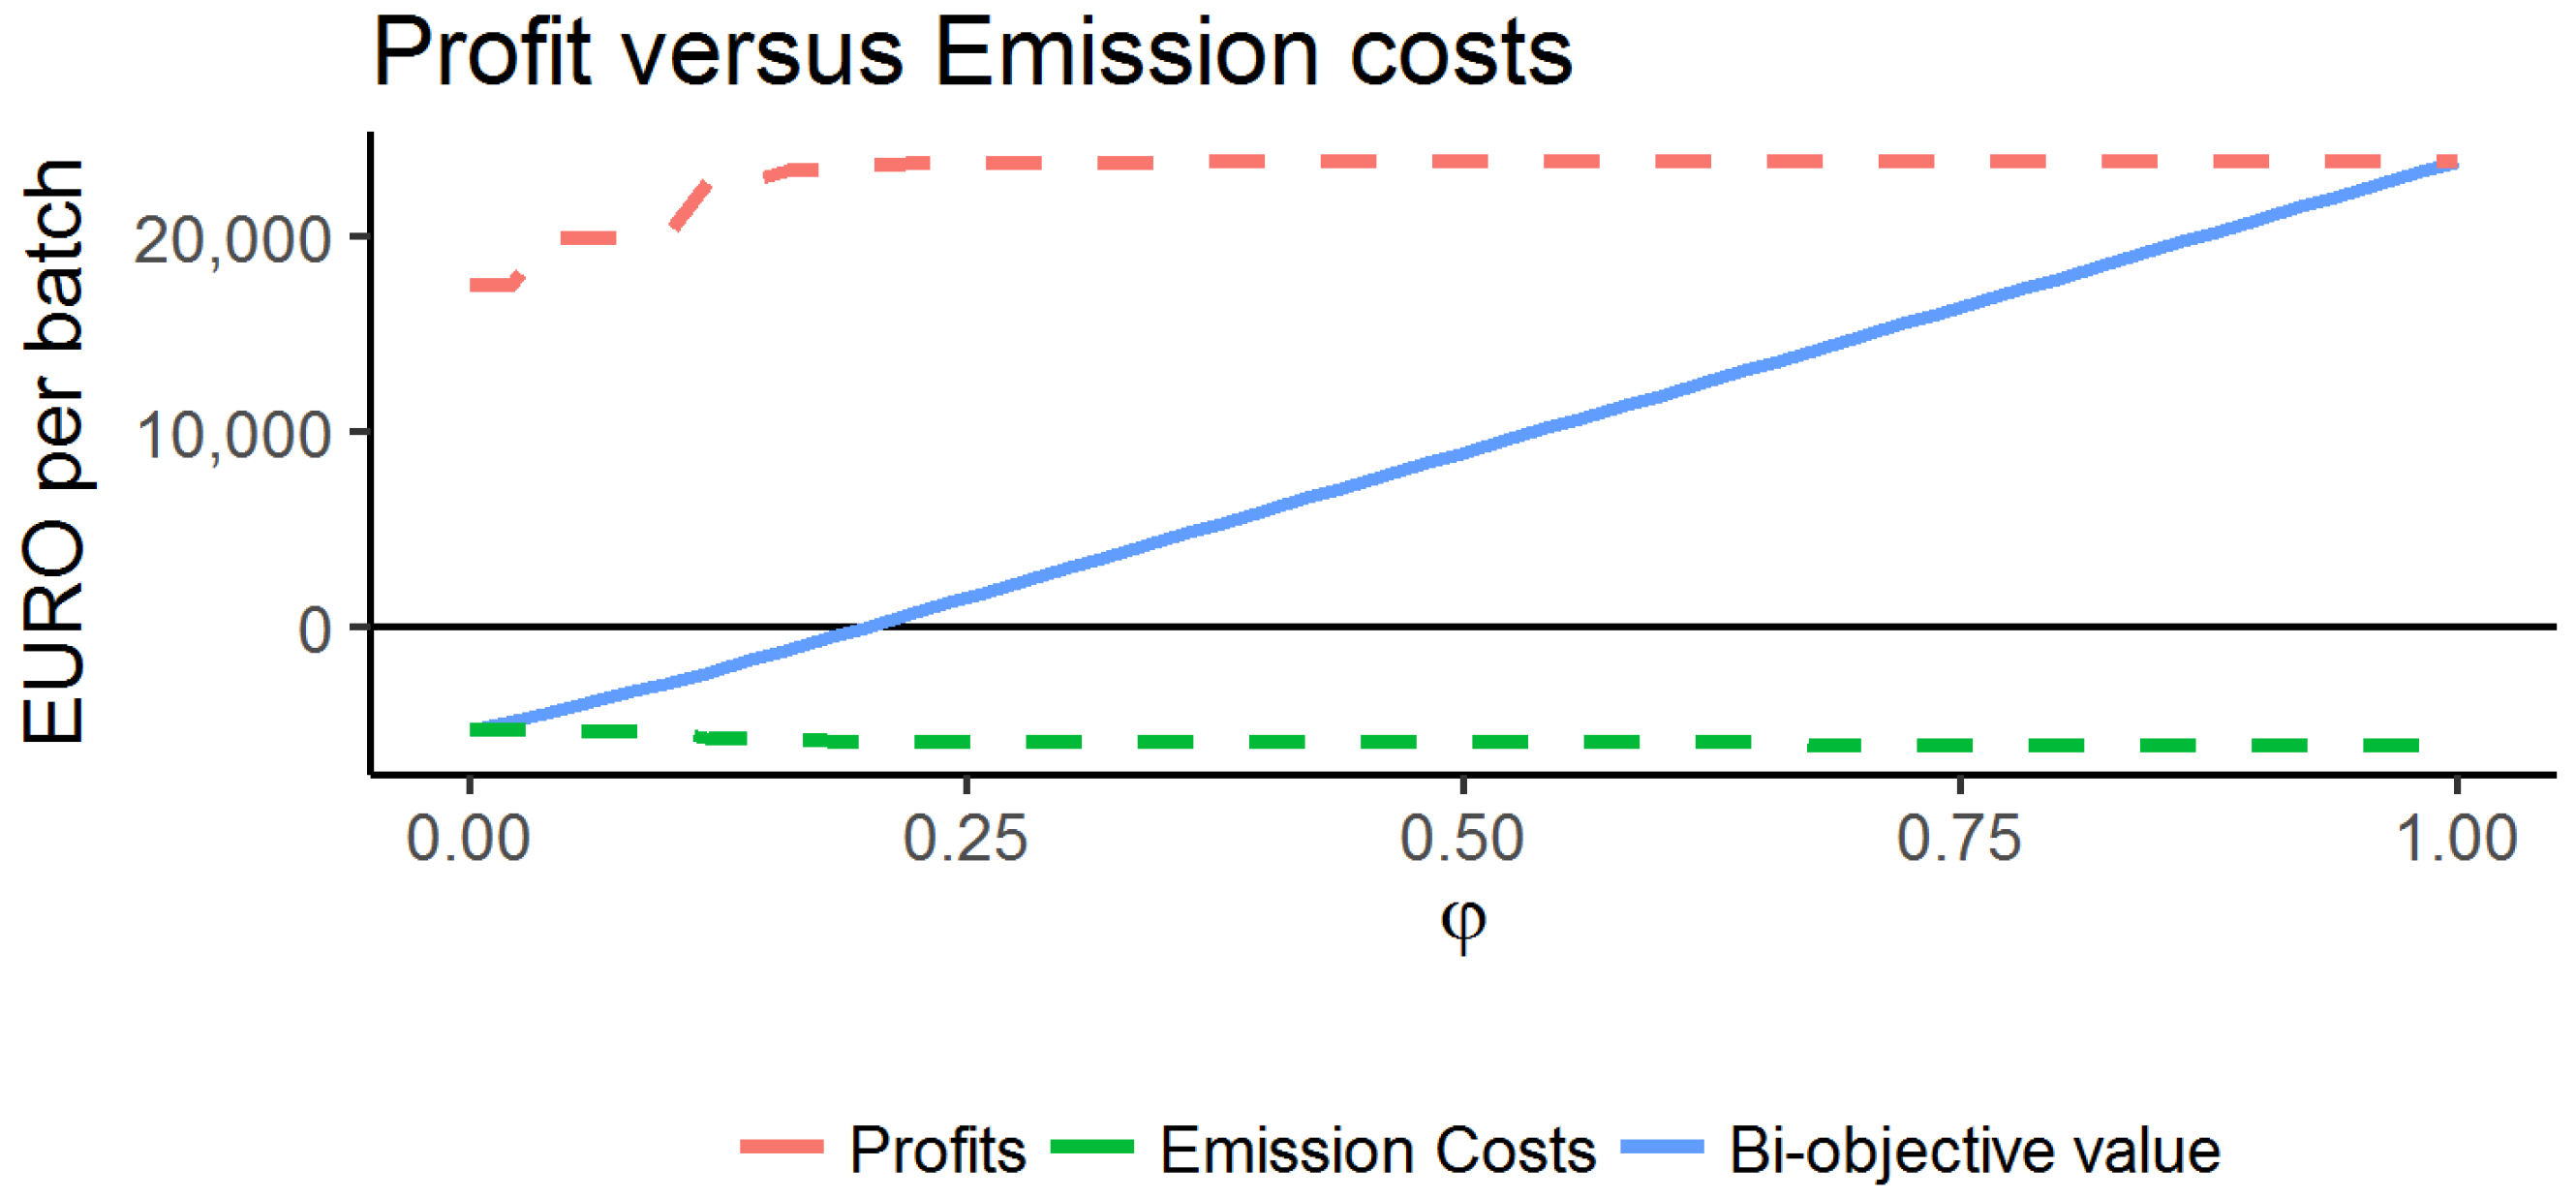
To analyze the impact and relationship between profit and the CO emissions, we generated a total of 51 different instances s by increasing by 0.02. Each instance represents a linear convex combination of the two objective functions. As a result, the different combinations ranged from (giving the most environmental optimum) to (giving the most profitable optimum). Figure 1 shows this outcome, particularly the distribution of the number of animals sent each week (Figure 1a), and we can appreciate how under the minimization of emissions, all pigs were sent to the abattoir as soon as possible. Otherwise, if only revenues are maximized, then most of the pigs are sent to the abattoir in Week #17 according to the base parameters considered. This scheduling involves different means of transport ranging from the less polluting to the least expensive ones (Figure 1b). Regarding the observed outcomes for both objective functions, Figure 2 shows the relationship between profit and CO costs for each . In the case of only taking the CO emissions into consideration, i.e., , the model presented less profits. This was produced because the model sent all the pigs to the abattoir in the first week to reduce CO emissions in feeding as much as possible (see Figure 1b). Profits, then, were reduced by 26.68%. On the contrary, when (maximizing the profit), the CO emissions were not taken into consideration, and therefore, the model maximized only the profit allocating trucks only regarding cost and no other considerations.
On the other hand, Table 4 shows the relationship between maximizing the profit and minimizing CO emissions depending on . The table shows that did not affect the profit or CO emissions for . Furthermore, it was noted that for small , the reduction of the cost of CO emissions is higher than the reduction of the profit. This relationship changed when . In other words, the effort to decrease the cost of CO was relatively higher in terms of profit. Hence, the with a profit of 22,821 Euros and a cost of 5685 Euros in CO emissions was used as a reference. These results confirmed that the level of CO emissions does not increase to the same extent as profit can. Note that additional reductions in CO emissions would be feasible considering different diets and manure management systems not considered in this paper.
In terms of deliveries to the abattoir, Table 5 shows the schedule for different and how CO emissions may affect the scheduling and selection of the means of transport. As seen when , all the animals must be sent to the abattoir as soon as possible to minimize emissions. This is in the first week of the marketing window because the model does not take the profits into consideration. Meanwhile, increases with the deliveries becoming later as profit has priority over the CO emissions, the maximum profit and maximum cost of the CO emission being reached with in contrast with , which was the better profit vs. CO emissions balance found.
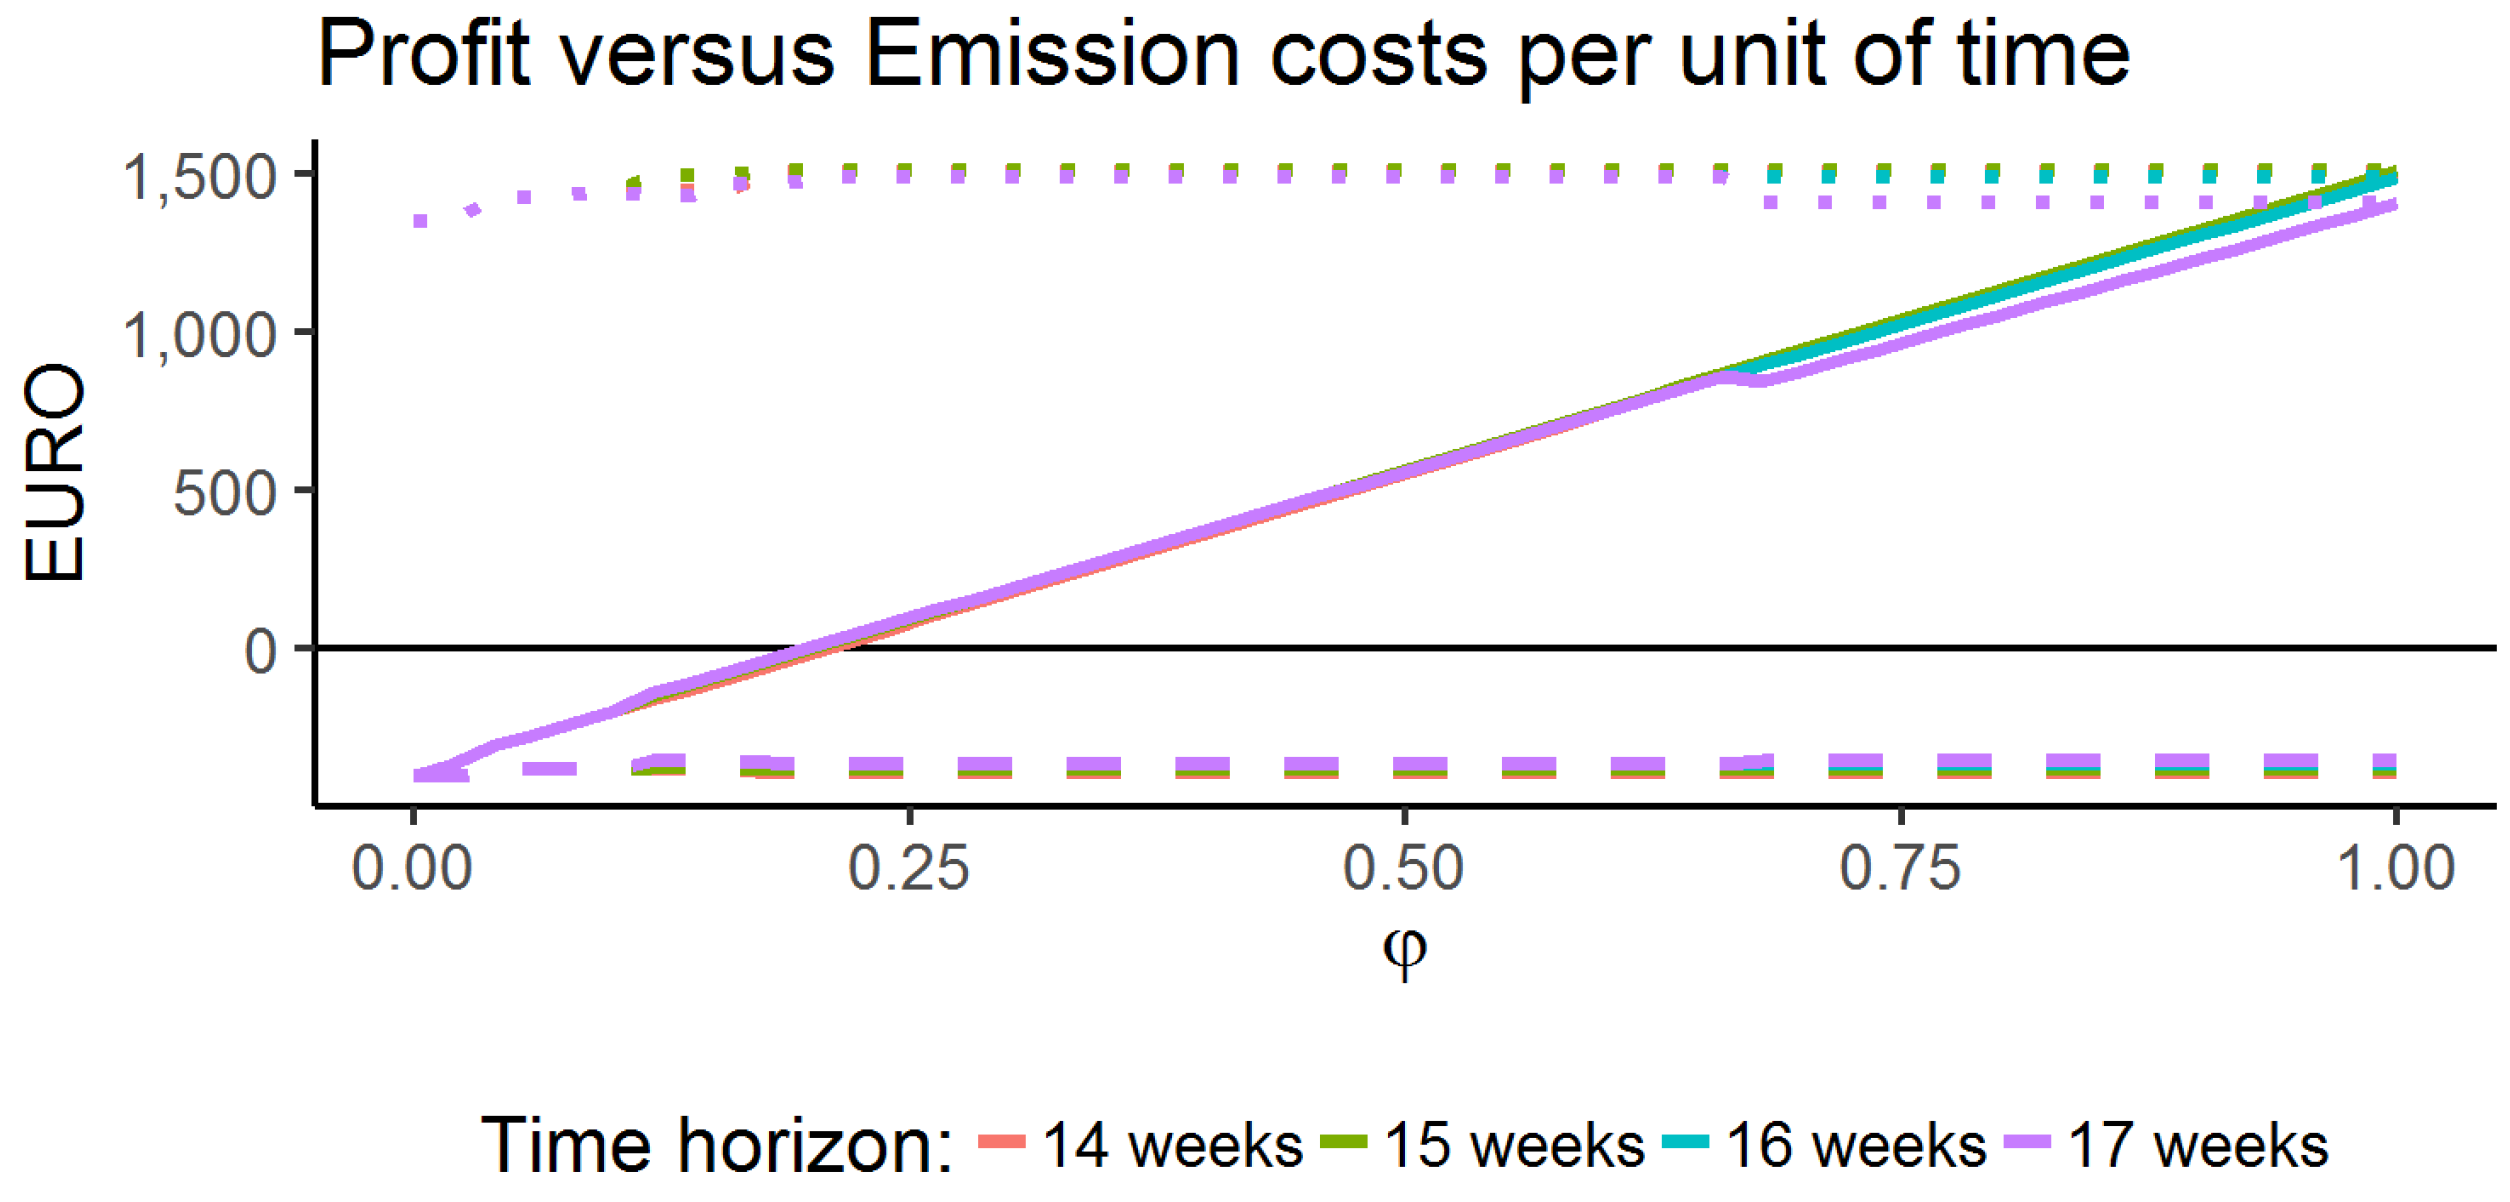
Figure 3 shows the expected profit earned on average per week considering different time horizons associated with different marketing windows. The initial optimal solution allowed fattening pigs for a maximum of 17 weeks with no extra revenues for additional weeks. This maximum, and corresponding time window, was reduced week by week to shorter time horizons of up to 14 weeks. We investigated the Euro per day reward for each time horizon. This way we look for the optimal fattening duration, not just for a single batch of pigs, but rather, in the optimal value per unit of time. Then, while we observed that the maximum profit per batch is obtained when 17 weeks is the maximum time a pig can stay on the farm, looking at the profit per week generated by the batch, the maximum is obtained at 15 weeks. With regards to the CO emissions, these are minimized with shorter time horizons due to the linearity of the function. This result is explained by the fact that shorter time horizons produce less meat in total, and consequently, there is a lower footprint.
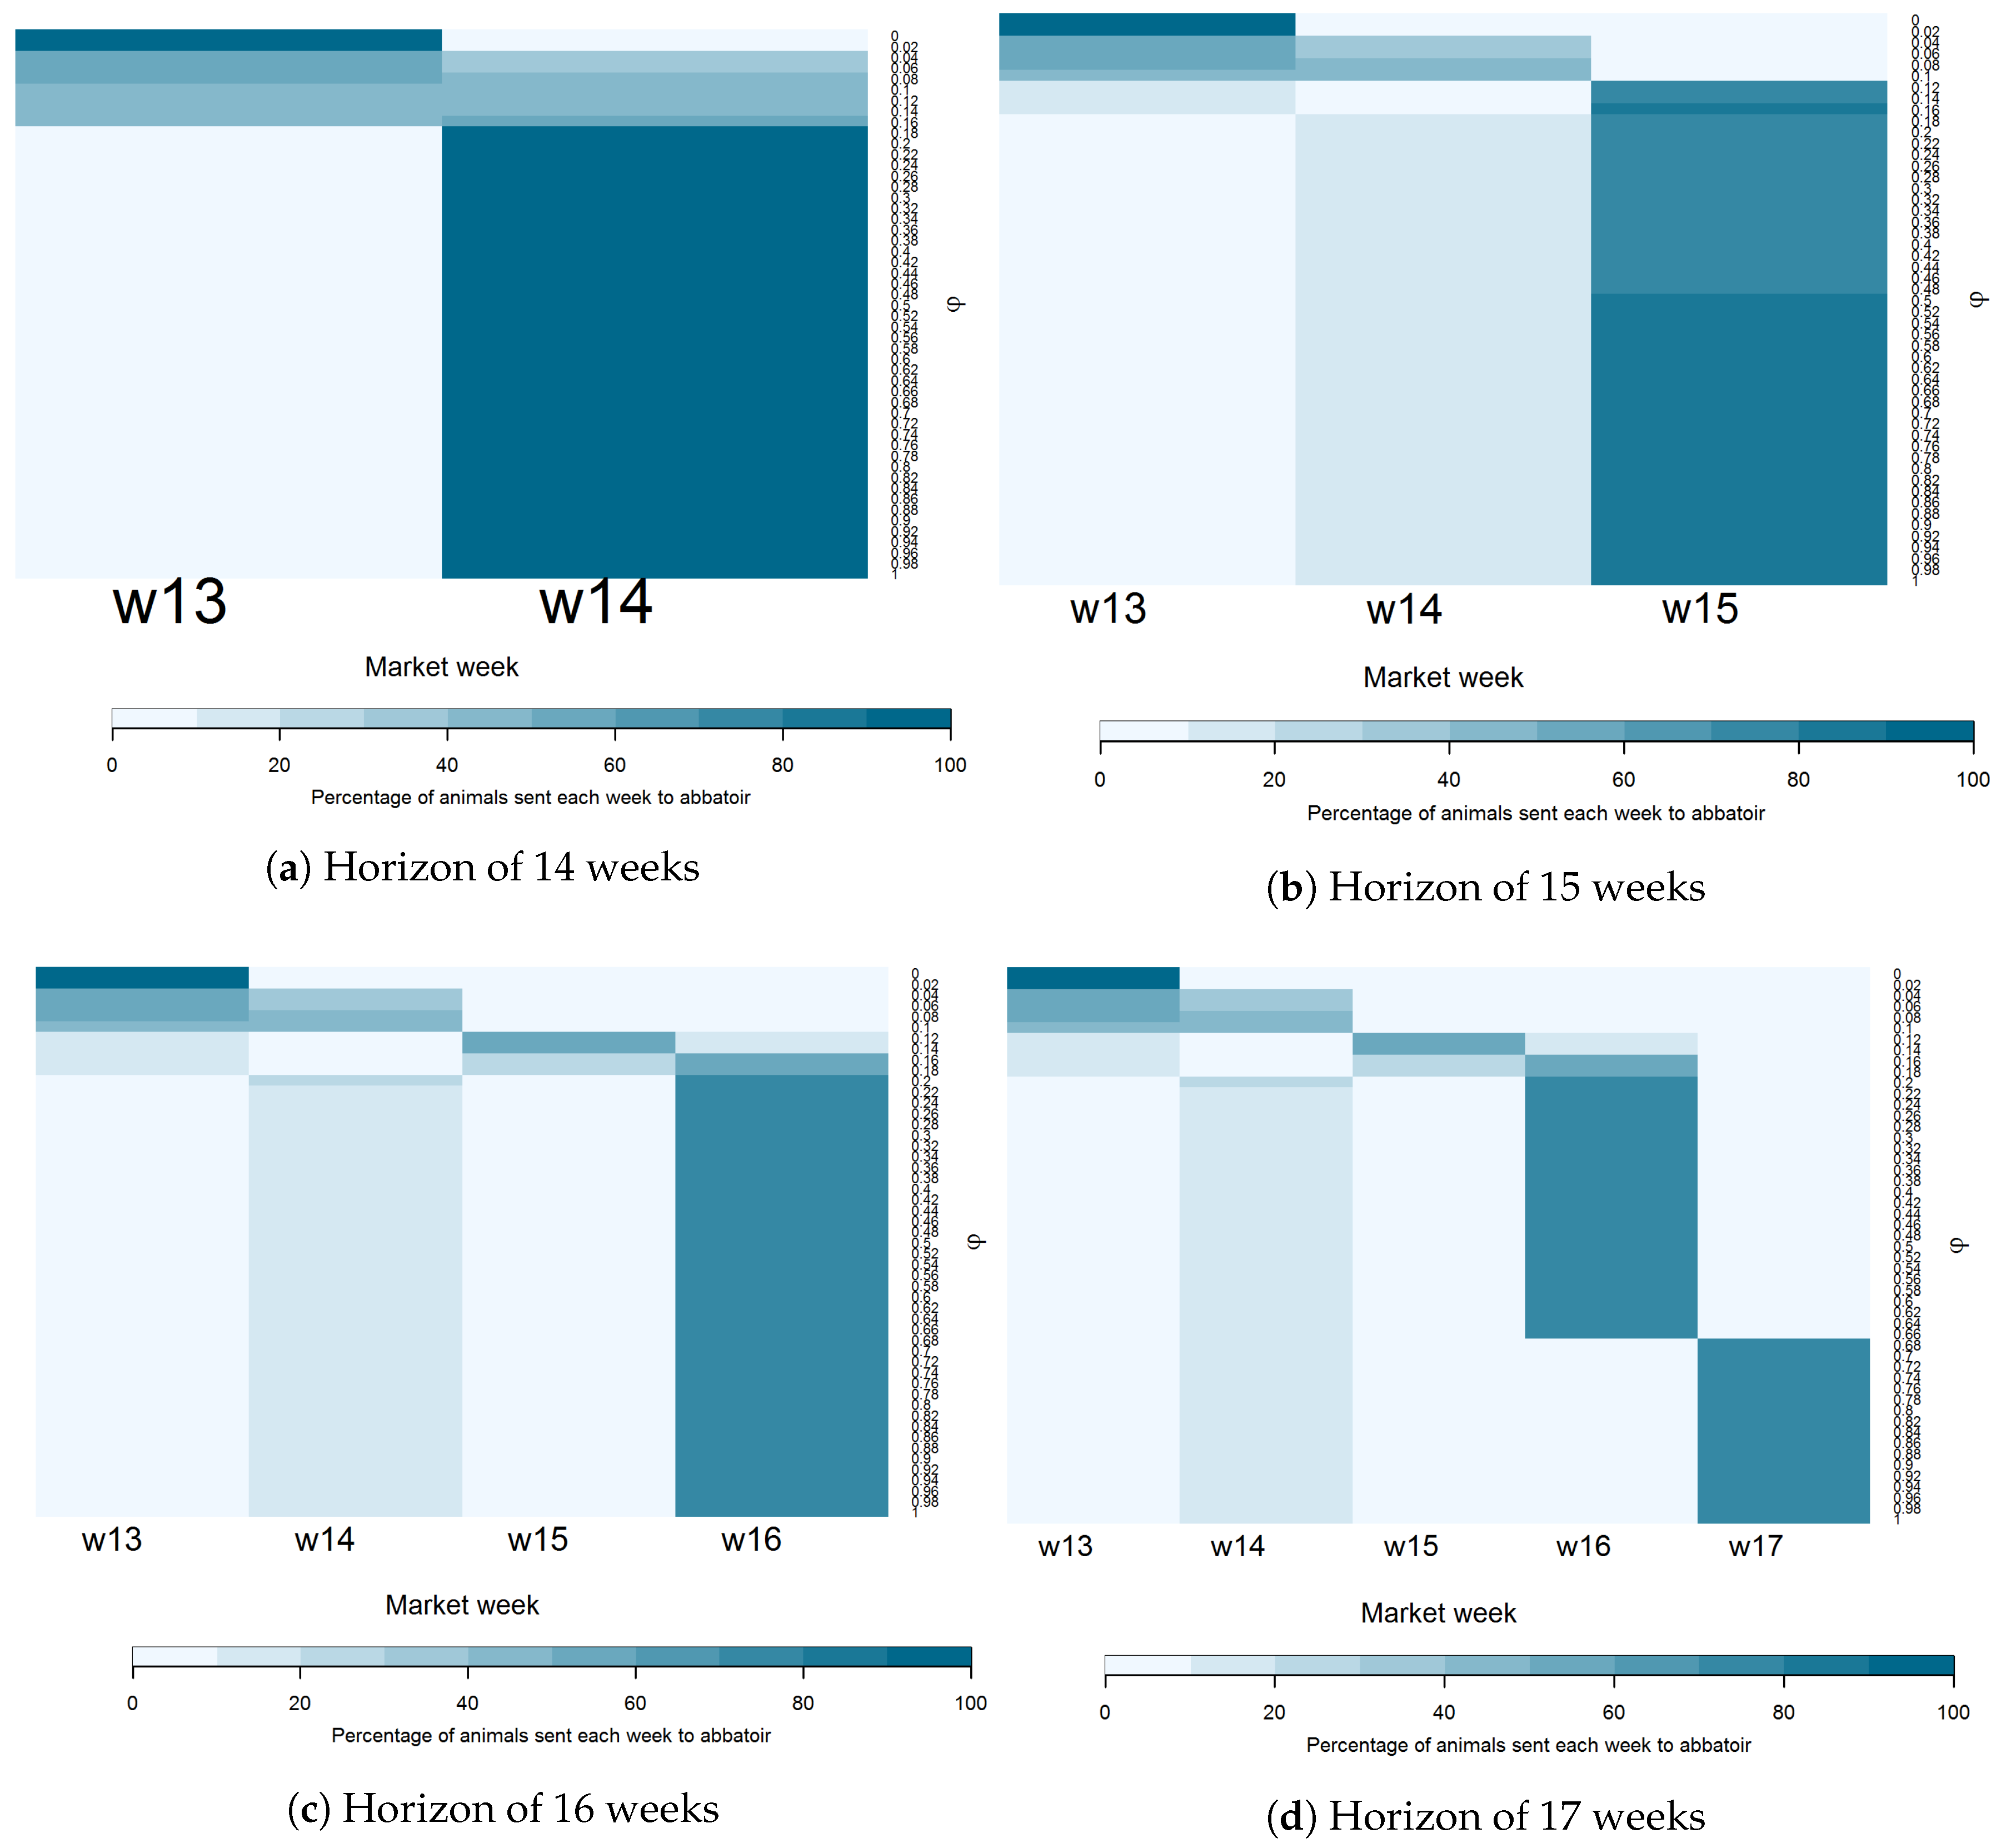
With regard to different time horizons analyzed, Figure 4 shows the patterns observed in the solutions obtained for different values of . We can appreciate how the effect of including the emission costs suggests a range of diverse solutions depending on the weight given to each goal. The range of solutions observed is enlarged with the time horizon allowed. For the shortest horizon (14 weeks), the solutions are mostly either to sell everything in Week 13 (when the goal is to minimize emissions) or to sell the whole batch in Week 14 (when the weight of the profit is above ). On the other hand, when the time horizon is 17 weeks, the marketing plan of selling the whole batch in Week 14 happens only when the goal is to focus on minimizing emissions. When the time horizon is 17 weeks, the set of solutions changes gradually up to the point of selling around 20% of the animals in the batch in Week 14 and the rest in Week 17.
5. Conclusions
Deliveries of fattened pigs to the abattoir comprise one of the most important activities in the PSC and have received attention from the managerial point of view. This paper highlights their importance according to previous research works and states the environmental concern, which is increasing in the pig sector mainly because of environmental awareness among producers and the social attitudes of consumers. No studies were found that combined economic and environmental assessment approaches together for fattening farms. Our contribution relies on a bi-objective mixed integer programming model able to optimize the deliveries of the pigs to the abattoir taking the CO emissions into consideration. In agreement with the literature, feeding and transport by trucks are the main sources of emissions considered. The bi-objective model maximizes profits and minimizes CO emissions, thus helping managers to find a compromise between these two conflicting objectives.
We only emphasize profit, as economic driving tends to involve higher CO emissions that are not proportional to the final revenue achieved. That is, the level of CO emissions does not increase to the same extent as profit can. We demonstrated that for a single farm and a single batch, it is possible to decrease the CO emissions by 6.05%, which represents a penalty of 4.48% of the total revenue. Therefore, the multiplicative effect over the entire PSC represented by a cooperative or a large integrator would have a bigger impact. Note that additional reductions in CO emissions would be feasible considering different diets and manure management systems not considered in this paper.
Author Contributions
E.N.-R. participated in the formal analysis, investigation and writing of the original and subsequent draft versions. A.P.-B. participated especially in the conceptualization, formal analysis, methodology, validation and visualization of results. L.M.P.-A. participated in the conceptualization, data curation methodology, supervision, validation and reviewing and editing of the final version of the manuscript. All authors have read and approved the final manuscript.
Funding
This research was partially funded by CYTED Grant Number 516RT0513.
Acknowledgments
A.P.-B. and L.M.P.-A. are members of the excellence research group 2017-SGR1193 supported by the Autonomous Government of Catalonia.
Conflicts of Interest
The authors declare no conflict of interest.
References
- Rodríguez, S.V.; Plà, L.M.; Faulin, J. New opportunities in operations research to improve pork supply chain efficiency. Ann. Oper. Res. 2014, 219, 5–23. [Google Scholar] [CrossRef]
- Petit, G.; Sablayrolles, C.; Yannou-Le Bris, G. Combining eco-social and environmental indicators to assess the sustainability performance of a food value chain: A case study. J. Clean. Prod. 2018, 191, 135–143. [Google Scholar] [CrossRef]
- Vorst, J.G.; da Silva, C.A.; Trienekens, J. Agro-Industrial Supply Chain Management: Concepts and Applications; Agricultural Management, Marketing and Finance Occasional Paper; Food and Agriculture Organization of the United Nations: Rome, Italy, 2007; Volume 17. [Google Scholar]
- Rodríguez-Sánchez, S.V.; Plà-Aragonés, L.M.; Albornoz, V.M. Modeling tactical planning decisions through a linear optimization model in sow farms. Livest. Sci. 2012, 143, 162–171. [Google Scholar] [CrossRef]
- Perez, C.; Castro, R.D.; Furnols, M.F.I. The pork industry: A supply chain perspective. Br. Food J. 2009, 111, 257–274. [Google Scholar] [CrossRef]
- Lamnatou, C.; Ezcurra-Ciaurriz, X.; Chemisana, D.; Plà-Aragonés, L.M. Environmental assessment of a pork-production system in North-East of Spain focusing on life-cycle swine nutrition. J. Clean. Prod. 2016, 137, 105–115. [Google Scholar] [CrossRef]
- Ohlmann, J.; Jones, P. An integer programming model for optimal pork marketing. Ann. Oper. Res. 2011, 190, 271–287. [Google Scholar] [CrossRef]
- Rodriguez-Sanchez, S.; Pla-Aragones, L.M.; de Castro, R. Insights to Optimise Marketing Decisions on Pig Fattening Farms. Anim. Prod. Sci. 2018, in press. [Google Scholar]
- Plà-Aragonés, L.M.; Rodríguez-Sánchez, S.V.; Rebillas-loredo, V. A mixed integer linear programming model for optimal delivery of fattened pigs to the abattoir. J. Appl. Oper. Res. 2013, 5, 164–175. [Google Scholar]
- Balogh, P.; Ertsey, I.; Fenyves, V.; Nagy, L. Analysis and optimization regarding the activity of a Hungarian Pig sales and Purchased Cooperation. Stud. Agric. Econ. 2009, 109, 35–54. [Google Scholar]
- Nadal-Roig, E.; Plà, L.M. Multiperiod planning tool for multisite pig production systems. J. Anim. Sci. 2014, 92, 4154–4160. [Google Scholar] [CrossRef] [PubMed]
- Khamjan, S.; Piewthongngam, K.; Pathumnakul, S. Pig procurement plan considering pig growth and size distribution. Comput. Ind. Eng. 2013, 64, 886–894. [Google Scholar] [CrossRef]
- Kristensen, A.R.; Nielsen, L.; Nielsen, M.S. Optimal slaughter pig marketing with emphasis on information from on-line live weight assessment. Livest. Sci. 2012, 145, 95–108. [Google Scholar] [CrossRef]
- Pourmoayed, R.; Nielsen, L.R.; Kristensen, A.R. A hierarchical Markov decision process modeling feeding and marketing decisions of growing pigs. Eur. J. Oper. Res. 2016, 250, 925–938. [Google Scholar] [CrossRef]
- Li, N.; Preckel, P.V.; Foster, K.A.; Schinckel, A.P. Analysis of economically optimal nutrition and marketing strategies for Paylean® usage in hog production. J. Agric. Resour. Econ. 2003, 28, 272–286. [Google Scholar]
- McAuliffe, G.A.; Chapman, D.V.; Sage, C.L. A thematic review of life cycle assessment (LCA) applied to pig production. Environ. Impact Assess. Rev. 2016, 56, 12–22. [Google Scholar] [CrossRef]
- Notarnicola, B.; Sala, S.; Anton, A.; McLaren, S.J.; Saouter, E.; Sonesson, U. The role of life cycle assessment in supporting sustainable agri-food systems: A review of the challenges. J. Clean. Prod. 2017, 140, 399–409. [Google Scholar] [CrossRef]
- Nguyen, T.L.T.; Hermansen, J.E.; Mogensen, L. Fossil energy and GHG saving potentials of pig farming in the EU. Energy Policy 2010, 38, 2561–2571. [Google Scholar] [CrossRef]
- Van Der Werf, H.M.; Petit, J.; Sanders, J. The environmental impacts of the production of concentrated feed: The case of pig feed in Bretagne. Agric. Syst. 2005, 83, 153–177. [Google Scholar] [CrossRef]
- Reckmann, K.; Traulsen, I.; Krieter, J. Life Cycle Assessment of pork production: A data inventory for the case of Germany. Livest. Sci. 2013, 157, 586–596. [Google Scholar] [CrossRef]
- Röös, E.; Sundberg, C.; Tidåker, P.; Strid, I.; Hansson, P.A. Can carbon footprint serve as an indicator of the environmental impact of meat production? Ecol. Indic. 2013, 24, 573–581. [Google Scholar] [CrossRef]
- Basset-Mens, C.; Van Der Werf, H.M. Scenario-based environmental assessment of farming systems: The case of pig production in France. Agric. Ecosyst. Environ. 2005, 105, 127–144. [Google Scholar] [CrossRef]
- Eriksson, I.S.; Elmquist, H.; Stern, S.; Nybrant, T. Environmental systems analysis of pig production—The impact of feed choice. Int. J. Life Cycle Assess. 2005, 10, 143–154. [Google Scholar] [CrossRef]
- Sasu-Boakye, Y.; Cederberg, C.; Wirsenius, S. Localising livestock protein feed production and the impact on land use and greenhouse gas emissions. Anim. Int. J. Anim. Biosci. 2014, 8, 1339–1348. [Google Scholar] [CrossRef] [PubMed]
- González-García, S.; Belo, S.; Dias, A.C.; Rodrigues, J.V.; Costa, R.R.D.; Ferreira, A.; Andrade, L.P.D.; Arroja, L. Life cycle assessment of pigmeat production: Portuguese case study and proposal of improvement options. J. Clean. Prod. 2015, 100, 126–139. [Google Scholar] [CrossRef]
- Dalgaard, R.; Halberg, N.; Hermansen, J. Danish Pork Production: An Environmental Assessment. DJF Anim. Sci. 2007, 82, 1–34. [Google Scholar]
- Dourmad, J.Y.; Ryschawy, J.; Trousson, T.; Bonneau, M.; Gonzalez, J.; Houwers, H.W.J.; Hviid, M.; Zimmer, C.; Nguyen, T.L.T.; Morgensen, L. Evaluating environmental impacts of contrasting pig farming systems with life cycle assessment. Anim. Int. J. Anim. Biosci. 2014, 8, 2027–2037. [Google Scholar] [CrossRef] [PubMed]
- De Miguel, Á.; Hoekstra, A.Y.; García-Calvo, E. Sustainability of the water footprint of the Spanish pork industry. Ecol. Indic. 2015, 57, 465–474. [Google Scholar] [CrossRef]
- Bava, L.; Zucali, M.; Sandrucci, A.; Tamburini, A. Environmental impact of the typical heavy pig production in Italy. J. Clean. Prod. 2017, 140, 685–691. [Google Scholar] [CrossRef]
- Noya, I.; Aldea, X.; Gasol, C.M.; González-García, S.; Amores, M.J.; Colón, J.; Ponsá, S.; Roman, I.; Rubio, M.A.; Casas, E.; et al. Carbon and water footprint of pork supply chain in Catalonia: From feed to final products. J. Environ. Manag. 2016, 171, 133–143. [Google Scholar] [CrossRef] [PubMed]
- Espagnol, S.; Demartini, J. Environmental impacts of extensive outdoor pig production systems in Corsica. In Proceedings of the 9th International Conference on Life Cycle Assessment in the Agri-Food Sector (LCA Food 2014), San Francisco, CA, USA, 8–10 October 2014; pp. 364–371. [Google Scholar]
- Grupo de gestión porcina Departamento de Producción Animal, U. L’ Observatori del Porcí, Annual Report. 2015. Available online: http://agricultura.gencat.cat/web/.content/de_departament/de02_estadistiques_observatoris/08_observatoris_sectorials/04_observatori_porci/informes_anuals/fitxers_estatics/CAT_Informe-sector-porci-2015_20160814.pdf (accessed on 24 April 2018).
- Oficina Catalana del Cambio Climàtic. Guía de cálculo de emisiones de gases de efecto invernadero. Available online: http://canviclimatic.gencat.cat/es/redueix_emissions/com-calcular-emissions-de-geh/guia_de_calcul_demissions_de_co2/ (accessed on 24 April 2018).
- European Energy Exchange AG. Available online: https://www.eex.com/en/market-data/environmental-markets/spot-market/european-emission-allowances (accessed on 24 April 2018).
Figure 1.
Summary of the solution obtained for different values of . (a) Distribution of the number of animals sent each week; (b) type of truck used.
Figure 1.
Summary of the solution obtained for different values of . (a) Distribution of the number of animals sent each week; (b) type of truck used.
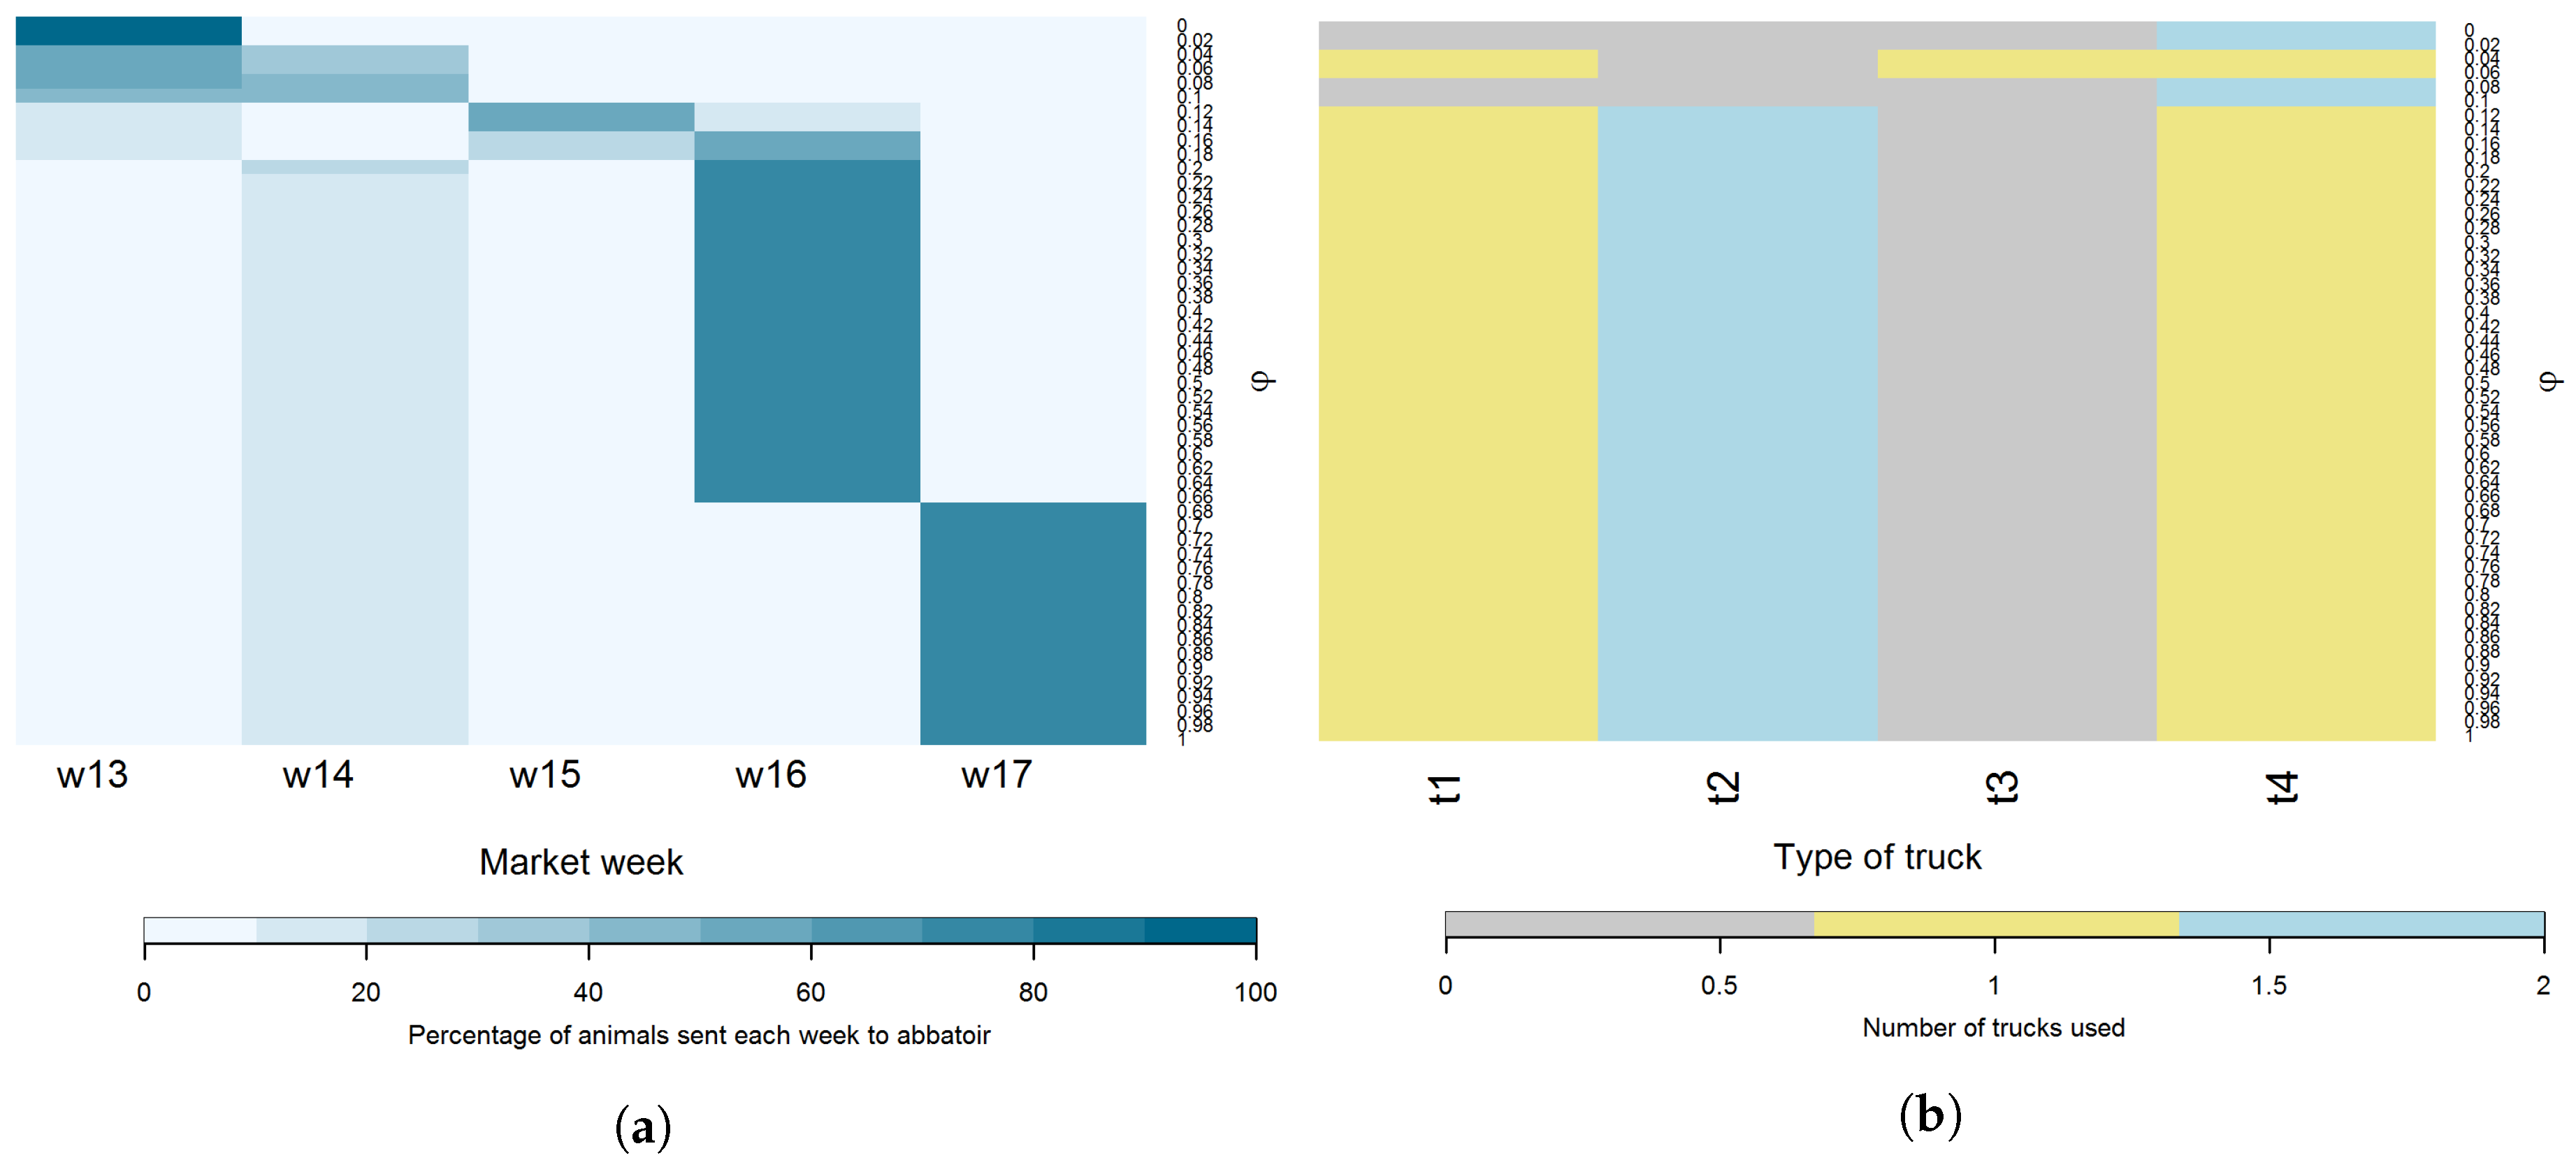
Figure 2.
Expected profit versus emission costs and weighted bi-objective function value for different values of .
Figure 2.
Expected profit versus emission costs and weighted bi-objective function value for different values of .

Figure 3.
Expected profit versus emission costs and weighted bi-objective function value per week for different values of and different time horizons.
Figure 3.
Expected profit versus emission costs and weighted bi-objective function value per week for different values of and different time horizons.

Figure 4.
Distribution of the number of animals sent each week for different values of and different market windows.
Figure 4.
Distribution of the number of animals sent each week for different values of and different market windows.

Table 1.
Mean and standard deviation of live weight and accumulated feed intake by week t.
| Age (Week) | Weight (kg) Mean | SD | Intake (kg) Mean | SD |
|---|---|---|---|---|
| 1 | 29.7 | 3.9 | 5.1 | 5.5 |
| 2 | 33.4 | 4.6 | 12.1 | 8.5 |
| 3 | 37.8 | 5.4 | 20.5 | 12.1 |
| 4 | 42.6 | 6.3 | 30.2 | 15.9 |
| 5 | 47.9 | 7.4 | 41.3 | 19.7 |
| 6 | 53.5 | 8.4 | 53.4 | 23.6 |
| 7 | 59.3 | 9.5 | 66.4 | 27.5 |
| 8 | 65.3 | 10.6 | 80.3 | 31.4 |
| 9 | 71.3 | 11.8 | 94.9 | 35.3 |
| 10 | 77.4 | 12.9 | 110.1 | 39.2 |
| 11 | 83.4 | 14.0 | 125.7 | 43.2 |
| 12 | 89.2 | 15.2 | 141.6 | 47.1 |
| 13 | 94.8 | 16.3 | 157.6 | 51 |
| 14 | 100 | 17.5 | 173.7 | 54.9 |
| 15 | 104.8 | 18.7 | 189.6 | 58.9 |
| 16 | 109.1 | 19.8 | 205.3 | 62.8 |
| 17 | 112.8 | 21.0 | 220.6 | 66.7 |
Table 2.
Characteristic of the trucks available for transportation.
| T1 | T2 | T3 | T4 | |
|---|---|---|---|---|
| Capacity () | 50 | 220 | 440 | 550 |
| Cost per trip () | 125 | 475 | 900 | 1000 |
| Emissions kg CO /trip () | 28.25 | 66.30 | 57.99 | 79.14 |
Table 3.
Bonuses based on the SEUROP classification distribution and weight (live and carcass).
| S | E | U | R | O | P | Live Weight (kg) | Carcass Weight (kg) |
|---|---|---|---|---|---|---|---|
| 0.57 | 0.28 | 0.12 | 0.03 | 0.00 | 0.00 | 50 | 39.4 |
| 0.55 | 0.27 | 0.14 | 0.04 | 0.00 | 0.00 | 55 | 43.4 |
| 0.53 | 0.26 | 0.15 | 0.05 | 0.01 | 0.00 | 60 | 47.4 |
| 0.50 | 0.28 | 0.16 | 0.05 | 0.01 | 0.00 | 65 | 51.4 |
| 0.49 | 0.27 | 0.17 | 0.05 | 0.01 | 0.00 | 70 | 55.5 |
| 0.49 | 0.28 | 0.17 | 0.06 | 0.01 | 0.00 | 75 | 59.5 |
| 0.45 | 0.27 | 0.18 | 0.08 | 0.01 | 0.00 | 80 | 63.6 |
| 0.44 | 0.26 | 0.19 | 0.09 | 0.03 | 0.01 | 85 | 67.6 |
| 0.43 | 0.25 | 0.18 | 0.09 | 0.03 | 0.01 | 90 | 71.7 |
| 0.41 | 0.24 | 0.19 | 0.10 | 0.04 | 0.01 | 95 | 75.8 |
| 0.40 | 0.23 | 0.19 | 0.11 | 0.05 | 0.02 | 100 | 79.9 |
| 0.39 | 0.23 | 0.19 | 0.12 | 0.05 | 0.02 | 105 | 84.0 |
| 0.38 | 0.22 | 0.19 | 0.12 | 0.06 | 0.03 | 110 | 88.1 |
| 0.38 | 0.21 | 0.19 | 0.13 | 0.07 | 0.04 | 115 | 92.3 |
| 0.37 | 0.2 | 0.18 | 0.13 | 0.07 | 0.04 | 120 | 96.4 |
Table 4.
Behavior of each objective function depending on the value.
| % Profit Decrease | % CO emission Decrease | Profit (€) | CO Cost (€) | |
|---|---|---|---|---|
| 1 | 23,891 | 6051 | ||
| 0.68 | 0.00 | 0.00 | 23,891 | 6051 |
| 0.38 | 0.33 | 2.65 | 23,812 | 5891 |
| 0.22 | 0.50 | 3.44 | 23,684 | 5843 |
| 0.20 | 0.87 | 3.44 | 23,684 | 5843 |
| 0.16 | 1.189 | 4.35 | 23,440 | 5788 |
| 0.12 | 4.48 | 6.05 | 22,821 | 5685 |
| 0.10 | 15.30 | 11.36 | 20,237 | 5364 |
| 0.08 | 15.88 | 11.59 | 20,098 | 5350 |
| 0.04 | 16.63 | 11.82 | 19,919 | 5336 |
| 0 | 26.68 | 13.31 | 17,516 | 5246 |
Table 5.
Schedule of deliveries of pigs to the abattoir depending on the value and considering a marketing window of five weeks (13–17).
Table 5.
Schedule of deliveries of pigs to the abattoir depending on the value and considering a marketing window of five weeks (13–17).
| 13 | 14 | 15 | 16 | 17 | |
|---|---|---|---|---|---|
| 0 | 1,000 | 0 | 0 | 0 | 0 |
| 0.04 | 600 | 400 | 0 | 0 | 0 |
| 0.08 | 550 | 450 | 0 | 0 | 0 |
| 0.1 | 500 | 500 | 0 | 0 | 0 |
| 0.12 | 200 | 0 | 600 | 200 | 0 |
| 0.16 | 180 | 0 | 220 | 600 | 0 |
| 0.20 | 50 | 220 | 0 | 730 | 0 |
| 0.22 | 50 | 180 | 0 | 770 | 0 |
| 0.38 | 0 | 200 | 50 | 750 | 0 |
| 0.68 | 0 | 200 | 0 | 0 | 800 |
| 1 | 0 | 200 | 0 | 0 | 800 |
© 2018 by the authors. Licensee MDPI, Basel, Switzerland. This article is an open access article distributed under the terms and conditions of the Creative Commons Attribution (CC BY) license (http://creativecommons.org/licenses/by/4.0/).
Share and Cite
MDPI and ACS Style
Nadal-Roig, E.; Pagès-Bernaus, A.; Plà-Aragonès, L.M. Bi-Objective Optimization Model Based on Profit and CO2 Emissions for Pig Deliveries to the Abattoir. Sustainability 2018, 10, 1782. https://0-doi-org.brum.beds.ac.uk/10.3390/su10061782
AMA Style
Nadal-Roig E, Pagès-Bernaus A, Plà-Aragonès LM. Bi-Objective Optimization Model Based on Profit and CO2 Emissions for Pig Deliveries to the Abattoir. Sustainability. 2018; 10(6):1782. https://0-doi-org.brum.beds.ac.uk/10.3390/su10061782
Chicago/Turabian StyleNadal-Roig, Esteve, Adela Pagès-Bernaus, and Lluís M. Plà-Aragonès. 2018. "Bi-Objective Optimization Model Based on Profit and CO2 Emissions for Pig Deliveries to the Abattoir" Sustainability 10, no. 6: 1782. https://0-doi-org.brum.beds.ac.uk/10.3390/su10061782
Note that from the first issue of 2016, this journal uses article numbers instead of page numbers. See further details here.