Contemporary Resource Policy and Decoupling Trends—Lessons Learnt from Integrated Model-Based Assessments


1
Global Developments and Resources, GWS mbH, Osnabrück 49080, Germany
2
Resource Conservation & Circular Economy, Ecologic Institute, Berlin 10717, Germany
*
Author to whom correspondence should be addressed.
Sustainability 2018, 10(6), 1858; https://0-doi-org.brum.beds.ac.uk/10.3390/su10061858
Submission received: 29 March 2018
/
Revised: 28 May 2018
/
Accepted: 30 May 2018
/
Published: 4 June 2018
(This article belongs to the Special Issue Enhancing Environmental and Sustainability Policy: Assessing the Past and charting a Course for the Future)
Abstract
:Addressing climate change and natural resource depletion has been key to the international and national sustainability agenda for almost 30 years. Despite existing efforts, global CO2 emissions and raw material use levels continue to grow. This seems to suggest the need for more systemic approaches in environmental policy. Our paper contributes modelling results to assess the potential of efficiency improvements to achieve absolute decoupling of global raw material use and environmental impacts from economic growth. We apply the global, dynamic MRIO model GINFORS to simulate potential effects of raw material efficiency improvements in production against a climate mitigation scenario baseline. Our simulation experiments indicate that (rather radical) progress in the raw material efficiency of production technologies in concert with extensive climate mitigation efforts could enable an absolute decoupling of resource use and CO2 emissions from GDP growth at a global level and for some countries. The absolute raw material extraction levels achieved, however, still exceed the material use reduction targets suggested by sustainability scientists. Our findings highlight that achieving such targets without addressing rebound effects is implausible. Hence, we call upon policy makers to integrate rebound mitigation strategies and move beyond exclusively improving efficiency to tackling structural and behavioural changes.
1. Introduction
Recent trends in CO2 emissions and raw material use indicate that environmental policy finds itself at a crossroads. Globally, increasing CO2 emissions and raw material extraction levels [1,2,3,4] are proof that we need to step up the ambitiousness, and effectiveness, of environmental policies.
Since 1970,
- global atmospheric CO2 concentration has increased from around 325 to above 400 ppm [5];
- global average temperature has increased by approximately 0.9 °C [7]; and
- global extraction of raw materials (biomass, fossil fuels, metal ores and non-metallic minerals) has almost quadrupled from around 23 billion tonnes to more than 80 billion tonnes [3].
These global development trends call for applying more systemic approaches in environmental policy. In its most recent report, the International Resource Panel (launched by the United Nations Environment Programme in 2007) asserts that “environmental impacts—including climate change and pollution—cannot be effectively mitigated by focusing on emission abatement alone. The level of resource use determines the magnitude of final waste and emissions released to the environment, making resource management and efficiency key strategies for environmental protection. Decoupling economic activity and human well-being from resource use—i.e., enhanced resource efficiency—is necessary […]” (IRP 2017 [8]) (p. 8).
From a global environmental perspective, efforts aimed at an overall reduction of resource use appear comprehensible. Improvements in resource efficiency may well be able to support a reduction in raw material use at individual company or industry levels. However, the resulting economy-wide effects of any of these initial savings tend to be curtailed by a magnitude of economy wide feedback effects, which can lead to rebound effects. In this regard “sustainability concepts that rest on the idea of resource- or energy-efficiency improvements due to technological progress tend to overestimate the potential saving effects” (Binswanger 2001 [9]) (p. 119). As numerous authors already analysed the empirical significance of individual rebound effects (see, e.g., the survey on direct rebound effects by Sorrel et al. (2009) [10]), policy makers should actually be aware of the need for effective rebound mitigation strategies when applying resource efficiency approaches. However, whereas different authors discuss the appropriateness of various policy instruments (see, e.g., Vivanco et al. (2016) [11] who identified outstanding rebound mitigation potential for economic instruments), prevailing resource policy paradigms actually tend to omit rebound mitigation strategies. Therefore, it seems justified to ask whether economy-wide resource efficiency improvements that are not accompanied by any additional rebound mitigation strategies could be able to achieve an absolute decoupling of economic activities from global raw materials use. Against this background, our paper aims to explore overall decoupling potentials of global increases in resource efficiency. We present findings from a dynamic modelling study, which assumes (rather radical) increases in resource efficiency and assesses potential overall effects on global economic activity, CO2 emissions and raw material extraction levels.
We apply the material footprint (MF) concept to allocate global material extractions via multi-national supply chains to production activities and the final domestic demand of individual national economies. In our view, applying the MF concept in this context is justified because in open economies domestic production activities and the final demand also induce foreign material demand in international supply chains, in addition to direct material inputs to an economy (domestic extraction and physical raw material imports). The MF-concept represents an elaborated calculation framework, which traces the contributions of individual national economic activities to global material extractions along these supply chains. The estimated upstream material flows that internationally traded goods and services induce are called Raw Material Equivalents (RME). These RMEs measure the weights of all raw materials needed along these supply chains based on well-defined statistical environmental-economic accounting frameworks [12].
The general MF-concept can be applied by implementations of several so called material flow indicators (Bringezu 2015 [13] provided a condensed overview of relevant indicators and their main characteristics): Total Material Consumption (TMC) indicators map the balance between the sum of all (used as well as unused) primary raw material inputs to a national economy (domestic extractions plus direct material imports together with indirect (upstream) extraction flows associated with the imports of goods and services) and the respective outflows from this economy (direct material exports together with indirect extraction flows associated with the exports of goods and services). TMCabiot refers to abiotic resources and TMCbiot refers to biotic resources. Likewise, the indicator Raw Material Consumption (RMC) maps the balance between the sum of primary raw material inputs to a national economy (domestic extractions plus direct material imports together with indirect (upstream) extraction flows associated with the imports of goods and services) and respective outflows. However, only used primary raw material extractions are considered by this indicator [13]. Following IRP (2017) [8], the “concept of a material footprint offers an additional perspective on a country’s material use by attributing material extraction, wherever it may have occurred globally, along supply chains of different products and services to final domestic demand […]. It is therefore a measure of the material requirement of the consumption and infrastructure system of a country […]” (IRP 2017 [8]) (p. 38). Wiedmann et al. (2015) [4] defined the RMC as the “global allocation of used raw material extraction to the final demand of an economy […] [which] does not record the actual physical movement of materials within and among countries but, instead, enumerates the link between the beginning of a production chain (where raw materials are extracted from the natural environment) and its end (where a product or service is consumed)” (p. 6271).
Another MF indicator is the indicator Raw Material Input (RMI). RMI is closely related to RMC as it provides information about all used material inputs induced by the total amount of goods and services available within an individual economy for a given time period (domestic extractions plus direct material imports together with indirect (upstream) extraction flows). Compared to RMC, RMI happens to be less frequently reported in international comparisons. However, the nature of our applied simulation exercise suggests itself for an additional observation of the RMI indicator. Our results are therefore covering scenario implications for both RMC and RMI.
1.1. International Environmental Policy—Unified in Lack of Quantified Targets on Raw Material Use
The past few years have produced significant environmental policy commitments, most notably the adoption of the Sustainable Development Goals (SDGs) and the Paris Agreement under the United Framework Convention on Climate Change (UNFCCC) to limit a global temperature rise in the 21st century to well below 2°C above pre-industrial levels. While the Paris agreement sets a joint target and issues strong calls for further global and national action on reducing CO2 (and other greenhouse gas) emissions in the years ahead [14], similar international commitments to aspired raw material extraction levels are missing. Only recently have international processes on tackling increasing raw material extraction levels gained momentum, for instance the G7 Alliance for Resource Efficiency, set up in October 2015, or the G20 Resource Efficiency Dialogue, which started in March 2017 ([3], see also Bahn-Walkowiak and Steger (2015) [15]). These processes tend to focus predominantly, however, on improving resource efficiency. Even if the SDGs do explicitly address resource efficiency (e.g., Goal #8, “Promote sustained, inclusive and sustainable economic growth, full and productive employment and decent work for all”, and Goal #12, “Ensure sustainable consumption and production patterns”), qualitative and strategic targets prevail [3,15]:
Similarly, current EU policy lacks specific and measurable targets on resource use and resource efficiency. A resource productivity target of at least +30% between 2008 and 2030 had been recommended by the European Resource Efficiency Platform in 2014 ([18], see also Ekins et al. (2017) [3]). However, in contrast to the previous Barroso II Commission’s proposal for a circular economy action plan from 2014 ([19], see also Ekins et al. (2017) [3]), the EU’s current main resource policy document—the Circular Economy Action Plan [20]—has not integrated this target.
Despite or because of lacking international targets, several countries across the EU and also worldwide have set their own quantified and measurable targets to tackle raw material extraction levels, e.g., Austria, China, Finland, Germany, Japan, South Korea, the UK and the US ([3], for an overview of countries’ targets in Europe and worldwide, see Bahn-Walkowiak and Steger (2015) [15] and EEA (2016) [21]). Nevertheless, all national targets seem to remain focused on increasing resource efficiency and reducing waste generation; hence, on improving the efficiency with which national economies use resource input to produce value, and the intensity with which they generate unwanted output in terms of waste (materials) during the throughput of raw materials [3,15,21].
This reflects the predominant orientation in resource policies around the world: fostering the socioeconomic development and performance of nations, while minimising raw material extraction and associated environmental impacts. This concept is referred to as double decoupling [3]. In this context, various national policies include decoupling as a strategic objective (e.g., the German ProgRess II [22]). However, they focus on relative decoupling only, i.e., reducing raw material extraction in relation to economic performance (GDP), which means that absolute raw material extractions continue to grow, but slower than growth in GDP [15]. There are no national targets for reducing the use of primary raw materials in absolute terms, i.e., absolute decoupling [15,21].
1.2. Past Decoupling Trends on Global and National Levels
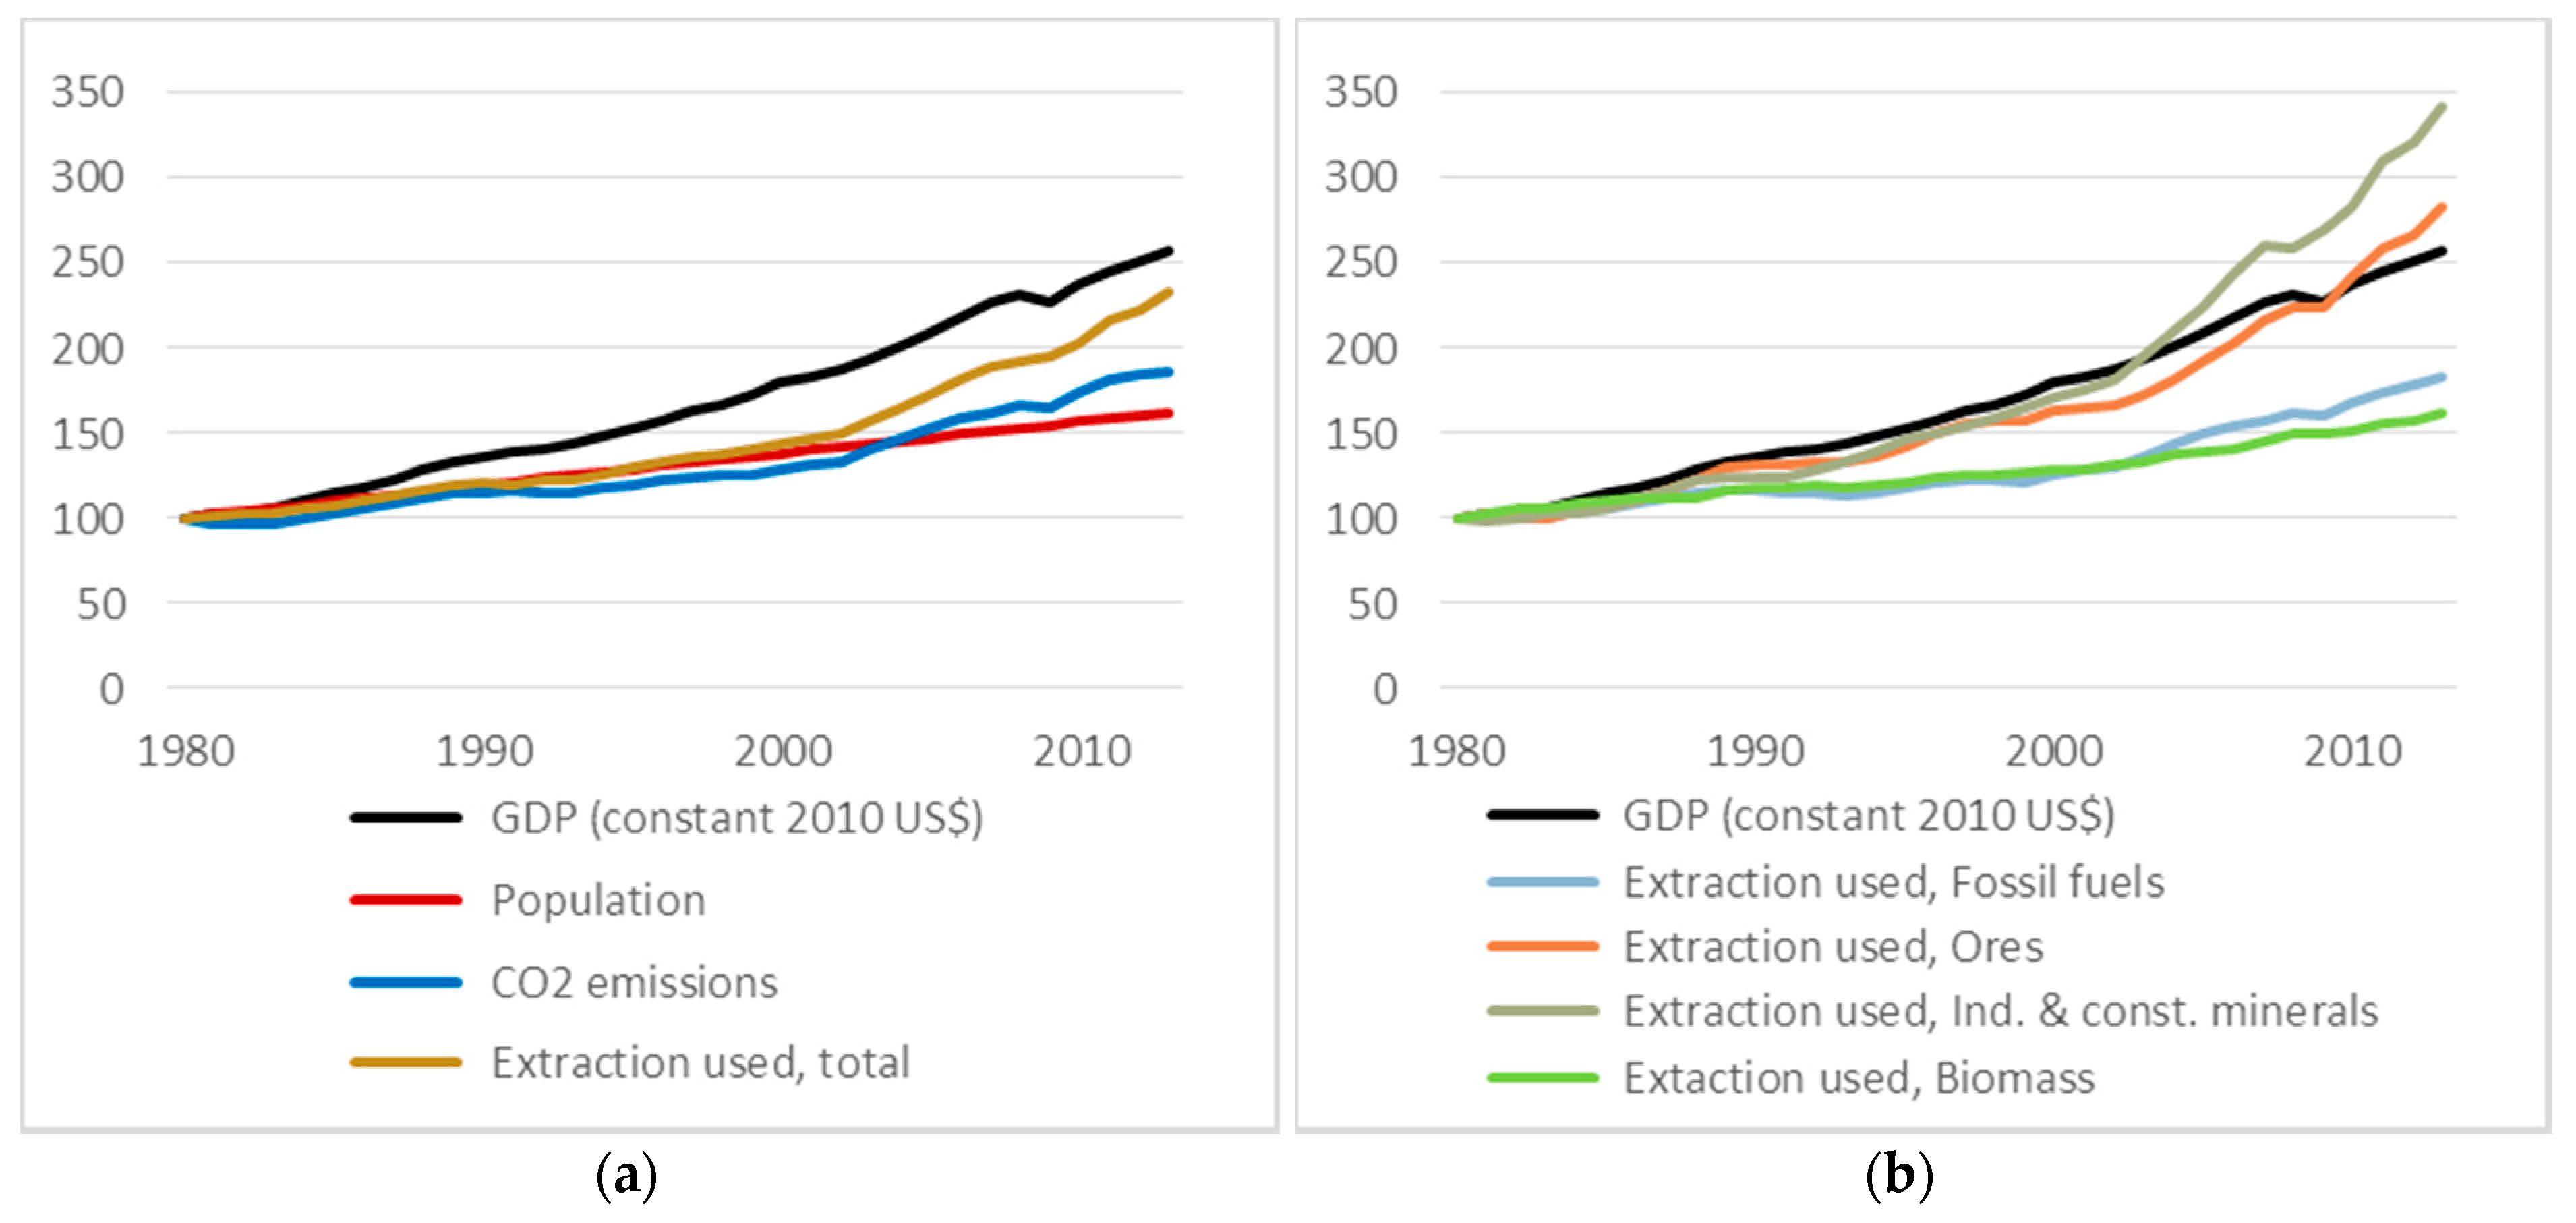
Long-term historical trends on raw material extractions and GDP growth show clear patterns of relative decoupling since around the 1960s, with material extractions growing continuously, albeit at slower rates than GDP until around 2006–2007 ([9]; see also Ekins et al. (2017) [3] and IRP (2017) [8]). Calculations by the authors (see Figure 1) concerning global GDP, CO2 emissions and raw material extractions for the last three decades reveal the relative decoupling, too, but with decoupling trends differing across raw material categories.
According to Figure 1a, global CO2 emissions (blue line) and globally used raw material extractions (brown line) increased slightly slower than GDP (black line) between 1980 and 2000. From 2000 onwards, they move more or less in lock-step with GDP, hence there is no further indication of relative decoupling. For different material categories, Figure 1b indicates relative decoupling only for biomass (green line), while trends for fossil fuels (blue line) match global GDP developments at least since the 2000s (hence, they mimic the curve of global CO2 emissions in Figure 1a). For ores (orange line) and industrial and construction minerals (grey line), global extraction levels started overshooting global GDP (black line) between 2000 and 2010; hence, there is no longer any relative decoupling. This seems to be a setback, but it may be related to the surging demand for infrastructure in Asian economies, in particular China and India, and may not constitute a long-term satiation trend [3,8,23]. Regardless of whether relative decoupling can be assumed to be a long-term trend, current policies aimed at fostering resource efficiency have not (yet) been able to prevent raw material extraction from further increasing at a global level, i.e., to achieve absolute decoupling [3,8].
Considering national RMC developments since 1990, Wiedmann et al. (2015) [4] indicated that until 2008 only four out of twelve countries under inspection had featured relative decoupling with (per capita) RMC growing slower than GDP: Australia, China, India and South Africa. Apart from South Africa during the 1995–2002 period, they did not find any indications of absolute decoupling [4]. Across OECD countries, per capita RMC levels tended to increase by around 7 t between 1990 and 2008. Globally, increasing RMC trends have been most notably among:
- China, the UK and the US (where the increases approximate 8 t per capita each);
- Brazil and Japan (around 6 t per capita each);
- Australia and EU-27 (approximately 5 t per capita); and
- Russia (around 3 t per capita) [4].
Hence, further efforts seem necessary to advance decoupling globally. While relative decoupling can be considered beneficial from an environmental, social and economic perspective, global trends and developments pose the question of whether relative decoupling will be sufficient from a long-term sustainability viewpoint. Population growth, urbanisation and increasing numbers of middle-class consumers, particularly in Asia as well as the associated proliferation of resource-intense (and usually also carbon-intense) production and consumption patterns, inter alia in relation to mobility, housing, communications and nutrition, seem to lock-in rising raw material extraction levels in the long term [1,3,24,25,26,27]. Hence, to achieve global absolute decoupling of economic development from resource use and associated environmental impacts (such as carbon emissions) will have to transform prevailing social metabolisms (i.e., “the inputs of materials and energy into socio-economic systems and the corresponding outflows of wastes and emissions” (Krausmann et al. (2009) [28]) (p. 2696); see also Fischer-Kowalski and Haberl (2007) [29] in this regard). This holds for both industrialised countries and emerging economies, above all in BRIC countries (BRIC countries are Brazil, Russia, India and China), whose contributions to global raw material use and carbon emissions are converging towards or even exceeding that of industrialised countries [3,4].
1.3. A Need for Going beyond Resource Efficiency Oriented Policies?
In contrast to policy makers, academia has developed and suggested targets for achieving absolute reductions of resource use by 2050 at the global as well as national levels. Prominent among these is the concept of reducing resource use by a factor of x, where x stands for different ambition levels ranging from a factor of 4 (reducing by 75%) [30], 5 (reducing by 80%) [31] to 10 (reducing by 90%) [32,33]. Furthermore, scientists proposed target limits of around 50 billion tonnes of global material consumption by 2050 ([34,35,36]; see also Bringezu (2015) [13]) and a triplet of per capita targets relating to different indicators:
- 10 t per capita (or a range of 6–12 t per capita) for TMCabiot;
- 2 t per capita for TMCbiot; and
- 5 t per capita (or a range of 3–6 t per capita) for RMC [13].
In the context of globally prevailing resource efficiency oriented policies, the afore-mentioned extraction reduction levels discussed in the academic literature imply an essential question: Can we expect to achieve these objectives exclusively by economy-wide resource efficiency improvements, or do these objectives require more ambitious policy approaches? In our view, this question has not yet been sufficiently discussed.
This article summarises the main findings from a simulation study that evaluates the potential impacts of resource efficiency paradigms on key environmental indicators and GDP in different countries as well as globally up to 2050. We analysed this research question in the context of a German research project. (SimRess: Models, Potentials and Long-Term Scenarios for Resource Efficiency; funded by the German Environmental Agency and the German Environment Ministry under FKZ: 3712 93 102; www.simress.de/en). Triggered by an interest in long-term resource policy orientation and ambition vis-à-vis existing policy paradigms at the German and international level, we applied a global dynamic multi-regional input-output (MRIO) model (GINFORS3) to assess the economy-wide impacts of resource efficiency improvements on CO2 emissions, raw material extractions and GDP against a scenario baseline of enhanced efforts on climate mitigation.
We document this research work as follows: Section 2 recapitulates the research question, provides an overview of the applied model and outlines the parameterisation of the baseline scenario as well as of the simulation experiments. Section 3.1 presents key model results for developments of national and global raw material use up to 2050 in a climate-active setting (baseline scenario). In Section 3.2, the key model results for the impacts of further resource efficiency improvements are shown. Section 4 serves to discuss our findings in the context of other existing studies. Section 5 concludes with key policy recommendations and research gaps.
2. Materials and Methods
2.1. Research Question and Study Design
Our study assessed the economy-wide impacts of resource efficiency improvements on CO2 emissions, raw material extractions and GDP against a scenario baseline of enhanced efforts on climate mitigation. The baseline scenario incorporates essential policy ingredients of a climate mitigation scenario, but under currently prevailing environmental policy paradigms does not assume any additional resource policy actions over the coming decades. However, due to the dynamic nature of the applied simulation model, this baseline features an endogenous account for usual technological progress as it may be expected based on historical observations. Hence, as shown in Section 3.1, the baseline already reflects the effects of prospective international efficiency improvements until the year 2050. In a second simulation run, we then tested the response of the global social metabolism to substantial increases in resource efficiency in absence of any rebound mitigation strategies. A comparison of both scenario results then enabled us to exemplify the potential global effects of enhanced autonomous technical progress leading to economy-wide resource efficiency improvements. While this setup refrains from assessing individual policy instruments, it may be understood as an explorative illustration of the prospective scope of contemporary international resource policy paradigms.
In the following, Section 2.2 highlights the key methodological features of dynamic macroeconomic simulation models and introduces details that we consider relevant to better understand the dynamic macroeconomic simulation model GINFORS3 and the results we obtained from applying it. Section 2.3 explains the climate policy parameterisations incorporated in our baseline specification and defines the scenario settings of the additional resource efficiency simulation.
2.2. The Global Dynamic MRIO Model GINFORS3
2.2.1. Why Use a Dynamic Macroeconomic Simulation Model?
Global extraction trends, such as shown in Figure 1, are driven by direct demand for individual materials (such as biomass products used for nutrition or heating needs) or the induced demand for primary materials required for the production and use of products (such as ores used for car production to fulfil transportation needs, or construction minerals used to fulfil housing needs). However, the link from a plurality of human needs to global resource use is subject to a complex network of multi-dimensional and mutually interdependent drivers (see, e.g., Hirschnitz-Garbers et al. (2015) [24]). These drivers establish a complex feedback system and include
- the evolution of societal preferences (such as the diffusion rate of meat and dairy-based diets or the perceived relevance of product ownership for societal status);
- socio-economic structures (such as population levels and structures, labour participation rates, wage–price dynamics and resulting income distribution structures);
- associated infrastructure investment decisions (shaping, inter alia, urbanisation tendencies); and
- and the diffusion of technical progress in multi-national supply chains.
Accordingly, any assessment of prospective future pathways for material and energy use and their implied effects on economic growth and employment in individual countries and inter-connected industrial sectors necessitates multilayer analytical frameworks (see, e.g., Hatfield-Dodds et al. (2017) [37] and Distelkamp and Meyer (2017) [38]). Thus, it seems straightforward to rely on dynamic macroeconomic simulation models in an assessment of future resource use and possible (environmental and socio-economic) impacts of structural change (such as globally accelerating resource efficiency developments) on future resource use. This is in line with one of the most recent critical review of existing assessment studies that examine transition pathways towards more circular production and consumption patterns: “Ex-ante, economy-wide, quantitative dynamic models appear to be the tool best suited for assessing the likely macroeconomic consequences of a circular economy transition.” (OECD (2017) [39]) (p. 41)
Macroeconomic simulation models reproduce the complex dynamics of economic systems by consistently mapping economy-wide supply-and-demand interrelationships. They can generate dynamic ex-ante projections of the interplay among corporations, private households, government actions and foreign developments. Supplemented by detailed information about individual production structures in terms of input-output databases, structural macroeconomic models, such as GINFORS3, represent well suited analytical tools for any economy-wide assessment of resources use and a circular economy (see, e.g., Hatfield-Dodds et al. (2017) [37]). However, thus far, few respective applications have been able to also consider the macroeconomic impacts of increasing resource efficiency (see, e.g., Ekins et al. (2017) [3] (p. 99–110)) for a methodological overview in this regard). The structural macroeconomic MRIO model GINFORS3 has already provided relevant contributions in this regard (see Distelkamp and Meyer (2017) [38] and Meyer et al. (2015) [40]).
2.2.2. The GINFORS3 Model
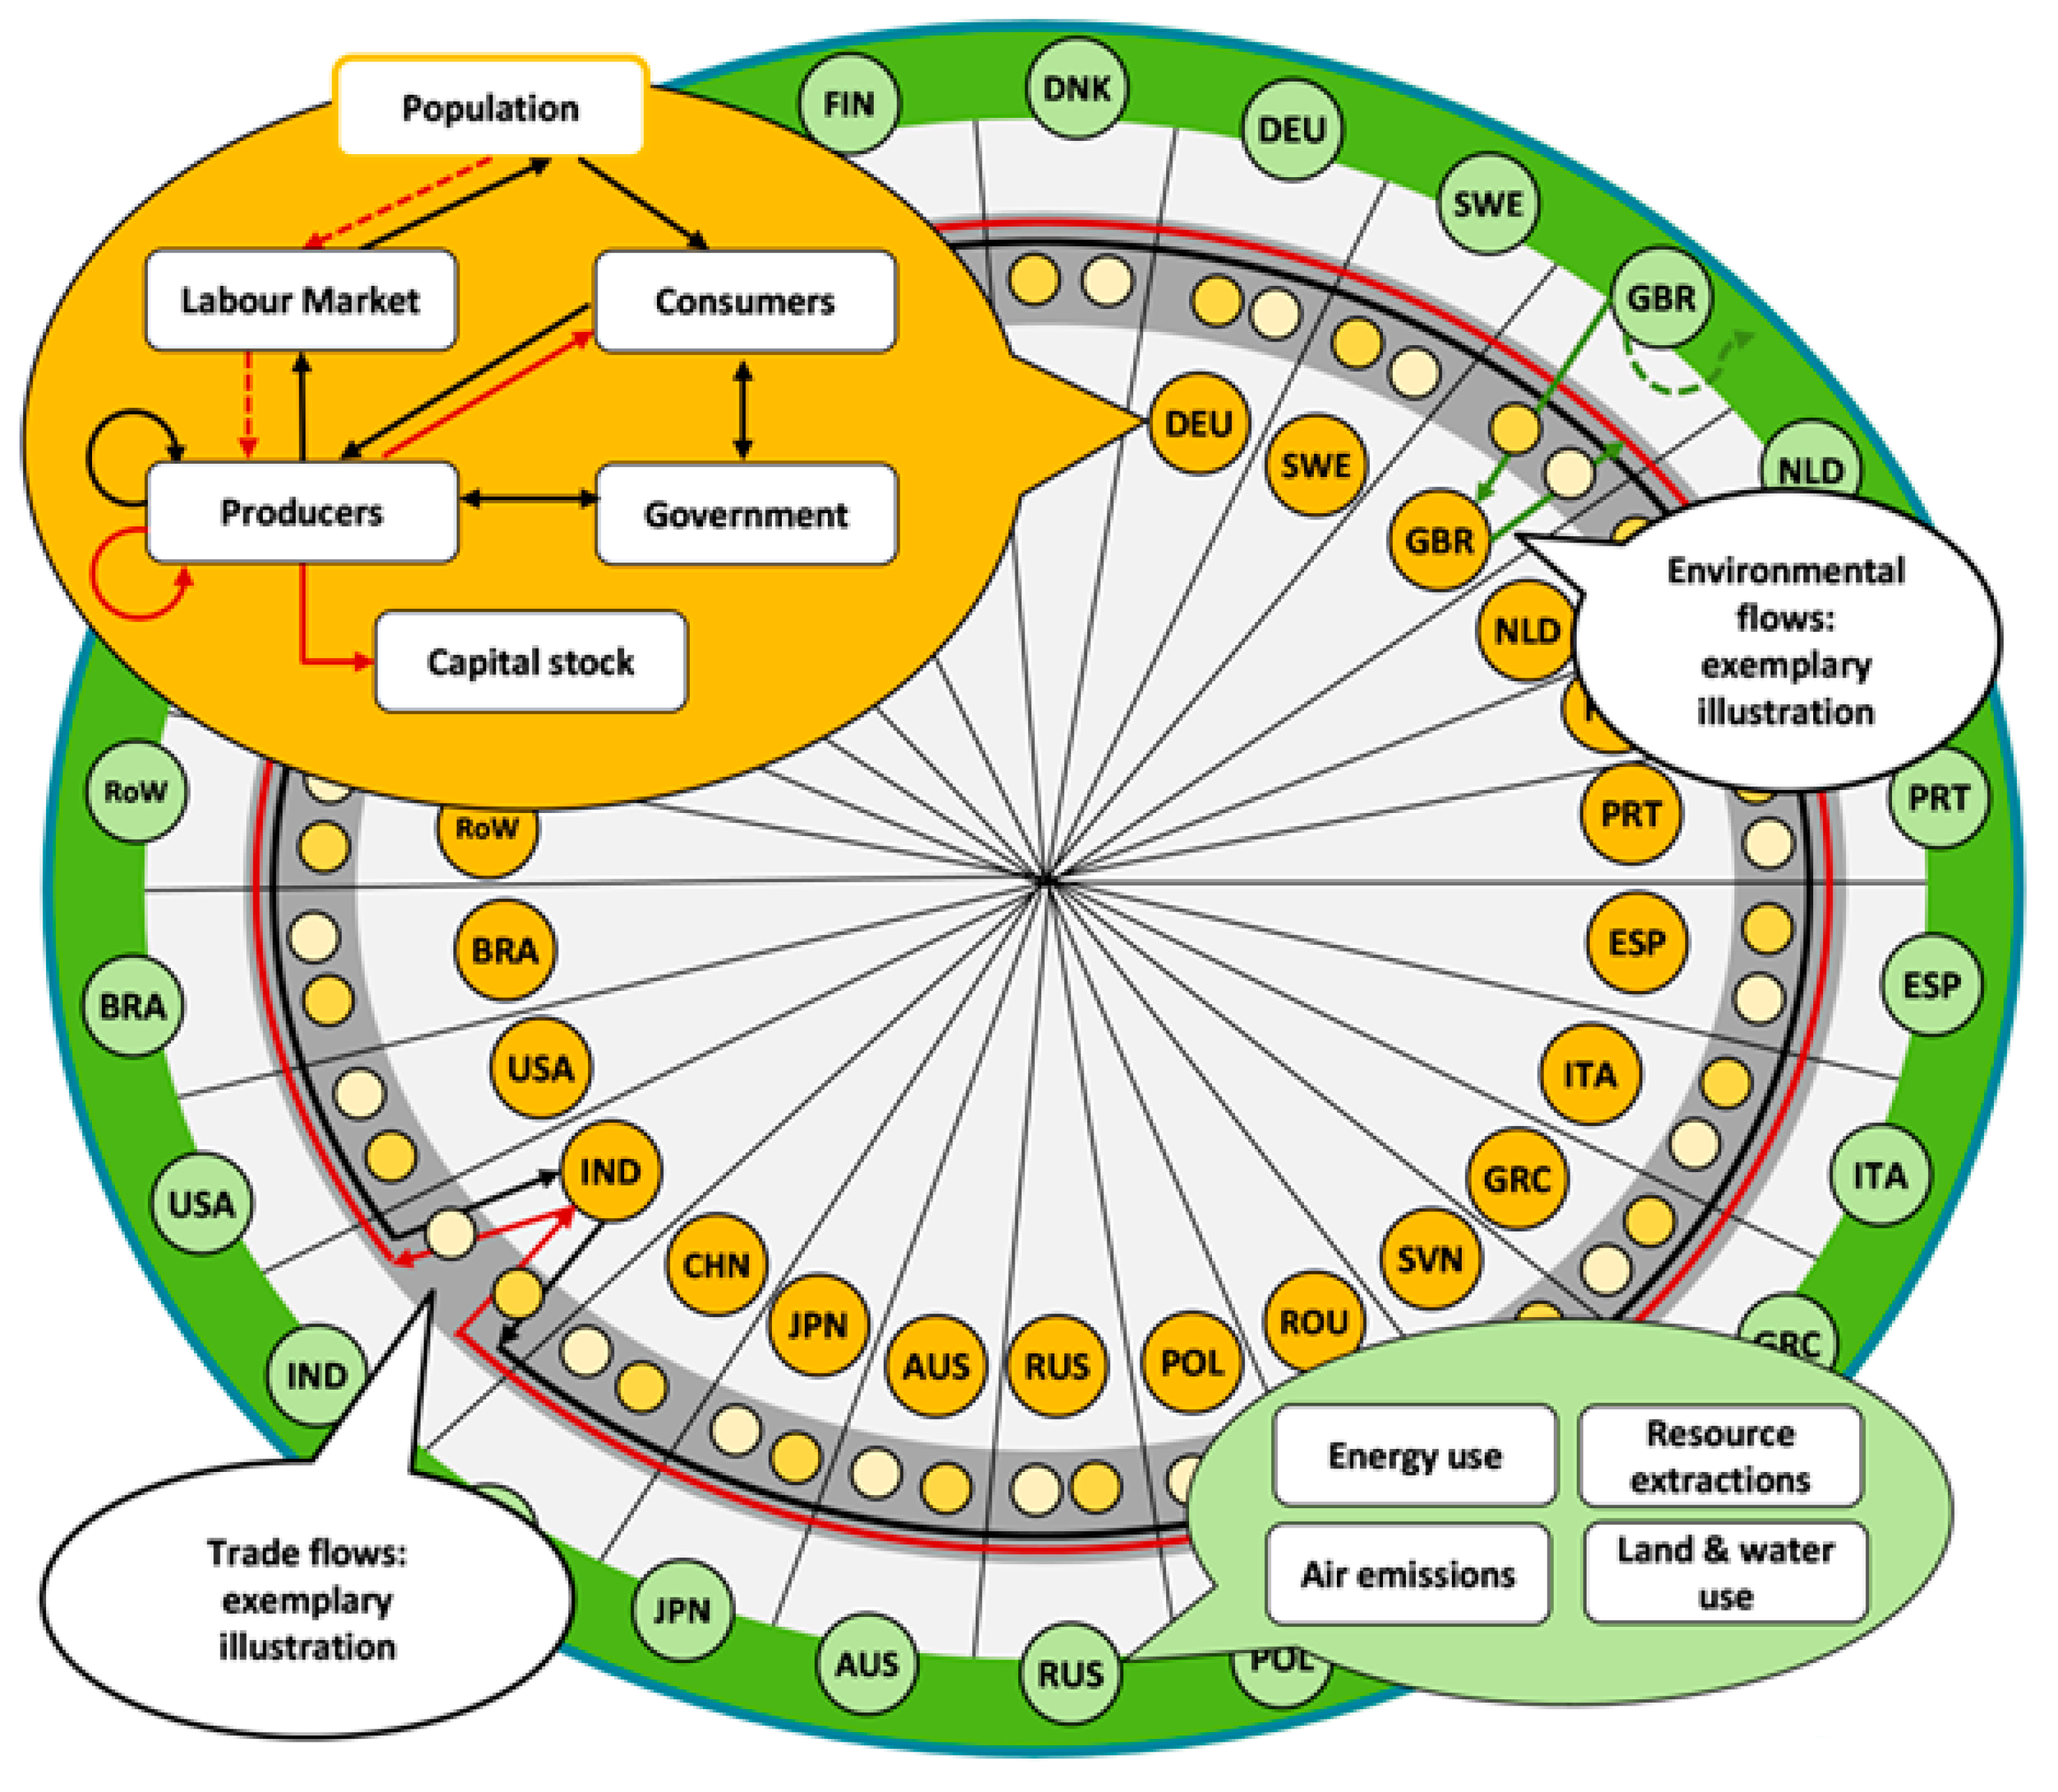
Based on a comprehensive Environmentally Extended Multi-Regional Input-Output (EE-MRIO) database, GINFORS3 represents a dynamic EE-MRIO simulation model with global coverage. Introductory surveys on well-established MRIO databases have been (inter alia) provided by Tukker and Dietzenbacher (2013) [41] and Wiedmann and Barrett (2013) [42]. Figure 2 provides a conceptual visualisation of the interplay of key model elements and the model’s different modules.
The model is based on a deep mapping of country and sector structures. These structures depict mutual international as well as inter-sectoral economic interdependencies by means of a bottom-up approach. This means that projections for macroeconomic indicators (such as GDP) are consistently derived from dynamic mappings of their constitutive parts (such as private household expenditure, government spending, gross fixed capital formation and exports and imports). Hence, at the core of the GINFORS3 model lies an economic module. It encompasses 35 industries with 59 products groups in 38 national economies (including the EU-27 and BRICS countries as well as an overwhelming majority of OECD member states) and a Rest of World (RoW) region (a full list of the geographical coverage is given in Appendix A). This allows the model to assess changes in (inter alia)
- production, basic prices, intermediate demand and value added;
- international supply chains (bilateral trade matrices; the grey circle in Figure 2);
- final demand (consumption expenditures by households and non-profit organisations, government spending and gross fixed capital formation by industries); and
- labour markets (labour demand, wages, (un-)employment).
The economic module is rooted in the WIOD database [43]. Global economic developments are thus fully endogenised within the model. For each economy modelled, all relevant monetary flows are completely integrated on the macroeconomic scale. The economic activities on the demand and supply side are consistently interlinked with approved statistical accounting schemes capturing the generation, distribution and use of income for individual transactors (e.g., private households and government). Given this complete mapping of well-defined accounting and balancing interrelationships, the model can provide a thorough account of complex response relationships on a macroeconomic scale in each simulation. This modelling philosophy corresponds to the tradition of INFORUM-type models [44] and features post-Keynesian system properties (see Meyer and Ahlert (2017) [45] for complementary methodological annotations on the implied simulation properties contrasted to commonly applied CGE approaches). GINFORS3 is thus comparable to the E3ME model developed and maintained by Cambridge Econometrics. As Pollitt and Mercure (2018) put it: “There are only two post-Keynesian macro-econometric models that are used for E3 [Energy-Environment-Economy] analysis at global level: the E3ME and GINFORS models. The general principles underlying both models with regards to money and finance are the same, although the models differ somewhat in terms of detail” [46] (p. 190). Moreover, GINFORS3 provides extensive insights into the globalisation effects from international trade developments.
The environmental extension comprises an energy module and resources modules. The energy model simulates endogenously the energy demand (differentiated for 20 energy carriers) of different industries and private households as well as the evolution of the energy carrier mix in electricity production with regards to central scenario parameters (nuclear energy and total share of renewables) and individual shares for specific renewable technologies and fossil energy carriers. Thus, the energy module captures resulting CO2 emissions.
The resource module encompasses different kinds of resource extraction (abiotic and biotic materials) as well as land and water use. Its mapping of global material flows is primarily based on historical analyses of extraction data provided by the WU Global Material Flows Database (www.materialflows.net; see Lutter et al. (2014) [47] for a comprehensive description of this data source). Based on historical time series information on multi-national extraction dynamics until the year 2013, GINFORS3 is thus able to explain and project the evolution of
- used and unused extractions of abiotic resources (non-metallic minerals, metal ores, coal, oil and gas); thereby allowing the calculation of
- sophisticated environmental indicators (such as raw material consumption RMC and raw material input RMI that identify/consider the environmental impacts of domestic activities along the diversified international supply chains);
- demand and supply/production for 13 different crop groups and 3 different livestock categories and the resulting impacts on prices and agricultural land use; and
- water abstraction for 38 national economies and a RoW region.
Notably for assessments of global raw material requirements, the model facilitates essential insights into the MF of nations. Within this total modelling framework for global macroeconomic interrelationships, physical material extraction activities are consistently derived from economic projections for respective extraction industries. Therefore, due to its detailed mapping of multi-national supply chains, it is ensured that in any simulation of individual economic impulses (e.g., a regional efficiency increase in the use of basic metals in car manufacturing) all globally induced responses in regional raw material extraction activities are endogenously projected by the model. The simulated variations in regional extraction activities can then be communicated by applications of individual indicator concepts. For this purpose, GINFORS3 has been augmented by algorithms, which facilitate an application of well-established RME accounting routines. This enables us to report own estimates for MF indicators like RMI and RMC in historical analyses (in the tradition of, e.g., [4,48,49,50]) but also in own ex-ante scenario projections.
The applied dynamic mapping of the interplay between economic development, energy and resource use controls for national variations in respective economic metabolic profiles. Global development trends can thus be traced back to national drivers by means of GINFORS3 simulations. Furthermore, the respective impacts of altered metabolic system statuses can be endogenously derived (on national or multi-national levels as well as on the global level) by means of GINFORS3 simulation studies.
2.3. Scenario Parameterisations
To assess the potential impacts of resource efficiency improvements and climate mitigation options on the above-mentioned key environmental and socio-economic indicators, we first developed a climate mitigation baseline scenario and then a resource efficiency improvement scenario that would deviate from the former. Both scenarios were assessed against their potential environmental and socio-economic impacts.
2.3.1. Exogenous Scenario Parameters—Setting Values for Global Population Growth and World Market Prices for Primary Metal Ores by Exchanging Information with a System Dynamic Model
On behalf of the funding German Environmental Agency, our research work was intended to, inter alia, foster a collaboration of GINFORS3-modellers with system dynamic modellers who work on extending the initial WORLD model [51] by dynamic projections of the extraction activities for individual raw materials to a so-called WORLD6 variant (e.g., Sverdrup and Ragnarsdottir (2016) [52], Sverdrup et al. (2015) [53] and Sverdrup et al. (2014) [54]). The latest update of the original WORLD3 model has been published by Meadows et al. (2005) [55]. Following Costanza et al. (2007) [56], the model does not, however, seem to have experienced fundamental progress within the last 50 years. The updated version incorporates roughly 100 variables and 80 parameters to project global developments over centuries. This paper is not intended to provide any additional annotations to the well-documented criticisms concerning the methodological framework of the initial WORLD3 model [51] or to outline our own scepticism concerning supposed evidence in favour of the model’s projection capabilities (as done, e.g., by Imhof (2000) [57], Bardi (2011) [58] or Turner (2012) [59]). Notwithstanding the broad public attention to the initial publication of WORLD simulation results [51], it can be said that social scientists questioned the scientific principles of this simulation study across the board. From a methodological viewpoint, the Meadows et al. study (1972) [51] indeed seems astonishingly vulnerable as “researchers and methods came from a technical background that had no reputation of having worked successfully on topics of social sciences before” (Imhof 2000) [57] (p. 15). Thus, socio-economic dynamics were actually not covered by the model. This also applies with regards to government expenditures or any other relevant policy intervention points. With insufficient empirical data, the model’s database was furthermore rather weak since the parameterised causal relationships were essentially derived from expert guesses for global averages instead of historical measurement approaches on a regional scale. Hence, after having disputed these issues for a couple of years in the aftermath of the release of the 1972 Limits to Growth study [51], both communities went their separate ways again.
Irrespective of our own methodological concerns, our collaboration with the system dynamic modellers resulted in an exchange of information for scenario parameters that are usually exogenous to GINFORS3: global population developments, metal price trajectories and metal recycling rates.
Global population developments are endogenously derived by the WORLD6 model (e.g., Sverdrup et al. (2013) [60]). As these figures represent one of the few exogenous model variables in GINFORS3, these projections can be easily adopted in any GINFORS simulation run. The same applies with regards to the world market prices for metal ores. They are usually exogenous scenario parameters in any GINFORS projection, but they are endogenously derived within the WORLD6 model. Thus, in an iterative soft-linked procedure, coupled simulation exercises were applied as follows: GINFORS3 was initially applied with exogenous population and price assumptions to generate global outlooks on overall economic performance until 2050. Aggregated demand figures were then fed from GINFORS3 into WORLD to derive detailed projections of global supply side dynamics. These updated supply projections generated explicit price trajectories and globally averaged metal recycling rates which (together with updated population prospects) could then be returned to GINFORS. After a couple of simulation exercises, this procedure converged towards an integrated world market price projection for metal ores, featuring a balanced consideration of global supply and demand dynamics and harmonised population dynamics.
Following this procedure, overall world market prices for primary metal ores are assumed to rise between 2013 and 2050 with an average annual growth rate slightly below 2.5%. This projection is remarkably lower than, for example, the annual increase in the real price for metal ores of 4% p.a. (per annum) assumed by Distelkamp and Meyer (2017) [38] and caused by the very dynamic projection of the WORLD6 model for the medium-term evolution of global metal recycling rates. Compared to other statistical projections, the population outlook derived within WORLD6 is also characterised by dampened medium term dynamics. Averaged global annual population growth rates were expected to be around 0.5% between 2013 and 2050, reaching a level of (slightly above) 8.7 billion people in 2050. We ran our simulation experiments with these exogenous specifications despite the possibility that they may somehow hamper the comparison of our results with related assessments.
2.3.2. Parameterising a Climate Active Scenario Baseline
We developed a narrative for the baseline scenario that advances climate mitigation efforts beyond business as usual, terming it the climate active scenario baseline. In addition to the above exogenous scenario parameter values (see Section 2.3.1), the climate active baseline contains further climate policy progress on the global and on national levels (for instance, covering Germany’s energy needs by 100% renewable energy sources by 2050).
The following tables present the key parameter values assumed for national and international climate mitigation efforts. They cover assumptions for global price developments in fossil energy carriers (Table 1), developments in renewable energy share (Table 2) and in nuclear energy share (Table 3) in electricity generation in key countries in addition to further key scenario parameters (Table 4).
2.3.3. Parameterising Resource Efficiency Improvements for Simulation Experiments
To compare the potential environmental and socio-economic impacts of the climate active scenario baseline with further prospects of (maximum) conceivable additional improvements in resource efficiency, we developed simulation experiments that represent the dominant policy orientation of using technology improvements in resource-relevant production sectors to foster resource efficiency. These simulation experiments indicate the overall effects of assumed autonomous increases in material efficiency for selected industries. Hence, it is important to note that these experiments feature a “what if” character: We explore potential improvements in resource use indicators and in CO2 emission trends versus the climate active scenario baseline irrespective of whether such improvements can be deemed technically feasible. Thus, our simulation results should be understood as tentative assessments of the systemic impacts of extensive global resource efficiency improvements.
Given current environmental policy orientations we are convinced that such assessments should be of value in light of
- the relevance of climate policy for resource efficiency improvements and of resource efficiency improvement for relevant climate parameters (CO2 emissions); and
- the potential of the existing dominant resource policy orientation to achieve existing policy goals of relative decoupling as well as scientific calls for absolute decoupling.
We used indicator calculations in GINFORS3′s resource modules to identify resource-relevant production technologies/sectors, i.e., those that account for the highest material footprints of all production activities in Germany by their individual raw material intensities. To distinguish the impacts of resource efficiency improvements from climate policy measures, energy-related inputs were not included within this selection procedure. The simulation results for the climate active baseline for the year 2020 yielded the basis for these calculations. The resulting findings indicated that more than 50% of Germany’s overall raw material input (RMI) can be attributed to a subset of roughly 100 resource-relevant intermediate inputs. A list of the 75 resource-relevant intermediate inputs varied in our simulation experiments can be inferred from Appendix A (Table A2). An extended list covering the 100 most resource-relevant production technologies/sectors can be found in the annex of Distelkamp and Meyer (2017) [61] (which can be provided upon request).
To provide a (tentative) allowance for costs associated with assumed annual efficiency improvements, we adopted the following hypotheses: The benefitting industries are assumed to experience a singular increase in consulting costs equalling the savings of one year. Corresponding increases in research and development costs are assumed to equal one and a half times the savings of one year. Furthermore, costs for additional investment in new fixed assets are assumed to equal two and a half times the savings of one year.
Regarding the potential global diffusion of efficiency improvements, we assumed that Germany would initiate efficiency gains that other world regions then adopt over time (other EU countries, non-EU highly industrialised countries and RoW).
Table 5 presents the key parameter values assumed for national and international efforts to foster resource efficiency in resource-relevant production technologies and sectors.
3. Results
Here, we first describe the potential impacts of the assumptions in the climate active baseline on primary raw materials use, CO2 emissions and GDP on a global and regional level. Then, we present the findings of the simulation experiments on resource efficiency improvements in comparison to the climate active baseline.
3.1. Baseline Projection—Potential Impacts of the Climate Active Scenario
3.1.1. Potential Impacts on Global Environmental Indicators and Global GDP
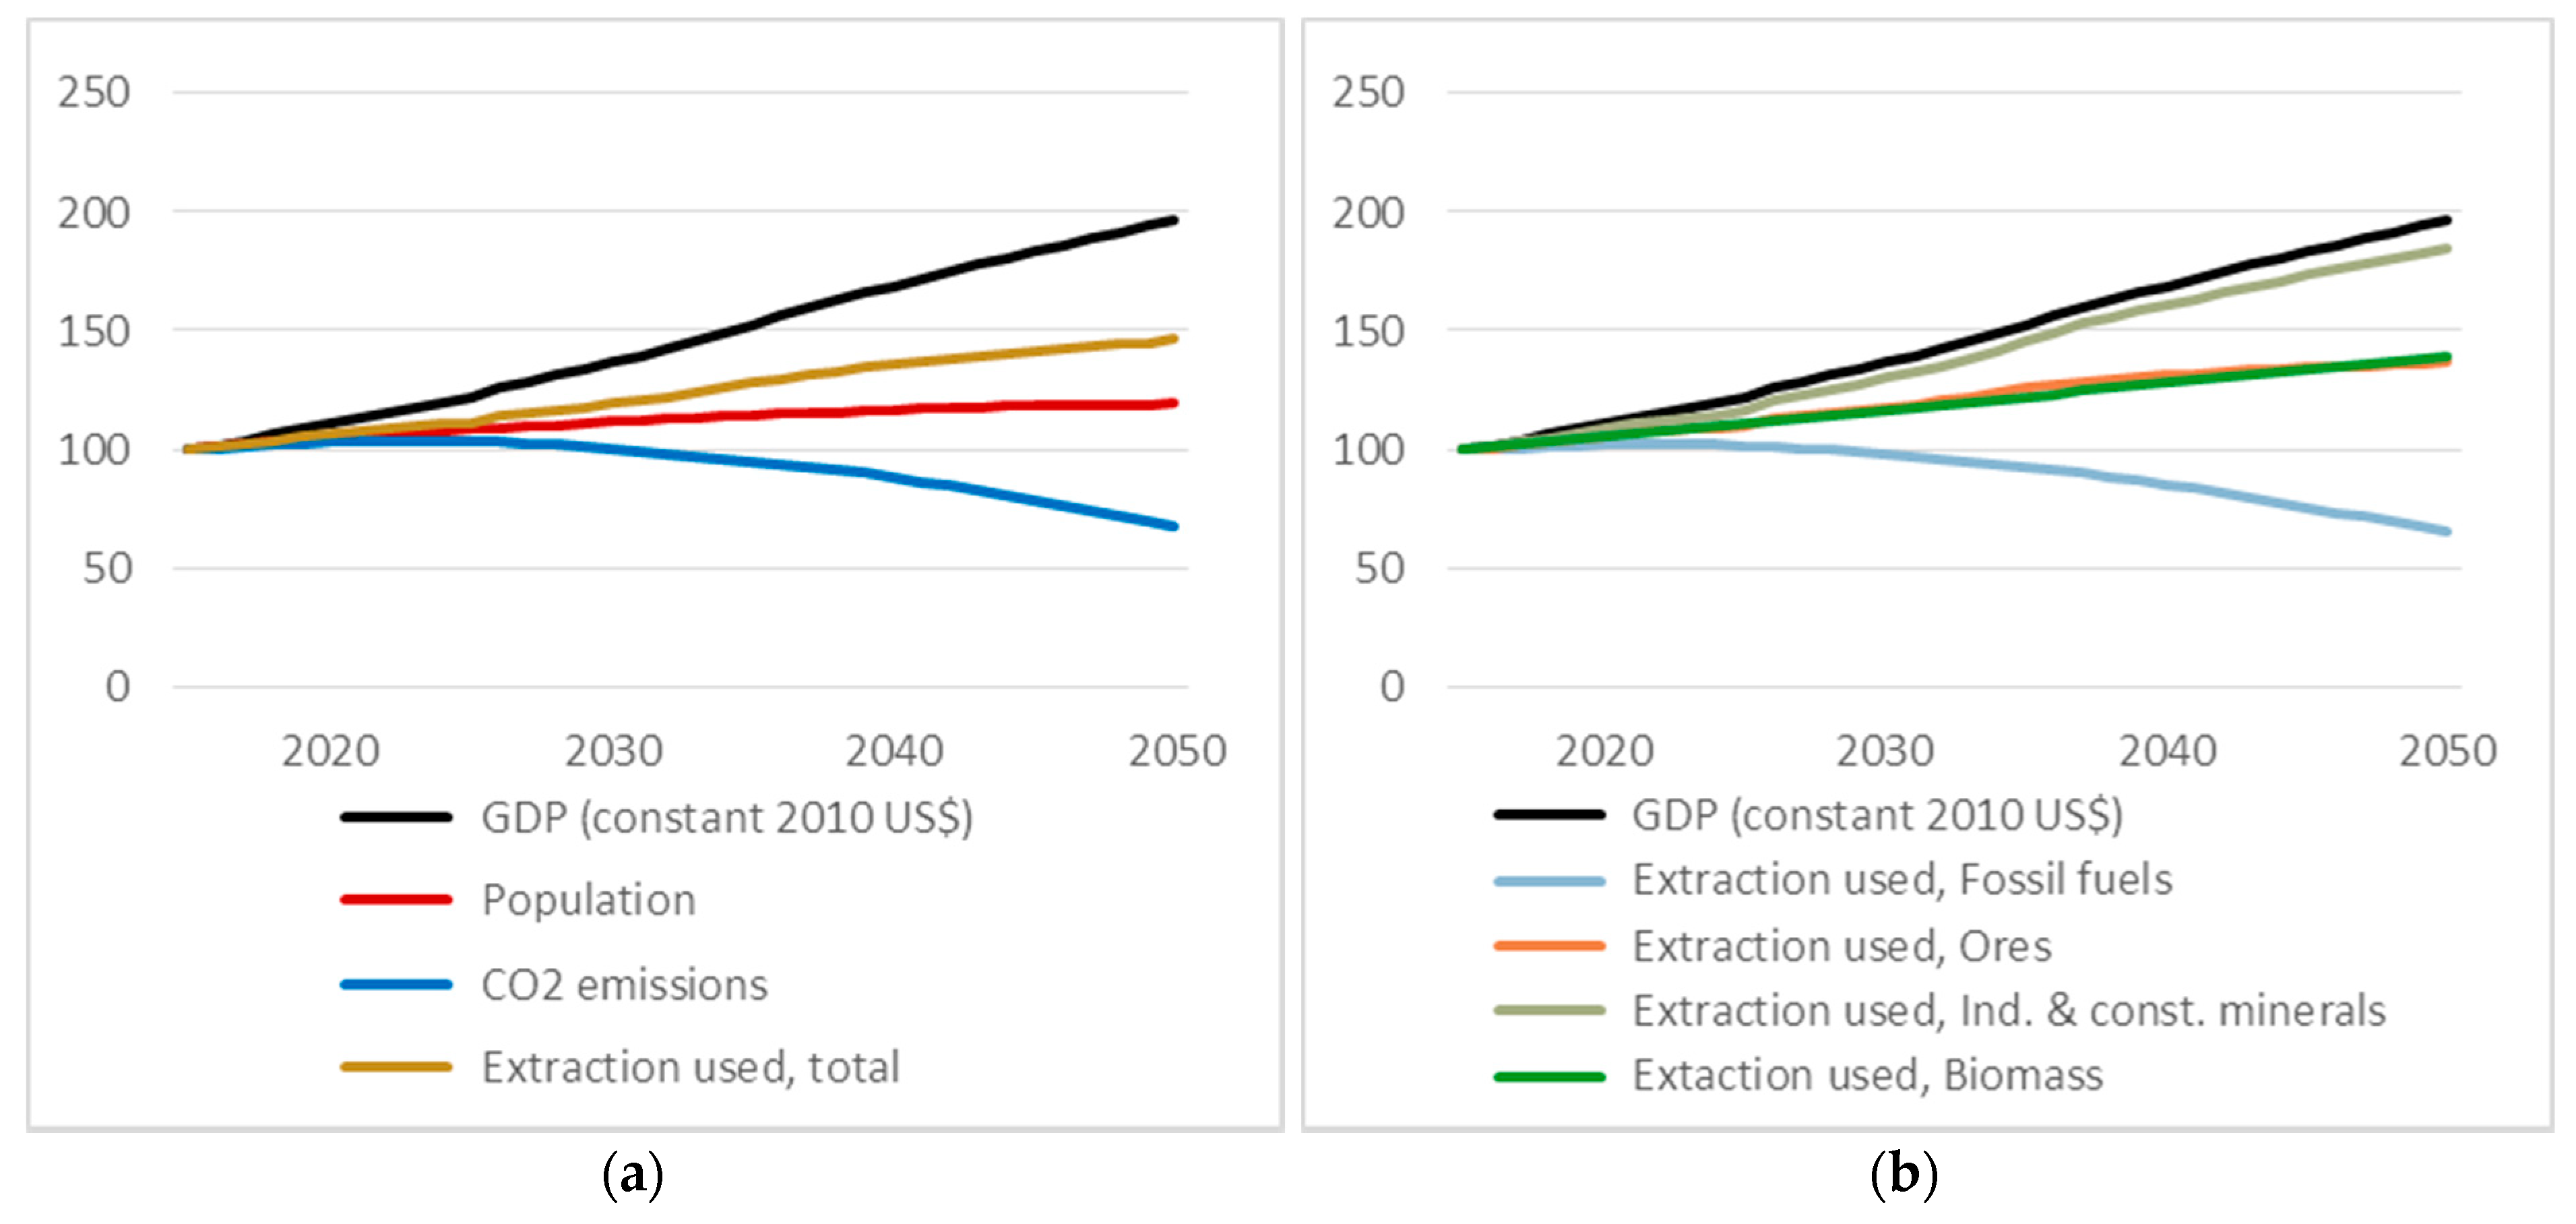
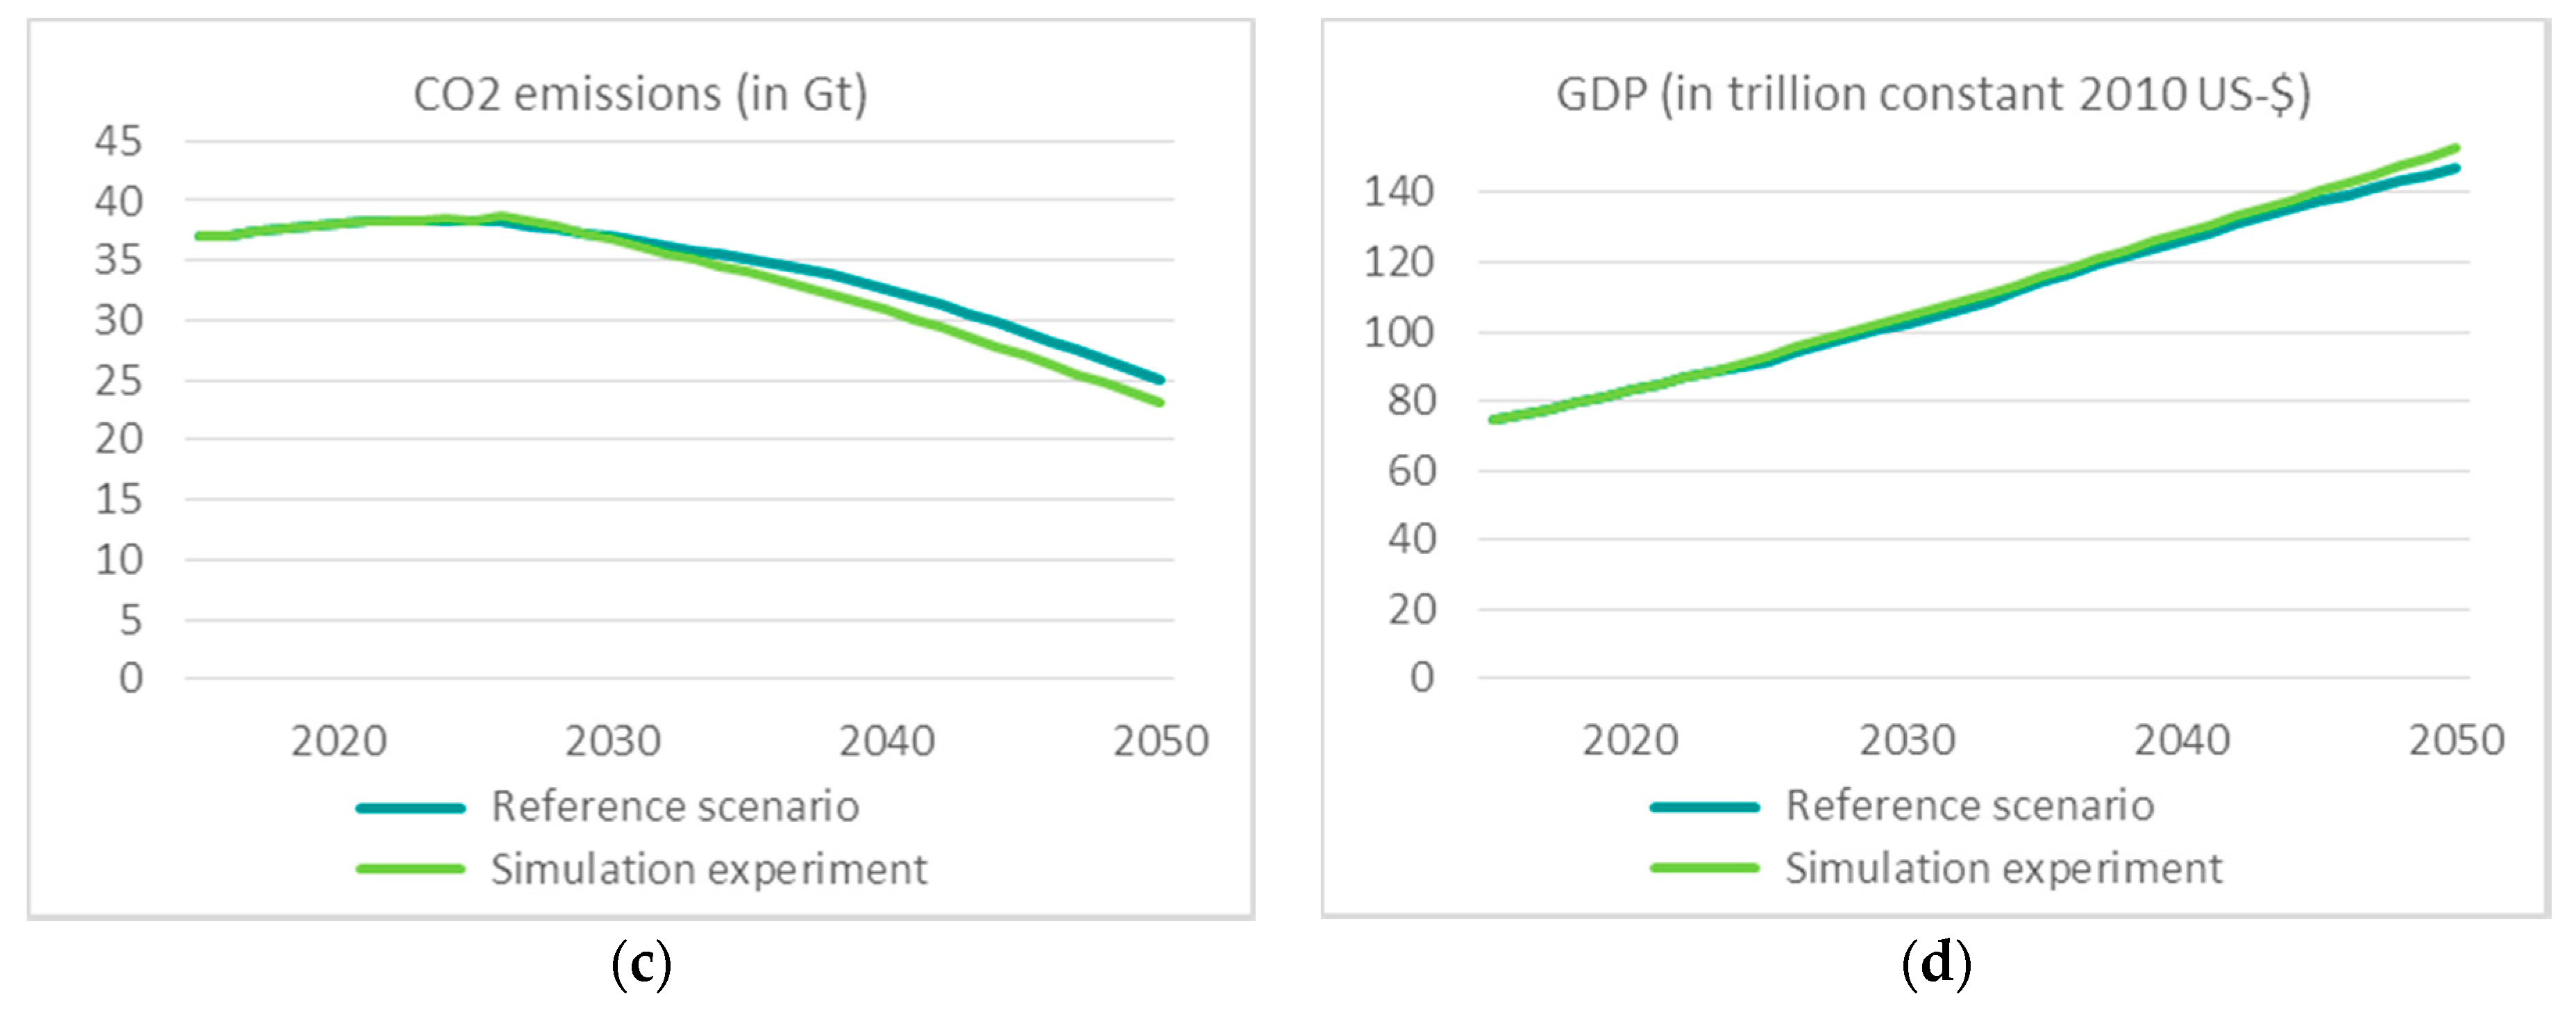
Figure 3 shows that, on a global level, the assumptions underlying the climate active baseline yield a doubling of GDP by 2050 (black line in Figure 3a) with an average annual growth of 1.8%. This baseline features exogenous population dynamics (exogenous input from WORLD6 model as outlined in Section 2.3.1) that are weaker than those in the authors’ previous publications [38,40]. Global population is assumed to level around 8.7 billion in 2050 (red line in Figure 3a). Global raw material extraction used increases by almost 48% over the simulation period (brown line in Figure 3a), while CO2 emissions display a slight increase until around 2025 and then a decrease by almost 30% by 2050 (blue line in Figure 3a). Therefore, Figure 3a indicates relative decoupling of resource use from GDP growth and absolute decoupling of CO2 emissions from GDP growth.
Used extractions of industrial and construction minerals are projected to increase more than 80% over this period (brown line in Figure 3b). This growth also exceeds the projected rise in globally used primary ore extractions, which increase by slightly more than 52% (orange line in Figure 3b). Resulting from the exogenous assumptions concerning the development of metal recycling rates, secondary metal ores would cover a larger share of metal ore demand, thereby dampening the increase in primary ore extractions used. Fossil fuel extractions also first increase slightly and then drop significantly from around 2025 onwards by approximately 30% until 2050. This mirrors the projected CO2 emissions in Figure 3a and is in line with the assumptions of the climate active scenario of globally increasing shares of renewables in energy production. Not least because of the use of energy crops, the biomass extractions in our projections increase by some 40% until 2050.
3.1.2. Potential Impacts on Regional Material (RMC per Capita) and CO2 Footprints
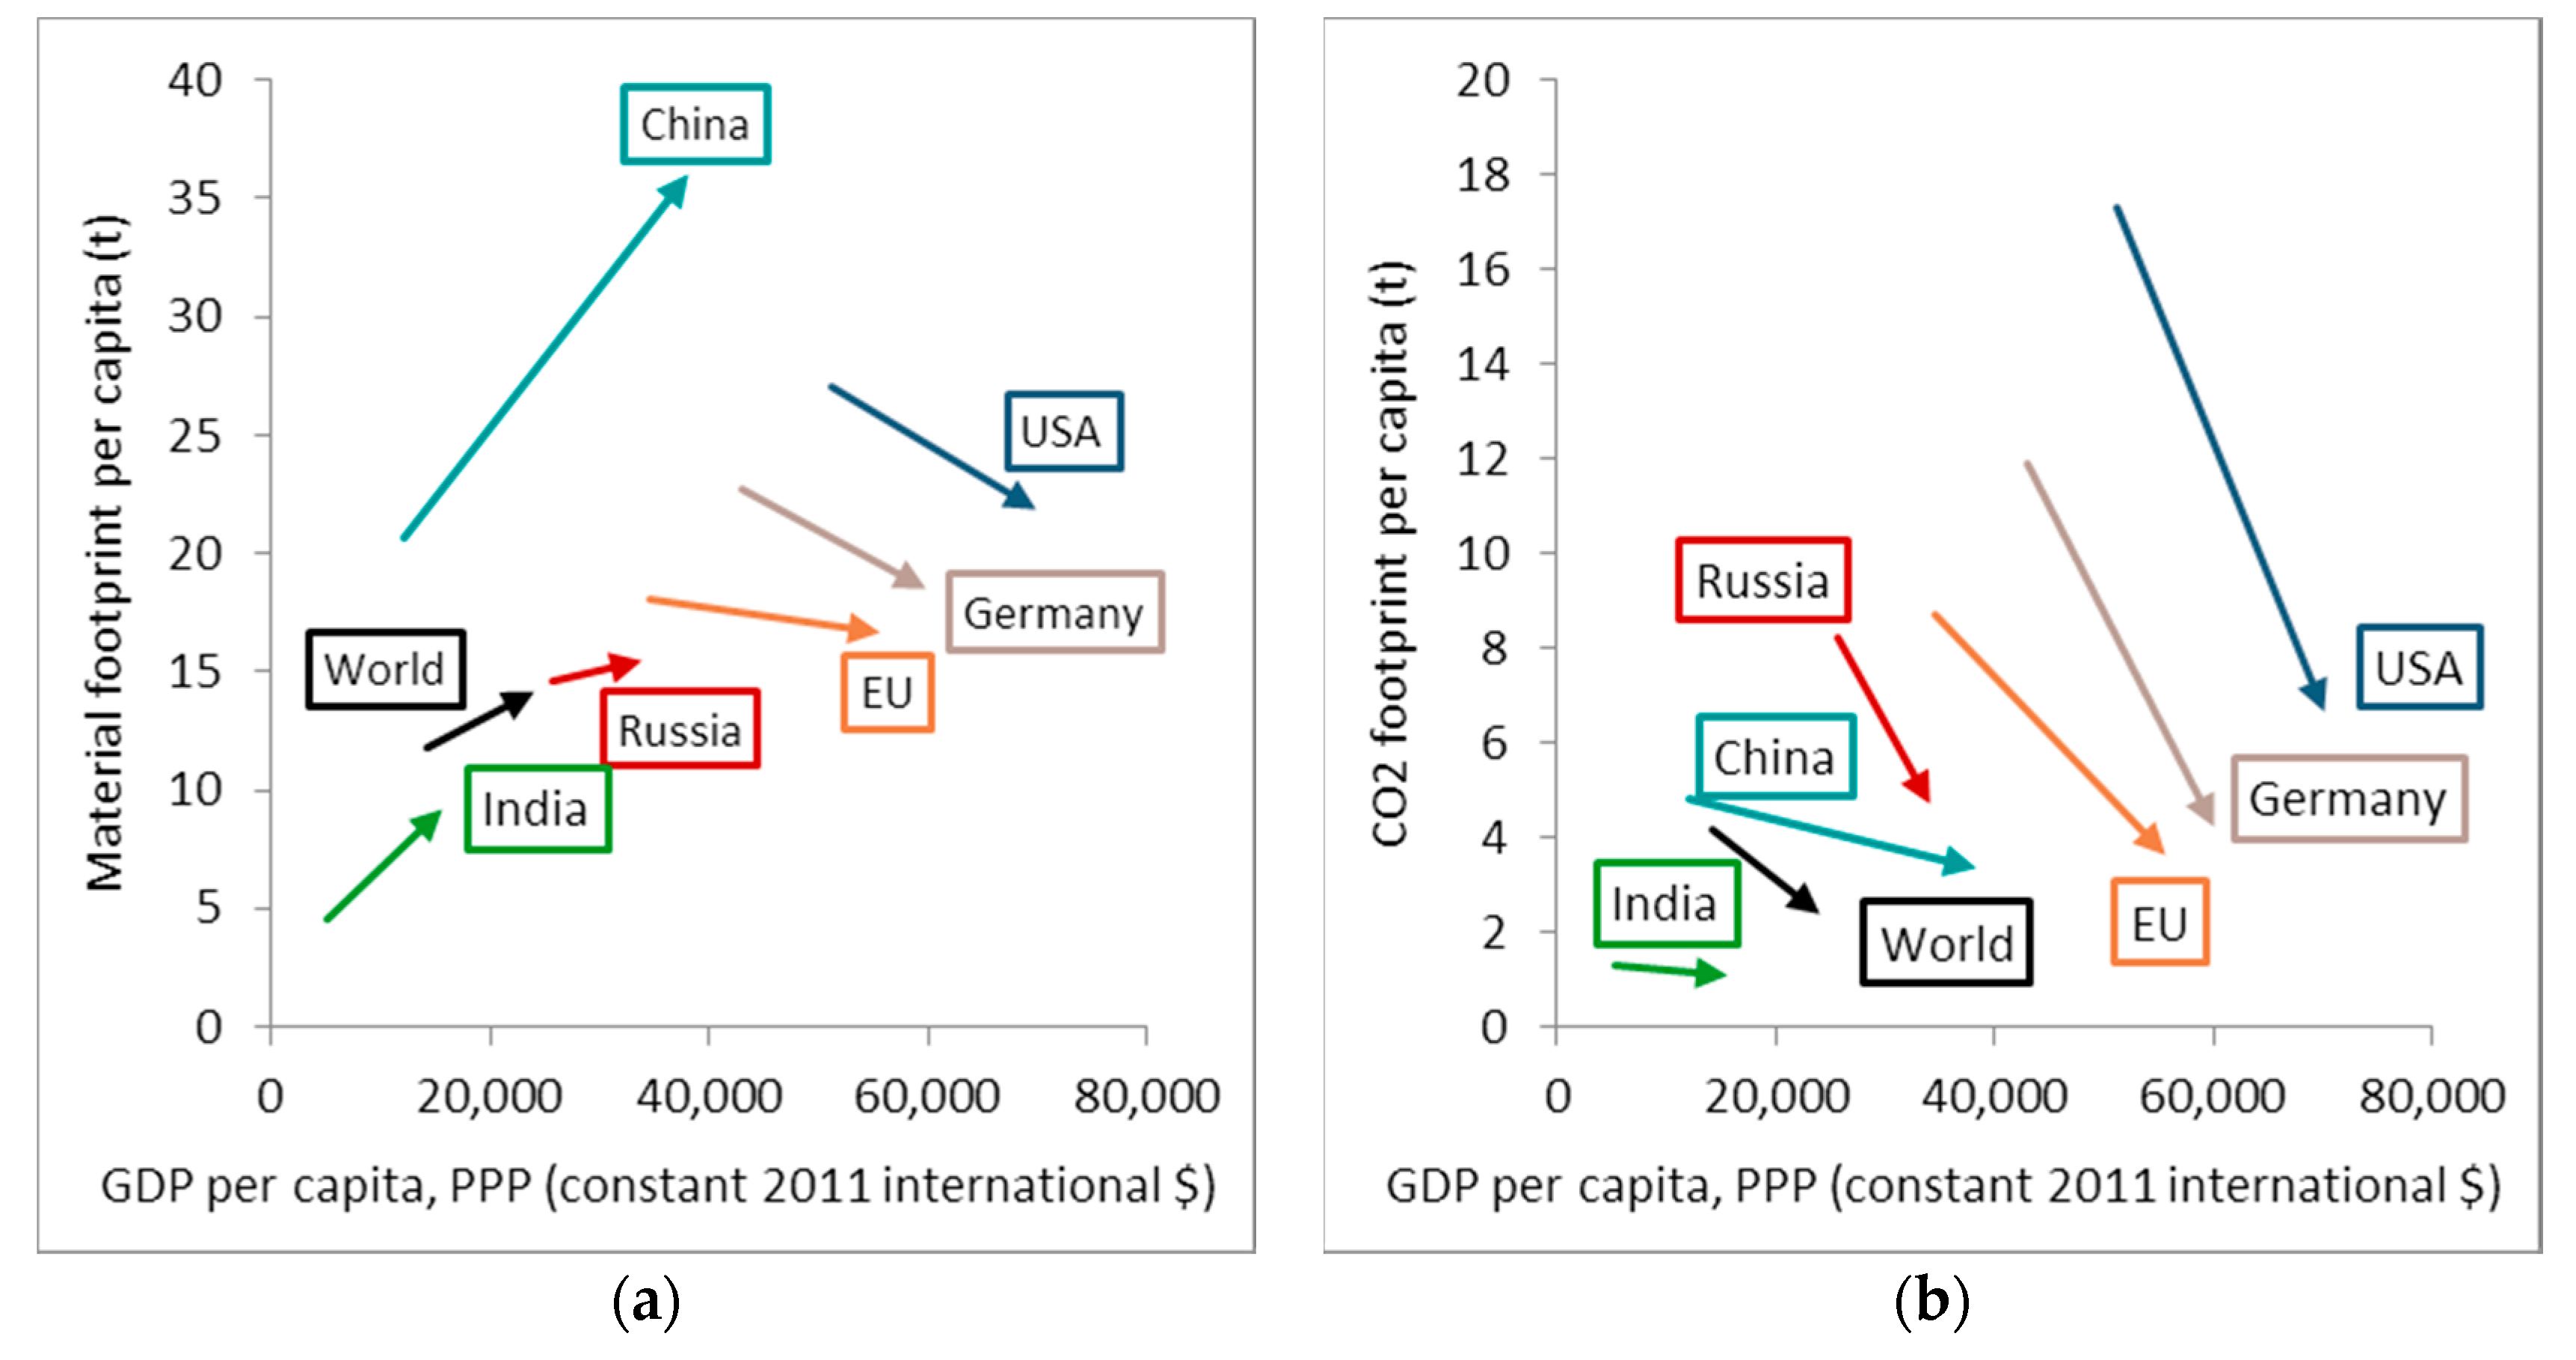
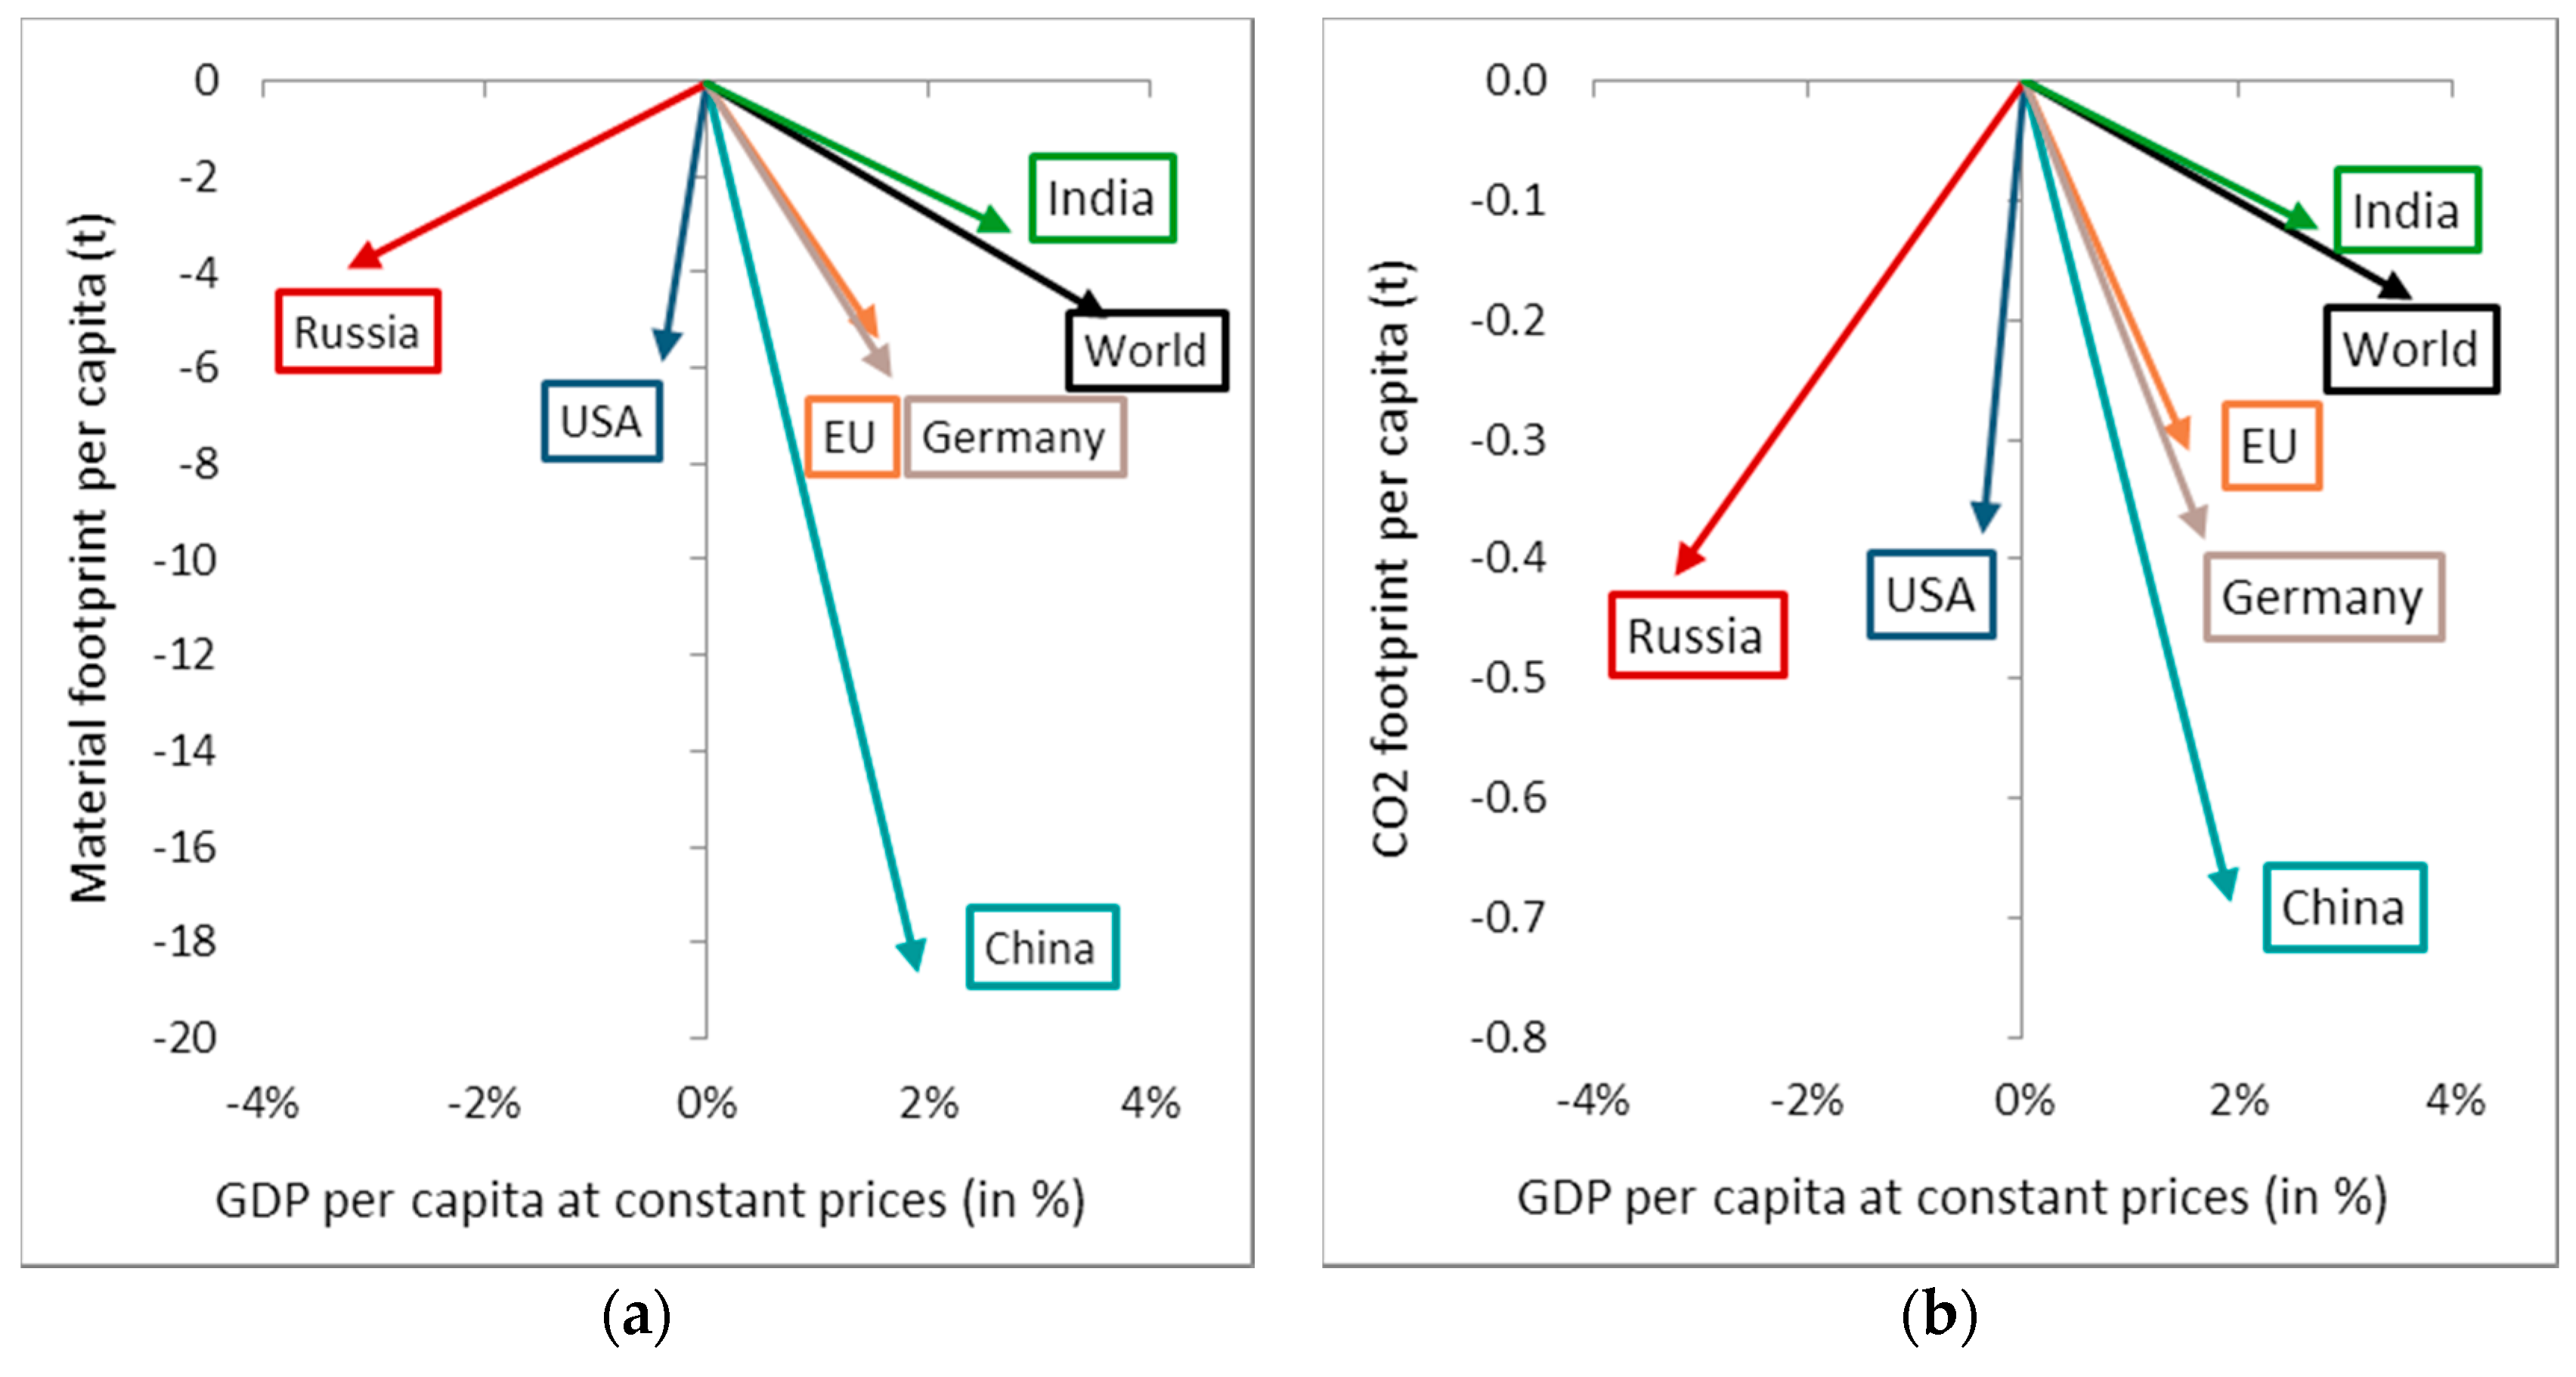
Looking at potential impacts at the level of different countries and regions (EU), the scatter plot shown in Figure 4a compares own estimates of present per capita material footprint relations with year 2050 simulation results. For illustrative reasons, selected per capita material footprint results are depicted against per capita GDP values. To facilitate a visual interpretation of the results, the arrows connect contemporary reference values for regional (per capita) RMC to (per capita) GDP relationships with corresponding year 2050 simulation results. That is, we abstained from individual mappings of simulated annual development dynamics. The same applies in the case in Figure 4b, which compares present regional per capita CO2 footprint in their relation to regional (per capita) GDP with year 2050 simulation results.
Figure 4a shows that simulating the climate active baseline yields absolute decoupling tendencies for the highly industrialised economies of the EU, Germany and the US. However, it also indicates that development trends in key industrialising economies in Asia (China and India) are driven by catch-up effects with material footprints increasing faster or in lock-step with GDP-growth. As these countries are expected to dominate primary raw materials use in the future (in particular China), we can only observe relative decoupling on the averaged global level (World in Figure 4a). The reason behind the highly dynamic projection of China’s material footprint lies in China’s infrastructure investments, which surged over the historical observation sample of the GINFORS database (starting in 1995) and are expected to continue to be significant in the coming years (see, e.g., WBGU (2017) [23]). Whereas it may well be anticipated that these investment dynamics will not be maintained until 2050, it is apparently challenging to project respective saturation effects for the Chinese economy (other studies arrive at similar conclusions, see, e.g., IRP (2017) [8], Distelkamp and Meyer (in press) [38], and OECD (2017) [39]).
Figure 4b shows the absolute decoupling of economic growth from CO2 emissions (declining per capita CO2 footprints, while GDP keeps growing) for all modelled economies. This is in line with key assumptions of the climate active baseline, which feature climate mitigation efforts at the global and national levels. The strongest reductions in per capita CO2 footprint occur in industrialised economies: the US, Germany and the EU. These economies start reductions from the highest base levels, however, and they are projected to remain among the most CO2 intensive in 2050. The 2050 values in Figure 4b are 6.7 for the US, 4.7 for Russia, 4.2 for Germany and 3.7 for the EU while China (3.4) has a higher per capita CO2 footprint than the World average (2.4), and India, a lower one (1.1).
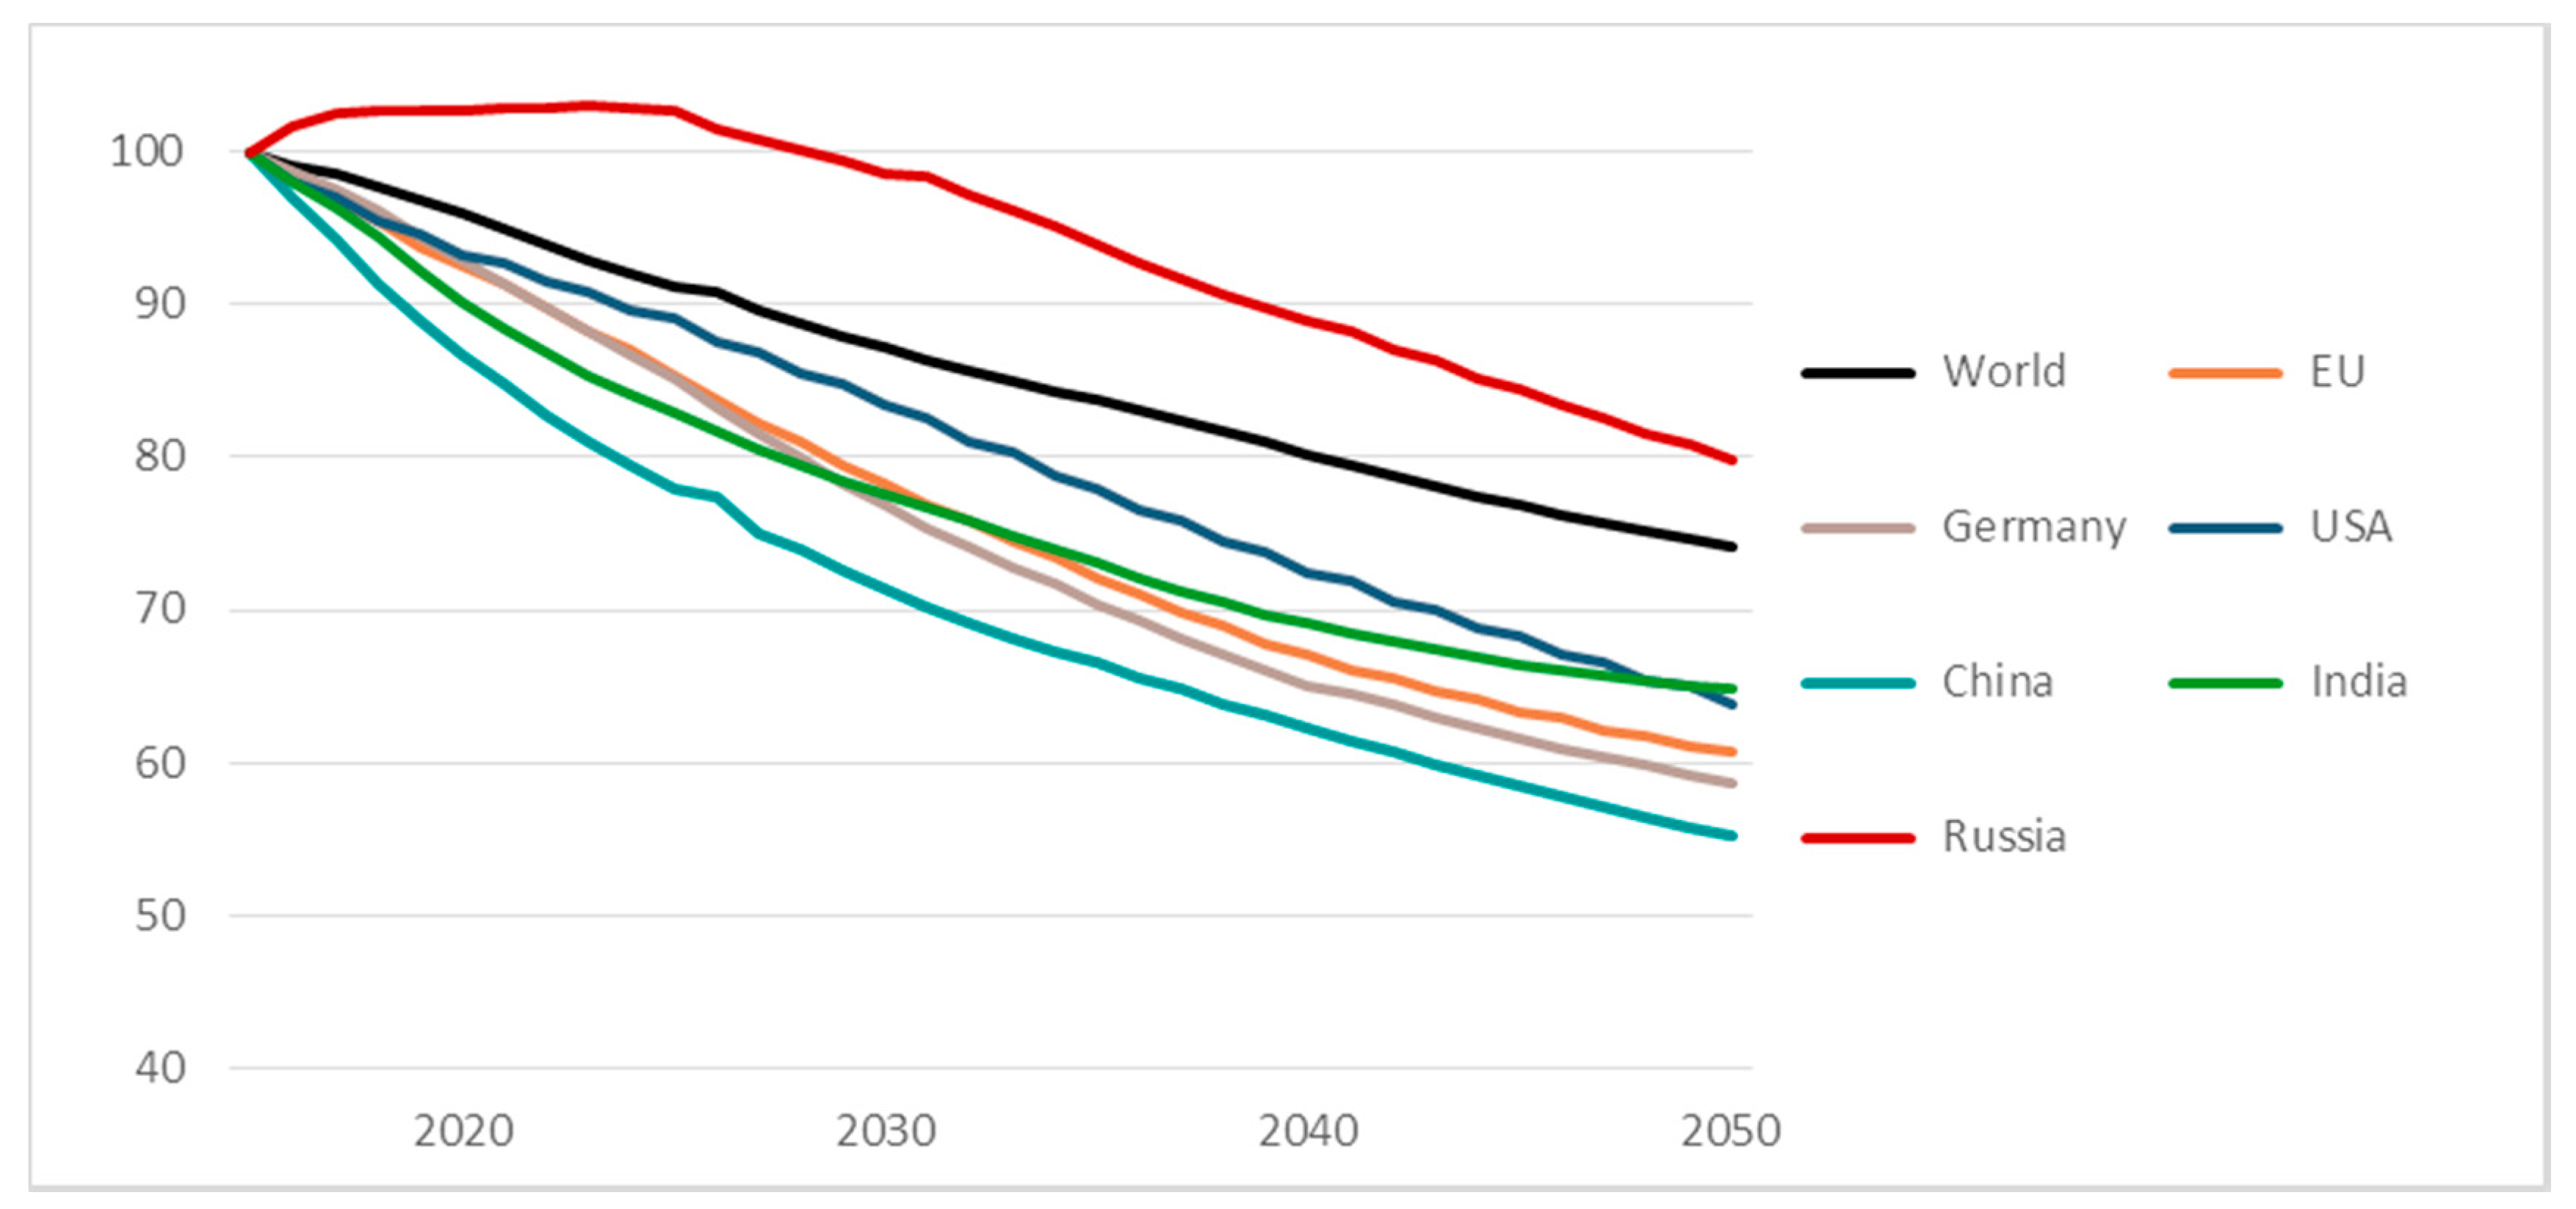
Figure 5 yields additional insights as to the developments in raw material intensity footprints, i.e., the raw material input needed to generate a unit of GDP. The figure shows an indexed representation of the raw material input (RMI)/GDP ratio for selected countries. Concerning the raw material intensity of international production activities, the climate active baseline already leads to increased resource efficiency (illustrated as decreasing resource intensity). On a global average (the black line for World), the ratio of raw material input to GDP decreases by (slightly more than) 25% until 2050. All economies presented in Figure 5 show declining trends in their raw material intensity until 2050; the smallest decrease was simulated for Russia, the largest for China. It should be clear, however, that these improvements in China’s resource efficiency do not imply extensive changes in the multi-national structures of global primary raw materials demand. Even with this strong decline in resource intensity, the absolute value of China’s year 2050 raw material inputs is projected to represent the largest overall RMI figures among all countries presented in Figure 5. Therefore, we might conclude that the projected improvements in China’s resource efficiency represent the transition dynamics from rather inefficient base levels (of a contemporary rapidly industrialising nation) to the levels of already-industrialised Western economies.
3.2. Resource Efficiency Improvements—Potential Impacts of the Simulation Experiments
3.2.1. Potential Impacts on Global Economic and Environmental Indicators
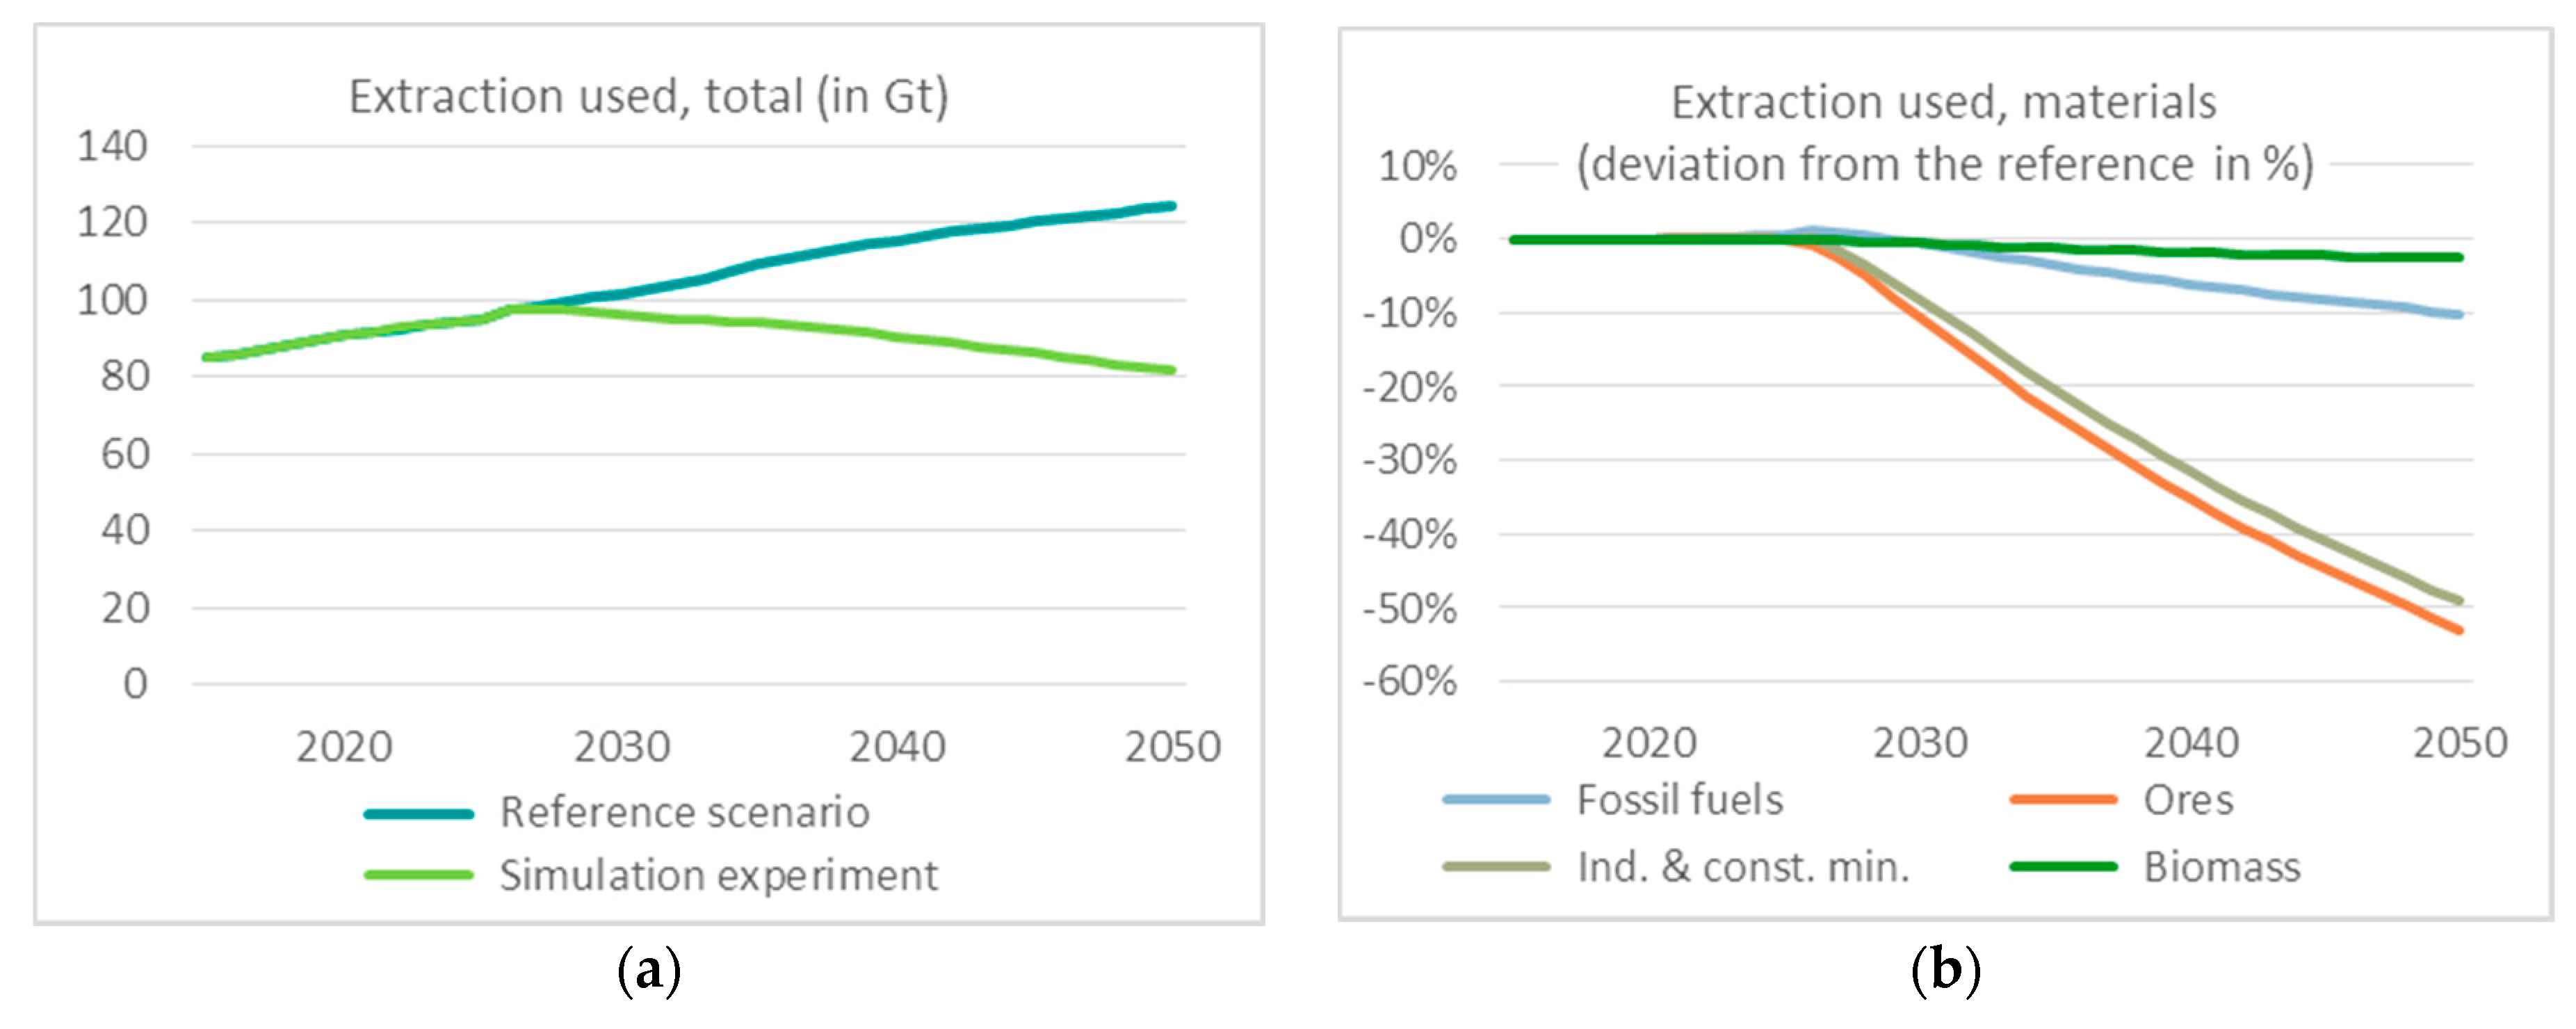
Figure 6 shows the modelled impacts of the assumed resource efficiency improvements (outlined in Table 5) on globally used extractions in general and per raw material category in particular; on global CO2 emissions, and on global GDP (see Section 2.3.3 for the assumptions underlying the simulation experiments).
Figure 6a illustrates that the assumed additional resource efficiency improvements for resource-relevant production technologies/sectors (intermediate inputs) are based on a rather optimistic scenario. Overall, we observe a reduction of the globally used resource extractions by around 40 Gt (Gigatonnes) to approximately 80 Gt in 2050 (a reduction of almost 35%) compared to the climate active reference scenario (blue line in Figure 6a). This effect may be ascribed predominantly to the reduction of ores and non-metallic minerals inputs to global production activities (see Figure 6b). Overall, the assumed direct reductions in material relevant inputs do result in an average reduction of more than 40% for industrial and construction minerals and more than 50% for ores in global raw material consumption figures. Please note that the figures in Figure 6b refer to relative deviations from corresponding baseline results. The observed pattern for biomass demand thus indicates that global demand for this material category remains rather unaltered between both scenarios (see Figure 3b in Section 3.1.1 for an illustration of respective baseline projection levels). This finding is in line with the fact that global biomass demand is primarily associated with population growth and corresponding human nutrition needs (see, e.g., the long-term analysis of historical global raw material development trends by Krausmann et al. (2009) [28]). Given that both scenarios assume identical global population dynamics, this observation appears rather self-evident.
As the simulated essential reductions in intermediate demand lower global ore and non-metallic mineral production levels, the energy requirements for their production are also reduced, which promotes further reductions in CO2 emissions. In Figure 6c, we can also observe that the additional increases in resource efficiency tend to facilitate the transition towards a low-carbon society: the simulated resource efficiency improvements lower global per capita CO2 emissions by about 10% in comparison to the climate active baseline. This is a remarkable result as all direct impulses considered within the resource efficiency scenarios were influencing exclusively non energy-related inputs.
Against the steep increase in global GDP, which both the climate active scenario baseline and the simulation experiments project (see Figure 6d), the reduction in globally used extraction implies an absolute decoupling of economic development from resource use at the global level. The assumed additional investment needs trigger global GDP growth, which is some 5 trillion US$2010 higher in the simulation experiments than in the climate active reference scenario and represents a 4% deviation from the latter.
3.2.2. Potential Impacts on Regional and National Material and CO2 Footprints
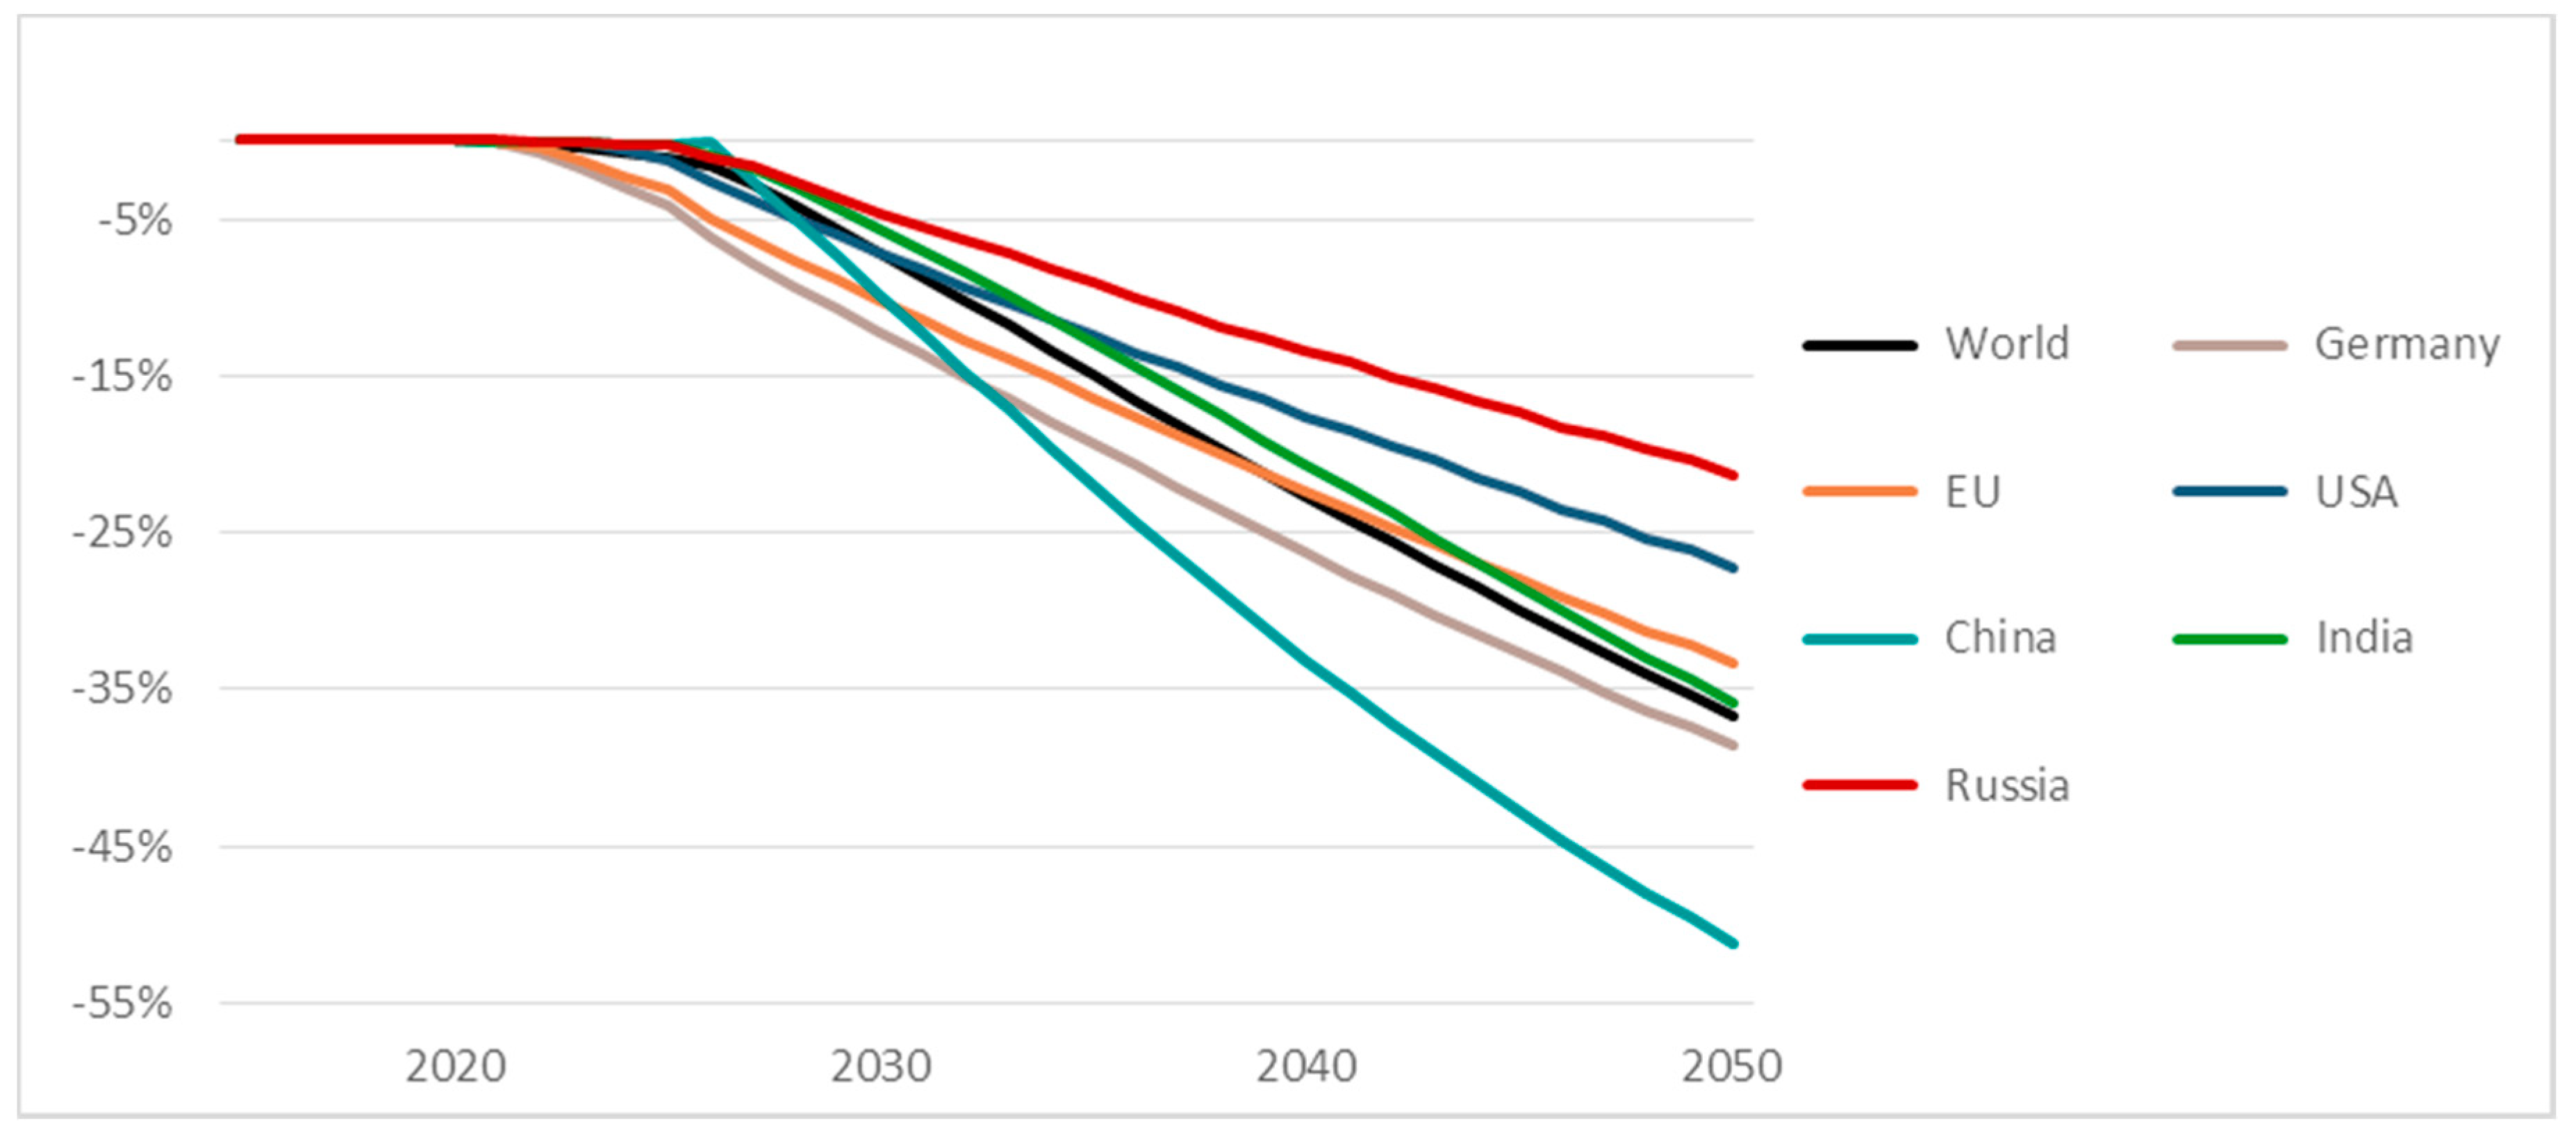
Figure 7 compares simulated trends for economy-wide resource intensity indicators (RMI/GDP) across several countries and regions (EU, World). Shown are the percentage deviations from the climate active scenario baseline. Similar to the findings for the climate active scenario, the greatest reductions by 2050 can be observed for China (greater than 50% compared to the baseline), while Russia witnesses the lowest level of reductions (with some 21% lower than the baseline). Germany ranks second in reduction achievements (almost 40% lower than the baseline).
As regards material and CO2 footprints, the simulation experiments yield reductions by 2050 for all economies presented (see Figure 8). Whereas this graph illustrates simulated percentage year 2050 deviations from corresponding baseline results, we can ascertain that the strongest reductions in material footprints (Figure 8a) emerge for China (more than 18 tonnes per capita lower than the climate active scenario baseline), Germany, the US and the EU (each around 6 tonnes lower than the baseline). Meanwhile, CO2 footprint (Figure 8b) reductions are strongest for China (almost 0.7 tonnes per capita lower than the baseline), Russia, Germany and the US (each between 0.4 and 0.35 tonnes lower). Looking at the GDP developments in the economies covered, Figure 8 indicates that resource efficiency improvements have positive economic impacts in the majority of countries covered, except for the US and Russia, where GDP decreases by 0.2% (US) and around 3% (Russia).
Compared to the material footprint reductions that we projected for the climate active scenario baseline, the simulation experiments show absolute decoupling by 2050 for more countries. In addition to the EU, Germany and the US, China and Russia also achieve an absolute decoupling of material footprints from economic growth (or, in case of Russia and the US, a stronger reduction in respective material footprints compared to GDP). Regarding CO2 footprints, our projections indicate absolute decoupling for all national and regional economies modelled—which we had already found for projections of the climate active scenario baseline. Adding resource efficiency improvements to ambitious climate policy helps to further reduce CO2 emissions, but the greatest reductions in per capita CO2 footprints result from climate policy (see Figure 4b). Nonetheless, resource efficiency improvements have relevant climate mitigation effects. For instance, the per capita CO2 footprint for China fell by approximately 1.4 tonnes by 2050 in the climate active scenario baseline (see Figure 4b), while resource efficiency improvements further reduced it by almost 0.7 tonnes, therefore achieving almost half the amount of reductions that climate policy effects did.
4. Discussion
4.1. Belief in Progress: Critical Notes on the Prospects for Extensive Autonomous Accelerations in Current Resource Efficiency Trends
4.1.1. It May Be Possible to Achieve Significant Reductions in Global Raw Material Extraction Levels by Improvements in Resource Efficiency
Our simulation experiments indicate that significantly improving resource efficiency in production sectors and technologies can help achieve absolute decoupling of raw material extraction and CO2 emissions from economic development (GDP growth). Here, we would like to highlight that the simulation experiments can be classified as rather ambitious reduction scenarios.
Assuming an (additional) autonomous increase in global resource efficiency by 2% p.a. (compared to the climate active scenario baseline developments) for a pre-selected set of 75 input coefficients in all modelled economies, we project globally used material extractions to level around 80 Gt in 2050. Referring to other studies which project global—and regional—material extraction levels within comparable methodological frameworks, we may assert that these levels appear rather low. Hatfield-Dodds et al. (2017) [37], for example, found a global value of approximately 132 Gt for material extraction in 2050 in an “efficiency plus” scenario. This scenario assumes three measures driving improvements in resource efficiency (technical innovations, a resource extraction tax, and an exogenous resource demand shift) as well as ambitious greenhouse gas abatement policies on a global level (including a carbon price of US$573 in 2050). Earlier work by Schandl et al. (2016) [62] projects global material extractions to stand slightly above 95 Gt in 2050 in a “high efficiency” scenario, which includes: (i) a global carbon price of more than US$236 in 2050; and (ii) improvements in resource efficiency assuming the use of best available technologies in heavy industry (iron and steel and cement production), manufacturing, construction and performance of buildings, transport and mobility, and agriculture and food. Schandl and co-workers’ study does not, however, account for any economic drivers of resource efficiency (such as investment activities, relative price ratios, income and rebound effects).
In our simulation experiments, we find the material footprint to be slightly above 10 tonnes on a global per capita level. This is very similar to the findings of Schandl et al. (2016) [62], which come in just below 10 tonnes (calculated by dividing 95.2 billion tonnes of material extractions at the global level in 2050 by 9.77 billion people, taken from the medium variant of the population outlook of the United Nations (2013) [63]). Hatfield-Dodds et al. (2017) [37] arrived at a value of more than 14 tonnes per capita in 2050 in their “efficiency plus” scenario.
These comparisons with findings reported in other simulation studies are insightful: While our assumed resource efficiency improvements lack references to individual technologies and respective engineering expertise, they do not deviate for aggregated global figures from published scenario projections, which feature more complex mappings of individual technologies by applying coupled multi-model simulation frameworks. Hence, even without detailed information on further prospective technical production potentials available for the simulation experiments in this research project, our assumed efficiency improvement rates may be interpreted as rather crude but nevertheless acceptable approximations for the parameterisation of a high efficiency scenario.
4.1.2. Such Significant Reductions, However, Require Rather Exceptional Accelerations in Global Resource Efficiency Not Witnessed Anywhere in the Past
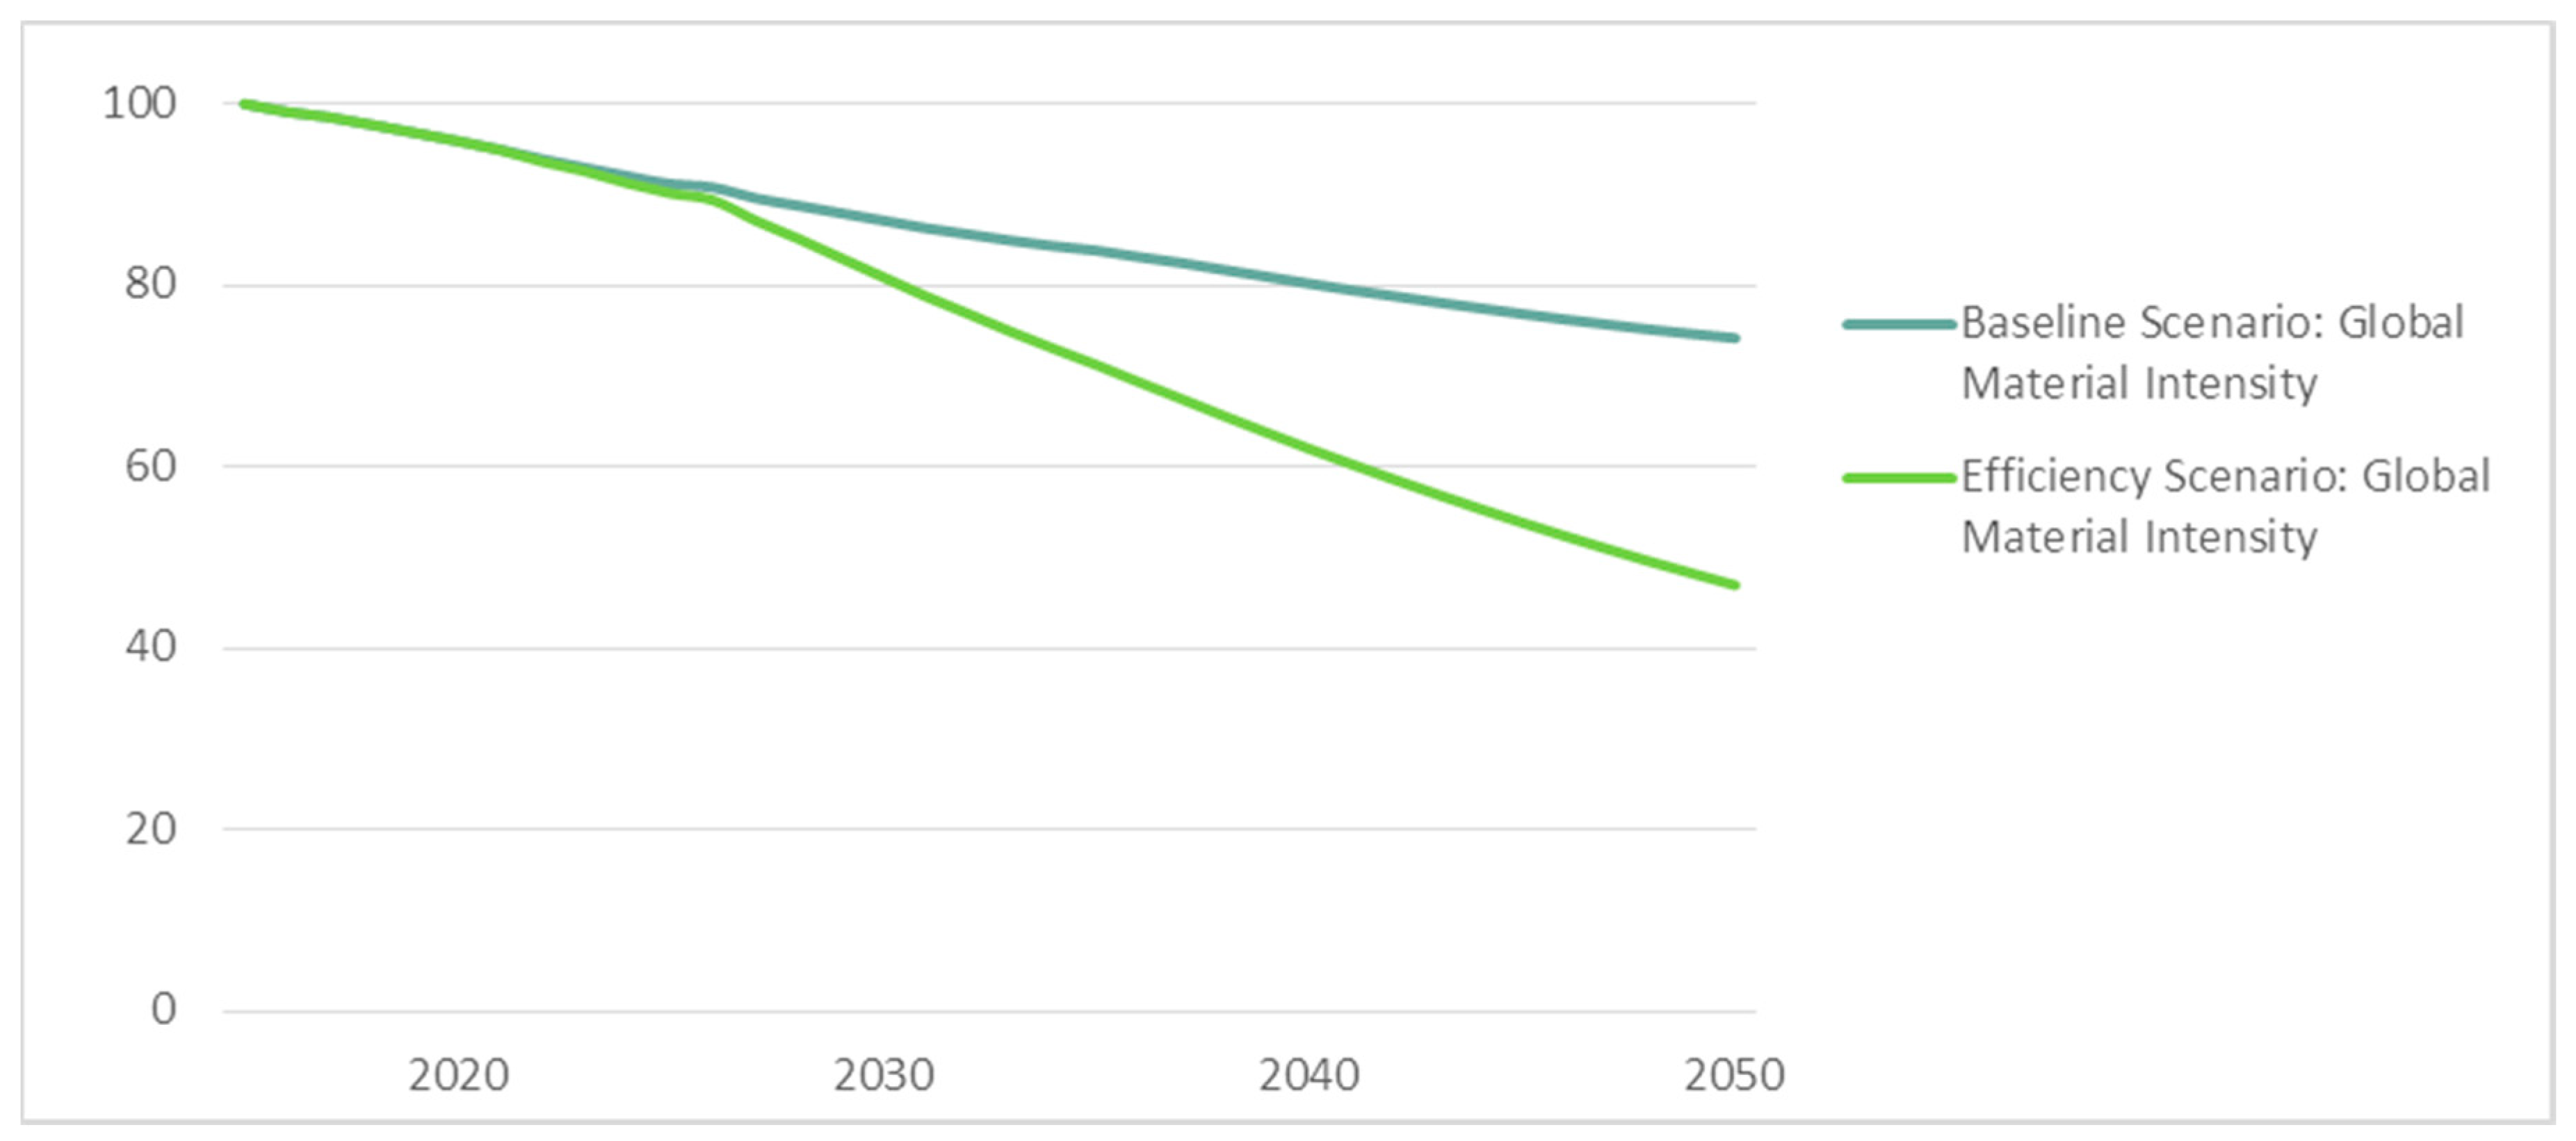
In our simulation experiments, we assumed for each modelled economy an additional annual increase in resource efficiency of 2% for a set of 75 input coefficients. Furthermore, due to the dynamic simulation properties of the applied model, the climate active scenario baseline simulation accounts for sustained progress in raw material efficiency based on historic experiences. Figure 9 merges indexed global raw material intensity projections from the baseline (as already illustrated by the black line in Figure 5) with a corresponding representation of the global findings from our simulation experiments (green line in Figure 9). Whereas the baseline simulation endogenously projects an overall decrease of global raw material intensity by approximately 25% (compared to 2015) by 2050, our raw material efficiency simulation experiment assumes that fostered progress on resource efficiency may reduce global material intensity by more than 50% (compared to 2015) by 2050.
We acknowledge that this assumption is rather bold as we cannot control for any relevant technological barriers, which could effectively impede the assumed efficiency improvements for individual input coefficients. Constituting an examination of the potentials of and prospective systemic responses to maximal conceivable achievements in resource efficiency from a macroeconomic perspective, our simulation results should be interpreted as a quantified illustration of a very optimistic “best” efficiency scenario when compared to selected findings from the previously mentioned studies. Whereas both Hatfield-Dodds et al. (2017) and Schandl et al. (2016) projected relative decoupling, i.e., global material extraction still increasing until 2050 (from 84 to 132 Gt (Hatfield-Dodds et al. (2017)) [37] and from around 80 to 95.2 Gt (Schandl et al. (2016)) [62]), our simulation experiments do indicate slight absolute reductions by around 2 Gt.
4.2. Critical Notes on the Orientation and Ambition of Currently Prevailing Environmental Policy Approaches
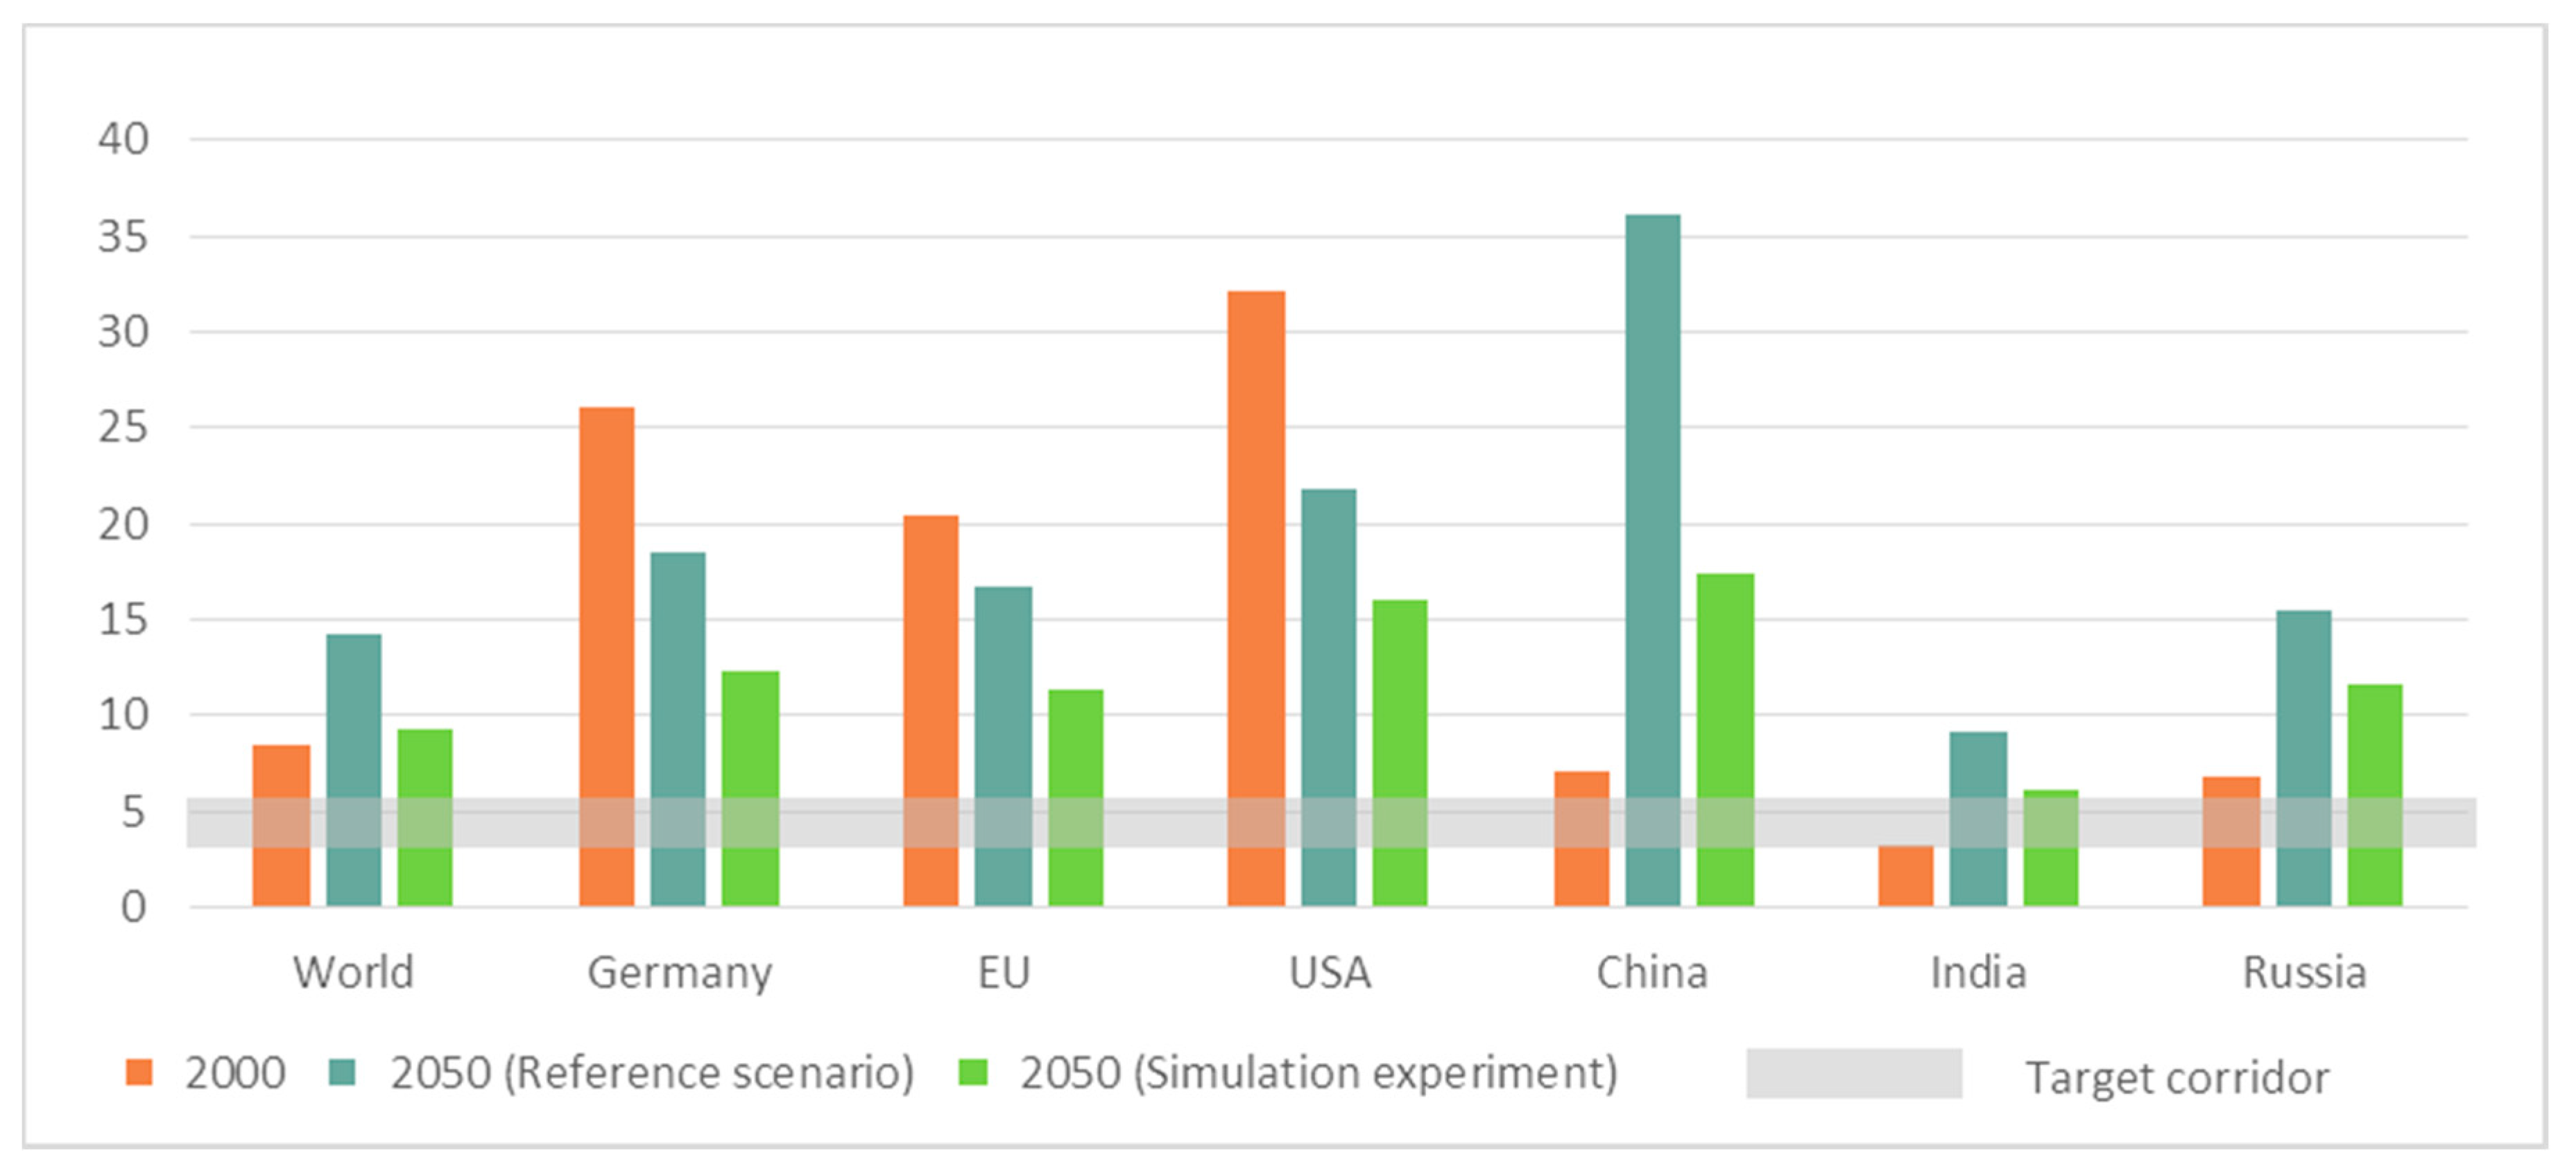
Compared to other studies, our results provide a very positive outlook on the decoupling progress that may be achievable through (maximum) efficiency improvements. However, the question remains whether such developments may already be considered sufficient under sustainability considerations. Bringezu (2015) [13] suggested an RMC-target value of five tonnes per capita (or a range of 3–6 tonnes per capita) for the year 2050. Figure 10 shows year 2050 per capita material footprint projections from our simulation experiments together with the suggested 3–6 tonnes target corridor. According to this figure, none of the illustrated countries and regions is projected to achieve this target range in 2050. Whereas India features the lowest per capita RMC-values of all countries depicted, respective findings from the simulation experiments indicate that the upper range of six tonnes per capita will also be slightly exceeded in India in 2050.
We are well aware that these target values can be intensively discussed. The indicated target ranges pursue a global equity approach (allocating the same amount of primary raw materials to each global citizen) and have been deduced from normative reasoning. As it is impossible to derive any kind of globally optimal extraction levels, they have been set to ensure (more or less arbitrary) medium to long term reductions in global extraction activities. Furthermore, as noted by an anonymous reviewer, it seems generally difficult to interpret these averaged figures because different extraction activities are accompanied by different environmental impacts.
Nevertheless, the robust indication that diverse scenarios with large efficiency improvements, such as by Hatfield-Dodds et al. (2017) [37], Schandl et al. (2016) [62] and us, miss these suggested target corridors also raises the question whether policy can maintain isolated efficiency improvement paradigms over the coming decades. As rebound effects tend to dampen the overall effects of resource efficiency improvements on global raw material extraction level, we think that resource policy needs to also tackle the economic, social-psychological and political mechanisms fuelling rebound effects (see, e.g., Binswanger (2001) [9] and Santarius and Soland (2016) [64]). Resource policy approaches will have to overcome isolated efficiency improvement paradigms, integrate rebound mitigation strategies and also tackle the complex issue of structural and behavioural changes. This will require comprehensive policy mixes, including incentives, penalties and coercion. Simulation results presented by Distelkamp and Meyer (in press) [38] and Meyer et al. (2015) [40] indicate that ambitious global efforts to implement an extensive policy mix have the potential to induce an absolute decoupling of global economic growth from primary resource use. It at least seems plausible to call for globally concerted resource policy efforts, which include strong instruments (involving, inter alia, economic as well as regulatory policy instruments), to foster decoupling.
The mutual positive effects we find for resource efficiency improvements both on raw material extraction levels and CO2 emission levels may aid the implementation of resource policy approaches around the world. Although the climate active baseline stresses the need for ambitious global and national climate policies, adding resource policy will support climate mitigation while fostering dematerialisation. A combined climate-resource policy approach can: (i) reduce energy requirements for the production of ores and non-metallic minerals through energy efficiency improvements; and (ii) reduce the need for ores and non-metallic minerals via material efficient technologies that promote further reductions in CO2 emissions (see, e.g., Ekins et al. (2014) [65] for a comparable argument).
Given our assumed efficiency improvements, we observed a reduction of almost 35% in globally used raw material extraction levels (compared to projected baseline developments) by 2050. Simultaneously, the simulated efficiency improvements induced a reduction of global (per capita) CO2 emissions by about 10%. Thus, an indicative value for the climate mitigation potential of fostering dematerialisation could be that a 1% reduction in global primary raw material consumption can be accompanied by almost 0.3% reductions in global CO2 emissions.
Furthermore, the projected slight increase in global GDP when adding resource efficiency improvements to the climate active scenario baseline indicates that resource policy can enhance the cost-efficiency of climate mitigation efforts. This supports the claim that “improving resource efficiency is indispensable for meeting climate change targets cost effectively” (IRP (2016) [66]) (p. 4). At the same time, supporting resource efficiency improvements by dedicated policy promises to trigger global economic growth (see, e.g., Ekins et al. (2017) [3]). However, regional differences occur. Our simulation experiments result, for example in slightly dampened GDP developments, relative to the climate active scenario baseline, for the US and Russia.
5. Conclusions
According to our study findings, improving resource efficiency in production sectors and technologies in concert with climate policy efforts can trigger absolute decoupling tendencies at global level as well as for various regional economies. However, this should not lead to the conclusion that no further policy-efforts are necessary. Instead, we see good arguments for stepping up policy efforts: First, we cannot rule out that our assumed efficiency advancements may not be transferred into practice due to technological, institutional and organisational barriers. Transdisciplinary research will be required to evaluate this issue. The simulation experiments presented in this paper could certainly benefit from an information exchange with technology-based physical models, which are capable of deriving the partial dynamics and bottlenecks of economic sectors from detailed stock and flow representations. As this kind of exchange of information with physical models could not be implemented within the current research project, it remains for future research activities to realise.
Realising the assumed efficiency improvements in production sectors and technologies requires investments in consultancy, research and development and gross-fixed capital formation that may exceed associated cost savings. Therefore, we personally doubt that the additional efficiency improvements assumed in our simulation experiments will occur unaided or by market forces alone [3], in particular where resource prices encourage inefficient resource use. Policy support to set conducive framework conditions, such as getting the prices right by phasing out subsidies that keep resource prices artificially low, taxing material use and providing direct financial or capacity support to (in particular small and medium-sized) businesses [24,31,37,67,68,69], will increase the likelihood to approach our modelled “best” efficiency scenario. We are convinced that such policy support will be required around the world to help achieve absolute decoupling trends observed in our model findings.
Nonetheless, because the base values of material extraction levels in many countries and regions are high, the magnitude of absolute reductions achieved towards the middle of the 21st century will unlikely be sufficient to reduce raw material extractions to the levels called for by sustainability scientists.
Thus, to increase the likelihood of achieving the per capita extraction levels suggested in the scientific literature, it appears necessary to transform current resource policy paradigms. The low to lacking relevance of absolute reductions as policy targets around the world complicates this matter. Currently, there are only a few resource efficiency related policy targets at the national level (China, Japan, South Korea, the US and European countries) and no targets at the European or international level (e.g., on a G7 or G20 level). Furthermore, all existing policy targets relate to relative decoupling [13,28]. Eliciting policy support for absolute reductions appears to be a paramount challenge [3,24,70]. Beyond stepping up the ambitiousness of national resource policy, commitment in relation to absolute decoupling should also be fostered in international discourse. Here, too, we consider international dialogue and agreements to also be a prerequisite to implementing effective policy instruments requiring international cooperation [71,72]. The potential need to arrange for compensation to balance winning and losing regions in terms of economic development (see, e.g., Binswanger (2001) [9]) reinforces the argument in favour of international resource efficiency agreements.
International dialogue might benefit from insights gained by applying dynamic MRIO simulation models. Although, recently, a couple of more or less comparable simulation approaches have emerged [39], a universally accepted simulation framework has not yet been adopted. Adopting a common simulation framework may neither be feasible (due to budgetary issues, intellectual property rights or other administrative barriers) nor necessary. However, we do believe that the complexity of the various aspects of economy-wide material uses generally speaks in favour of multi-model simulation frameworks and a continuous exchange of expert knowledge amongst international research groups. In that regard, we also advocate a comprehensive research agenda that can create and sustain the windows of opportunity necessary for relevant international research teams to carry out joint model-refinement works.
Author Contributions
M.M. and M.D. developed and maintained the actual version of the global MRIO simulation model GINFORS, which has been applied in this study. Together, they designed and performed the simulation experiments documented in this article and analysed the data. M.M. and M.H.-G. wrote the paper.
Acknowledgments
The results presented within this paper have been generated by the research project “SimRess—Models, potential and long-term scenarios for resource efficiency”, funded by the German Environmental Agency and the German Environment Ministry (FKZ: 3712 93 102).
Conflicts of Interest
The authors declare no conflict of interest. The founding sponsors had no role in the collection, analyses, or interpretation of data; in the writing of the manuscript, and in the decision to publish the results.
Appendix A

Table A1.
GINFORS3, geographical coverage.
| # | Country or Region |
|---|---|
| 1 | Austria |
| 2 | Belgium |
| 3 | Cyprus |
| 4 | Estonia |
| 5 | Finland |
| 6 | France |
| 7 | Germany |
| 8 | Greece |
| 9 | Ireland |
| 10 | Italy |
| 11 | Luxembourg |
| 12 | Malta |
| 13 | Netherlands |
| 14 | Portugal |
| 15 | Slovak Republic |
| 16 | Slovenia |
| 17 | Spain |
| 18 | Bulgaria |
| 19 | Czech Republic |
| 20 | Denmark |
| 21 | Hungary |
| 22 | Latvia |
| 23 | Lithuania |
| 24 | Poland |
| 25 | Romania |
| 26 | Sweden |
| 27 | United Kingdom |
| 28 | Russia |
| 29 | Turkey |
| 30 | Brazil |
| 31 | Canada |
| 32 | Mexico |
| 33 | United States |
| 34 | China |
| 35 | India |
| 36 | Japan |
| 37 | Korea |
| 38 | Australia |
| 39 | Rest of World |
Table A2.
Simulation experiments: altered parameters in the “best efficiency” scenario.
| Input Category | Affected Industry |
|---|---|
| Products of agriculture, hunting and related services | Food, Beverages and Tobacco |
| Metal ores | Basic Metals and Fabricated Metal |
| Basic metals | Transport Equipment |
| Other mining and quarrying products | Other Non-Metallic Mineral |
| Construction work | Real Estate Activities |
| Other mining and quarrying products | Construction |
| Basic metals | Machinery, n.e.c. |
| Other non-metallic mineral products | Construction |
| Basic metals | Electrical and Optical Equipment |
| Food products and beverages | Hotels and Restaurants |
| Chemicals, chemical products and man-made fibres | Rubber and Plastics |
| Construction work | Public Admin and Defence; Compulsory Social Security |
| Other mining and quarrying products | Chemicals and Chemical Products |
| Products of forestry, logging and related services | Wood and Products of Wood and Cork |
| Electrical machinery and apparatus n.e.c. | Construction |
| Chemicals, chemical products and man-made fibres | Health and Social Work |
| Other mining and quarrying products | Public Admin and Defence; Compulsory Social Security |
| Construction work | Health and Social Work |
| Electrical machinery and apparatus n.e.c. | Transport Equipment |
| Fabricated metal products, except machinery and equipment | Transport Equipment |
| Rubber and plastic products | Transport Equipment |
| Basic metals | Construction |
| Other mining and quarrying products | Agriculture, Hunting, Forestry and Fishing |
| Food products and beverages | Health and Social Work |
| Electrical machinery and apparatus n.e.c. | Machinery, n.e.c. |
| Wood and products of wood and cork (except furniture), articles of straw and plaiting materials | Construction |
| Fabricated metal products, except machinery and equipment | Machinery, n.e.c. |
| Chemicals, chemical products and man-made fibres | Transport Equipment |
| Construction work | Renting of M&Eq and Other Business Activities |
| Products of agriculture, hunting and related services | Public Admin and Defence; Compulsory Social Security |
| Basic metals | Chemicals and Chemical Products |
| Machinery and equipment n.e.c. | Transport Equipment |
| Construction work | Electricity, Gas and Water Supply |
| Construction work | Other Community, Social and Personal Services |
| Other mining and quarrying products | Food, Beverages and Tobacco |
| Rubber and plastic products | Construction |
| Fabricated metal products, except machinery and equipment | Construction |
| Chemicals, chemical products and man-made fibres | Basic Metals and Fabricated Metal |
| Other non-metallic mineral products | Transport Equipment |
| Food products and beverages | Agriculture, Hunting, Forestry and Fishing |
| Products of agriculture, hunting and related services | Hotels and Restaurants |
| Products of agriculture, hunting and related services | Health and Social Work |
| Products of forestry, logging and related services | Pulp, Paper, Paper, Printing and Publishing |
| Construction work | Education |
| Chemicals, chemical products and man-made fibres | Construction |
| Chemicals, chemical products and man-made fibres | Electrical and Optical Equipment |
| Other non-metallic mineral products | Electrical and Optical Equipment |
| Wood and products of wood and cork (except furniture), articles of straw and plaiting materials | Manufacturing, n.e.c.; Recycling |
| Rubber and plastic products | Machinery, n.e.c. |
| Other non-metallic mineral products | Basic Metals and Fabricated Metal |
| Chemicals, chemical products and man-made fibres | Agriculture, Hunting, Forestry and Fishing |
| Medical, precision and optical instruments, watches and clocks | Health and Social Work |
| Electrical machinery and apparatus n.e.c. | Electricity, Gas and Water Supply |
| Other mining and quarrying products | Basic Metals and Fabricated Metal |
| Chemicals, chemical products and man-made fibres | Pulp, Paper, Paper, Printing and Publishing |
| Chemicals, chemical products and man-made fibres | Textiles and Textile Products |
| Public administration and defence services, compulsory social security services | Electricity, Gas and Water Supply |
| Construction work | Financial Intermediation |
| Radio, television and communication equipment and apparatus | Machinery, n.e.c. |
| Construction work | Other Supporting and Auxiliary Transport Activities; Activities of Travel Agencies |
| Other transport equipment | Public Admin and Defence; Compulsory Social Security |
| Chemicals, chemical products and man-made fibres | Machinery, n.e.c. |
| Pulp, paper and paper products | Chemicals and Chemical Products |
| Fabricated metal products, except machinery and equipment | Electrical and Optical Equipment |
| Basic metals | Electricity, Gas and Water Supply |
| Construction work | Transport Equipment |
| Other transport equipment | Air Transport |
| Products of agriculture, hunting and related services | Real Estate Activities |
| Other mining and quarrying products | Other Community, Social and Personal Services |
| Other non-metallic mineral products | Chemicals and Chemical Products |
| Furniture, other manufactured goods n.e.c. | Transport Equipment |
| Construction work | Retail Trade, Except of Motor Vehicles and Motorcycles; Repair of Household Goods |
| Construction work | Chemicals and Chemical Products |
| Pulp, paper and paper products | Food, Beverages and Tobacco |
| Construction work | Basic Metals and Fabricated Metal |
References
- Ripple, W.J.; Wolf, C.; Newsome, T.M.; Galetti, M.; Alamgir, M.; Crist, E.; Mahmoud, M.I.; Laurance, W.F. World Scientists’ Warning to Humanity: A Second Notice. BioScience 2017, 67, 1026–21028. [Google Scholar] [CrossRef]
- Steffen, W.; Richardson, K.; Rockstrom, J.; Cornell, S.E.; Fetzer, I.; Bennett, E.M.; Biggs, R.; Carpenter, S.R.; de Vries, W.; de Wit, C.A.; et al. Planetary Boundaries: Guiding Human Development on a Changing Planet. Science 2015, 347, 1259855. [Google Scholar] [CrossRef] [PubMed]
- Ekins, P.; Hughes, N.; Bringezu, S.; Clark, C.A.; Fischer-Kowalsk, M.; Graede, T.; Hajer, M.; Hashimoto, S.; Hatfield-Dodds, S.; Havlik, P.; et al. Resource Efficiency: Potential and Economic Implications. A Report of the International Resource Panel; UNEP IRP: Paris, France, 2017. [Google Scholar]
- Wiedmann, T.O.; Schandl, H.; Lenzen, M.; Moran, D.; Suh, S.; West, J.; Kanemoto, K. The material footprint of nations. PNAS 2015, 112, 6271–6276. [Google Scholar] [CrossRef] [PubMed]
- NOAA (National Oceanic and Atmospheric Administration). NOAA-ESRL Annual CO2 Data. 2018. Available online: http://co2now.org/Current-CO2/CO2-Now/annual-co2.html (accessed on 6 February 2018).
- Boden, T.A.; Marland, G.; Andres, R.J. Global, Regional, and National Fossil-Fuel CO2 Emissions; Carbon Dioxide Information Analysis Center, Oak Ridge National Laboratory, U.S. Department of Energy: Oak Ridge, TN, USA, 2017. [Google Scholar] [CrossRef]
- GISTEMP Team. GISS Surface Temperature Analysis (GISTEMP). NASA Goddard Institute for Space Studies. Available online: https://data.giss.nasa.gov/gistemp/ (accessed on 6 February 2018).
- IRP (International Resource Panel). Assessing Global Resource Use: A Systems Approach to Resource Efficiency and Pollution Reduction. A Report of the International Resource Panel; Bringezu, S., Ramaswami, A., Schandl, H., O’Brien, M., Pelton, R., Acquatella, J., Ayuk, E., Chiu, A., Flanegin, R., Fry, J., et al., Eds.; United Nations Environment Programme: Nairobi, Kenya, 2017; 99p, ISBN 978-92-807-3677-9. [Google Scholar]
- Binswanger, M. Technological progress and sustainable development: What about the rebound effect. Ecol. Econ. 2001, 36, 119–132. [Google Scholar] [CrossRef]
- Sorrell, S.; Dimitropoulos, J.; Sommerville, M. Empirical estimates of the direct rebound effect: A review. Energy Policy 2009, 37, 1356–1371. [Google Scholar] [CrossRef]
- Vivanco, D.F.; Kemp, R.; van der Voet, E. How to deal with the rebound effect? A policy-oriented approach. Energy Policy 2016, 94, 114–125. [Google Scholar] [CrossRef]
- United Nations Statistics Division (UNSD). System of Environmental-Economic Accounting 2012—Central Framework; United Nations: New York, NY, USA, 2014. [Google Scholar]
- Bringezu, S. Possible Target Corridor for Sustainable Use of Global Material Resources. Resources 2015, 4, 25–54. [Google Scholar] [CrossRef] [Green Version]
- UNFCCC. Summary of the Paris Agreement. 2018. Available online: http://bigpicture.unfccc.int/#content-the-paris-agreemen (accessed on 9 February 2018).
- Bahn-Walkowiak, B.; Steger, S. Resource Targets in Europe and Worldwide: An Overview. Resources 2015, 4, 597–620. [Google Scholar] [CrossRef] [Green Version]
- Sustainable Development Knowledge Platform. Sustainable Development Goal 8: Promote Sustained, Inclusive and Sustainable Economic Growth, Full and Productive Employment and Decent Work for All. 2017. Available online: https://sustainabledevelopment.un.org/sdg8 (accessed on 8 February 2018).
- Sustainable Development Knowledge Platform. Sustainable Development Goal 12: Ensure Sustainable Consumption and Production Patterns. 2017. Available online: https://sustainabledevelopment.un.org/sdg12 (accessed on 8 February 2018).
- European Resource Efficiency Platform (EREP). Manifesto & Policy Recommendations; European Commission: Brussels, Belgium, 2014; 13p. [Google Scholar]
- European Commission. Towards a Circular Economy: A Zero Waste Programme for Europe; COM(2014) 398 Final; European Commission: Brussels, Belgium, 2014; 14p. [Google Scholar]
- European Commission. Closing the Loop—An EU Action Plan for the Circular Economy; COM(2015) 614 Final; European Commission: Brussels, Belgium, 2015; 21p. [Google Scholar]
- EEA (European Environment Agency). More from Less—Material Resource Efficiency in Europe. 2015 Overview of Policies, Instruments and Targets in 32 Countries; EEA Report No 10/2016; EEA: Copenhagen, Denmark, 2016; 151p. [Google Scholar] [CrossRef]
- Federal Ministry for the Environment, Nature Conservation, Building and Nuclear Safety (BMUB). German Resource Efficiency Programme II. Programme for the Sustainable Use and Conservation of Natural Resources; BMUB: Berlin/Heidelberg, Germany, 2016; 143p. [Google Scholar]
- WBGU—German Advisory Council on Global Change. Humanity on the Move: Unlocking the Transformative Power of Cities; WBGU: Berlin/Heidelberg, Germany, 2017; 514p, ISBN 978-3-936191-45-5. [Google Scholar]
- Hirschnitz-Garbers, M.; Tan, A.R.; Gradmann, A.; Srebotnjak, T. Key Drivers for Unsustainable Resource Use—Categories, Effects and Policy Pointers. J. Clean. Prod. 2015, 132, 13–31. [Google Scholar] [CrossRef]
- Lorenz, U.; Sverdrup, U.; Ragnarsdottir, K.V. Global Megatrends and Resource Use—A Systemic Reflection, In Factor X—Challenges, Implementation Strategies and Examples for a Sustainable Use of Natural Resources; Lehmann, H., Ed.; Eco-Efficiency in Industry and Science 32; Springer: Cham, Switzerland, 2017; pp. 31–44. ISBN 978-3-319-50078-2. [Google Scholar]
- United Nations Environment Programme (UNEP). 21 Issues for the 21st Century: Result of the UNEP Foresight Process on Emerging Environmental Issues; United Nations Environment Programme (UNEP): Nairobi, Kenya, 2012; 56p. [Google Scholar]
- EEA (European Environment Agency). European Environment—State and Outlook 2015: Assessment of Global Megatrends; European Environment Agency: Copenhagen, Denmark, 2015; 134p, ISBN 978-92-9213-534-8. [Google Scholar]
- Krausmann, F.; Gingrich, S.; Eisenmenger, N.; Erb, K.H.; Haberl, H.; Fischer-Kowalski, M. Growth in global materials use, GDP and population during the 20th century. Ecol. Econ. 2009, 68, 2696–2705. [Google Scholar] [CrossRef]
- Fischer-Kowalski, M.; Haberl, H. Socioecological Transitions and Global Change: Trajectories of Social Metabolism and Land Use; Edward Elgar: Cheltenham, UK, 2007; ISBN 978-1-84720-340-3. [Google Scholar]
- Weizsäcker, E.U.V.; Lovins, A.B.; Lovins, L.H. Factor Four: Doubling Wealth, Halving Resource Use; Earthscan: London, UK, 1997; 320p, ISBN 978-1853834066. [Google Scholar]
- Weizsäcker, E.U.V.; Hargroves, K.; Smith, M.; Desha, C.; Stasinopoulos, P. Factor 5: Transforming the Global Economy through 80% Improvements in Resource Productivity; Earthscan: London, UK, 2009; 432p, ISBN 978-1844075911. [Google Scholar]
- Schmidt-Bleek, F. Wieviel Umwelt Braucht der Mensch? Faktor 10—Das Maß für Ökologisches Wirtschaften; Dtv: München, Germany, 1997; 303p, ISBN 978-3-423-30580-8. [Google Scholar]
- Schmidt-Bleek, F. Factor 10: The future of stuff. Sustain. Sci. Pract. Policy 2008, 4, 1–4. [Google Scholar] [CrossRef]
- Bringezu, S. Visions of a sustainable resource use. In Sustainable Resource Management: Global Trends, Visions and Policies; Bringezu, S., Bleischwitz, R., Eds.; Greenleaf Publishing: Sheffield, UK, 2009; pp. 155–215. ISBN 978-1906093266. [Google Scholar]
- Dittrich, M.; Giljum, S.; Lutter, S.; Polzin, C. Green Economies around the World? Implications of Resource Use for Development and the Environment; SERI: Vienna, Austria, 2012. [Google Scholar]
- Bringezu, S. Key elements for Economy-wide Sustainable Resource Management. Annales des Mines Responsabilité et Environnement 2011, 61, 78–87. [Google Scholar] [CrossRef]
- Hatfield-Dodds, S.; Schandl, H.; Newth, D.; Obersteiner, M.; Cai, Y.; Baynes, T.; West, J.; Havlik, P. Assessing global resource use and greenhouse emissions to 2050, with ambitious resource efficiency and climate mitigation policies. J. Clean. Prod. 2017, 144, 403–414. [Google Scholar] [CrossRef]
- Distelkamp, M.; Meyer, M. Pathways to a Resource-Efficient and Low-Carbon Europe. Ecol. Econ. 2017. [Google Scholar] [CrossRef]
- OECD Working Party on Resource Productivity and Waste & OECD Working Party on Integrating Environmental and Economic Policies. The Macroeconomics of the Circular Economy Transition: A Critical Review of Modelling Approaches; ENV/EPOC/WPRPW/WPIEEP(2017)1/FINAL; OECD: Paris, France, 2017. [Google Scholar]
- Meyer, B.; Distelkamp, M.; Beringer, T. Report about Integrated Scenario Interpretation GINFORS/LPJML Results. Deliverable D.3.7a of the Project “Policy Options for a Resource-Efficient Economy (POLFREE)”; GWS: Osnabrück, Germany, 2015; 133p. [Google Scholar]
- Tukker, A.; Dietzenbacher, E. Global Multiregional Input-Output Frameworks: An Introduction and Outlook. Econ. Syst. Res. 2013, 25, 1–19. [Google Scholar] [CrossRef]
- Wiedmann, T.; Barrett, J. Policy-Relevant Applications of Environmentally Extended MRIO Databases—Experiences from the UK. Econ. Syst. Res. 2013, 25, 143–156. [Google Scholar] [CrossRef]
- Timmer, M.P.; Dietzenbacher, E.; Los, B.; Stehrer, R.; de Vries, G.J. An Illustrated User Guide to the World Input–Output Database: The Case of Global Automotive Production. Rev. Int. Econ. 2015, 23, 575–605. [Google Scholar] [CrossRef]
- Almon, C. The INFORUM Approach to Interindustry Modeling. Econ. Syst. Res. 1991, 3, 1–7. [Google Scholar] [CrossRef]
- Meyer, B.; Ahlert, G. Imperfect Markets and the Properties of Macro-economic-environmental Models as Tools for Policy Evaluation. Ecol. Econ. 2017, in press. [Google Scholar] [CrossRef]
- Pollitt, H.; Mercure, J.F. The role of money and the financial sector in energy-economy models used for assessing climate and energy policy. Clim. Policy 2018, 18, 184–197. [Google Scholar] [CrossRef]
- Lutter, S.; Giljum, S.; Lieber, M. Global Material Flow Database. Material Extraction Data; Technical Report, Version 2014.1; Vienna University of Economics and Business (WU): Vienna, Austria, 2014. [Google Scholar]
- Bruckner, M.; Giljum, S.; Lutz, C.; Wiebe, K. Materials embodied in international trade—Global material extraction and consumption between 1995 and 2005. Glob. Environ. Chang. 2012, 22, 568–576. [Google Scholar] [CrossRef]
- Wiebe, K.S.; Bruckner, M.; Giljum, S.; Lutz, C.; Polzin, C. Carbon and Materials Embodied in the International Trade of Emerging Economies A Multiregional Input-Output Assessment of Trends Between 1995 and 2005. J. Ind. Ecol. 2012, 16, 636–646. [Google Scholar] [CrossRef]
- Wood, R.; Stadler, K.; Bulavskaya, T.; Lutter, S.; Giljum, S.; de Koning, A.; Kuenen, J.; Schuetz, H.; Acosta-Fernandez, J.; Usubiaga, A.; et al. Global Sustainability Accounting-Developing EXIOBASE for Multi-Regional Footprint Analysis. Sustainability 2015, 7, 138–163. [Google Scholar] [CrossRef] [Green Version]
- Meadows, D.H.; Meadows, D.L.; Randers, J.; Behrens, W. Limits to Growth; Universe Books: New York, NY, USA, 1972; 205p, ISBN 0876631650. [Google Scholar]
- Sverdrup, H.; Ragnarsdottir, K. A system dynamics model for platinum group metal supply, market price, depletion of extractable amounts, ore grade, recycling and stocks-in-use. Res. Conserv. Recycl. 2016, 114, 130–152. [Google Scholar] [CrossRef]
- Sverdrup, H.; Ragnarsdottir, K.V.; Koca, D. An Assessment of Metal Supply Sustainability as an Input to Policy: Security of Supply Extraction Rates, Stocks-in-Use, Recycling, and Risk of Scarcity. J. Clean. Prod. 2015, 140, 359–372. [Google Scholar] [CrossRef]
- Sverdrup, H.; Ragnarsdottir, K.V.; Koca, D. On modelling the global copper mining rates, market supply, copper price and the end of copper reserves. Res. Conserv. Recycl. 2014, 87, 158–174. [Google Scholar] [CrossRef]
- Meadows, D.H.; Randers, J.; Meadows, D.L. Limits to Growth: The 30 Year Update; Earthscan: London, UK, 2005; 338p, ISBN 978-1844071449. [Google Scholar]
- Costanza, R.; Leemans, R.; Boumans, R.; Gaddis, E. Integrated Global Models. In Sustainability or Collapse? An Integrated History and Future of People on Earth; Costanza, R., Graumlich, L.J., Steffen, W., Eds.; MIT Press: Cambridge, MA, USA, 2007; pp. 417–446. ISBN 978-0262515979. [Google Scholar]
- Imhof, P. Computer Simulation in the Controversy over Limits of Growth; Working Paper; Technische Universität Hamburg, Institut für Technik und Gesellschaft: Hamburg, Germany, 2000. [Google Scholar] [CrossRef]
- Bardi, U. The Limits to Growth Revisited; Springer: New York, NY, USA, 2011; ISBN 978-1-4419-9416-5. [Google Scholar]
- Turner, G. On the Cusp of Global Collapse? Updated Comparison of The Limits to Growth with Historical Data. GAIA 2012, 21, 116–124. [Google Scholar] [CrossRef]
- Sverdrup, H.; Koca, D.; Ragnarsdottir, K. Peak Metals, Minerals, Energy, Wealth, Food and Population: Urgent Policy Considerations for a Sustainable Society. J. Environ. Sci. Eng. 2013, B2, 189–222. [Google Scholar]
- Distelkamp, M.; Meyer, M. Langfristszenarien und Potenziale zur Ressourceneffizienz in Deutschland im Globalen Kontext—Quantitative Abschätzungen mit dem Modell GINFORS. SimRess-Endbericht Band 3; GWS: Osnabrück, Germany, 2017; 279p. [Google Scholar]
- Schandl, H.; Hatfield-Dodds, S.; Wiedmann, T.; Geschke, A.; Cai, Y.; West, J.; Newth, D.; Baynes, T.; Lenzen, M.; Owen, A. Decoupling global environmental pressure and economic growth: Scenarios for energy use, materials use and carbon emissions. J. Clean. Prod. 2016, 132, 45–56. [Google Scholar] [CrossRef]
- United Nations (UN). World Population Prospects. The 2012 Revision; Comprehensive Tables; United Nations Economic and Social Affairs Department: New York, NY, USA, 2013; Volume I. [Google Scholar]
- Santarius, T.; Soland, M. Towards a Psychological Theory and Comprehensive Rebound Typology. In Rethinking Climate and Energy Policies. New Perspectives on the Rebound Phenomenon; Santarius, T., Walnum, H.J., Aall, C., Eds.; Springer: Cham, Switzerland, 2016; pp. 107–120. [Google Scholar]
- Ekins, P.; Meyer, B.; Schmidt-Bleek, F.; Schneider, F. Reducing resource consumption—A proposal for global resource and environmental policy. In Factor X: Policy, Strategies and Instruments for a Sustainable Resource Use; Angrick, M., Burger, A., Lehmann, H., Eds.; Springer: Dordrecht, The Netherlands, 2014; pp. 249–273. [Google Scholar]
- IRP (International Resource Panel). Resource Efficiency: Potential and Economic Implications; Summary for Policy-Makers; UNEP IRP: Paris, France, 2016; 74p. [Google Scholar]
- McKinsey Global Institute. Resource Revolution: Meeting the World’s Energy, Materials, Food, and Water Needs; McKinsey & Company: New York, NY, USA, 2011; 209p. [Google Scholar]
- Ekvall, T.; Hirschnitz-Garbers, M.; Eboli, F.; Śniegocki, A. A Systemic and Systematic Approach to the Development of a Policy Mix for Material Resource Efficiency. Sustainability 2016, 8, 373. [Google Scholar] [CrossRef]
- Hirschnitz-Garbers, M.; Hinzmann, M.; Watkins, E.; ten Brink, P.; Milios, L.; Soleille, S. A Framework for Member States to Support Business in Improving Its Resource Efficiency. An Analysis of Support Measures Applied in the EU-28; European Commission: Brussels, Belgium, 2015; 79p. [Google Scholar]
- Akenji, L.; Bengtsson, M.; Bleischwitz, R.; Tukker, A.; Schandl, H. Ossified materialism: Introduction to the special volume on absolute reductions in materials throughput and emissions. J. Clean. Prod. 2016, 132, 1–12. [Google Scholar] [CrossRef]
- Bleischwitz, R.; Bahn-Walkowiak, B.; Bringezu, S.; Lucas, R.; Steger, S.; Wilts, H.; Onischka, M.; Röder, O. Outline of a resource policy and its economic dimension. In Sustainable Resource Management: Global Trends, Visions and Policies; Bringezu, S., Bleischwitz, R., Eds.; Greenleaf Publishing: Sheffield, UK, 2009; pp. 216–296. ISBN 978-1906093266. [Google Scholar]
- Bleischwitz, R.; Bringezu, S. Global Governance for Sustainable Resource Management. Miner. Energy 2008, 23, 84–101. [Google Scholar] [CrossRef]
Figure 1.
Global developments since 1980 (Index: 1980 = 100): (a) economic activity (GDP), CO2 emissions and raw material extractions; and (b) economic activity (GDP) and raw material extractions per material category. (Sources: World Bank World Development Indicators, Global Material Flow database; own calculations.)

Figure 2.
Conceptual framework of GINFORS3. (Simplified illustration, source: GWS.)

Figure 3.
Projected global developments until 2050 (Index: 2015 = 100): (a) economic activity (GDP), CO2 emissions and raw material extractions; and (b) economic activity and raw material extractions per material category. (Source: own estimations.)
Figure 3.
Projected global developments until 2050 (Index: 2015 = 100): (a) economic activity (GDP), CO2 emissions and raw material extractions; and (b) economic activity and raw material extractions per material category. (Source: own estimations.)

Figure 4.
Projected development in selected national footprint indicators and national economic activity until 2050: (a) material footprint (per capita RMC) vs. per capita GDP; and (b) per capita CO2 footprint vs. per capita GDP. (Sources: World Bank World Development Indicators, own estimations.)
Figure 4.
Projected development in selected national footprint indicators and national economic activity until 2050: (a) material footprint (per capita RMC) vs. per capita GDP; and (b) per capita CO2 footprint vs. per capita GDP. (Sources: World Bank World Development Indicators, own estimations.)

Figure 5.
Development of selected economy-wide raw material intensity footprints (RMI/GDP). (Index (2015 = 100), GDP in constant prices, sources: own estimations.)
Figure 5.
Development of selected economy-wide raw material intensity footprints (RMI/GDP). (Index (2015 = 100), GDP in constant prices, sources: own estimations.)

Figure 6.
Simulated global impacts of resource efficiency improvements: (a) globally used extractions; (b) globally used extractions per raw material category; (c) global CO2 emissions; and (d) global GDP (Source: own estimations.)
Figure 6.
Simulated global impacts of resource efficiency improvements: (a) globally used extractions; (b) globally used extractions per raw material category; (c) global CO2 emissions; and (d) global GDP (Source: own estimations.)


Figure 7.
Simulated regional impacts of resource efficiency improvements on economy-wide raw material intensities (RMI/GDP). (Baseline deviations from 2050 in per cent) (Source: own estimations.)
Figure 7.
Simulated regional impacts of resource efficiency improvements on economy-wide raw material intensities (RMI/GDP). (Baseline deviations from 2050 in per cent) (Source: own estimations.)

Figure 8.
Simulated regional impacts of resource efficiency improvements (baseline deviations 2050 in %): (a) material footprint vs. GDP; and (b) CO2 footprints vs. GDP. (Per capita values; Sources: World Bank World Development Indicators; own estimations.)
Figure 8.
Simulated regional impacts of resource efficiency improvements (baseline deviations 2050 in %): (a) material footprint vs. GDP; and (b) CO2 footprints vs. GDP. (Per capita values; Sources: World Bank World Development Indicators; own estimations.)

Figure 9.
Simulated global raw material efficiency improvements (globally used extractions/global GDP, indexed 2015 = 100) in the baseline scenario and in the “best efficiency” simulation experiment. (Source: own estimations.)
Figure 9.
Simulated global raw material efficiency improvements (globally used extractions/global GDP, indexed 2015 = 100) in the baseline scenario and in the “best efficiency” simulation experiment. (Source: own estimations.)

Figure 10.
Material footprints of nations (RMC per capita) and scientifically discussed target corridors. (Sources: Global Material Flow database, own estimations.)
Figure 10.
Material footprints of nations (RMC per capita) and scientifically discussed target corridors. (Sources: Global Material Flow database, own estimations.)

Table 1.
Climate active scenario baseline: Assumed global price trajectories for fossil energy carriers.
Table 1.
Climate active scenario baseline: Assumed global price trajectories for fossil energy carriers.
| Assumed Global Price Trajectories for Fossil Energy Carriers | 2020 | 2030 | 2040 | 2050 |
|---|---|---|---|---|
| Coal: OECD Steam Coal Import Price (2013 USD/tonne) | 88 | 78 | 77 | 76 |
| Crude Oil: IEA Crude Oil Import Price (2013 USD/bbl) | 105 | 102 | 100 | 98 |
| Gas: Europe Import Price (2013 USD/Mbtu) | 10.5 | 10.0 | 9.2 | 9.0 |
Table 2.
Climate active scenario baseline: Shares of renewable energy carriers in electricity generation.
Table 2.
Climate active scenario baseline: Shares of renewable energy carriers in electricity generation.
| Country | 2030 | 2050 |
|---|---|---|
| Russia | 23.3 | 55.2 |
| China | 40.1 | 77.2 |
| India | 40.7 | 73.9 |
| United States | 34.4 | 71.8 |
| Germany | 73.0 | 100.0 |
Table 3.
Climate active scenario baseline: Shares of nuclear energy carriers in electricity generation.
Table 3.
Climate active scenario baseline: Shares of nuclear energy carriers in electricity generation.
| Country | 2030 | 2050 |
|---|---|---|
| Russia | 8.6 | 9.6 |
| China | 5.7 | 7.4 |
| India | 6.4 | 7.5 |
| United States | 20.2 | 19.0 |
| Germany | 0.0 | 0.0 |
Table 4.
Climate active scenario baseline: Overview on further key scenario parameters.
| Key Scenario Parameters | Assumed Values of Key Scenario Parameters |
|---|---|
| ETS certificate price | By 2050, prices in EU-ETS increase to 147 €2010 per tonne of CO2 Introduction of ETS in further countries from 2020 onwards, prices in EU-ETS increase to 152 US$2010 per tonne of CO2 |
| Financial support for energy refurbishment in buildings | Additional energy refurbishment of 1.5% of residential building stock from 2016 onwards (Germany); 2021 onwards (further EU member states); 2026 onwards (industrialised non-EU-countries); 2031 onwards (BRIC countries, Mexico and Turkey) |
| Petroleum tax | Raising real tax rate on petroleum products in Germany by a factor of 1.5 by 2050; further countries follow with a time lag of 5 years (further EU member states); 10 years (industrialised non-EU countries); 15 years (BRIC countries, Mexico and Turkey) |
| Supporting e-mobility, private households | By 2050 the share of e-mobility in individual motor car traffic amounts to 33.3% (Germany); 25% (further EU member states and industrialised non-EU countries); 16.7% (BRIC countries, Mexico and Turkey), 8.3% (RoW) |
| Supporting e-mobility, business and industry | By 2050 the share of e-mobility in freight motor car traffic amounts to 16.7% (Germany); 12.5% (further EU member states and industrialised non-EU countries); 8.3% (BRIC countries, Mexico and Turkey); 8.3% (RoW) |
Table 5.
Resource efficiency improvements: Overview of key scenario parameters and values * in the simulation experiments.
Table 5.
Resource efficiency improvements: Overview of key scenario parameters and values * in the simulation experiments.
| Key Parameters | Parameter Value Assumptions |
|---|---|
| Number of resource relevant production technologies/sectors in Germany | 75 |
| Additional annual efficiency gain per technology/sector in Germany | 2.0% |
| Time that producers need to achieve these efficiency improvements in: | |
| …other EU countries | 1 year |
| …industrialised non-EU countries | 3 years |
| …other countries and in RoW region | 5 years |
| Initial investments needed (in relation to realised savings) for: | |
| …consultancy services | 1 |
| …research and development | 1.5 |
| …gross fixed capital formation | 2.5 |
* We conducted two additional simulation experiments using values for these parameters that are lower or higher, respectively, to cover a broader scope of possible future developments of these values. Findings for these parameter values are available in Distelkamp and Meyer (2017) [62] and can be provided upon request.
© 2018 by the authors. Licensee MDPI, Basel, Switzerland. This article is an open access article distributed under the terms and conditions of the Creative Commons Attribution (CC BY) license (http://creativecommons.org/licenses/by/4.0/).
Share and Cite
MDPI and ACS Style
Meyer, M.; Hirschnitz-Garbers, M.; Distelkamp, M. Contemporary Resource Policy and Decoupling Trends—Lessons Learnt from Integrated Model-Based Assessments. Sustainability 2018, 10, 1858. https://0-doi-org.brum.beds.ac.uk/10.3390/su10061858
AMA Style
Meyer M, Hirschnitz-Garbers M, Distelkamp M. Contemporary Resource Policy and Decoupling Trends—Lessons Learnt from Integrated Model-Based Assessments. Sustainability. 2018; 10(6):1858. https://0-doi-org.brum.beds.ac.uk/10.3390/su10061858
Chicago/Turabian StyleMeyer, Mark, Martin Hirschnitz-Garbers, and Martin Distelkamp. 2018. "Contemporary Resource Policy and Decoupling Trends—Lessons Learnt from Integrated Model-Based Assessments" Sustainability 10, no. 6: 1858. https://0-doi-org.brum.beds.ac.uk/10.3390/su10061858
Note that from the first issue of 2016, this journal uses article numbers instead of page numbers. See further details here.