A Geographical Analysis of the Poverty Causes in China’s Contiguous Destitute Areas

1
Institutes of Science and Development, Chinese Academy of Sciences, Beijing 100190, China
2
School of Geographic Sciences, East China Normal University, Shanghai 200241, China
3
Information School, Capital University of Economics and Business, Beijing 100026, China
*
Author to whom correspondence should be addressed.
Sustainability 2018, 10(6), 1895; https://0-doi-org.brum.beds.ac.uk/10.3390/su10061895
Submission received: 25 April 2018
/
Revised: 2 June 2018
/
Accepted: 4 June 2018
/
Published: 6 June 2018
(This article belongs to the Special Issue Sustainable Land Uses and Rural Governance)
Abstract
:One of the most critical development problems in China is the existence of a considerable number of contiguous destitute areas (also known as regional poverty), and the causes behind such regional poverty might structurally differ by geographical characteristics. To deal with the problem, this paper, based on the “Three Nature” theory of New Economic Geography, first establishes an analytical index system of poverty causes, and then uses the gray relational method to identify the causes of poverty in 14 contiguous destitute areas. The results show that, at present, the main poverty causes in the mountain areas in eastern part of China, such as the Dabie mountain area, the Yanshan-Taihang mountain area and the southern Greater Khingan mountain area, are the shortage of human capital and information technology. In contrast, the main factors behind regional poverty in the central mountain areas such as the LuoXiao mountain area, the Lvliang mountain area and the Wuling mountain area are poor transport, locational and other natural factors. The western mountain regions such as Tibet, Tibetan areas in four provinces, South Xinjiang’s three districts and the West Yunnan border area are especially affected by natural endowments, but each area’s specific cause for poverty is different from one another. Finally, this paper discusses relevant policy issues regarding the fact that poverty causes are different by distinct natural factors.
1. Introduction
Poverty is a worldwide development problem, and China has now taken anti-poverty as a national strategy. One serious problem in China is the existence of many contiguous destitute areas, namely, regional poverty. Anti-poverty in these contiguous destitute areas has become a largely debated issue in multidisciplinary studies such as economics and sociology. Different from other general problems relating to poverty, in some regions and individual households, poverty is primarily driven by disasters, diseases or education issues. The causes of such kind of poverty are mainly social factors. The concentration of contiguous regional poverty has long-term, multiple and geographical features, in which the deep factors of poverty can only be understood from the background of geography.
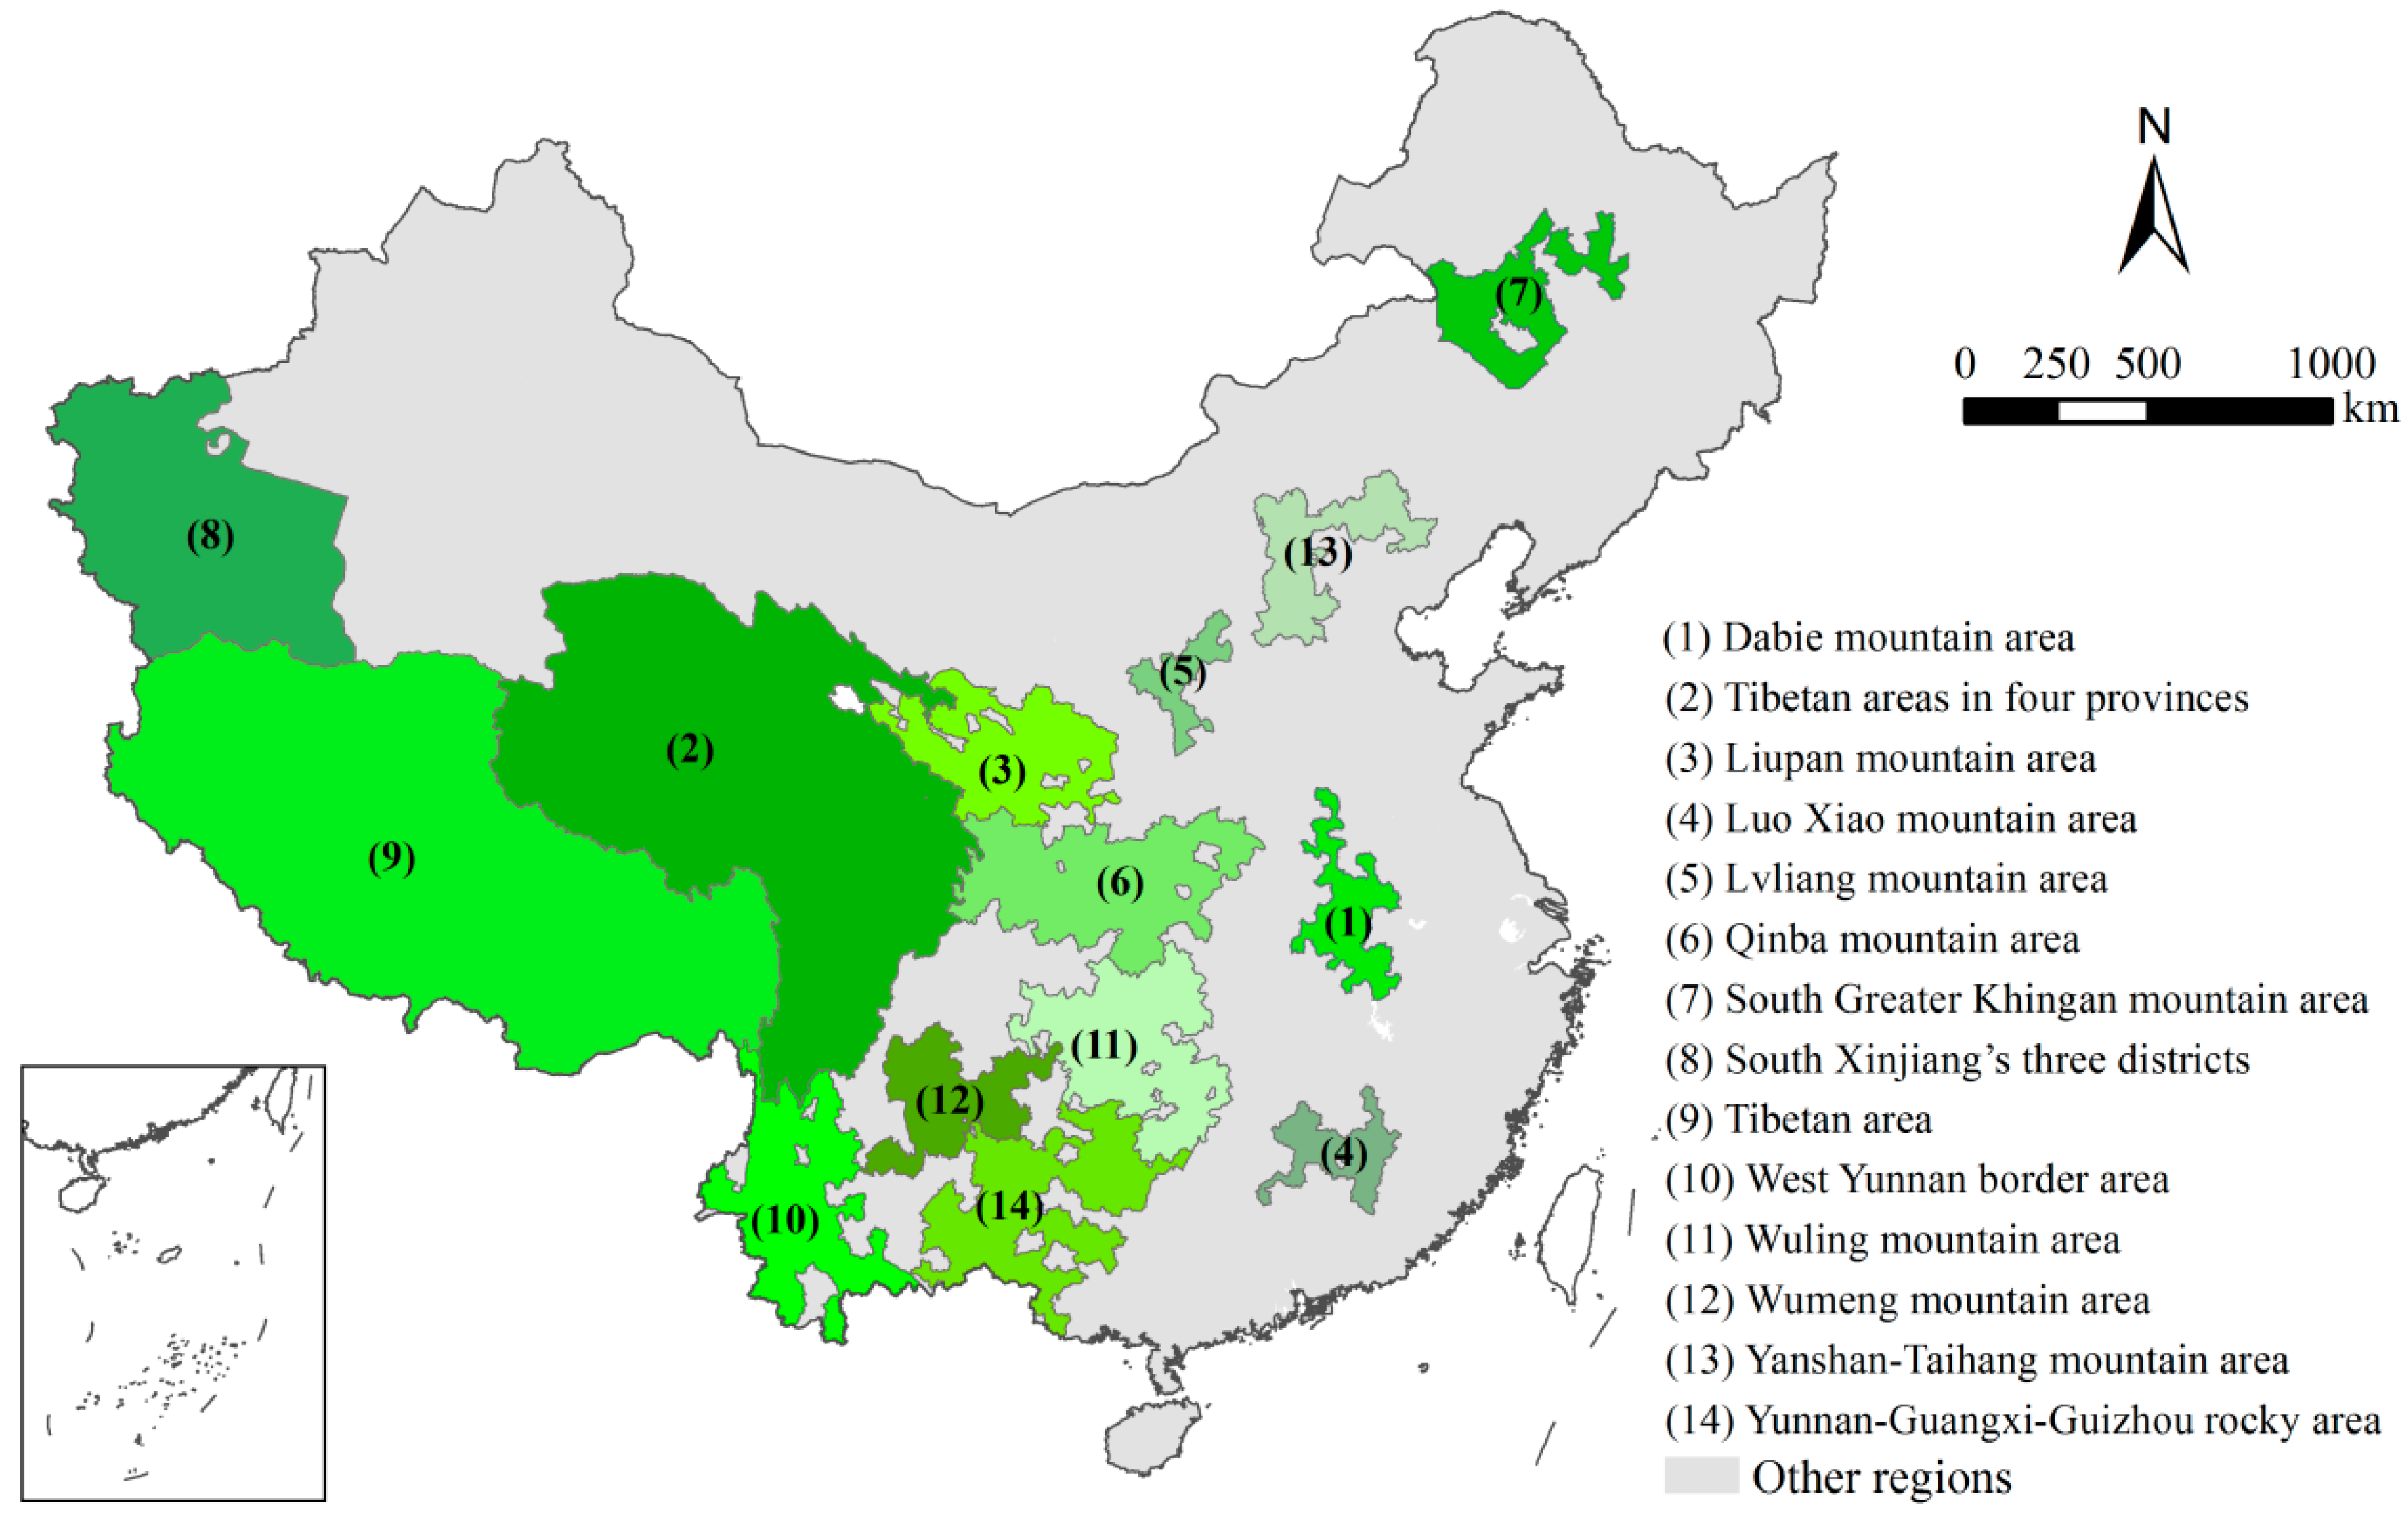
According to the Outline of poverty alleviation and development in rural China (2011–2020) and the 2011 Central Poverty Alleviation and Development Conference, the contiguous destitute areas of China include 11 contiguous special difficulty areas such as the Wuling mountain area and the Dabie mountain area, together with the South Xinjiang’s three districts, Tibet area and the Tibetan areas in four provinces that are explicitly implemented with special supportive policies. They consist altogether 680 counties in 14 districts and areas, which have become the main battlefields for tackling poverty in the new phase of China. Figure 1 shows the spatial distribution of these geographically contiguous poverty areas.
According to Figure 1, the 14 contiguous destitute areas are mainly located in the western and central regions, most of which are in mountain areas. Table 1 presents more details about the general situation of the 14 contiguous destitute areas. Although there have been many studies on anti-poverty and many practical achievements have been made in China, thus far, there is insufficient research finding on the causes of regional poverty. The main reason is that some studies lack geography-based analysis and instead pay more attention to socioeconomic causes and contingencies. For example, many reports cover the existence of the “serious illness and poverty” phenomenon, but fail to answer the question why the poor areas are contiguous. To this end, the Chinese government launched an anti-poverty campaign in the destitute counties in 2016 that requires an analysis of the geographical causes of regional poverty in the contiguous destitute areas so that we can find a solution to tackle the deep-rooted poverty problem. To derive an efficient regional anti-poverty strategy in the contiguous poverty-stricken areas, scholars should not only consider and develop economic theories that will theoretically alleviate poverty, but also find the intrinsic reasons driving local poverty based on local geographical features and mitigate the issue using targeted anti-poverty practice.
In fact, when finding the causes responsible for forming contiguous poverty areas, many scholars have conducted analysis from geographical perspective. Among them, the influence of geographical environment on poverty is often considered as one of the most important compared to many other causes of poverty [1,2,3]. Liu et al. [4] explored the characteristics of geographical differentiation of rural poverty in China. The geographical features of different contiguous destitute areas include: drought, frequent geological disasters, topographic fractures, soil erosion, etc. These natural elements are basis for the occurrence of poverty. Some researchers think that poverty is an ecological problem because the majority of the rural poor live in areas with poor natural conditions, scarce natural resources and fragile ecological environment [5] and with the coexistence of fragile ecological environment and economic poverty [6] In addition, natural disasters can also aggravate poverty and inequality [7]. Zhuang and Zhang [8] found that there is a high degree of consistency between disasters and poverty in ethnic areas. In economic geography, traffic conditions usually represent the geographical advantages and disadvantages of the region. Adverse traffic conditions are another factor resulting in poverty. For example, Rephann et al. [9] and Olsson [10] studied the relationship between transport advantages and changes in traffic accessibility and poverty reduction in underdeveloped areas of the United States and the Philippines, respectively, and they noticed differences in the rate of return on transportation infrastructure development between poor and economically developed areas. Fan et al. [11] studied the poverty reduction effects of different grades of roads in China. Wang et al. [12] measured the relationship between highway dominance and economic growth in the contiguous destitute areas in China and found that improving public transportation dominant degree can promote economic growth.
Studies mentioned above explain the causes of regional poverty from various specific perspectives. All these factors are important. However, the causes of poverty are often more complicated. Poverty cannot be attributed to a single reason—natural, economic or individual—and poor natural conditions, weak location, laggard infrastructure, uneven regional development and even the pre-poverty development policy are all the main cruxes of sustained poverty in rural China [4] Next, to deepen the understanding of widespread regional poverty in China, we use a multi-dimensional geography analysis and propose appropriate targeted policies.
2. Theoretical Basis
We apply the new economic geography theory to understand the underlying reasons of regional poverty. Krugman [13] proposed two Geographical Natures that led to the evolution of areas when he researched the urban spatial development. These two natures are the natural endowment as first nature and human choice aggregation and location as the second nature. In 2003, Lu [14] proposed that there is a new factor in China’s regional development that was then defined by Liu and Wang [15] as information facilities and human resources in the new economic environment (they can be simply referred to as informatization conditions). Based on this theory, Xia and Wang [16] proposed that, according to the interaction of the three industrial revolutions, the regions have demonstrated three geographical natures. The trilateral industrial division of labor means that the entrepreneurial conditions of industrial development are different, and the constraints of geographical conditions are also different, which will restrict development at different stages and lead to regional poverty. Therefore, it is possible to analyze the issues of regional poverty through the concept of three geographical natures and to deal with relevant policies in a proper way. This is a direction suggested by the new economic geography.
In theory, it is clearly related to economic development that poverty as an economic phenomenon is associated with regional geographical nature. According to Krugman’s theory [13] and Liu’s analysis [15], the first geographical nature includes the abundance of natural resources as well as the nature of the natural environment, elevation, topography, agriculture production potential, etc., which constitute the ecological conditions. In fact, it is the first nature that creates the original surplus and accumulates capital. Specifically, the first nature provides the foundation for the economic activities of a region and the development of capital. For example, in the Wumeng mountain area, the local poverty-relief cadres complained the lack of industrial capital: “there is no surplus of labor income and no further capital investment”. This is the first issue that needs to be solved before we can eliminate poverty. The second geographical nature of the region is to recreate itself based on human adaptation to nature; the development of road traffic is a good example. The second nature is the human-driven practice of poverty alleviation. The third nature is the further human force on development. To improve their own living conditions, human beings create and reform social resources such as schools and hospitals, and develop education and human resources at the same time. These conditions produce the “spillover” effect from new growth theory and have driven the entire social resources with some specific initiatives.
Based on these understandings, this study used the quantitative method to obtain the relationship between the three geography natures and the contiguous destitute areas, looking for countermeasures against poverty. The article first quantifies the three geography natures into specific indicators. Due to the comprehensiveness of the three geographical features, the article mainly analyzes the relationship between three geographical features and poverty through the construction of index system and the distribution of weights.
2.1. Index System Construction
To estimate the geographical nature of regional poverty, we first need to develop a quantitative model for regional geography. Xia and Wang [16] developed related computational models, as follows.
2.1.1. The First Geographical Nature Index
In the first geographical nature of the region, the abundance of natural resources is the foundation. The richness or ease of development of natural resources is the condition that determines the initial development of a region. Many areas, thanks to the abundance of natural resources, have not become poverty-stricken areas under harsh ecological conditions. For example, the Middle East has successfully eliminated extreme poverty after its full resource development. This is also the case in the Karamay region, and the Datong region in Shanxi Province. The richness of agricultural natural resources in a region is directly related to the occurrence of poverty. However, the abundance of natural resources is caused by the geo-history and can hardly be changed. Thus, anti-poverty policies should pay attention to the ecological conditions and basic productivity of agriculture in the targeted regions.
(1) Agricultural potential productivity
China has been advocating the “food as the first necessity of man” concept, i.e., agriculture is the foundation of a populous country, and the potential agricultural productivity is the scientific basis for characterizing the basic agricultural conditions in the region. In fact, the agricultural potential for productivity is the basis for deriving the expected agricultural yield in a region, which is an estimate of the primary ecological potential of terrestrial ecosystems. In this paper, we use the models developed by Zhong and Wang. The calculation method is based on the study of Zhong [17]:
where shows the agricultural potential productivity (kg/hm2); and , , and represent the light production potential, temperature, moisture, and effective coefficient of soil impact, respectively.
(2) Composite altitude
The hardship of the natural environment corresponding to the poor ecological conditions is often the cause of regional poverty. Among them, the altitude factor is crucial. Medical research shows that long-term hypoxia, low temperature, and high UV intensity in the plateau environment can cause a variety of acute and chronic diseases, and may have a serious impact on human health. As altitude increases, oxygen content decreases, fuel cannot be fully combusted, energy consumption increases, and work efficiency is thus low. Therefore, altitude is an important reason for regional poverty. In fact, Zhai and Sun [18] selected two sets of samples from the five provincial capitals along the Yellow River and the data on altitude and GDP per capita in 18 provincial capitals between 25° N and 40° N. They found that there was a negative linear correlation between altitude and economy, and called it the “altitude effect”.
Due to the latitudinal zonal cooling effect in the quantitative calculation of the altitude effect, we also considered the hypoxia and cooling with the altitude. As with the altitude, there is also a zonal change in oxygen distribution, latitude and sunshine duration. There is some similarity in zonality between high latitudes and high altitudes (including heat, soil and zonality). We choose zonality factors as a reflection of the characteristics of geographical nature, for an intuitive understanding, known as composite altitude. Composite altitude is calculated as follows:
Composite altitude = 0.7 × mean altitude + 0.3 × county town altitude + 2/3 × Latitude heat conversion value
In this study, we assumed that, as the latitude of the region increases, the amount of solar radiation that it receives will decrease accordingly. Similar to the altitude, it will face the same problem of negative radiation balance. We calibrated the radiation balance by converting the latitude into an altitude above the effective solar radiation. The selection of the latitude heat conversion value was obtained from the experiments we conducted in China’s rough and remote areas, and then we got the combined altitude.
In this paper, the zonal factors are based on the 1:250,000 DEM database in China. We obtained the average altitude of all counties and county-level cities in China, and the altitude of the county town is prominently considered because most people live in the county town. According to the method of Xia [19], using the average altitude of the region, we obtained the altitude of geographical unit and the latitude heat conversion value, as shown in Equation (2).
(3) Water resources suitability
Water resources are the most common and indispensable resources in social life. Water is often the important factor in an ecosystem and production activities. Therefore, water resources in the first geography nature often have a decisive impact on poverty; when regional poverty factors are considered, water resources must be included. However, the impact is not monotonical. Whether a region’s water resources are suitable for production depends on the suitability of water resources. It needs to meet the appropriate standards of the environment, for which we define the region’s water resource suitability.
Water resources suitability is a comprehensive indicator of water resources in a region. It is mainly reflected by the degree of wetness in a region and the surface runoff caused by precipitation. Moisture is a meteorological indicator of wetness degree, which reflects the level of demand for water resources in a region. Precipitation and river network density are contributive to surface runoff, and they collectively reflect the extent to which surface water is available in a region. These two indicators reflect the richness of water resources in a region from the two aspects of demand and supply, respectively. The comprehensive index formed by them can comprehensively reflect the water resource suitability of a region. Moisture index is defined as follows:
In Equation (3), , , represent the moisture, precipitation and evaporation, respectively.
The calculation of river network density refers to Xia [19]. Based on the precipitation in 31 watersheds and the spatial distribution of rivers, the cross-section flow and river flow are calculated. River flow is further weighted based on the precipitation to obtain the river network density. The water suitability formula is:
In Equation (4), , , , represent the water resources suitability, moisture, precipitation and river network index, respectively. The coefficient is defined as:
The subscript indicates region . represents the normalized data.
(4) Earth surface environmental vulnerability
Earth’s surface environmental vulnerability characterizes the harsh and vulnerability of natural environment in a region. Due to its comprehensiveness, this study used the surface environmental vulnerability as caused by the combination of the bumpiness of land surface, frost-free period, flood and drought index and karst features to characterize the comprehensive surface natural environment in a region.
In this study, the bumpiness of land surface pSA index was obtained under the application of remote sensing images. The calculation method is made by Xia et al. [16], and then the bumpiness of land surface is corrected by Equation (7) according to the slope algorithm proposed by Burrough in 1986.
In Equation (7), is bumpiness of land surface, and and represent average gradient and the adjusted bumpiness of land surface, respectively.
Frost period indicator: This is a climatological indicator. We obtained the dates of first frost and last frost based on the weather station observation data to get the duration of frost season of each site for many years, and took the average value to get the average number of frost days. Using the spatial interpolation to obtain the national spatial distribution, and summarizing the regional statistics of all the counties in the country, we obtained the average of the frost period in each county for many years, and standardized it as the index of the frost period.
Droughts and Floods Index: Standardized Precipitation Index (SPI) is an index which can express the drought condition only by using the precipitation data of continuous period (more than 30 years), which can reflect the drought condition in different regions and different time scales and can better reflect the wet and dry condition, which can carry on the contrastive analysis of many time scale. In this study, we calculated the SPI by using the formulas of Zhang et al. [20] Considering that crops stop growing in winter, precipitation has little effect on crop growth, so we ignored the calculation of the SPI in winter. The SPI index for spring, summer and autumn was synthesized according to the weight of 1:1:1, and the compound SPI index of all counties in China was obtained. When the index is greater than 0, it indicates a drought, otherwise, it indicates adequate rainfall. Then, for the composited SPI value of absolute value, greater values indicate greater degrees of disaster. Finally, it was standardized to obtain drought and flood index.
Karst Indicator: Karst, as an energy condition, has seriously affected the quality of farmland and surface water content. As an industrial condition, it affects industrial production. Based on the “China Karst Environmental Geological Map”, this study classified the karst categories and the degree of their damage to the localities in a total of four levels.
After the above work, we calculatde Earth surface environmental vulnerability, frost period, and flood and drought index as the composite weight of 3:1:1, which is estimated from economic loss survey. In other words, this weight is proportionally estimated based on the field survey hazard scale.
2.1.2. The Second Geographical Nature Index
In China’s anti-poverty practice, the proverb “Wanna be rich, build roads first” illustrates the role of transportation and economic location as a geographical feature in poverty or poverty alleviation. Krugman, taking “Chicago” as an example, indicated the importance of the second nature. In the 19th century, the “first nature” of Chicago was inferior. However, it was an important transportation hub in the United States. With its accessible roads, where the “second nature” was developed, the trade in the neighboring cities passed through and brought about economic development and urban development. To some extent, although natural endowments can determine whether a region has the advantage of development, transportation and location factors can make up for regional differences and provide the necessary locational conditions and infrastructure for economic development and promote industrial development. Therefore, we can use the second nature of the region to analyze the poverty factors and characterize the second nature of the region based on economic location and traffic conditions. A description of their roles and measurements is as follows.
(1) Economic location index
The relationship between a region and the central city and its relations with economically developed areas around it have led to the development of trade in the region. When we surveyed in Yunnan Province, we found that, due to the dispersed ethnic minorities and the difficulties in transportation, as well as being far away from major cities, the products in poor areas were hard to be transported outwards. Farmers who came to cities did not easily adapt to long-distance regional cultures and became typical vulnerable groups. It constitutes one of the important reasons for regional poverty. Therefore, calculating the economic location index of agglomeration centers (towns) to measure the economic status of each county (city) in the spatial distribution across the country is a way to find the poverty factors.
The economic position of an enterprise is easy to understand, and it represents the possibility of an economic connection between the enterprise and the region. How is the location of a gathering place (town) in the whole country understood? It is the sum of its economic impact on all the central cities in the country. In this way, the Wilson model can be used to calculate the economy in which the region (represented by i) has the economic influence by all the central cities in the country.
where represents the economic scale of city , expressed as per capita GDP. In the model, , as the attenuation factor, can be obtained by calculation. Referring to Wang and Yue’s calculation methods [21], the economic location index reflects that the larger the area deviates from most urban economic areas, the more likely it is to become poor. Since the location is related to the traffic conditions, this article also needs to analyze the convenience of traffic around.
(2) Traffic convenience
The backward closure of a region depends, to a large extent, on the traffic conditions in the area: the worse the traffic situation, the worse the connectivity with the outside world and the less conducive to development. At present, the main transportation methods relied on for the social mobility in China are train, airplane and automobile, while fewer people travel by boat. Therefore, referring to the definitions of regional transport convenience derived from Xia et al. [22]:
where represent train, plane and automobile, respectively; is the weight for transportation vehicle, with the average speed being the measurement index; is the transportation vehicle’s weight, with the average passenger capacity being the measurement index; and represents separately counties (cities) daily train frequency, flight frequency and passenger car ownership.
2.1.3. The Third Geographical Nature Index
The third geographical nature of the region is another factor affecting the development thereof. Liu and Wang [15] held that the levels of human capital and informatization development in the region are the third geographical factor influencing regional growth, which is also called geographical nature. The level of human capital, according to the theory of new economic growth, is measured by the educational level of the region, while information can be physically measured by the communication convenience.
(1) Education degree
The degree of education shows the impact of human development on economic growth. The calculation method is based on the statistics of the years of education in all regions. According to our survey in the poverty-stricken areas in southern Xinjiang and western Yunnan, minority nationals have difficulties in both learning the Han national language and integrating into the cultural environment of the Han people. They usually need to learn Chinese for two to three years. Particularly, in some of the less developed areas and some “directly-entering-socialism ethnic groups” areas, there are some disparities between the actual level of education and the years of education. Therefore, this article will amend the years of education in various regions to get the actual level of education.
E = (1 − 0.25 × m) × e
E is equivalent to the grade of education, e is the average years of schooling, and m is the proportion of ethnic minorities. The significance of coefficient of 0.25 is employed according to the fact that, if the entire staff is ethnic minorities, it takes them three years to learn Chinese, and the actual effective learning period is nine years during the 12 years of primary and secondary school graduation.
(2) Communication convenience
In this study, we used the fixed telephone access of poverty-stricken counties to express the convenience of communication there. To calculate the communication convenience index of each county, the data of fixed telephone users’ access volume for 2007–2009 were calculated, indicating the level of information technology development. In fact, by using the counties and cities at night lighting, network cable placement, or some well-known websites such as microblog Taobao and other landing situation can also be used to illustrate the indicators. However, due to the difficulty in obtaining such data, and that randomness cannot be ignored, the phone installation situation is taken as a measure. The number of telephone users reflects the level of regional informatization development. In Wuding County of Yunnan Province, the farmers we surveyed used mobile phones and smartphones to sell their products online. In Qujing, peasants got access to the Internet via landline phones and sold potatoes on the Taobao website. According to an educated youth who worked in the area, potatoes from their village had not been sold at all before telephone lines were available. The use of telephones has brought about an increase in the economic development of the market for agricultural products in this area.
2.2. Data Source
Contiguous destitute areas involve a large amount of data. This work sets out to establish a GIS information system for the contiguous destitute areas.
The data used in this article were obtained from the relevant statistical yearbooks and other statistical sources. In terms of the first nature, the data of sunshine hours, temperature, precipitation, evaporation and frost-free period were from the data of 1951–2012 of the National Meteorological Administration of China Meteorological Administration. The distribution of karst areas was from “China Karst Environmental Geological Map”. The soil data such as alkalinity, pH, organic matter content, and N, P and K nutrient potential were from the “National Natural Atlas of the People’s Republic of China”. As for the second nature, the data of traffic indicators such as trains and highways came from the China Railway Customer Service Center and the “2016 National Transport Digital Map of the Ministry of Communications”. The sources of GDP and economic location were the “China County (City) Social and Economic Statistical Yearbook” and “China City Statistical Yearbook” from 2013 to 2015. Finally, as for the third nature of the population, the proportions of ethnic minorities and other social data were from the “China’s Sixth Census Data”. The Vector and DEM data were from the National Geographic Information Center.
3. Evaluation Model
According to the regional analysis index system constructed by the “three geography natures” theories above, we further built an integrated model. Taking the simplicity of the method into account, our main method used was the gray relational analysis. This method is based on the same degree of trend among objects as a judgment of the correlation between them. The degree of association between two objects depends on how they change over time or another object. If the changes of two objects have the same tendency, the correlation between them is high; on the contrary, the correlation is low.
Applying this method, we must first determine the reference series and compare series. Set the reference sequence as Y = {Y (k)|k = 1,2, Λ, n}. Compare the sequences Xi = {Xi, ..., n}, i = 1, 2, ..., m. The reference sequence in this study was the per capita GDP of 680 counties and cities. The comparison series was based on eight poverty factors from three natures. The calculation method is as follows:
- (1)
- Because the raw data are in different dimensions, we need non-dimensional ones to make them comparable. This study used the linear function to convert as follows:where x represents the poverty factor in each county, and y represents the result of the non-dimensional treatment of each factor index. MaxValue and MinValue are the maximum and minimum values of the sample, respectively. All data are converted into positive values by this method, and the values are between 0 and 1.y = (x − MinValue)/(MaxValue − MinValue)
- (2)
- Calculating the gray correlation coefficient. The gray correlation coefficient indicates the closeness of two sequences in the range of (0, 1), which can be calculated as follows:where is called resolution coefficient. The smaller is the value of , the greater would be the difference between the correlation coefficients, and the greater would be the resolution. Generally, was taken as 0.5 in this study. If the value of is too small, it is easy to underestimate the impact of the difference of poverty factors on poverty; and if is too large, it is easy to enlarge the relationship between geographical factors and poverty.
- (3)
- Calculate the gray. The average value of correlation coefficients of the comparison series Xi and the reference series X0 in each indicator is the correlation degree:where . If is greater, then the impact of poverty in each county on GDP per capita is bigger; if , j = 1, 2, … m, then the factor Xi is better to achieve a high GDP than the factor Xj.
- (4)
- Gray correlation sequence. The gray correlation degree is listed in descending order, which is the gray related sequence. The gray relational sequence indicates the closeness of the two sequences.
4. Analysis of Poverty Causes
4.1. First-Grade Factors from Three Geography Natures
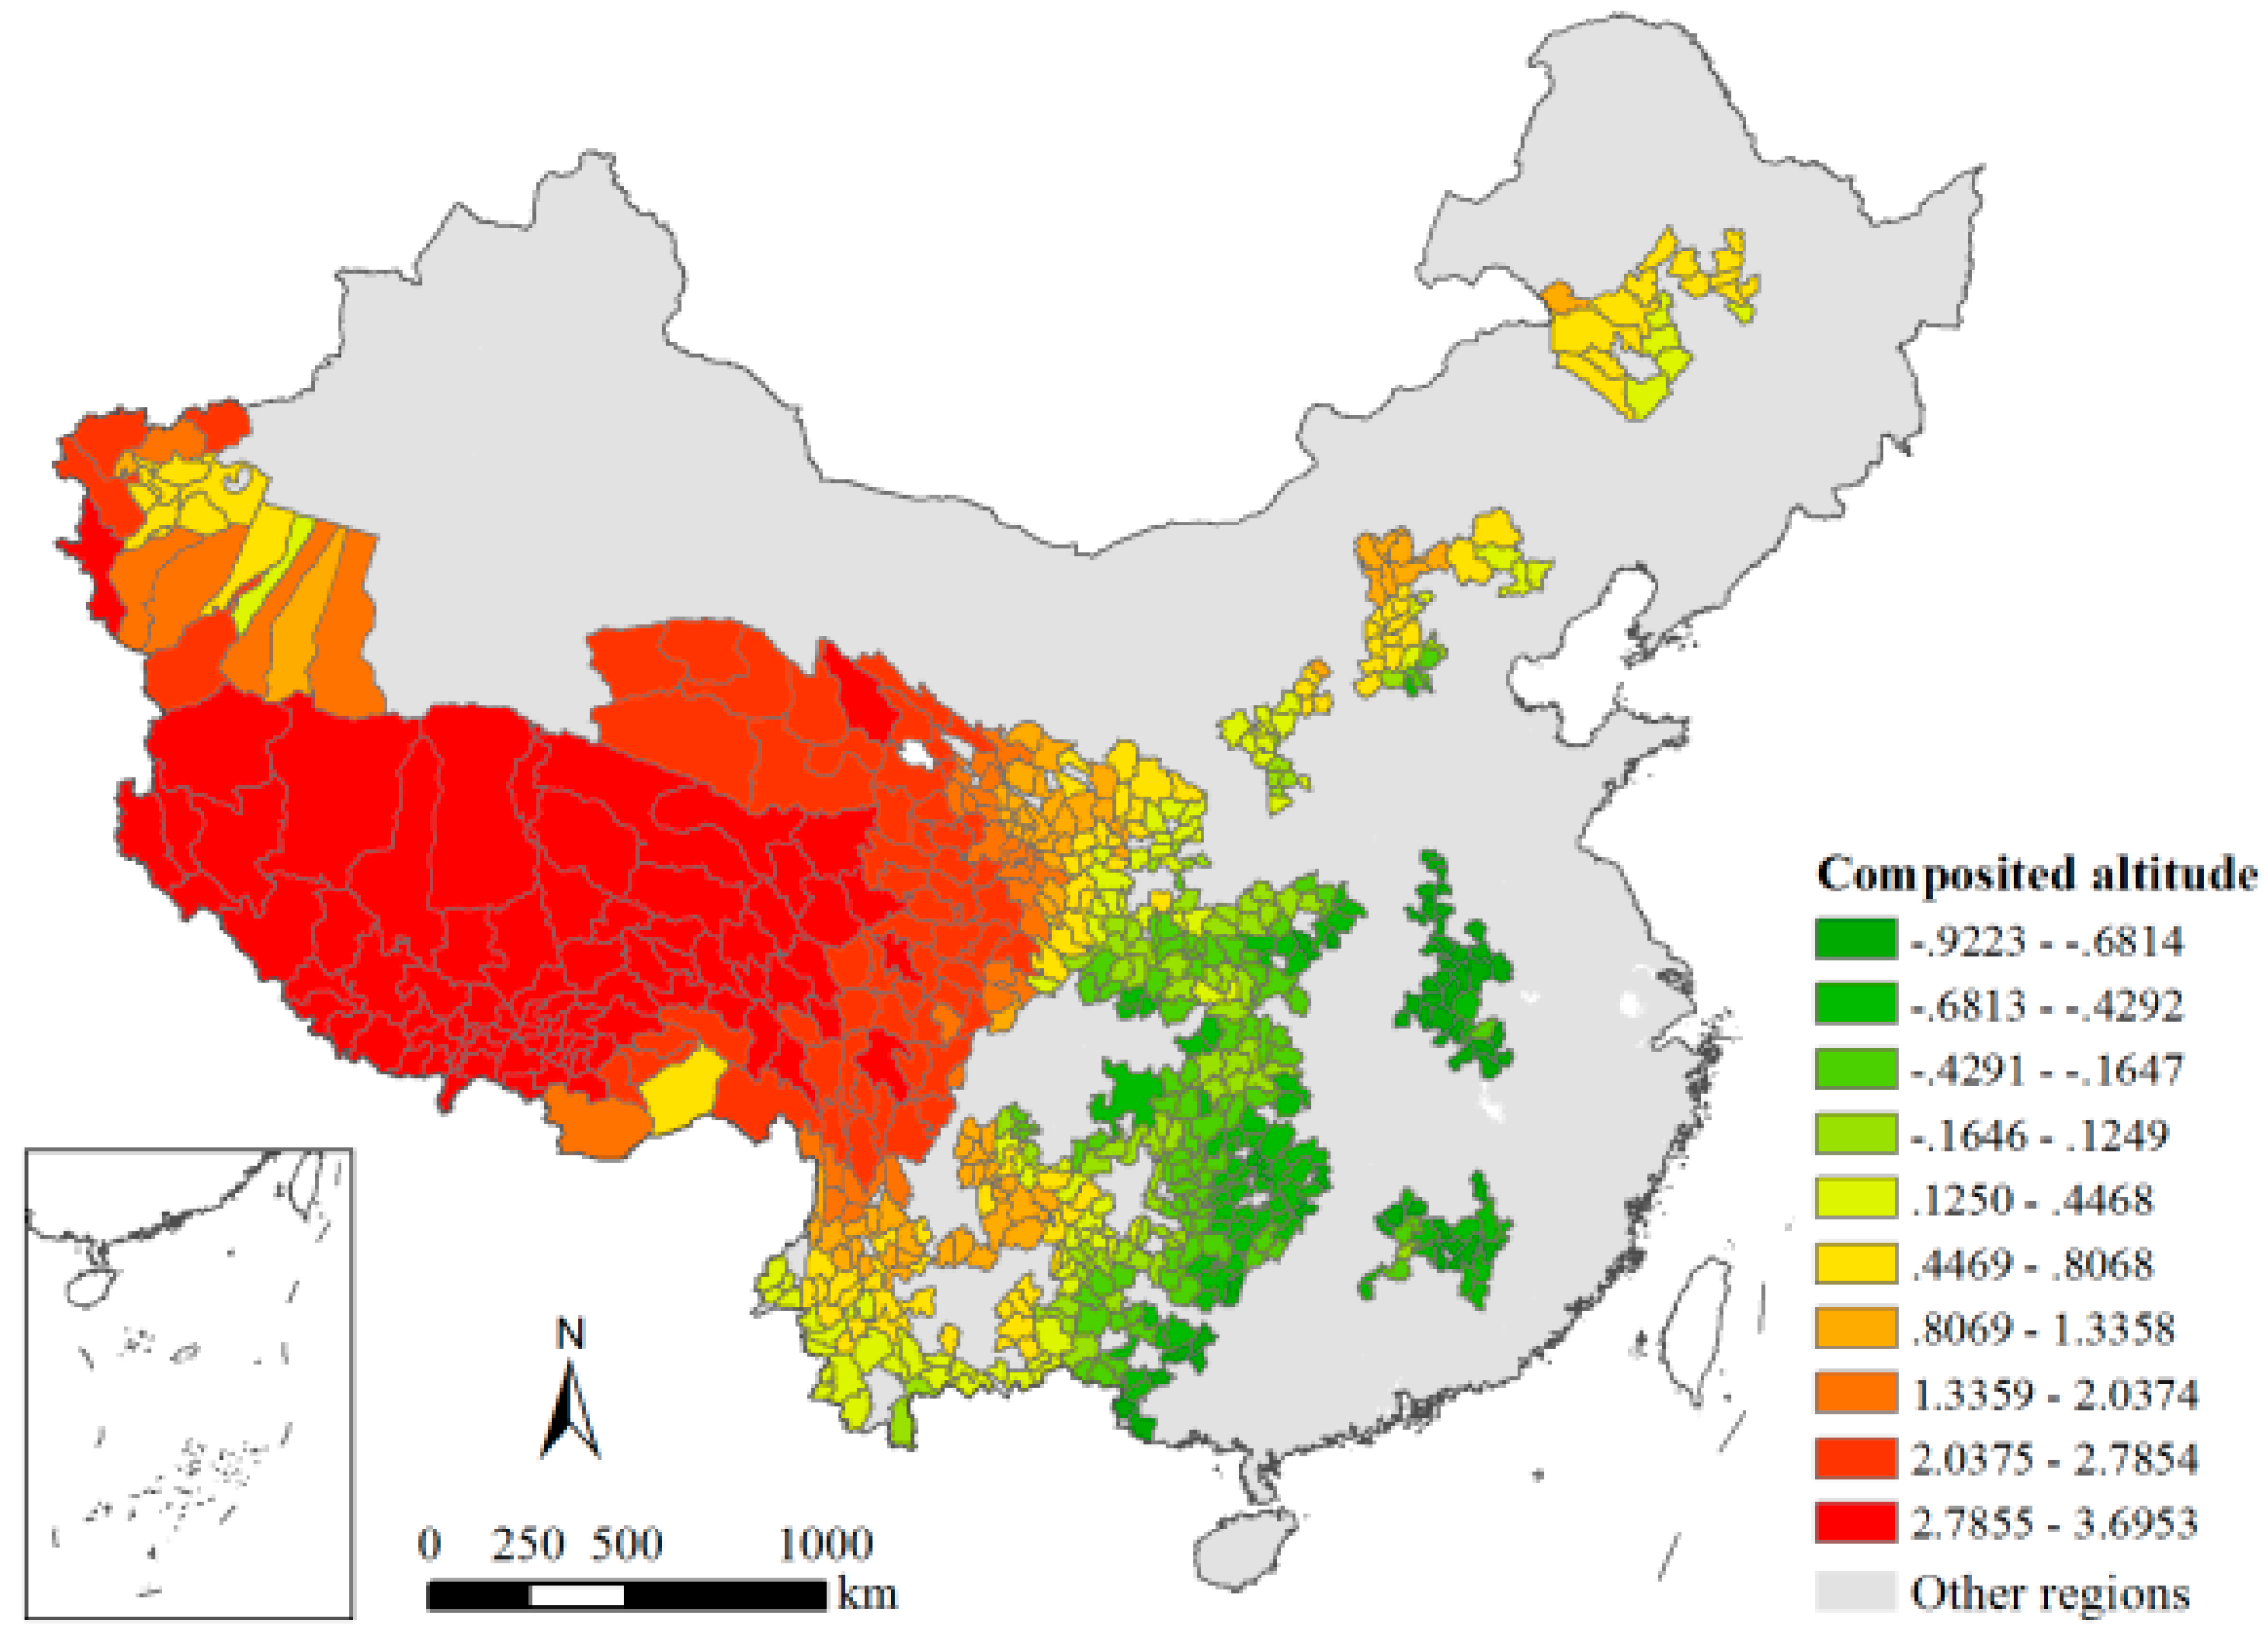
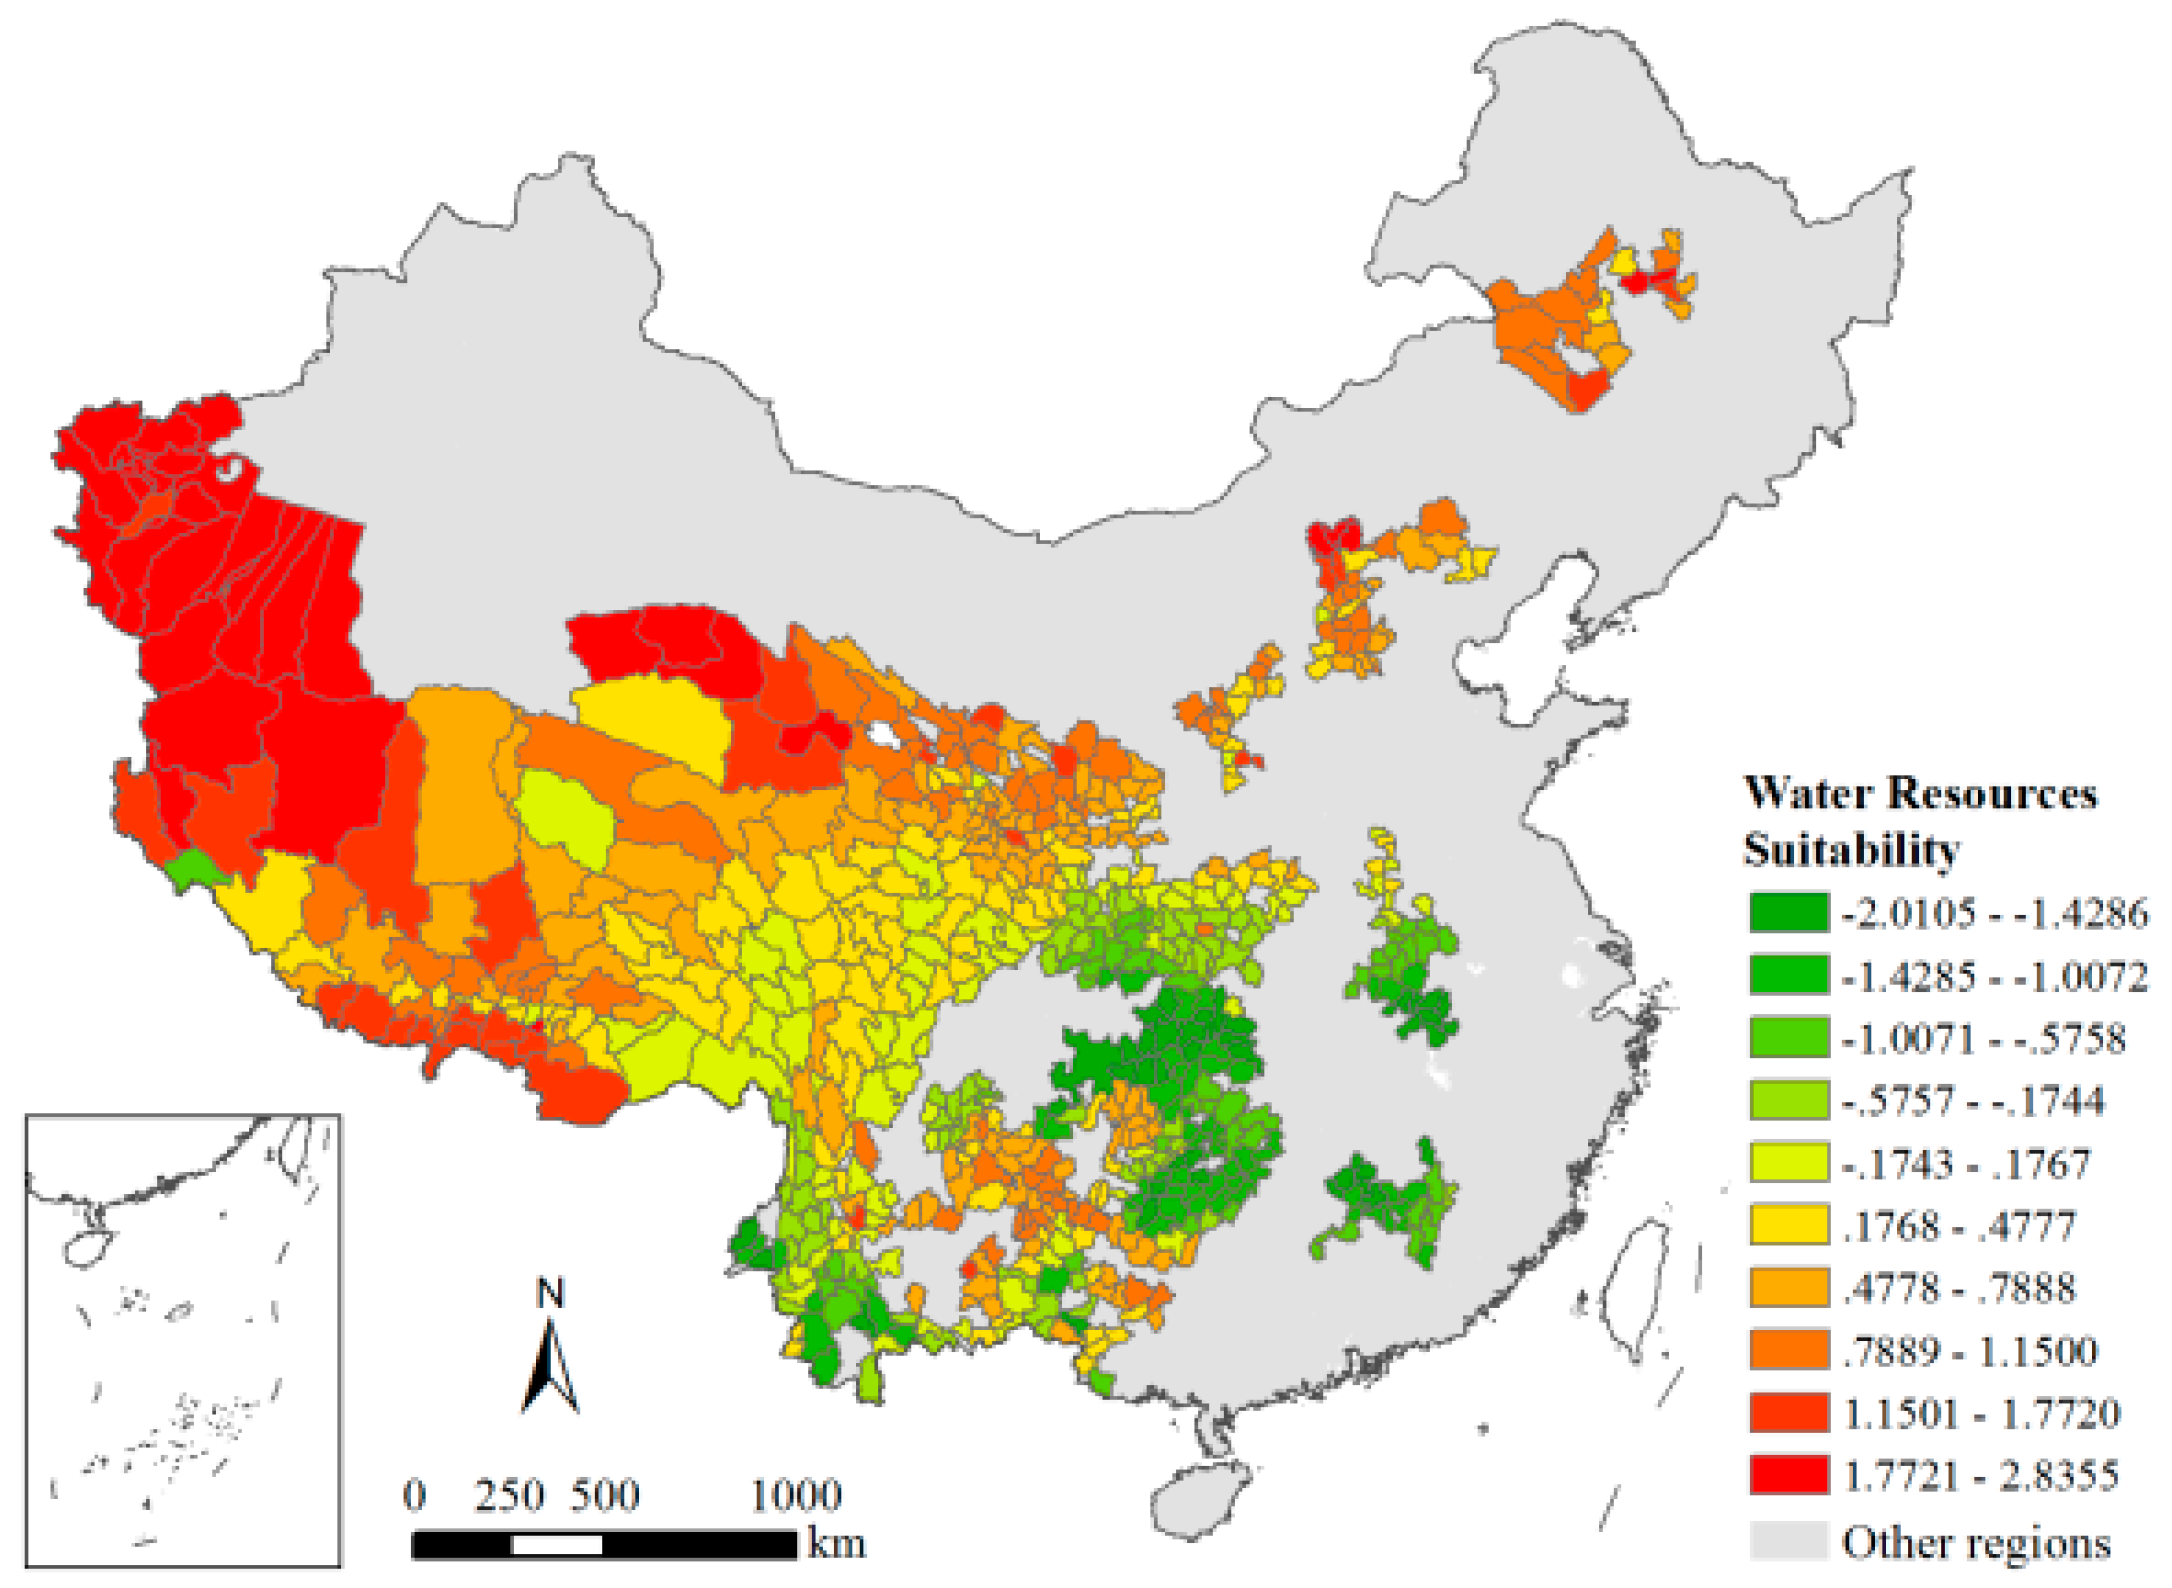
According to the three geographical nature theories that serve as the framework and the gray relational degree calculation method, this study calculated the secondary indicators of 680 counties in 14 contiguous destitute areas in China. Figure 2 and Figure 3 show the composited altitude and water resources suitability distribution of the first nature at the county level.
The composited altitude indicator shows that it decreased from the west to east in China, reflecting that the differences in terrain affect the distribution of destitute areas. Furthermore, the western mountain areas are arid or semi-arid and have scarce water resources. Due to the restricted development of agriculture and industry and the distribution of water resources, the distribution of arid and semi-arid areas has affected the development of local agriculture and economy, which has a strong relationship with poverty. This is the basic structural control factor in theory and is also the basic reason for the affluence in the eastern part of China over the western part. The calculated result shows that the first nature factor is the common and basic reason for the formation of contiguous destitute areas in China. For example, the causes of poverty in poor counties in Tibet area are mainly high altitude and cold weather. The water resources conditions in the South Xinjiang’s three districts are disadvantageous, and these are all included in the first nature.
Table 2 presents the correlation between the three natures and the formation of each contiguous destitute areas:
It can be seen in Table 2 that the first nature factor is relatively more obvious in the Yunnan-Guangxi-Guizhou rocky area, Tibetan areas in four provinces, Wuling mountain area, Tibet area, Lvliang mountain area, Wumeng mountain and Liupan mountain areas, all of which are located in the west of China. Therefore, the main poverty reason is the geographical nature conditions. In contrast, there is a larger association in the second nature of the Luoxiao and Qinba mountain areas, which are located in the central part of China. These areas are basically the backward areas of economic and geographical conditions. In the Dabie mountain area, the south Greater Khingan mountain area, the Yanshan-Taihang mountain area and part of the Lvliang mountain area, which are associated with the third nature, are also located in the central and eastern part of China. Local topographic conditions lead to the backwardness of the culture and information communication. To further understand the causes of poverty, we still need more careful identification.
4.2. Further Identification of the Poverty Causes
By means of gray relational analysis, we have calculated the degree of association between each mountain area and eight secondary indicators, respectively. The higher the value, the greater the link with poverty. Table 3 shows the correlation between poverty indicators at various levels and the causes of poverty.
Furthermore, let us come to understand the relationship between the secondary factor of geography nature and poverty. The correlation calculation results are given in Table 4. In Table 4, Indexes 1–8 represent Composited Altitude, Agricultural Production Potential, Earth Surface Environmental Vulnerability, Water Resources Suitability, Economic Location, Traffic Convenience, Education Degree, and Communication Convenience, respectively.
To show the main causes of poverty easily, in Table 4, we represent in bold the most two or three important poverty factors in each contiguous destitute area. It shows that the most frequent cause of poverty in the secondary indicators is the Earth surface environment vulnerability, and the other factors have different degrees of correlation with poverty. This shows that the policy of establishing a green economy and building ecological engineering that the government put forward is the right direction for long-term development.
Our model shows that the factors leading to poverty in each contiguous destitute area are not the same. The lower level of education grade in the third nature of the Dabie mountain area is the relative major cause of poverty, followed by the poor economic location. The Dabie mountain area is located at the junction of three provinces of Hubei, Henan and Anhui. Affected by hilly terrain, traffic inconvenience, blocking of information, education and information technology, it is difficult to coordinate the development of knowledge-based economy and society, and thus regional economic and social development is not high there. Therefore, the Dabie mountain area should rely more on raising the level of informatization and the overall education development to alleviate poverty.
The first nature factor is the highest degree of poverty in the South Greater Khingan mountain area. Especially, the relationship between earth surface environmental vulnerability and poverty is more obvious. The frost-free period in this area is short and the accumulative temperature is insufficient. The zonal cold weather presents more frigid climatic features in this area, resulting in low potential for agricultural production. These factors are congenital. However, the degree of informatization in this area is not high, and the poor basic communication is also a factor that causes poverty. As we all know, the first nature is bound to be difficult to overcome. Therefore, in the South Greater Khingan mountain area, getting out of poverty needs to be exploited with modern technologies. The flourishing greenhouses in western China, for example, are good examples of vegetable farming.
The most crucial cause of poverty in Yunnan-Guangxi-Guizhou rocky area is the vulnerability of the earth surface environment. Our findings show that tertiary factor karst topography is the main cause of poverty. We visited the area to confirm that the karst geomorphologic types caused serious seepage of surface water. In some areas, the groundwater was buried deeply; the soil was red soil or brick red soil. The soil suitable for planting was generally poor, and the stone teeth and stone mounds were exposed and decreased that effective planting area. Therefore, the potential for agricultural production is low and the economic development is largely constrained. Therefore, agriculture needs to be strengthened in its restoration of ecology and disaster mitigation. Special attention should be paid to the fact that natural landscapes in karst areas are generally good and the closure of villages makes it possible to better preserve the traditional landscape and to develop tourism to change the economic status of the region. In fact, the development of tourism in this region has indeed come true.
The Luoxiao mountain and Qinba mountain area are greatly affected by the traffic convenience of the second nature. In connection with the values of other indicators, it can be found that the areas with poor traffic convenience often suffer from severer environmental vulnerability on the earth surface. The areas with steep slope topography are not conducive to the construction of the highway project. Therefore, overall, the calculation results reflect the structural reasons of contiguous destitute areas. These areas need to focus on improving the traffic environment
The major causes of poverty in the Wumeng mountain areas are the first nature of environmental vulnerability and the third nature of poor education. According to our survey from associate professor Lei Ming in Qujing Normal university, who has participated in poverty alleviation work for a long time, this area is rich in natural resources but lacks investment in natural resources because it is difficult to transport the product to the outside world. In addition, due to the high-altitude mountain areas and the loosely-scattered villages in small regions, many small villages cannot meet the conditions for primary school education as stipulated by the Chinese Ministry of Education. Children must live in large villages with concentrated schools, which leads to a low enrollment rate. We investigated a Lisu nationality village in a difficult and remote area where children lived in large villages. In addition to teaching schoolwork, school teachers also took care of students’ daily lives. Local education department officials complained that teachers could not go home and, as a result, affected their education performance. Under such circumstances, how to protect the life of teachers and improve the conditions for their education is a crucial issue and part of the systematic project of regional informatization construction, which requires policy adjustments.
Our further investigation found that farmers in the Wumeng mountain area lacked the accumulation of new primary industries and the economic location of the region is not ideal. According to the survey in the Liupan mountain area, water resource of the first nature in Dingxi of Gansu is not suitable, but, according to the characteristics of natural endowment, drought-resistant agriculture can still be carried out. Several financial projects have been funded to help farmers solve the capital problem. They also introduced vegetables-related investment from the southeast region of China, and the economic situation has been improved significantly. According to our interview with a business owner engaging in vegetable warehousing, his business has greatly benefited from the high-speed railways and highways that have been built in Dingxi county, and that good traffic condition has now brought significant amount of investment there. The Wumeng mountain area has no comparative advantage of this second geographic nature. Therefore, we believe that, in this region, the local government of Gansu should promote agricultural and financial policy while striving to achieve traffic modernization and to improve the disadvantage of economic location. This requires continuing investment by the state and an overall rational planning.
Overall, the major causes of poverty in the eastern and central regions include the first nature of earth surface environmental vulnerability as a more seriously concentrated cause, including the Southern Greater Khingan Mountain area, the Liupan mountain area, the Luoxiao mountain area and the Wuling mountain area. Therefore, strengthening both ecological engineering protection and national transport infrastructure in these areas while paying attention to disaster prevention and reduction are all the most important tasks in poverty alleviation. Due to this long-term poverty and severe bumpiness of land surface, the necessary investment in road construction is indispensable. Changing the second nature is the key direction in poverty alleviation work.
It must be pointed out that, in the regions of Yanshan-Taihang mountain area, Lvliang mountain area and Qinba mountain area, the first cause of poverty is the low agricultural production potential. This is further due to the lack of water resources in those regions. Thus, improving the water supply and water conservation in agriculture irrigation measures and adjusting the agricultural planting structure to adapt to the water conditions should be the key work of the local anti-poverty work. In the western Yunnan border area, the agricultural production potential has also become the most important factor for poverty reduction. Preliminary investigations show that the potential for agricultural production in these areas is not low but high instead, resulting in multiple tropical diseases and excessive land biomass. We have noticed that there are many ethnic groups across the area and their modes of agricultural production lag. How to help them quickly adapt to the modern culture and lifestyles is the key to fighting poverty. According to our survey, the work of poverty reduction in the Luoxiao mountain area has made good progress thanks to the government’s requirement of Jiangxi Province that all provincial departments and agencies coordinate their efforts to help the poverty-hit people start their industries. This highlights that improving the input of the third nature can be a prerequisite for anti-poverty efforts.
In addition, unlike most areas, the two most important poverty reasons in the south Xinjiang’s three districts, Tibet area and Tibetan areas in four provinces belonged to the first nature. In other words, the inferior nature of natural endowments leads to much higher levels of poverty in these areas than that in other areas, such as the unfavorable factors of water resources in south Xinjiang’s three districts and Tibetan areas in four provinces, and the high altitude cold with hypoxia in Tibet. These insurmountable geographical constraints also bring even bigger challenges to the poverty reduction work in this area. Therefore, in these poor production areas, proper relocation may be necessary.
5. Conclusions
Based on the theory of economic geography, this study analyzed the Contiguous Destitute Areas and established indicators system for poverty causes from the perspectives of three geography natures, used quantitative methods to collect the data, and established an analysis model to explore the causes of poverty in 14 contiguous destitute areas.
The results show that the underlying causes of regional poverty in China are geography attributes, and the main causes of geography in different regions are also different. Specifically, the first nature is the common cause of poverty. Except for the 13 areas outside the Dabie mountain area, the first two poverty factors contain 1–2 first-nature factors, which reflects the quality differences of the first geographical nature. Among them, altitude (zonal factor) and water resources are fundamental conditions, leading to basic differences in poverty between eastern and western China. For example, the severe water resource suitability conditions in South Xinjiang’s three districts are harsh and obvious high altitude factors in Tibet area. The earth surface environment vulnerability is the reason for the regional poverty in many areas, especially in areas east of Hu’s line. This is the case with the West Yunnan border area and the Wuling mountain areas. In addition, some of the second-level indicators from the second geographical nature and the third geographical nature are also the major poverty-inducing factors in some poverty-stricken areas, which are reflected in economic location, educational degree, traffic and communication conditions. However, these factors do not originate from the same root as the difficulties of the first geographical nature, and thus they become the “starting point” for poverty alleviation and development.
According to different main causes of poverty in different destitute areas, the state and local government can adopt specifically targeted poverty alleviation plan. The direction of poverty alleviation policy should be as follows: For areas where the value of the first geographical nature is low, meaning the areas with restricted natural endowments and bad ecological conditions that are difficult to change by manpower, ecological immigration can be considered gradually. For the contiguous destitute areas with low second geographical and natural values, government needs to invest and build roads to consciously support the clustering of small- and medium-sized towns. For the contiguous destitute areas where the third nature value is low, it is necessary to not only strengthen the construction of information infrastructure, but also to increase investment on education, break down cultural information blockade, promote regional alliances, strengthen the connect with developed areas, and increase directional support from industrial chains and trade chain. Overall, each region should tackle the bottlenecks and prominent contradictions that restrict development by combining its own unique resources, national cultures and conditions of economic and social development, highlighting regional characteristics, industrial characteristics and comparative advantages, and promoting the development of destitute areas get out of poverty.
Author Contributions
Z.W. conceived and designed the experiments; Y.T. performed the scenario and experiments; Y.T., X.J. and J.Z. analyzed the data; J.Z. made the maps; Y.T. wrote the paper; and R.G. modified the language. All authors read and approved the final manuscript.
Acknowledgments
This research was funded by the China Postdoctoral Fund (No. 2018M631584), and China Association for Science and Technology “Science and Technology Innovation Think Tank Youth Project” (No. DXB-ZKQN-2016-032).
Conflicts of Interest
The authors declare no conflict of interest.
References
- Wu, G.; Cai, Y. Integrated Physical Geography, 2nd ed.; Higher Education Press: Beijing, China, 2004. [Google Scholar]
- Minot, N.; Baulch, B. Spatial patterns of poverty in Vietnam and their implications for policy. Food Policy 2005, 30, 461–475. [Google Scholar] [CrossRef] [Green Version]
- Lan, H. A Research on the Chronic Poverty in Ethnic Areas—Empirical Analysis Based on Sichuan Liangshan Yi District. Soft Sci. 2013, 27, 73–78. [Google Scholar]
- Liu, Y.; Zhou, Y.; Liu, J. Regional Differentiation Characteristics of Rural Poverty and Targeted Poverty Alleviation Strategy in China. Bull. Chin. Acad. Sci. 2016, 31, 269–276. [Google Scholar]
- An, S.; Zhang, S. Environment in the western area of China—Poverty and the Degradation of Industrial Structure. Prediction 2005, 24, 14–18. [Google Scholar]
- Cao, S.; Wang, Y.; Duan, F.; Zhao, W.; Wang, Z.; Fang, N. The Coupling Relationship between Ecological Environment Vulnerability and Economic Poverty in Destitute Areas of China—An Empirical Analysis on 714 Poor Counties in Contiguous Destitute Areas. Chin. J. Appl. Ecol. 2016, 27, 2614–2622. [Google Scholar]
- Bui, A.T.; Dungey, M.; Nguyen, C.V.L.; Pham, T.P. The impact of natural disasters on household income, expenditure, poverty and inequality: Evidence from Vietnam. Appl. Econ. 2014, 46, 1751–1766. [Google Scholar] [CrossRef]
- Zhuang, T.; Zhang, J. Research on Poverty Alleviation and Development in Minority Areas—Based on the fit of Poverty Causes Factor and Inducing Environmental. Agric. Econ. Quest. 2012, 8, 50–55. [Google Scholar]
- Rephann, T.; Isserman, A. New highways as economic development tools: An evaluation using quasi-experimental matching methods. Reg. Sci. Urban Econ. 1994, 24, 723–751. [Google Scholar] [Green Version]
- Olsson, J. Improved road accessibility and indirect development effects: evidence from rural Philippines. J. Transp. Geogr. 2009, 17, 476–483. [Google Scholar] [CrossRef]
- Fan, G. The Road Development, Economic Growth and Poverty Reduction in China; China Agriculture Press: Beijing, China, 2006. [Google Scholar]
- Wang, W.; Yang, W.; Cao, X. Road transport superiority degree and impact on economic growth in the concentrated contiguous severe poverty areas in China. Prog. Geogr. 2015, 34, 665–675. [Google Scholar]
- Krugman, P.R. First nature, second nature, and metropolitan location. J. Reg. Sci. 1993, 33, 129–144. [Google Scholar] [CrossRef]
- Lu, D. New factors and new patterns of regional development in China. Geogr. Res. 2003, 22, 261–271. [Google Scholar]
- Liu, Q.; Wang, Z. Research on geographical elements of economic difference in China. Geogr. Res. 2009, 28, 430–440. [Google Scholar]
- Xia, H.; Wang, Z. Evolution of Land differentiation in Chinese mainland. Geogr. Res. 2012, 31, 2123–2138. [Google Scholar]
- Zhong, Z.; Wang, Z.; Xia, H.; Sun, Y.; Yue, Q. Temporal and Spatial Variation of the Potential Agricultural Productivity of China under Global Climate Change. J. Nat. Resour. 2015, 30, 2018–2032. [Google Scholar]
- Zhai, S.; Sun, A. On the Relationship between Altitude and Economy—The Inspiration of Altitude Effects to the Economic Development of the Qinghai-Tibet plateau region. Qinghai J. Ethnol. 2012, 23, 152–159. [Google Scholar]
- Xia, H. Roughness and Remoteness Analysis Oriented GIS-Design, Model and Algorithm. Master’s Thesis, East China Normal University, Shanghai, China, 2006. [Google Scholar]
- Zhang, Y.; Hao, Z.; Wang, Y.; Li, M.; Chen, E.; Fen, L.; Zhang, Y. Multiscale Characteristics of Drought Based on SPEI and SPI in Association with Climate Index in Taiyuan. Ecol. Environ. Sci. 2014, 23, 1418–1424. [Google Scholar]
- Wang, Z.; Yue, Q.; Wu, J. Theoretical Geography; China Science Publishing & Media Ltd.: Beijing, China, 2013; pp. 232–233. [Google Scholar]
- Xia, H.; Dai, X.; Wang, Y.; Wang, Z. The Analysis of Traffic Convenience on County Level Based on GIS. Areal Res. Dev. 2006, 25, 120–124. [Google Scholar]
Figure 1.
Diagram of Contiguous Destitute Areas.

Figure 2.
Composited altitude profile in Contiguous Destitute Areas.

Figure 3.
Suitability distribution of water resources in Contiguous Destitute Areas.


Table 1.
Indicators of Contiguous Destitute Areas.
| Number | Contiguous Destitute Area | Provence | Number of Counties | Area (104 km2) |
|---|---|---|---|---|
| 1 | South Greater Khingan mountain area | Inner Mongolia, Jilin, Heilongjiang | 19 | 11.18 |
| 2 | Yanshan-Taihang mountain area | Inner Mongolia, Hebei, Shanxi | 33 | 9.27 |
| 3 | Lvliang mountain area | Shanxi, Shaanxi | 20 | 3.63 |
| 4 | Dabie mountain area | Hubei, Henan, Anhui | 36 | 6.47 |
| 5 | Wulin mountain area | Hubei, Sichuan, Chongqing, Guizhou | 64 | 16.32 |
| 6 | LuoXiao mountain area | Jiangxi, Hunan | 23 | 5.21 |
| 7 | Liupan mountain area | Shanxi, Gansu, Qinghai, Ningxia | 61 | 15.30 |
| 8 | Qinba mountain area | Henan, Chongqing, Sichuan, Shaanxi, Hubei, Gansu | 75 | 21.83 |
| 9 | Wumeng mountain area | Sichuan, Yunnan, Guizhou | 38 | 10.70 |
| 10 | Yunnan-Guangxi-Guizhou rocky area | Yunnan, Guangxi, Guizhou | 80 | 21.28 |
| 11 | West Yunnan border area | Yunnan | 56 | 19.21 |
| 12 | Tibetan areas in four provinces | Yunnan, Sichuan, Gansu, Qinghai | 77 | 99.62 |
| 13 | Tibetan area | Tibet | 74 | 122.84 |
| 14 | South Xinjiang’s three districts | Xinjiang | 24 | 43.65 |
| Total | 21 | 680 | 406.51 |
Table 2.
Correlation table between poverty factors and three natures.
| Areas | First Nature | Second Nature | Third Nature |
|---|---|---|---|
| Dabie mountain area | 0.62 | 0.61 | 0.65 |
| South of Greater Khingan mountain area | 0.66 | 0.55 | 0.68 |
| Yunnan-Guangxi-Guizhou rocky area | 0.63 | 0.61 | 0.62 |
| West Yunnan border area | 0.68 | 0.65 | 0.67 |
| Liupan mountain area | 0.64 | 0.54 | 0.63 |
| LuoXiao mountain area | 0.62 | 0.63 | 0.61 |
| Lvliang mountain area | 0.70 | 0.52 | 0.69 |
| Qinba mountain area | 0.67 | 0.68 | 0.67 |
| Tibetan areas in four provinces | 0.69 | 0.55 | 0.64 |
| Wuling mountain area | 0.65 | 0.47 | 0.64 |
| Wumeng mountain area | 0.62 | 0.58 | 0.61 |
| South Xinjiang’s three districts | 0.60 | 0.59 | 0.56 |
| Tibetan area | 0.62 | 0.45 | 0.54 |
| Yanshan-Taihang Mountain area | 0.65 | 0.65 | 0.67 |
Table 3.
Three geographical natures corresponding poverty causes.
| Geography Nature | Index | Actual Conditions | Poverty Causes |
|---|---|---|---|
| The First Nature | Composited altitude | Landform, Zonality | Zonal cold makes the environment and culture closed. |
| Agricultural production potential | Soil, Light, Temperature, Water | Soil conditions and natural ecological are weak, not suitable for crop growth. | |
| Water resources suitability | Rainfall, Evaporation, Runoff | Water scarcity is harm to crop growth and industrial water use. | |
| Earth surface environmental vulnerability | Bumpiness of land surface, Drought and Flood, Karst, The surface of the disaster | Frequent natural disasters (droughts, cold wave or other disasters), lack of surface water in karst areas and the rugged terrain make external communications difficult. | |
| The Second Nature | Economic location index | Population and capital accumulation location. | Underdeveloped surrounding areas, resulting in less demand; poor geographical location, resulting in less investment. |
| Traffic convenience | Convenient transportation degree | Poor traffic, less investment, lack of trade. | |
| The Third Nature | Education degree | Human capital | Low level of education and insufficient in human capital investment. |
| Communication convenience | Information technology level | Information facilities construction is difficult, information is blocked. |
Table 4.
Correlation table between poverty factors and the secondary indicators.
| Contiguous Destitute Areas | Index 1 | Index 2 | Index 3 | Index 4 | Index 5 | Index 6 | Index 7 | Index 8 |
|---|---|---|---|---|---|---|---|---|
| Dabie mountain area | 0.62 | 0.62 | 0.64 | 0.63 | 0.65 | 0.58 | 0.68 | 0.63 |
| South of Greater Khingan mountain area | 0.67 | 0.58 | 0.71 | 0.64 | 0.48 | 0.62 | 0.66 | 0.71 |
| Yunnan-Guangxi-Guizhou rocky area | 0.56 | 0.65 | 0.68 | 0.62 | 0.58 | 0.63 | 0.62 | 0.61 |
| West Yunnan border area | 0.58 | 0.73 | 0.72 | 0.69 | 0.63 | 0.67 | 0.64 | 0.72 |
| Liupan mountain area | 0.59 | 0.61 | 0.73 | 0.62 | 0.58 | 0.49 | 0.64 | 0.62 |
| LuoXiao mountain area | 0.55 | 0.61 | 0.66 | 0.64 | 0.60 | 0.65 | 0.60 | 0.62 |
| Lvliang mountain area | 0.67 | 0.71 | 0.66 | 0.76 | 0.52 | 0.52 | 0.68 | 0.69 |
| Qinba mountain area | 0.62 | 0.70 | 0.68 | 0.70 | 0.65 | 0.70 | 0.68 | 0.66 |
| Tibetan areas in four provinces | 0.70 | 0.56 | 0.75 | 0.75 | 0.51 | 0.59 | 0.56 | 0.72 |
| Wuling mountain area | 0.59 | 0.58 | 0.76 | 0.67 | 0.49 | 0.45 | 0.63 | 0.65 |
| Wumeng mountain area | 0.60 | 0.60 | 0.69 | 0.59 | 0.60 | 0.57 | 0.66 | 0.56 |
| South Xinjiang’s three districts | 0.60 | 0.56 | 0.56 | 0.66 | 0.60 | 0.59 | 0.55 | 0.57 |
| Tibetan area | 0.71 | 0.48 | 0.69 | 0.58 | 0.43 | 0.47 | 0.50 | 0.58 |
| Yanshan-Taihang mountains area | 0.66 | 0.71 | 0.58 | 0.64 | 0.69 | 0.61 | 0.65 | 0.68 |
© 2018 by the authors. Licensee MDPI, Basel, Switzerland. This article is an open access article distributed under the terms and conditions of the Creative Commons Attribution (CC BY) license (http://creativecommons.org/licenses/by/4.0/).
Share and Cite
MDPI and ACS Style
Tian, Y.; Wang, Z.; Zhao, J.; Jiang, X.; Guo, R. A Geographical Analysis of the Poverty Causes in China’s Contiguous Destitute Areas. Sustainability 2018, 10, 1895. https://0-doi-org.brum.beds.ac.uk/10.3390/su10061895
AMA Style
Tian Y, Wang Z, Zhao J, Jiang X, Guo R. A Geographical Analysis of the Poverty Causes in China’s Contiguous Destitute Areas. Sustainability. 2018; 10(6):1895. https://0-doi-org.brum.beds.ac.uk/10.3390/su10061895
Chicago/Turabian StyleTian, Yuan, Zheng Wang, Jincai Zhao, Xuan Jiang, and Rongxing Guo. 2018. "A Geographical Analysis of the Poverty Causes in China’s Contiguous Destitute Areas" Sustainability 10, no. 6: 1895. https://0-doi-org.brum.beds.ac.uk/10.3390/su10061895
Note that from the first issue of 2016, this journal uses article numbers instead of page numbers. See further details here.